Attached files
| file | filename |
|---|---|
| EX-3.2 - EX-3.2 - Planet Payment Inc | a2205551zex-3_2.htm |
| EX-10.5 - EX-10.5 - Planet Payment Inc | a2205551zex-10_5.htm |
| EX-21.1 - EX-21.1 - Planet Payment Inc | a2205551zex-21_1.htm |
| EX-23.1 - EX-23.1 - Planet Payment Inc | a2205551zex-23_1.htm |
| EX-10.4 - EX-10.4 - Planet Payment Inc | a2205551zex-10_4.htm |
| EX-10.17 - EX-10.17 - Planet Payment Inc | a2205551zex-10_17.htm |
| EX-3.4 - EX-3.4 - Planet Payment Inc | a2205551zex-3_4.htm |
Use these links to rapidly review the document
Table of contents
Planet Payment, Inc.
As filed with the Securities and Exchange Commission on January 31, 2012
Registration No. 333-175705
UNITED STATES
SECURITIES AND EXCHANGE COMMISSION
Washington, DC 20549
Amendment No. 3
to
Form S-1
Registration Statement
Under
The Securities Act of 1933
Planet Payment, Inc.
(Exact name of registrant as specified in its charter)
| Delaware | 7389 | 13-4084693 | ||
| (State or other jurisdiction of incorporation or organization) |
(Primary Standard Industrial Classification Code Number) |
(IRS Employer Identification No.) |
Planet Payment, Inc.
670 Long Beach Blvd.
Long Beach, New York 11561
(516) 670-3200
(Address, including zip code, and telephone number, including area code, of
Registrant's principal executive offices)
Philip D. Beck
Chairman of the Board, Chief Executive Officer and President
Planet Payment, Inc.
670 Long Beach Blvd.
Long Beach, New York 11561
(516) 670-3200
(Name, address, including zip code, and telephone number, including area code, of agent for service)
Please send copies of all communications to:
| Robert A. Freedman, Esq. Cynthia Clarfield Hess, Esq. Michael A. Brown, Esq. Fenwick & West LLP 801 California Street Mountain View, California 94041 (650) 988-8500 |
Graham N. Arad, Esq. Director, Senior Vice President and General Counsel Planet Payment, Inc. 670 Long Beach Blvd. Long Beach, New York 11561 (516) 670-3200 |
Kenneth J. Gordon, Esq. Michael J. Minahan, Esq. Goodwin Procter LLP Exchange Place Boston, Massachusetts 02109 (617) 570-1000 |
Approximate date of commencement of proposed sale to the public:
As soon as practicable after this registration statement becomes effective.
If any of the securities being registered on this Form are to be offered on a delayed or continuous basis pursuant to Rule 415 under the Securities Act, check the following box: o
If this Form is filed to register additional securities for an offering pursuant to Rule 462(b) under the Securities Act, check the following box and list the Securities Act registration statement number of the earlier effective registration statement for the same offering. o
If this Form is a post-effective amendment filed pursuant to Rule 462(c) under the Securities Act, check the following box and list the Securities Act registration statement number of the earlier effective registration statement for the same offering. o
If this Form is a post-effective amendment filed pursuant to Rule 462(d) under the Securities Act, check the following box and list the Securities Act registration statement number of the earlier effective registration statement for the same offering. o
Indicate by check mark whether the registrant is a large accelerated filer, an accelerated filer, a non-accelerated filer, or a smaller reporting company. See the definitions of "large accelerated filer", "accelerated filer" and "smaller reporting company" in Rule 12b-2 of the Exchange Act. (Check one):
| Large accelerated filer o | Accelerated filer o | Non-accelerated filer ý (Do not check if a smaller reporting company) |
Smaller reporting company o |
The Registrant hereby amends this registration statement on such date or dates as may be necessary to delay its effective date until the registrant shall file a further amendment which specifically states that this Registration Statement shall thereafter become effective in accordance with Section 8(a) of the Securities Act of 1933 or until the registration statement shall become effective on such date as the Commission acting pursuant to said Section 8(a), may determine.
Subject to completion, dated January 31, 2012
The information in this preliminary prospectus is not complete and may be changed. Neither we nor the selling stockholders may sell these securities until the registration statement filed with the Securities and Exchange Commission is effective. This preliminary prospectus is not an offer to sell these securities and neither we nor the selling stockholders are soliciting offers to buy these securities in any state where the offer or sale is not permitted.
Prospectus
shares

Common stock
This is an initial public offering of shares of common stock of Planet Payment, Inc. We are selling shares of common stock. The selling stockholders identified in this prospectus are selling an additional shares of common stock. We will not receive any proceeds from the sale of shares of common stock by the selling stockholders. The estimated initial public offering price is between $ and $ per share.
We have applied to have our common stock listed on The NASDAQ Global Market under the symbol "PLPM." Prior to this offering our common stock has traded, and immediately subsequent to this offering will continue to trade, on the Alternative Investment Market of the London Stock Exchange under the symbols "PPT" and "PPTR" and has traded, and immediately subsequent to this offering will cease to trade, on the OTCQX market tier operated by OTC Markets Group, Inc. under the symbol "PLPM."
|
Per share | Total | |||||
Initial public offering price |
$ | $ | |||||
Underwriting discounts and commissions |
$ |
$ |
|||||
Proceeds to Planet Payment, before expenses |
$ |
$ |
|||||
Proceeds to selling stockholders, before expenses |
$ |
$ |
|||||
We have granted the underwriters an option for a period of 30 days from the date of this prospectus to purchase up to an additional shares of common stock to cover over-allotments, if any.
Investing in our common stock involves a high degree of risk. See "Risk factors" beginning on page 15.
Neither the Securities and Exchange Commission nor any state securities commission has approved or disapproved of these securities or passed on the adequacy or accuracy of this prospectus. Any representation to the contrary is a criminal offense.
The underwriters expect to deliver the shares of common stock on or about , 2012.
| J.P. Morgan | William Blair & Company | Jefferies |
| Needham & Company | Oppenheimer & Co. | Canaccord Genuity |
, 2012
You should rely only on the information contained in this prospectus or in any free-writing prospectus prepared by or on behalf of us and delivered or made available to you. Neither we nor the selling stockholders have authorized anyone to provide you with information different from that contained this prospectus. We and the selling stockholders are offering to sell, and seeking offers to buy, shares of our common stock only in jurisdictions where offers and sales are permitted. The information in this prospectus is accurate only as of the date of this prospectus, regardless of the time of delivery of this prospectus or of any sale of our common stock. Our business, financial condition, results of operations and prospects may have changed since that date.
No action is being taken in any jurisdiction outside the United States to permit a public offering of our common stock or possession or distribution of this prospectus in that jurisdiction. Persons who come into possession of this prospectus in jurisdictions outside the United States are required to inform themselves about, and to observe any restrictions as to, this offering and the distribution of this prospectus applicable to that jurisdiction.
This summary highlights information contained elsewhere in this prospectus and does not contain all of the information you should consider in making your investment decision. Before deciding to invest in shares of our common stock, you should read this summary together with the more detailed information, including our consolidated financial statements and the related notes, provided elsewhere in this prospectus. You should carefully consider, among other things, the matters discussed in "Risk factors," our consolidated financial statements and the related notes, and "Management's discussion and analysis of financial condition and results of operations," in each case included elsewhere in this prospectus.
All references to "$" or "U.S. Dollars" are to the legal currency of the United States, to "£" or "pound sterling" or "pence" or "p" are to the legal currency of the United Kingdom and to "€" or "Euros" are to the legal currency of the European Union.
Planet Payment, Inc.
Overview
Planet Payment is a leading provider of international payment processing and multi-currency processing services. We provide our services to over 25,000 active merchant locations in 16 countries and territories across the Asia Pacific region, North America, the Middle East, Africa and Europe, primarily through our acquiring bank and processor customers, as well as through our own direct sales force. Our point-of-sale and e-commerce services help merchants sell more goods and services to consumers and enable our acquiring customers to process and reconcile payment transactions in multiple currencies, geographies and channels.
Our services help banks, processors and merchants enhance revenue, broaden their product set and open new sales channels. Our payment processing services enable the authorization and settlement of payment transactions by providing the connections between the merchant, its bank and the card association. In addition, we provide online access to advanced reconciliation and reporting services and localized language support to our customers. Our flagship offerings are our multi-currency processing services, which include Pay In Your Currency and Multi-Currency Pricing. These services enable merchants to offer customized pricing in multiple currencies and enable acquiring banks, processors and merchants to settle and report transactions in their local currency.
Our proprietary, currency-neutral payment processing technology platform enables us to develop and deliver a broad range of international payment services, quickly enter new markets and provide a range of differentiated solutions and analytical tools that are easily integrated within our customers' existing business processes. We provide our customers with worldwide connectivity to our payments infrastructure that is secure, compliant and regularly updated with the latest capabilities, services and functionalities. Our secure platform was developed with next-generation technology, free of many of the traditional legacy constraints of older platforms. It is highly scalable to facilitate growth and meet the needs of new large volume customers, and flexible to provide a broad range of capabilities, including the unique regional requirements of the various markets in which we operate.
1
We distribute and cross-sell our services across a variety of points of sale and e-commerce payment channels with customized solutions in specific verticals, such as hospitality, restaurants and retail. We believe our business model creates powerful network effects which will help drive growth and operating leverage in our business while our contracts, which generally have an initial term of three to five years, offer stability to and enhanced visibility of our financial performance. In 2010, we produced 51% of our revenue internationally and 49% in the United States, and in the first nine months of 2011, we produced 57% of our revenue internationally and 43% in the United States through a recurring revenue model that generates fees every time a purchase is made across our network. We manage our business through two operating segments. For the nine months ended September 30, 2011, our multi-currency processing services represented approximately 65% of our revenue and our payment processing services represented approximately 35% of our revenue.
For the years 2008, 2009, and 2010 and the nine months ended September 30, 2011, our net revenue was $21.2 million, $26.3 million, $30.6 million and $29.5 million, respectively. In the same periods, our net (loss) income was $(11.2) million, $(4.2) million, $(3.1) million and $0.6 million, respectively, and our Adjusted EBITDA was $(7.4) million, $0.3 million, $1.8 million and $3.2 million, respectively. Adjusted EBITDA is a financial measure not calculated in accordance with U.S. generally accepted accounting principles, or GAAP. For information on how we calculate Adjusted EBITDA, see "Selected consolidated financial data."
The global payments industry
Industry trends
We operate in the global payments industry, with a specific focus on international payment processing. We believe there are three primary trends which drive growth in our industry.
Continued global shift toward electronic payment transactions. There has been a significant global shift away from paper-based methods of payment, including cash and checks, towards electronic-based methods of payment, including mobile payments. A growing number of merchants are accepting electronic payments to improve sales and customer convenience, but we believe that while card usage growth is a global phenomenon, many large markets are still highly underpenetrated.
Increased international travel and commerce. We believe a primary driver of growth in international spending is increasing international travel and commerce. Visa Inc., or Visa, reported that, for the twelve months ended September 30, 2011, cross-border payments and cash volume grew 14% year-over-year on a constant U.S. Dollar basis and MasterCard Incorporated, or MasterCard, reported that, for the three months ended September 30, 2011, cross-border payments and cash volume grew 19% compared with the three months ended September 30, 2010, on a local currency basis.
Increased e-commerce on a global scale. With the rapid increase in the number of Internet buyers worldwide, competition among e-commerce merchants is growing and becoming more global, and merchants must focus their resources on attracting consumers to their websites and making the buying decision as convenient and easy as possible.
2
Industry challenges
As a result of the trends that are driving growth and change in our industry, we believe acquiring banks and processors and merchants are facing new challenges and competitive pressures and are demanding secure, reliable and differentiated solutions to more efficiently and effectively process payments. In addition, we believe consumers are increasingly seeking a more transparent and convenient way to pay.
Acquiring banks and processors. We believe that acquiring banks and processors are eager to secure new revenue streams, expand their customer portfolios and reduce costs, while meeting the dynamic challenges of a rapidly growing global payment processing industry, including keeping pace with heightened security standards and evolving rules and regulations. Growing and retaining a strong and loyal customer base requires acquiring banks and processors to secure competitive differentiators by regularly upgrading their offerings with the latest services, capabilities and functionality.
Merchants. To survive and thrive in an increasingly competitive and global marketplace, we believe merchants need electronic payment solutions that improve sales, attract international consumers, enhance the consumer experience at the point of sale and reduce costs. Merchants with global reach may struggle to manage multiple acquiring relationships, processing solutions and point-of-sale systems across geographies.
Consumers. International payment card transactions typically represent an obscure and costly event for consumers because consumers are often not aware of the final cost of the transaction in their native currency, the exchange rate that will be applied or the additional fees that they will be charged by the card issuing bank. This lack of clarity may cause delay and inconvenience at the point of sale and create difficulties with reimbursement for international business travelers.
Our solution
Our payment processing and multi-currency processing services are designed to enable acquiring banks and processors and merchants to meet these challenges by integrating our secure and reliable processing platform into their existing systems with advanced services such as consolidated reporting and data analytics. These services are designed to expand the market reach and merchant portfolio of our acquiring bank customers, increase sales and provide an attractive new revenue stream for merchants, and improve the buying experience for consumers.
Acquiring banks and processors. Through our platform, acquiring banks and processors are able to offer differentiated services to merchant customers that enhance merchant loyalty, attract new merchants, and gain a competitive advantage by being able to more easily expand their merchant portfolio and open new sales channels. In addition, by securing a share of the foreign exchange rate margin, our customers gain access to a new, high-margin revenue stream.
Merchants. Merchants can use our services to attract more international customers, make the buying experience more convenient and transparent and share in additional fees. By using our solution, our merchants are able to provide consumers customized solutions that are adapted for their specific shopping experience and access valuable reporting data that helps them
3
better understand and capitalize on the purchasing patterns and form-of-payment preferences of their customers.
Consumers. Consumers benefit from the advanced multi-currency services we provide to our customers, enjoying greater clarity as to the final cost of the transaction in their native currency for point-of-sale purchases or online transactions.
Our competitive strengths
Domain leadership in international payments. Since our founding in 1999, we have established deep domain knowledge of international payments and multi-currency payment processing. Given the breadth of our offerings, the global scope of our services, our brand recognition in the industry and the proprietary nature of our technology, we believe we are one of the leading providers of international payment processing in the world.
Broad international footprint and distribution. We provide our services to more than 45 acquiring banks and processors who offer our payment and multi-currency services to their own network of merchants. We utilize our direct sales force and have leveraged the geographic footprints and distribution capabilities of our acquiring customers to build a diversified base of over 25,000 active merchant locations in 16 countries and territories across the Asia Pacific region, North America, the Middle East, Africa, and Europe.
Versatile and scalable proprietary technology platform. We have developed and operate a single, currency-neutral payment processing platform that enables us to quickly enter new markets and respond to new opportunities. Our proprietary platform is highly scalable to meet the needs of large volume customers, is highly flexible to provide a broad range of capabilities, and meets the regional requirements of the various markets in which we operate. Our platform has dedicated endpoints which allow us to connect directly to Visa, MasterCard, American Express and JCB, and provide an end-to-end service for our customers, without the need for third-party processors.
Differentiated and innovative suite of payment services. Our proprietary platform offers a broad range of domestic and international point-of-sale and e-commerce processing services, which utilize our patented rate mark-up methodology. Our suite of services is comprised of payment processing services, multi-currency processing services, including Pay In Your Currency, FX Assured, and Multi-Currency Pricing, our iPAY Gateway, and global consolidated reporting and data analytics services.
Customized vertical specific solutions. We leverage our platform and services to create a suite of customized solutions for specific verticals and channels that we believe provide a differentiated value proposition for our customers. We have also created solutions for specific point-of-sale systems, such as support for MICROS integrated systems, which enable merchants to utilize our multi-currency processing services easily without any further integration.
Business model with network effects. We believe there are significant and powerful network effects in our business model, which will help drive growth and operating leverage in our business. We believe that these network effects are at an early stage of development and will be a material driver of growth in the future. As we continue to add new acquiring bank and processing customers and board new merchants, we gain additional market penetration.
4
Our strategy
We seek to extend our leading position and enhance the network effects in our business model by continuing to penetrate our existing markets and expand in new geographies and market segments. Our goal is to continue to deliver innovative payment services to our customers that help merchants sell more goods and services and improve their business efficiencies. The key components of our strategy include:
Continued focus on existing customer base. We intend to continue to collaborate with our existing acquiring bank and processor customers in order to increase participation by merchants in the various services that we offer together. We believe that based solely on our existing acquiring bank and processor customers, we have a large addressable market, consisting of their existing pool of merchants and additional merchants that they may acquire in the future.
Cross sell to existing customers. We intend to continue to cross sell our innovative services to our acquiring banks and processors, and merchants and believe that these cross-sale opportunities are at a very early stage of penetration. Our range of services and solutions enable cross-selling opportunities that are intended to increase revenue from our existing customers by helping them broaden their product set with additional value-add services.
Add new customers. We believe acquiring banks and processors are seeking differentiated turnkey solutions, such as ours, to provide them with international payment processing services and multi-currency processing capabilities, which they can offer to merchants. We believe merchants are increasingly seeking global payment processing services, such as ours, that are integrated into their existing business processes, enabling them to consolidate reporting and data from different international business units and streamline their operations.
Enter new markets. We are leveraging our platform to enter new geographies and business sectors, which we believe will increase our market opportunity and continue to facilitate our growth into the future. We are working to implement our services in new countries to expand our footprint and support the growth of our customers, targeting geographies with higher levels of international purchase volume and expanding into additional business sectors.
Enhance our technology platform capabilities. We will continue to use our technology resources to develop advanced platform capabilities in order to enhance our market position and enable our customers to retain and attract new business. We believe that platform enhancements, whether driven by changes in the marketplace or regulatory requirements, will lead to increased revenue.
Develop new services and solutions. As the payment industry continues to evolve, we aim to be at the forefront by developing new services and solutions that leverage our platform and core competencies and thereby enable us to enter new markets, attract new customers and retain existing ones. We believe the development of new services and solutions will be an important revenue source in the future, enable us to continue to differentiate our platform and capabilities, and accelerate the network effects of our business model. For example, we are developing innovative mobile payment and mobile commerce solutions for our partners and channels that leverage the core competencies of our payment processing platform.
Pursue selective acquisitions. We intend to selectively pursue acquisitions that will help us achieve our strategic goals, enhance our technology and capabilities, and accelerate growth.
5
Selected risk factors
Our business is subject to numerous risks and uncertainties that you should understand before making an investment decision. These risks are discussed more fully in the section entitled "Risk factors." Some of these risks include:
- •
- We have a history of losses and may not achieve or sustain profitability for 2011 and in the future.
- •
- If the card associations do not allow our services to be offered, either generally or in certain geographies, then we
cannot sell our services to acquiring banks, processors and merchants in those geographies and our ability to grow our business may be harmed.
- •
- A limited number of our customers are responsible for a significant portion of our revenue and a decrease in revenue from
these customers could have a material adverse effect on our operating results and cash flow.
- •
- We rely on third parties to implement our services and to market them to consumers.
- •
- Any security and privacy breaches in our systems may damage client relations, our reputation and expose us to liability.
- •
- Any new laws, regulations, card association rules or other industry standards affecting our business, or any changes made
to them, in any of the geographic regions in which we operate may require significant development efforts or have an unfavorable impact on our financial results.
- •
- We rely on our management team and will need to attract, retain and motivate highly skilled personnel to grow our
business, and the loss of one or more key employees or our inability to attract and retain qualified personnel could harm our business.
- •
- We are required to be registered with Visa and MasterCard in order to provide our services, and we rely on the sponsorship
of our acquiring bank customers for this registration.
- •
- In order for us to continue to grow and improve our operating results, we must continue to increase participation by
existing customers, cross sell additional services and add new customers in existing and new geographies.
- •
- Fees that may be charged in connection with our Pay In Your Currency processing services are subject to change.
- •
- We are subject to international business uncertainties.
Corporate information
We were incorporated in the State of Delaware on October 12, 1999 as Planet Group, Inc. On June 18, 2007, we changed our name to Planet Payment, Inc. Our principal executive offices are located at 670 Long Beach Boulevard, Long Beach, New York 11561, and our telephone number is (516) 670-3200. Our website address is www.planetpayment.com. The information on, or that can be accessed through, our website is not part of this prospectus.
6
Since March 20, 2006, shares of our common stock have traded on the Alternative Investment Market of the London Stock Exchange, or AIM, under the symbols "PPT" and "PPTR," and immediately subsequent to this offering will continue to trade on AIM.
Since November 19, 2008, shares of our common stock have traded on the OTCQX market tier operated by OTC Markets Group, Inc., or the OTCQX, under the symbol "PLPM," and immediately subsequent to this offering will cease to trade on the OTCQX.
Except where the context requires otherwise, in this prospectus, "Company," "Planet Payment," "Registrant," "we," "us" and "our" refer to Planet Payment, Inc. and its subsidiaries.
Planet Payment®, BuyVoice®, FX Assured®, Helping International Customers Feel at Home®, iPAY®, Pay in Your Currency®, The Better Way to Pay®, The Better Way to Pay, Guaranteed®, and Voice Store® are registered trademarks of Planet Payment and Cardholder Choice™, iPAY Tokens™, Planet Switch™ and our logo are additional trademarks of Planet Payment. All other service marks, trademarks and tradenames appearing in this prospectus are the property of their respective owners.
7
The offering
Common stock offered by us |
shares | |
Common stock offered by the selling stockholders |
shares | |
Over-allotment option offered by us |
shares | |
Common stock to be outstanding after this offering |
shares ( shares if the over-allotment option is exercised in full) | |
Use of proceeds |
We plan to use the net proceeds of this offering for general corporate purposes, including working capital and potential acquisitions. We will not receive any of the proceeds from the sale of shares of common stock by the selling stockholders. See "Use of proceeds." | |
Risk factors |
You should read the "Risk factors" section of this prospectus for a discussion of factors to consider carefully before deciding to invest in shares of our common stock. | |
Proposed NASDAQ Global Market symbol |
"PLPM" |
The number of shares of common stock that will be outstanding after this offering is based on 58,565,195 shares of our common stock outstanding as of September 30, 2011, and excludes:
- •
- 7,844,794 shares of common stock issuable upon the exercise of options outstanding as of September 30, 2011, with a
weighted-average exercise price of approximately $2.27 per share;
- •
- 741,576 shares of common stock issuable upon the exercise of warrants outstanding as of September 30, 2011,
with a weighted-average exercise price of approximately $2.25 per share, which warrants do not do not expire upon the completion of this offering;
- •
- 1,381,717 shares of common stock issuable upon the exercise of a warrant outstanding as of September 30, 2011, with
an exercise price of $1.31 per share, which will be automatically net exercised upon the completion of this offering, if not exercised before then;
- •
- 5,000,000 shares of common stock reserved for future issuance under our 2012 Equity Incentive Plan, which will become
effective upon the completion of this offering; and
- •
- 800,000 shares of common stock reserved for future issuance under our 2012 Employee Stock Purchase Plan, which will become effective upon the completion of this offering.
Unless otherwise indicated, all information in this prospectus assumes:
- •
- the conversion of all outstanding shares of our convertible preferred stock into 6,851,144 shares of common stock
effective immediately prior to the completion of this offering;
- •
- no exercise by the underwriters of their right to purchase up to an additional shares of our common
stock
to cover over-allotments; and
- •
- the effectiveness upon the completion of this offering of our restated certificate of incorporation and our restated bylaws, which contain provisions customary for public companies, as more fully described below under "Description of capital stock."
8
Summary consolidated financial data
You should read the following summary historical consolidated financial data in conjunction with "Management's discussion and analysis of financial condition and results of operations" and the consolidated financial statements, related notes and other financial information appearing elsewhere in this prospectus. The summary consolidated financial data in this section are not intended to replace the consolidated financial statements and are qualified in their entirety by the consolidated financial statements and related notes included in this prospectus.
The consolidated statements of operations data for the years ended December 31, 2008, 2009 and 2010 are derived from our audited consolidated financial statements included in this prospectus. The unaudited consolidated statements of operations data for the nine months ended September 30, 2010 and 2011, and the unaudited consolidated balance sheet data as of September 30, 2011, are derived from our unaudited financial statements that are included elsewhere in the prospectus. We have included, in our opinion, all adjustments, consisting only of normal recurring adjustments, which we consider necessary for a fair presentation of the financial information set forth in those statements. Our historical results are not necessarily indicative of the results to be expected in the future, and our interim results are not necessarily indicative of the results to be expected for the full year.
Certain adjustments and reclassifications have been made to the financial statements for the three years ended December 31, 2010 and the nine months ended September 30, 2010. Please refer to the immaterial restatement disclosure located in Note 2 to the consolidated financial statements for further information.
9
| |
Year ended December 31, | Nine months ended September 30, |
|||||||||||||||||
|---|---|---|---|---|---|---|---|---|---|---|---|---|---|---|---|---|---|---|---|
| |
2008 |
2009 |
2010 |
2010 |
2011 |
||||||||||||||
Consolidated statements of operations data: |
|||||||||||||||||||
Revenue: |
|||||||||||||||||||
Net revenue |
$ | 21,185,878 | $ | 26,319,319 | $ | 30,553,164 | $ | 21,026,680 | $ | 29,527,135 | |||||||||
Operating expenses: |
|||||||||||||||||||
Cost of revenue: |
|||||||||||||||||||
Payment processing service fees |
9,808,434 | 10,175,430 | 10,051,640 | 7,423,046 | 8,273,579 | ||||||||||||||
Processing and service costs(1) |
6,434,693 | 6,282,743 | 6,980,981 | 5,175,096 | 6,758,294 | ||||||||||||||
Software licenses impairment |
— | — | 1,108,514 | — | — | ||||||||||||||
Total cost of revenue |
16,243,127 | 16,458,173 | 18,141,135 | 12,598,142 | 15,031,873 | ||||||||||||||
Selling, general and administrative expenses(1) |
15,365,254 | 12,822,449 | 14,304,448 | 10,354,051 | 13,580,381 | ||||||||||||||
Goodwill impairment |
129,887 | — | — | — | — | ||||||||||||||
Total operating expenses |
31,738,268 | 29,280,622 | 32,445,583 | 22,952,193 | 28,612,254 | ||||||||||||||
(Loss) income from operations |
(10,552,390 | ) | (2,961,303 | ) | (1,892,419 | ) | (1,925,513 | ) | 914,881 | ||||||||||
Other (expense) income: |
|||||||||||||||||||
Interest expense |
(1,015,633 | ) | (1,236,504 | ) | (1,169,578 | ) | (906,286 | ) | (307,796 | ) | |||||||||
Interest income |
140,191 | 18,702 | 429 | 142 | 804 | ||||||||||||||
Other income, net |
— | — | — | — | 98,682 | ||||||||||||||
Total other expense, net |
(875,442 | ) | (1,217,802 | ) | (1,169,149 | ) | (906,144 | ) | (208,310 | ) | |||||||||
(Loss) income from continuing operations before provision for income taxes |
(11,427,832 | ) | (4,179,105 | ) | (3,061,568 | ) | (2,831,657 | ) | 706,571 | ||||||||||
Provision for income taxes |
(1,681 | ) | (4,095 | ) | (3,219 | ) | — | (106,260 | ) | ||||||||||
(Loss) income from continuing operations |
(11,429,513 | ) | (4,183,200 | ) | (3,064,787 | ) | (2,831,657 | ) | 600,311 | ||||||||||
Income from discontinued operations, net of taxes |
272,847 | — | — | — | — | ||||||||||||||
Net (loss) income |
$ | (11,156,666 | ) | $ | (4,183,200 | ) | $ | (3,064,787 | ) | $ | (2,831,657 | ) | $ | 600,311 | |||||
Basic net (loss) income per share from continuing operations |
$ | (0.43 | ) | $ | (0.12 | ) | $ | (0.08 | ) | $ | (0.07 | ) | $ | 0.01 | |||||
Basic net income per share from discontinued operations |
$ | 0.01 | $ | — | $ | — | $ | — | $ | — | |||||||||
Basic net (loss) income per share applicable to common stockholders |
$ | (0.42 | ) | $ | (0.12 | ) | $ | (0.08 | ) | $ | (0.07 | ) | $ | 0.01 | |||||
Diluted net (loss) income per share applicable to common stockholders |
$ | (0.42 | ) | $ | (0.12 | ) | $ | (0.08 | ) | $ | (0.07 | ) | $ | 0.01 | |||||
Weighted average common stock outstanding (basic) |
26,720,171 | 33,725,727 | 40,431,073 | 39,316,392 | 48,834,130 | ||||||||||||||
Weighted average common stock outstanding (diluted) |
26,720,171 | 33,725,727 | 40,431,073 | 39,316,392 | 51,593,111 | ||||||||||||||
Pro forma basic net (loss) income per share applicable to common stockholders(2) |
$ | (0.06 | ) | $ | 0.01 | ||||||||||||||
Pro forma diluted net (loss) income per share applicable to common stockholders(2) |
$ | (0.06 | ) | $ | 0.01 | ||||||||||||||
Pro forma weighted average common stock outstanding (basic)(2) |
51,756,993 | 55,685,274 | |||||||||||||||||
Pro forma weighted average common stock outstanding (diluted)(2) |
51,756,993 | 58,444,255 | |||||||||||||||||
|
(footnotes on next page) |
||||||||||||||||||
10
| |
Year ended December 31, | Nine months ended September 30, |
|||||||||||||||
|---|---|---|---|---|---|---|---|---|---|---|---|---|---|---|---|---|---|
| |
2008 |
2009 |
2010 |
2010 |
2011 |
||||||||||||
Key metrics: |
|||||||||||||||||
Consolidated gross billings(3) |
$ | 35,849,475 | $ | 47,045,268 | $ | 64,653,725 | $ | 43,225,609 | $ | 70,903,471 | |||||||
Adjusted EBITDA (non-GAAP)(4) |
$ | (7,412,392 | ) | $ | 278,992 | $ | 1,815,478 | $ | (70,398 | ) | $ | 3,187,182 | |||||
Capitalized expenditures |
$ | 1,852,125 | $ | 2,069,497 | $ | 2,350,507 | $ | 1,712,944 | $ | 1,573,772 | |||||||
Total active merchant locations (at period end)(5) |
7,946 | 10,078 | 16,697 | 13,610 | 25,013 | ||||||||||||
Multi-currency processing services key metrics: |
|||||||||||||||||
Active merchant locations (at period end)(5) |
4,530 | 6,624 | 12,157 | 9,982 | 15,036 | ||||||||||||
Settled transactions processed(6) |
5,177,650 | 6,073,226 | 6,980,010 | 4,750,334 | 7,680,971 | ||||||||||||
Gross foreign currency mark-up(7) |
$ | 23,769,206 | $ | 33,322,683 | $ | 52,073,798 | $ | 34,072,645 | $ | 60,662,730 | |||||||
Settled dollar volume processed(8) |
$ | 688,808,842 | $ | 907,901,369 | $ | 1,377,308,710 | $ | 916,061,688 | $ | 1,612,753,388 | |||||||
Average net mark-up percentage on settled dollar volume processed(9) |
1.32% | 1.39% | 1.30% | 1.30% | 1.20% | ||||||||||||
Payment processing services key metrics: |
|||||||||||||||||
Active merchant locations (at period end)(5) |
3,416 | 3,469 | 4,603 | 3,682 | 9,993 | ||||||||||||
Payment processing services revenue(10) |
$ | 12,080,269 | $ | 13,722,585 | $ | 12,579,927 | $ | 9,152,964 | $ | 10,240,741 | |||||||
(1) Stock-based expense included in the statements of operations data above was as follows:
| |
Year ended December 31, | Nine months ended September 30, |
||||||||||||||
|---|---|---|---|---|---|---|---|---|---|---|---|---|---|---|---|---|
| |
2008 |
2009 |
2010 |
2010 |
2011 |
|||||||||||
Processing and service costs |
$ | 421,405 | $ | 437,919 | $ | 211,582 | $ | 194,293 | $ | 107,503 | ||||||
Selling, general and administrative expenses |
1,385,062 | 1,007,106 | 618,151 | 448,435 | 327,651 | |||||||||||
Total stock-based expense |
$ | 1,806,467 | $ | 1,445,025 | $ | 829,733 | $ | 642,728 | $ | 435,154 | ||||||
|
||||||||||||||||
(2) Pro forma net (loss) income per share has been calculated to give effect, even if antidilutive, to (1) the automatic conversion of all outstanding shares of our convertible preferred stock into 6,851,144 shares of common stock effective immediately prior to the completion of this offering, and (2) the effectiveness upon the completion of this offering of our restated certificate of incorporation.
(3) Represents gross foreign currency mark-up (see footnote 7) plus payment processing services revenue (see footnote 10).
(4) We define Adjusted EBITDA as GAAP net (loss) income adjusted to exclude (1) interest expense, (2) interest income, (3) provision (benefit) for income taxes, (4) depreciation and amortization, (5) stock-based expense from options and warrants and (6) certain other items management believes affect the comparability of operating results. Please see "—Adjusted EBITDA" below for more information and for a reconciliation of Adjusted EBITDA to net (loss) income, the most directly comparable financial measure calculated and presented in accordance with GAAP.
(5) We consider a merchant location to be active as of a date if the merchant completed at least one revenue-generating transaction at the location during the 90-day period ending on such date. The total number of active merchant locations exceeds the total number of merchants, as merchants may have multiple locations. As of December 31, 2009 and 2010 and as of September 30, 2010 and 2011, there were 15, 63, 54 and 16 active merchant locations, respectively, that used both our multi-currency processing services and our payment processing services. These amounts are included in multi-currency and payment processing active merchant locations but are not included in total active merchant locations.
(6) Represents settled transactions processed using our multi-currency processing services.
(footnotes continue
on the next page)
11
(7) Represents the gross mark-up amount on settled dollar volume processed using our multi-currency processing services. Gross mark-up represents multi-currency processing services net revenue plus amounts paid to acquiring banks and their merchants associated with such multi-currency processing transactions. Management believes this metric is relevant because it provides the reader an indication of the gross mark-up derived from multi-currency transactions processed through our platform during a given period. Refer to our revenue recognition policy in Note 3 and segment disclosure in Note 18 of our consolidated financial statements for information on our net revenue from multi-currency processing services.
(8) Represents the total settled dollar volume processed using our multi-currency processing services.
(9) Represents the average net mark-up percentage earned on settled dollar volume processed using our multi-currency processing services. The average net mark-up percentage on settled dollar volume processed is calculated by taking the reported total multi-currency processing services net revenue ($9.1 million, $12.6 million, and $18.0 million for the years ended December 31, 2008, 2009, and 2010, respectively, and $11.9 million and $19.3 million for the nine months ended September 30, 2010 and 2011, respectively) and dividing by settled dollar volume processed (see footnote 8).
(10) Represents revenue earned and reported on payment processing services.
| |
As of September 30, 2011 | ||||||||||
|---|---|---|---|---|---|---|---|---|---|---|---|
| |
Actual |
Pro forma(1) |
Pro forma as adjusted(2)(3) |
||||||||
Consolidated balance sheet data: |
|||||||||||
Cash and cash equivalents |
$ | 6,012,498 | $ | 6,012,498 | |||||||
Working capital(4) |
7,877,958 | 7,877,958 | |||||||||
Total assets |
22,422,556 | 22,422,556 | |||||||||
Total liabilities |
5,623,391 | 5,623,391 | |||||||||
Convertible preferred stock |
22,438 | — | |||||||||
Common stock |
517,140 | 585,651 | |||||||||
Accumulated deficit |
(79,245,357 | ) | (79,245,357 | ) | |||||||
Total stockholders' equity |
16,799,165 | 16,799,165 | |||||||||
(1) The pro forma column reflects (1) the automatic conversion of all outstanding shares of our convertible preferred stock into 6,851,144 shares of common stock effective immediately prior to the completion of this offering and (2) the effectiveness upon the completion of this offering of our restated certificate of incorporation.
(2) The pro forma as adjusted column reflects the pro forma adjustments and the issuance and sale by us of shares of our common stock in this offering, and the receipt of the net proceeds from our sales of these shares at an assumed public offering price of $ per share, which represents the midpoint of the estimated price range set forth on the cover page of this prospectus, after deducting estimated underwriting discounts and commissions and estimated offering expenses payable by us.
(3) A $1.00 increase (decrease) in the assumed initial public offering of $ per share would increase (decrease) each of cash and cash equivalents, additional paid-in capital and total stockholders' equity by $ million, assuming that the number of shares offered by us, as set forth on the cover page of this prospectus, remains the same, and after deducting the estimated underwriting discounts and commissions and estimated offering expenses payable by us. The pro forma information discussed above is illustrative only and following the completion of this offering will be adjusted based on the actual public offering price and other terms of this offering determined at pricing. If the underwriters' option to purchase additional shares to cover over allotments is exercised in full, the pro forma as adjusted amount of each of cash and cash equivalents and total stockholders' equity would increase by $ million, after deducting estimated underwriting discounts and commissions and estimated offering expenses payable by us, and we would have shares of our common stock issued and outstanding, pro forma as adjusted.
(4) Working capital is defined as current assets less current liabilities.
Adjusted EBITDA
This prospectus includes information about Adjusted EBITDA that is not prepared in accordance with GAAP. Adjusted EBITDA is not based on any standardized methodology prescribed by GAAP and is not necessarily comparable to similar measures presented by other companies. A reconciliation of this non-GAAP measure is included below.
Adjusted EBITDA is a non-GAAP financial measure that represents GAAP net (loss) income adjusted to exclude (1) interest expense, (2) interest income, (3) provision (benefit) for income taxes, (4) depreciation and amortization, (5) stock-based expense from options and warrants and (6) certain other items management believes affect the comparability of operating results.
12
Management believes that Adjusted EBITDA, when viewed with our results under GAAP and the accompanying reconciliations, provides useful information about our period-over-period growth. Adjusted EBITDA is presented because management believes it provides additional information with respect to the performance of our fundamental business activities and is also frequently used by securities analysts, investors and other interested parties in the evaluation of comparable companies. We also rely on Adjusted EBITDA as a primary measure to review and assess the operating performance of our company and our management team in connection with our executive compensation.
Adjusted EBITDA has limitations as an analytical tool, and you should not consider it in isolation from, or as a substitute for, analysis of our results as reported under GAAP. Some of these limitations are:
- •
- Adjusted EBITDA does not reflect our cash expenditures or future requirements for capital expenditures or contractual
commitments;
- •
- Adjusted EBITDA does not reflect changes in, or cash requirements for, our working capital needs;
- •
- although depreciation and amortization are non-cash charges, the assets being depreciated and amortized will
often have to be replaced in the future, and Adjusted EBITDA does not reflect any cash requirements for such replacements;
- •
- non-cash compensation is and will remain a key element of our long-term incentive compensation for
our employees, although we exclude it from Adjusted EBITDA when evaluating our ongoing performance for a particular period; and
- •
- Adjusted EBITDA does not include the impact of certain charges or gains resulting from matters we consider not to be indicative of our ongoing operations.
Because of these limitations, Adjusted EBITDA should not be considered as a measure of discretionary cash available to us to invest in the growth of our business. We compensate for these limitations by relying primarily on our GAAP results and using Adjusted EBITDA only as a supplement to our GAAP results.
13
The following table sets forth the reconciliation of Adjusted EBITDA to net (loss) income, our most directly comparable financial measure in accordance with GAAP:
| |
Year ended December 31, | Nine months ended September 30, |
||||||||||||||
|---|---|---|---|---|---|---|---|---|---|---|---|---|---|---|---|---|
| |
2008 |
2009 |
2010 |
2010 |
2011 |
|||||||||||
Adjusted EBITDA: |
||||||||||||||||
Net (loss) income |
$ | (11,156,666 | ) | $ | (4,183,200 | ) | $ | (3,064,787 | ) | $ | (2,831,657 | ) | $ | 600,311 | ||
Interest expense |
1,015,633 |
1,236,504 |
1,169,578 |
906,286 |
307,796 |
|||||||||||
Interest income |
(140,191 | ) | (18,702 | ) | (429 | ) | (142 | ) | (804 | ) | ||||||
Provision for income taxes |
1,681 | 4,095 | 3,219 | — | 106,260 | |||||||||||
Depreciation and amortization |
1,203,644 | 1,537,674 | 1,769,650 | 1,212,387 | 1,837,147 | |||||||||||
Stock-based expense |
1,806,467 | 1,445,025 | 829,733 | 642,728 | 435,154 | |||||||||||
Gain from discontinued operations(1) |
(272,847 | ) | — | — | — | — | ||||||||||
Write off of note receivable(1) |
— | 257,596 | — | — | — | |||||||||||
Goodwill impairment |
129,887 | — | — | — | — | |||||||||||
Software licenses impairment(2) |
— | — | 1,108,514 | — | — | |||||||||||
Convertible debt prepayment(3) |
— | — | — | — | 601,318 | |||||||||||
Derecognition of note payable(4) |
— | — | — | — | (700,000 | ) | ||||||||||
Adjusted EBITDA (non-GAAP) |
$ | (7,412,392 | ) | $ | 278,992 | $ | 1,815,478 | $ | (70,398 | ) | $ | 3,187,182 | ||||
|
||||||||||||||||
(1) In November 2008, we sold our interest in a joint venture for consideration of a five-year note receivable in the amount of $0.2 million with an annual interest rate of 7%. For the year ended December 31, 2008, we recorded $0.3 million as income from discontinued operations related to this joint venture. For the year ended December 31, 2009, we determined that the note receivable and accrued interest of $0.3 million was uncollectible and in accordance with Staff Accounting Bulletin, or SAB, Topic 5-Z(5), the entire amount was written off to selling, general and administrative expenses within continuing operations. The debtor subsequently filed for bankruptcy in 2010.
(2) In the fourth quarter of 2010, due to our unsuccessful efforts to sell software licenses previously purchased for resale, we determined that the underlying undiscounted cash flow projections did not support the recorded value of the asset and wrote off the entire asset balance of $1.1 million to cost of revenue for the year ended December 31, 2010.
(3) In April 2011, the convertible debt holders converted the outstanding principal amount of $9.0 million under convertible notes issued in 2007 and 2008 into an aggregate of 4,049,776 shares of common stock. In addition, we issued 127,318 shares of common stock valued at $0.3 million in lieu of cash payments for accrued interest and 297,682 shares of common stock valued at $0.6 million as a prepayment fee negotiated at the time of conversion. The shares issued for the accrued interest and the prepayment fee were valued at the average closing price of our common stock on AIM under the symbol "PPTR" during the period immediately prior to the conversion.
(4) In 2003, we entered into an agreement with First Horizon Merchant Services, Inc., or FHMS, and First Tennessee Bank National Association, or FTB, and recorded a note payable. Due to a breach of the contractual terms by FHMS and FTB, we did not believe we were liable to repay these amounts. As of March 31, 2011, the statute of limitations had expired on $0.66 million of the $0.7 million balance and as of September 30, 2011, the statute of limitations had expired on the remaining $40,000. For the nine months ended September 30, 2011, we recorded other income due to the derecognition of the note payable in the amount of $0.7 million.
14
Risk factors
Investing in our common stock involves a high degree of risk. You should consider carefully the risks and uncertainties described below, together with all of the other information in this prospectus, including the consolidated financial statements and the related notes appearing at the end of this prospectus, before deciding to invest in shares of our common stock. If any of the following risks actually occurs, our business, financial condition, results of operations and future prospects could be materially and adversely affected. In that event, the market price of our common stock could decline and you could lose part or even all of your investment.
Risks related to our business and industry
We have a history of losses and may not achieve or sustain profitability in the future.
Although we had net income of $0.6 million for the nine months ended September 30, 2011, we have incurred losses since our inception, including net losses of $(11.2) million in 2008, $(4.2) million in 2009, and $(3.1) million in 2010. As a result, we had an accumulated deficit of $(79.2) million as of September 30, 2011.
Our ability to be profitable in the future will likely depend on our ability to continue to increase our revenue, which is subject to a number of factors including our ability to continue to increase multi-currency processing revenue, increase new merchant deployments in the regions in which we currently operate, and add new acquiring banks and processor customers in new geographies. Our revenue is also impacted by factors beyond our control such as global economic and political conditions, particularly those affecting cross-border travel and commerce. Our ability to be profitable in the future also depends on our expense levels, including our selling, general and administrative expenses, and other expenses related to improvements in our technology, launches of new services, and our expansion into new geographic and vertical markets. In addition, our fees, interchange and assessments may also be influenced by increased competition and changes in card association rules and governmental regulations. Our efforts to grow our business may prove more expensive than we currently anticipate and we may not succeed in increasing our revenue to offset higher expenses. These expenses, among other things, may cause our net income and working capital to decrease. If we fail to grow our revenue, manage our expenses and maintain or improve our gross margin, we may not be able to achieve or sustain profitability in the future.
If the card associations do not allow our services to be offered, either generally or in certain geographies, then we cannot sell our services to acquiring banks, processors and merchants in those geographies and our ability to grow our business may be harmed.
Our services require us to interconnect with the Visa, MasterCard, American Express and JCB card associations, and if these card associations do not allow acquiring banks and processors to offer certain services, either generally or in certain geographies, then we cannot sell our services to acquiring banks, processors and merchants, either generally or in those geographies. For example, in April 2010, Visa announced a moratorium on all new acquiring banks and merchants offering dynamic currency conversion, or DCC, services, such as our Pay In Your Currency service, and studied the impact of DCC on Visa cardholders and the Visa brand. In October 2010, Visa lifted the moratorium and also established certain rule changes that
15
removed a prior prohibition on offering DCC services in certain regions, namely Central Europe, the Middle East, Africa, Latin America and the Caribbean. Prior to the lifting of this moratorium we were unable to provide DCC services in those regions to potential customers. If the card associations do not allow the offering of certain services, either generally or in certain geographies, then we will not be able to sell our services to potential customers generally or in those geographies and our ability to grow our business may be harmed.
A limited number of our customers are responsible for a significant portion of our revenue and a decrease in revenue from these customers could have a material adverse effect on our operating results and cash flow.
A significant portion of our revenue is derived from agreements with a limited number of customers. Specifically, for the year ended December 31, 2010 and the nine months ended September 30, 2011, subsidiaries of Global Payments Inc. represented 30% and 29%, respectively, of our revenue and for the nine months ended September 30, 2011, Network International, LLC represented 10% of our revenue. Our contractual arrangements with these customers do not obligate them to offer our services and if they choose to do so, the agreements do not dictate the timing of implementation. Additionally, if these customers lose merchants or if their merchants do not use our services, then our revenue will decrease.
We expect that a limited number of customers will continue to account for a significant portion of our revenue in future periods. If we do not adequately perform under, or successfully renew or renegotiate, our agreements with these or our other customers, our business will suffer. Our acquiring bank and processor customers typically enter into agreement with three- or five-year terms and upon the termination of that initial contractual term, customers have the opportunity to consider other providers or renegotiate the terms of the contract. The loss of our contracts with existing customers, our failure to renegotiate contracts with existing customers on terms as favorable as in the past, or a significant decline in the number of transactions we process for them could adversely affect our business, financial condition and results of operations.
In addition, the financial position of our customers and their willingness to pay for our services and solutions are affected by general market conditions, competitive pressures and operating margins within the banking industry. Any of these factors could negatively affect our business, financial condition and results of operations.
We rely on third parties to implement our services and to market them to consumers.
We rely on acquiring banks, processors and merchants to integrate our services within their services and ultimately to offer our services to consumers in order to generate revenue for us. Although we have contracts with our customers, they are not obligated to offer our services and if they choose to do so, the agreements do not dictate the timing of implementation. If the pace of adoption of our services is slower than anticipated it could adversely affect our business, financial condition and results of operations. Following initial implementation of our services, we continue to be significantly dependent on our relationships with acquiring banks and processors to market our services to their merchants and customers. Even those contractual arrangements with our customers that contain exclusivity provisions are not perpetual, and customers could reassess their commitments to us in the future, purchase alternative services
16
and/or develop their own competitive services following the expiration of the exclusivity period, which in several cases does not run for the full term of the agreement.
Also, we collaborate with service providers that facilitate the provision of our services, technology and service providers to the electronic payments industry, including point-of-sale system providers, such as e-commerce gateways, terminal manufacturers and other processors that have certified their solutions to our platform. These third parties include acquiring banks, processors and merchants, each of which could be a customer, as well as a supplier, in addition to commercial communications providers. If these service providers fail to perform in accordance with the requirements of the technological specifications necessary for us to provide our services to our customers, it could result in our failure to provide our services in accordance with our contracts, potentially exposing us to liability to our customers. In these cases, we may have to rely on an indemnity or other contractual obligation from the service provider in order to avoid ultimate liability or suffering damages. However, due to the inherent risk of litigation, such indemnity or other obligation may not prove to be enforceable against the service provider, or even if favorable judgment is obtained, the service provider may not have the financial ability to meet its obligations, thereby exposing us to bearing the burden of the loss.
In many cases, we have little or no direct access to our customers' merchant bases and are heavily reliant on our customers' sales forces to promote our services. It is ultimately up to our customers or our customers' merchants to offer our services to consumers and to do so in an effective manner, and there is no guarantee that these merchants or their consumers will continue to use our services. Our customers may not be as effective at selling our services and solutions as our own sales personnel. Our customers are also competing with other participants in the industry for processing business and may have other actual or perceived disadvantages relative to such competitors, which may affect their ability to generate business, whether or not such business includes our services and solutions. As a result, much of our business depends on the continued success and competitiveness of our acquiring banks and processors. We further rely on the success of the merchants. If these merchants experience a reduction in transaction volume or become financially unstable, we may lose revenue. The performance of our customers and our customers' merchants is subject to general economic conditions and their impact on consumer spending.
In addition, we rely on the continuing expansion of merchant and consumer acceptance of the card associations' brands and programs. There can be no guarantee that merchant and consumer acceptance will continue to expand, and if the rate of merchant acceptance growth slows or reverses itself, our business could suffer.
Any security and privacy breaches in our systems may damage client relations, our reputation and expose us to liability.
We electronically collect and store sensitive personal information, such as credit card numbers, about consumers. We process that data and deliver our products and services by using computer systems and telecommunications networks operated by both us and by third party service providers. The confidentiality of the consumer information that resides on our systems is critical to our business. Although, we have what we believe to be sufficient security around our systems to prevent unauthorized access, we cannot be certain that our measures will be
17
successful and sufficient to counter all current and emerging technology threats designed to breach our systems in order to gain access to confidential information. If we are unable to protect, or our customers perceive that we are unable to protect, the security and privacy of our electronic transactions:
- •
- our clients may lose confidence in our services;
- •
- our reputation may be harmed;
- •
- we may be exposed to unbudgeted or uninsured financial liability;
- •
- it may become more difficult for us to register with card associations;
- •
- we may be subject to increased regulatory scrutiny; and
- •
- our expenses may increase as a result of potential remediation costs.
Our ability to attract and retain customers and employees could be adversely affected to the extent our reputation is damaged. While we believe we use proven applications and processes designed for data security and integrity to process electronic transactions, there can be no assurance that our use of these applications and processes will be sufficient to counter all current and emerging technology threats designed to breach our systems in order to gain access to confidential client information or our intellectual property or address the security and privacy concerns of existing and potential customers. Any failures in our security and privacy measures could adversely affect our business, financial condition and results of operations.
Any new laws, regulations, card association rules or other industry standards affecting our business, or any changes made to them, in any of the geographic regions in which we operate may require significant development efforts or have an unfavorable impact on our financial results.
We are subject to regulations that affect the electronic payments industry in the countries and territories in which we operate. Regulation and proposed regulation of the payments industry has increased significantly in recent years. Failure to comply with regulations may result in the suspension or revocation of a license or registration, the limitation, suspension or termination of service, and the imposition of civil and criminal penalties, including fines which could have a material adverse effect on our financial condition. For example, we are subject to:
- •
- the card association rules of Visa, MasterCard, American Express and JCB and other card and debit networks;
- •
- applicable privacy and information security regulations in the regions where we operate and of the card associations;
- •
- banking and financial regulations or monetary authorities in the jurisdictions in which we operate; and
- •
- governmental regulation of the payments, payment processing and financial services industries.
For example, in April 2010, Visa announced a moratorium on all new acquiring banks and merchants offering DCC services, including our Pay In Your Currency service, and studied the impact of DCC on Visa cardholders and the Visa brand. In October 2010, Visa lifted the moratorium and also established certain rule changes that removed a prior prohibition on
18
offering DCC services in certain regions, namely Central Europe, the Middle East, Africa, Latin America and the Caribbean. Prior to the lifting of this moratorium we were unable to provide DCC services in those regions to existing or potential customers.
Interchange fees, which are typically paid by the acquiring bank to the card issuing bank in connection with transactions, are subject to increasingly intense legal, regulatory, and legislative scrutiny worldwide. For instance, in the United States, the Dodd-Frank Wall Street Reform and Consumer Protection Act, or Dodd-Frank Act, has recently been signed into law to regulate the fees charged or received by card issuing banks for processing debit transactions. Additionally, the Durbin Amendment to the Dodd-Frank Act, which was enacted by the U.S. Congress in July 2010, enables the U.S. government to regulate the amount that can be charged to merchants for acceptance of U.S. debit card transactions, among other things. Certain of our customers or potential customers may experience difficulty complying with any new regulations and as a result, reduce or eliminate purchases of services such as ours. In addition, regulatory actions that impact our industry, even if not directed at us, may require significant efforts and costs to change our services and may require changes to how we price our services to customers. We cannot predict the impact of any of these changes on our operations and financial condition.
Although we are registered with the card associations as a third party processor and an independent sales organization, or ISO, we are not a bank, and therefore cannot belong to the card associations. The card associations' member banks set the rules for processing credit card transactions, and the card associations interpret these rules. Some of those member banks compete with us. The card associations could adopt new operating rules or interpretations of existing rules with which we or our acquiring banks or processors might find it difficult or even impossible to comply, in which case our competitive position would be seriously damaged. If we fail to comply, this could result in termination of our ability to accept or process payment cards.
Changes in the electronic payments industry in general, or changes in the laws and regulations that affect the electronic payments industry, or interpretation or enforcement thereof, could adversely affect our business, financial condition and results of operations. In addition, even an inadvertent failure to comply with laws and regulations could damage our business or our reputation.
We rely on our management team and will need to attract, retain and motivate highly skilled personnel to grow our business, and the loss of one or more key employees or our inability to attract and retain qualified personnel could harm our business.
Our success and future growth depend on the skills, working relationships and continued services of our management team and other key personnel. The loss of any of member of our senior management team, and in particular Philip D. Beck, our founder and Chief Executive Officer, who is our key policy-maker and has a direct working relationship with significant customers, could adversely affect our business. All of our employees in the United States work for us on an at-will basis, which means they may terminate their employment relationship with us at any time. We do not maintain key-person life insurance on any of our employees.
19
Our future success will also depend on our ability to attract, retain and motivate highly skilled personnel who have experience with our operations, the rapidly changing transaction processing industry, and the selected markets in which we offer our services. Competition for these types of personnel is intense, particularly in the New York metro area, where our headquarters are located. Additionally, we have significant operations abroad, including developing countries, and attracting highly skilled personnel with the necessary experience in these locations may be difficult.
Volatility or lack of performance in our stock price may also affect our ability to attract and retain our key personnel. Many of our senior management personnel and other key employees have become, or will soon become, vested in a substantial amount of stock or stock options. Employees may be more likely to leave us if the shares they own or the shares underlying their vested stock options have significantly appreciated in value relative to the original purchase prices of the shares or the exercise prices of the options, or if the exercise prices of the options that they hold are significantly above the market price of shares of our common stock. We cannot guarantee that we will continue to attract, retain or motivate such personnel, and our inability to do so could adversely affect our business.
We are required to be registered with Visa and MasterCard in order to provide our services, and we rely on the sponsorship of our acquiring bank customers for this registration.
Our services require us to interconnect with the Visa and MasterCard card associations, and to therefore be registered with those card associations. Since we are not a bank, we are unable to belong to and directly access the Visa and MasterCard card associations. Visa and MasterCard operating regulations require us to be sponsored by an acquiring bank in order to process payment card transactions. We are currently registered with Visa and MasterCard through the sponsorship of acquiring banks that are members of the card associations and a significant majority of our revenue is from transactions processed using Visa and MasterCard payment cards. If these sponsorships are terminated and we are unable to secure another bank sponsor, we will not be able to process payment card transactions.
By registering with card associations, we are subject to card association rules that could subject us or our customers to fines or penalties that may be levied by the card associations for certain acts or omissions. If we or our acquiring bank sponsors fail to comply with the applicable requirements of the card associations, the card associations could fine us, suspend us or terminate our registration. The termination or suspension of our registration could require us to stop providing payment processing services, which would adversely affect our business, financial condition and results of operations.
In order for us to continue to grow and improve our operating results, we must continue to increase participation by existing customers, cross sell additional services and add new customers in existing and new geographies.
Our future growth depends in part upon our ability to increase participation by our acquiring bank and processor customers' merchants in the various services that we offer, cross sell additional services to existing acquiring bank, processor and merchant customers, and add new acquiring banks and processors, and merchants in existing and new geographies.
20
In order to increase participation by our customers and their merchants in the various services that we offer together, we need to collaborate with our customers. However, our existing acquiring bank and processor customers may not assist us in increasing participation by their merchants or their merchants may be unreceptive to using our services. If our existing customers do not appreciate, and our sales force does not demonstrate, the benefits of our additional services, we will not be able to effectively cross sell to existing customers. Our expansion into new geographies is also dependent upon our ability to deploy our existing platform or to develop new services to meet the particular service needs of each new geographic location. We may not have adequate financial or technological resources to develop effective and secure services that will satisfy the demands of these new markets.
If we fail to increase participation by existing customers, cross sell additional services and add new customers in existing and new geographies, we may not be able to continue to grow and improve our operating results.
Fees that may be charged in connection with our Pay In Your Currency processing service are subject to change.
When a consumer uses our Pay In Your Currency processing service, they pay a fee that is included in the exchange rate used for each Pay In Your Currency transaction. While Visa and MasterCard rules permit merchants and other third parties to charge these fees, if these card associations change their policies in permitting merchants and other third parties to charge these fees or otherwise restrict the ability to do so, our business, financial condition and results of operations could be adversely affected.
In addition, some card issuing banks impose a fee on consumers for any foreign transaction, irrespective of the currency in which it occurred. Where this occurs, the consumer will pay the card issuing bank an extra fee on a foreign transaction in addition to any margin reflected by us in the cost of the converted amount for our Pay In Your Currency service. This additional cost, and other efforts by the card issuing banks to discourage consumers from utilizing our services, may adversely affect consumers' willingness to use our services.
We are subject to international business uncertainties.
Our ability to grow our business and our future success will depend to a significant extent on our ability to expand our operations and customer base worldwide. Operating in international markets requires significant resources and management attention. Historically, a significant majority of our revenue has been generated from international customers. For example, in 2010, we generated 51% of our revenue internationally and 49% in the United States, and in the first nine months of 2011, we produced 57% of our revenue internationally and 43% in the United States. International revenue and operations may be subject to risks such as:
- •
- difficulties in staffing and managing foreign operations;
- •
- burdens of complying with a wide variety of laws, regulations and standards;
- •
- controls on or obstacles to the repatriation of earnings and cash;
- •
- currency exchange rate fluctuations;
- •
- different tax burdens;
- •
- preference for local vendors;
- •
- trade restrictions;
21
- •
- changes in tariffs;
- •
- the imposition of government controls;
- •
- nationalization or seizure by banking regulators of our customers;
- •
- political instability;
- •
- exposure to a business culture in which improper sales practices may be prevalent; and
- •
- terrorist activities.
The legal systems of developing countries continue to rapidly evolve, the interpretations of many laws, regulations and rules are not always uniform and enforcement of these laws, regulations and rules involve uncertainties, which may limit legal protections available to you and us. In certain instances, local implementation rules and/or the actual implementation are not consistent with the regulations at the national level. Additionally, the laws of certain countries do not protect our intellectual property to the same extent as do the laws of the United States. Our failure to comply with applicable laws and regulations could subject us to administrative penalties and injunctive relief, as well as civil remedies, including fines, injunctions and recalls of our services and solutions.
International expansion and market acceptance depend on our ability to modify our business approach and technology to take into account such factors as differing customer business models, services requirements and needs, the applicable regulatory and business environment, labor costs and other economic conditions. There can be no assurance that these factors will not have an adverse effect on our future international revenue and, consequently, on our business, financial condition and results of operations.
Additionally, we are subject to the U.S. Foreign Corrupt Practices Act, or the FCPA, and other laws in the United States and elsewhere that prohibit improper payments or offers of payments to foreign governments and their officials and political parties for the purpose of obtaining or retaining business. We have operations in and deal with countries known to experience corruption. Our activities in these countries create the risk of unauthorized payments or offers of payments by one of our employees, contractors or customers that could be in violation of various laws, including the FCPA, even though these parties are not always subject to our control. We have implemented safeguards to discourage these practices by our employees, consultants and customers. However, our existing safeguards and any future improvements may prove to be less than effective, and our employees, contractors or customers may engage in conduct for which we might be held responsible. Violations of the FCPA or similar laws may result in severe criminal or civil sanctions and we may be subject to other liabilities, which could adversely affect our business, financial condition and results of operations.
Adverse changes in political and economic policies of the Chinese government could impede the overall economic growth of China, which could reduce the demand for our services and solutions and damage our business.
We conduct significant operations, including through an indirect subsidiary and a branch office, and generate a significant portion of our revenue, in the People's Republic of China, or China, as well as Hong Kong and Macau, which are special administrative regions of China.
22
Accordingly, our business, financial condition, results of operations and prospects are affected significantly by economic, political and legal developments in China. The Chinese economy differs from the economies of most developed countries in many respects, including:
- •
- a higher level of government involvement;
- •
- an early stage of development of the market-oriented sector of the economy;
- •
- a rapid growth rate;
- •
- a higher level of control over foreign exchange; and
- •
- the control over the allocation of resources.
As the Chinese economy has been transitioning from a planned economy to a more market-oriented economy, the Chinese government has implemented various measures to encourage economic growth and guide the allocation of resources. Although these measures may benefit the overall Chinese economy, they may also have a negative effect on us.
Although the Chinese government has in recent years implemented measures emphasizing the utilization of market forces for economic reform, the Chinese government continues to exercise significant control over economic growth in China through the allocation of resources, controlling the payment of foreign currency-denominated obligations, setting monetary policy, state ownership and imposing policies that impact particular industries or companies in different ways. For example, the Chinese government has suggested that Chinese government authorities should strengthen access and supervision with respect to the outsourcing of bank card data processing and related operations, specifically noting the need for specific regulations with respect to foreign-invested organizations that engage in related services in China.
Our ability to operate in China may be harmed by changes in its laws and regulations, including those relating to taxation, import and export tariffs, environmental regulations, land use rights, property and other matters. Government actions in the future, including any decision not to continue to support recent economic reforms and to return to a more centrally planned economy or regional or local variations in the implementation of economic policies, could have a significant effect on economic conditions in China or particular regions thereof.
Any adverse change in economic conditions or government policies in China could have a material adverse effect on the overall economic growth in China, which in turn could lead to a reduction in demand for our services and solutions and consequently adversely affect our business, financial condition and results of operations.
We derive a significant percentage of our net revenue from a limited number of countries and territories, and any natural disasters or other adverse changes could harm our business.
A significant portion of our net revenue is derived from six countries and territories. For the nine months ended September 30, 2011, we derived 43%, 20%, 10%, 8%, 6% and 4% of our net revenue from the United States, Hong Kong, the United Arab Emirates, China, Taiwan and India, respectively. We expect that a limited number of countries and territories will continue to account for a significant portion of our net revenue in future periods. If any of these countries or territories are affected by acts of terrorism, natural disasters, the effects of climate change, outbreaks of diseases or other significant adverse changes, cross-border travel to these countries and territories could decline, which could adversely affect our business, financial condition and results of operations.
23
Adverse changes in general economic or political conditions in any of the major countries or territories in which we do business could adversely affect our operating results.
Our business can be affected by a number of factors that are beyond our control, such as general geopolitical, economic, and business conditions. As a result of the recent global macroeconomic downturn, consumers reduced their international travel and spending. We cannot predict the reoccurrence of any economic slowdown or the strength or sustainability of the economic recovery, or the magnitude of any new geopolitical or economic conditions and the affect they would have on our business. A further weakening in the economy may reduce the number of transactions we process and, as a result, reduce our revenue.
Additionally, we generate a significant amount of our revenue from cross-border transactions. Thus, revenue from processing cross-border transactions for our customers fluctuates with cross-border travel and the need for transactions to be converted into a different currency. Cross-border travel may be adversely affected by world geopolitical, economic and other conditions. These include the threat of terrorism, natural disasters, the effects of climate change, and outbreaks of diseases. A decline in cross-border travel could adversely affect our revenue. A decline in the need for conversion of currencies might also adversely affect our revenue and profitability.
Additionally, because we are domiciled in the United States, a negative perception of the United States arising from its political or other positions could harm the perception of our company and our brand. Any of these factors could adversely affect our business, financial condition and results of operations.
Consolidation among financial institutions, including the merger of our customers with entities that are not our customers or the sale of portfolios of merchants by our customers to entities that are not our customers could materially impact our financial position and results of operation.
The payments industry is currently undergoing significant consolidation. Specifically, we face the risk that our acquiring bank or processor customers may merge with entities that are not our customers or may sell portfolios of merchants to entities that are not our customers, thereby impacting our existing agreements and projected revenue with these customers. Consolidation among financial institutions results in an increasingly concentrated client base of large acquiring banks and processors and could increase the bargaining power of our current and future customers. In addition, any nationalization or seizure of one of our acquiring bank customers by banking regulators in any of the jurisdictions in which we operate may also impact the services that we provide. Any significant changes in the ownership or operation of our customers, as a result of consolidation or otherwise, could adversely affect our business, financial condition and results of operations.
If our services and solutions do not interoperate with our customers' systems or experience defects, errors, or delays, the purchase or deployment of our services and solutions may be delayed or cancelled.
Our services are based on sophisticated software and computing systems and are designed to interface with our customers' payment card systems, each of which may have different specifications and utilize different standards. If we find errors in the existing software or defects in the hardware used in our customers' systems, or if there are errors or delays in our
24
processing of electronic transactions or defects in our software, we may need to modify our services or solutions to fix or overcome these errors, delays and defects and/or our customers may need to modify or fix their systems so that our services and solutions will interoperate with the existing software and hardware. Either of these solutions could result in additional development costs, diversion of technical and other resources from our other development efforts, loss of credibility with current or potential customers, harm to our reputation, breaches in security and/or exposure to liability claims. In addition, if our services and solutions do not interoperate with our customers' systems, customers may seek to hold us liable and demand for our services and solutions could be adversely affected. Any of these events could hurt our operating results, damage our reputation, and adversely affect our business, financial condition and results of operations.
Interruptions or delays in service from our systems and processing centers could impair the delivery of our services and harm our business.
We currently serve our customers out of seven synchronized processing centers linked by a global telecommunications network. Our primary data centers are located in Elmsford, New York, and New Castle, Delaware, but we also host facilities in Bermuda, Shanghai and Macau and host two facilities in Hong Kong, through co-location arrangements. We depend on the efficient and uninterrupted operation of our computer network systems, software, telecommunications networks, and processing centers, as well as the systems and services of third parties.
Our systems and processing centers are vulnerable to damage or interruption from, among other things, fire, natural disaster, power loss, telecommunications failure, terrorist acts, war, unauthorized entry, human error, and computer viruses or other defects. They may also be subject to break-ins, sabotage, intentional acts of vandalism and similar misconduct.
We have security, backup and recovery systems in place, as well as business continuity plans designed to ensure our systems will not be inoperable. However, there is still a risk that a system outage or data loss may occur which would not only damage our reputation but as a result of contractual commitments could also require the payment of penalties to our clients if our systems do not meet certain operating standards. Despite precautions taken at these facilities, the occurrence of a natural disaster or an act of sabotage or terrorism, a decision to close the facilities without adequate notice or other unanticipated problems at these facilities could result in lengthy interruptions in our service. Our property and business interruption insurance may not be applicable or adequate to compensate us for all losses or failures that may occur.
Any damage to, failure of, or defects in our systems or those of third parties, errors or delays in the processing of payment transactions, telecommunications failures or other difficulties could result in loss of revenue, loss of merchants, loss of merchant and consumer data, harm to our business or reputation, exposure to fraud losses or other liabilities, negative publicity, additional operating and development costs, and diversion of technical and other resources.
If we fail to respond to evolving technological changes, our services and solutions could become obsolete or less competitive.
Our industry is characterized by new and rapidly evolving technologies, developing industry standards and legal regulations and customer requirements and preferences. Recent
25
technological developments include smart cards, mobile commerce and radio frequency and proximity payment devices, such as contactless cards. Accordingly, our operating results depend upon, among other things, our ability to anticipate and respond to these industry and customer changes in order to remain competitive. The process of developing new technologies and services and solutions is complex, and carry the risks associated with any research and development effort, including cost overruns, delays in delivery and performance problems.
Our markets are experiencing rapid technological change. Any delay in the delivery of new services or solutions or the failure to differentiate our services and solutions could render them less desirable to our customers, or possibly even obsolete. In addition, our services and solutions are designed to process complex transactions and deliver reports and other information on those transactions, all at high volumes and processing speeds. Any failure to deliver an effective and secure service or solution, or any performance issue that arises with a new service or solution could result in significant processing or reporting errors, possibly resulting in losses.
If we are unable to develop enhancements and new features for our existing services and solutions or new services and solutions that keep pace with technological developments, industry standards, legal regulations, and customer requirements and preferences, our services and solutions may become obsolete and less marketable, and our business could be significantly harmed. Additionally, if there are delays in the introduction of new features or new services and solutions to the market, our business could be significantly harmed.
We operate in a highly competitive industry and we compete against many companies with substantially greater financial and other resources, and our business may be harmed if we are unable to respond to our competitors effectively.
Competition in our market is intense and involves rapidly changing technologies, evolving industry standards, frequent new product and service introductions, and changes in customer requirements. To maintain and improve our competitive position, we must keep pace with the evolving needs of our customers and continue to develop and introduce new features, services and solutions in a timely and efficient manner. Our primary competitors are international payment processors, multi-currency payment service providers and global e-commerce payment service providers. Our competitors that are financial institutions or subsidiaries of financial institutions do not incur the costs associated with being sponsored by a bank for registration with the card networks. These factors may allow them to offer better pricing terms to customers, which could result in a loss of our current or potential customers or could force us to lower our prices as well. Either of these actions could adversely affect our business, financial condition and results of operations.
Currently, there is a high level of concentration in the international payment processing industry, with a few large processors providing payment card processing services to acquiring banks on a multi-national and multi-regional basis. International processors with whom we compete include: First Data Corporation, with its OmniPay Limited subsidiary operating a multi-currency platform; Elavon, Inc., a wholly owned subsidiary of U.S. Bancorp, that operates in North America and Europe; and WorldPay (UK) Limited, formerly owned by Royal Bank of Scotland Group, PLC, that also primarily services the North American and European markets.
26
The multi-currency payment service industry is largely segmented among large, international processors, which provide multi-currency processing services as part of their broader international payment processing service, including those referenced above, and smaller companies who work on a regional or local basis to provide DCC or multi-currency processing services on behalf of acquiring banks or merchants. Specialized DCC providers include: FEXCO Holdings; Travelex Holdings Limited; Global Blue; Monex Financial Services Limited; Pure Commerce Pty Ltd; Fintrax Group Holdings, Ltd.; and Continuum Commerce Ltd. (formerly known as GCX (Global Currency Exchange Limited)).
In the global e-commerce payment space, our Multi-Currency Pricing service and iPAY Gateway, or iPAY, compete with several international online payment service providers, including CyberSource Corporation, a subsidiary of Visa, MasterCard International Gateway Services, or MIGS, PayPal, Inc., GlobalCollect, WorldPay (UK) Limited, and Payvision. In the Asia Pacific region, we compete against regional providers, including AsiaPay Limited, Joint Electronic Teller Services Ltd., or JETCO, and eNETS Pte Ltd, but also support MIGS.
Several of our competitors enjoy substantial competitive advantages such as:
- •
- greater name and brand recognition and longer operating histories;
- •
- larger sales and marketing budgets and resources;
- •
- greater resources to make acquisitions of other competitors or products, services and technologies that strengthen their
service and solution offerings and increase their presence in the market;
- •
- lower labor and development costs;
- •
- larger intellectual property portfolios related to electronic payment methods and systems; and
- •
- substantially greater financial, technical, customer support and other resources.
Conditions in our market could change rapidly and significantly as a result of technological advancements or market consolidation. For example, one of our smaller payment processing competitors may be acquired by a larger company with significant resources, and could leverage those resources to become a more significant competitive presence in our market. The development and market acceptance of alternative technologies could decrease the demand for our services and solutions or render them obsolete.
Our competitors may have the ability to devote more financial and operational resources than we can to the development of new technologies, including Internet payment processing services that provide improved operating functionality and features to their service and solution offerings. If successful, their development efforts could render our services and solutions less desirable to customers. If we are unable to compete successfully in the future, our business may be harmed.
27
We have experienced rapid growth in recent periods. If we fail to manage our growth effectively, our financial performance may suffer.
We have substantially expanded our overall business, customer base, employee headcount and operations in recent periods both domestically and internationally. Our expansion has placed, and our expected future growth will continue to place, a significant strain on our managerial, customer operations, research and development, sales and marketing, manufacturing, administrative, financial and other resources. In particular, we provided our services to 7,946 active merchant locations in seven countries and territories as of December 31, 2008 and over 25,000 active merchant locations in 16 countries and territories as of September 30, 2011. Our growth strategy contemplates further increasing the number of our customers and active merchant locations, however, the rate at which we have been able to establish relationships with our customers and active merchant locations in the past may not be indicative of the rate at which we will be able to do so in the future.
Our success will depend in part upon the ability of our management team to manage growth effectively. Our ability to grow also depends upon our ability to successfully hire, train, supervise, and manage new employees, obtain financing for our capital needs, expand our systems effectively, control increasing costs, allocate our human resources optimally, enhance and improve our operational functions and our finance and accounting functions, and manage the pressures on our management and administrative, operational and financial infrastructure. There can be no assurance that we will be able to accurately anticipate and respond to the changing demands we will face as we continue to expand our operations or that we will be able to manage growth effectively or to achieve further growth at all. If our business does not continue to grow or if we fail to effectively manage any future growth, our business, financial condition and results of operations could be adversely affected.
Our quarterly results are inherently unpredictable and subject to substantial fluctuations, and, as a result, we may fail to meet the expectations of securities analysts and investors, which could adversely affect the trading price of shares of our common stock.
We expect our quarterly revenue and operating results may vary significantly from quarter to quarter due to a number of factors, many of which are outside of our control and any of which may cause our stock price to fluctuate. The factors that may affect the unpredictability of our quarterly results include, but are not limited to:
- •
- our dependence on a limited number of customers;
- •
- our reliance on acquiring banks, processors, merchants and other technology providers to integrate our services within
their services and to offer our services to consumers;
- •
- the timing of new service launches with new and existing customers;
- •
- our inability to increase sales to existing customers, retain existing customers and attract new customers;
- •
- seasonality in the use of our services, as our revenue has historically been seasonal with the first quarter of our year
traditionally having less revenue compared to the prior fourth fiscal quarter;
- •
- changes in our pricing policies;
28
- •
- the amount and timing of operating expenses and capital expenditures related to the expansion of our operations and
infrastructure;
- •
- the timing of revenue and expenses related to the development or acquisition of technologies, products, services or
businesses;
- •
- changing market conditions;
- •
- competition;
- •
- failures of our services that result in contractual penalties or terminations; and
- •
- economic, regulatory and political conditions in the markets where we operate or anticipate operating, particularly those impacting cross-border travel and commerce.
As a result, we believe that quarter-to-quarter comparisons of operating results are not necessarily a good indication of what our future performance will be. It is likely that in some future quarters, our operating results may be below the expectations of securities analysts or investors, in which case the price of shares of our common stock may decline and we could face costly securities class action suits or other unanticipated issues.
Seasonality may cause fluctuations in our operating results.
Our revenue has historically been seasonal with the first quarter of our year traditionally having less revenue compared to the prior fourth fiscal quarter. We believe that increased international travel and spending by consumers during the traditional holiday months of November and December cause the fourth quarter of our year to have relatively higher revenue than our other quarters. Our seasonal volumes and revenue trends could change from those we have historically experienced upon our entry into new geographies, such as our entry into the Middle East in 2010.
In addition, the timing of signing a contract and implementing our services with a large acquiring bank or processor and bringing their merchants on board may overshadow seasonal factors in any particular quarterly period. In the future, we may experience revenue growth from additional other factors such as regulatory mandates that could continue to mask underlying seasonality of our business. Seasonal or cyclical variations in our operations may become more pronounced over time and may materially affect our results of operations in the future. We expect seasonality to continue to impact our business in the future.
Where we have direct contractual acquiring relationships with merchants, we incur chargeback liability when our merchants fail to reimburse chargebacks resolved in favor of their customers. We cannot accurately anticipate these liabilities, which may adversely affect our results of operations and financial condition.
In the event a billing dispute between a consumer and a merchant is not resolved in favor of the merchant, the transaction is normally "charged back" to the merchant and the purchase price is credited or otherwise refunded to the consumer. If we are acting as the acquiring bank by virtue of our status as an ISO and are unable to collect such amounts from the merchant's account or reserve account (if applicable), or if the merchant refuses or is unable, due to closure, bankruptcy or other reasons, to reimburse us for a chargeback, we bear the loss for the amount of the refund paid to the consumer. The risk of chargebacks is typically greater
29
with those merchants that promise future delivery of goods and services rather than delivering goods or rendering services at the time of payment. Although only a small part of our revenue is derived from direct contractual acquiring relationships with merchants, any increase in chargebacks not paid by our merchants may adversely affect our business, financial condition and results of operations.
Where we have direct contractual acquiring relationships with merchants, fraud by merchants or others or the violation of card association requirements by merchants could have an adverse effect on our operating results and financial condition.
We have potential liability for fraudulent bankcard transactions or credits initiated by merchants or others where we are acting as the acquiring bank by virtue of our status as an ISO. Examples of merchant fraud include when a merchant processes fraudulent debit transactions or credits an accomplice's payment card for transactions that did not occur or intentionally fails to deliver the merchandise or services sold in an otherwise valid transaction. Criminals are using increasingly sophisticated methods to engage in illegal activities such as counterfeit and fraud. While we have systems and procedures designed to detect and reduce the impact of fraud, we cannot ensure the effectiveness of these measures. It is possible that incidents of fraud could increase in the future. Failure to effectively manage risk and prevent fraud would increase our chargeback liability or other liability. Additionally, if a merchant fails to comply with the applicable requirements of the card associations, it could be subject to a variety of fines or penalties that may be levied by the card associations. If we cannot collect such amounts from the applicable merchant, we could end up bearing such fines or penalties. Although only a small part of our revenue are derived from direct contractual relationships with merchants, increases in chargebacks or other liability could adversely affect our business, financial condition and results of operations.
We are exposed to currency exchange risk.
We perform currency conversion data processing services, which involves processing and accounting for payments in multiple currencies. The currency conversion underlying such services is presently carried out through the card associations and certain acquiring banks with different exchange rates being applied to a transaction on authorization and subsequent settlement. In most cases, we may have exposure to between one and three days of currency exchange risk. Daily fluctuations will occur in the rate of exchange of the various currencies for which we offer multi-currency payment processing. These fluctuations may be favorable or adverse. Although there can be no guarantee that future fluctuations will match events to date, our analysis of these variations over an extended period of years indicates that variations over the short run have been substantially less than the margin that we charge for multi-currency payment processing transactions, and over the long run to date, the average variation has been nominal. In most cases, we share revenue with acquiring banks and processors and merchants after taking into account foreign exchange fluctuations, and therefore the risk is borne proportionately by us and the other parties participating in these transactions. Although we do not currently engage in hedging or other techniques to minimize exposure to currency exchange risk, we may decide to do so in the future as international transactional volume increases, and such techniques would introduce additional risks, including the risk that a counterparty may be unable to fulfill its obligations to us under such contracts.
30
Additionally, in the future, it is possible that an increasing proportion of our revenue will be received in non-U.S. currencies that may be subject to foreign currency risk as international currencies fluctuate relative to the value of the U.S. Dollar. Resulting exchange gains and losses are included in our net income. This may give rise to an exchange risk against the U.S. Dollar upon repatriation of foreign currency earnings or upon consolidation for financial account purposes. We will consider strategies for managing and hedging such risks once the volume of foreign earnings reaches certain threshold levels. Furthermore, we may become subject to exchange control regulations that might restrict or prohibit the conversion of its revenue currencies into U.S. Dollars or other freely tradable currencies. The occurrence of any of these factors could adversely affect our business, financial condition and results of operations.
Our business may suffer if it is alleged or found that our services infringe the intellectual property rights of others.
The operation of our business may subject us to claims of infringement or misappropriation of third party intellectual property. Responding to such claims, regardless of their merit, can be time consuming, costly to defend in litigation, divert management's attention and resources, damage our reputation and brand, and cause us to incur significant expenses. Even if we are indemnified against such costs, the indemnifying party may be unable to uphold its contractual obligations. Further, claims of intellectual property infringement might require us to redesign or replace affected services, delay affected service offerings, enter into costly settlement or license agreements or pay costly damage awards or face a temporary or permanent injunction prohibiting us from marketing, selling or distributing the affected services. If we cannot or do not license the infringed technology on reasonable terms or at all, or substitute similar technology from another source, our revenue and earnings could be adversely impacted. Additionally, our customers may not purchase our services if they are concerned that our services infringe third party intellectual property rights. This could reduce the market opportunity for the sale of our services and solutions.
For example, a competitor holds a patent for a particular method of performing DCC in several countries and territories including Canada, Hong Kong, India, Malaysia, Singapore and Taiwan, which could obstruct or impair us from doing business in those jurisdictions. Other parties, including other competitors, have filed patent applications or obtained patents with respect to various aspects of DCC in the United States and abroad. We closely monitor these applications and the actions of other parties who hold patents relating to DCC. Our ability to do business in particular jurisdictions may be severely impaired in the event that a third party successfully argues that any of our services, including Pay In Your Currency, infringe a patent held by such third party. Any pre-emptive legal action or legal action to defend against a lawsuit may not be successful, and could result in substantial legal fees, which could adversely affect our financial condition and results of operations.
Further, we are contractually obligated to indemnify certain customers or other third parties that use our services for losses suffered or incurred in the event our services are alleged to infringe a third party's intellectual property rights. The term of these indemnity provisions is generally perpetual after execution of the customer agreement subject to the statute of limitations.
The occurrence of any of these events may adversely affect our business, financial condition and results of operations.
31
The success of our business depends on our ability to protect and enforce our intellectual property rights.
We rely on a combination of patent, trademark, copyright and trade secret laws, as well as confidentiality procedures and contractual restrictions, to establish, maintain and protect our proprietary rights. These laws, procedures and restrictions provide only limited protection and any of our intellectual property rights may be challenged, invalidated, circumvented, infringed or misappropriated. Further, the laws of certain countries do not protect proprietary rights to the same extent as the laws of the United States and, to the extent available, may be very difficult to enforce and, therefore, in certain jurisdictions, we may be unable to protect our proprietary technology adequately against unauthorized third party copying, infringement or use, which could adversely affect our competitive position.
As of December 31, 2011, we had one patent issued and two patent applications pending in the United States, and multiple issued patents in India, New Zealand, the Philippines, Singapore and Sri Lanka and patent applications pending in several other jurisdictions, all of which are counterparts to our patent and patent applications in the United States. We cannot ensure that any of our pending applications will be granted or that any of our issued patents will adequately protect our intellectual property. Any patents that may be issued to us may be contested, circumvented, found unenforceable or invalidated and we may not be able to prevent third parties from infringing them. In addition, third parties could claim invalidity, co-inventorship, re-examination, or similar claims with respect to any of our currently issued patents or any patents that may be issued to us in the future. Any such claims, whether or not successful, could be extremely costly to defend, divert management's attention and resources, damage our reputation and brand, and substantially harm our business.
In addition to patented technology, we rely on our unpatented technology and trade secrets. We generally seek to protect this information by confidentiality, non-disclosure and assignment of invention agreements with our employees and contractors and with parties with which we do business. These agreements may be breached and we may not have adequate remedies for any such breach. We cannot be certain that the steps we have taken will prevent unauthorized use or reverse engineering of our technology. Moreover, our trade secrets may be disclosed to or otherwise become known or be independently developed by competitors. To the extent that our employees, contractors, or other third parties with whom we do business use intellectual property owned by others in their work for us, disputes may arise as to the rights in related or resulting know-how and inventions.
In order to protect or enforce our proprietary technology, we may initiate litigation against third parties, such as patent infringement suits or patent interference proceedings. Litigation may be necessary to assert claims of infringement, enforce our patents, protect our trade secrets or know-how, or determine the enforceability, scope and validity of the proprietary rights of others. Any lawsuits that we initiate could be expensive, take significant time and divert management's attention from other business concerns. Litigation also puts our patents at risk of being invalidated or interpreted narrowly and our patent applications at risk of not issuing. Additionally, we may provoke third parties to assert claims against us. We may not prevail in any lawsuits that we initiate and the damages or other remedies awarded, if any, may not be commercially valuable.
32
If, for any of the above reasons, our intellectual property is disclosed or misappropriated, it would harm our ability to protect our rights and could adversely affect our business, financial condition and results of operations.
We may not be able to enforce our contracts with our customers, including any exclusivity arrangements.
If our customers do not comply with the terms of our contracts, such as the payment of fees or exclusivity arrangements, we may lose revenue and this may adversely affect our business. Particularly, if those customers with whom we have exclusivity arrangements do not comply with these provisions, we may lose business to our competitors. If our customers do not comply with the provisions of our contracts, we may be required to enter into expensive litigation in order to enforce our rights. We cannot be certain that any such litigation would be successful. Even if successful, litigation may merely prevent a customer from engaging in competitive activity but would not necessarily require the customer to continue to use our services and, in any event, may severely harm the working relationship with such customer and other existing and potential customers that may learn of the litigation.
The costs and effects of litigation, investigations or similar matters, or adverse facts and developments related thereto, could materially affect our financial position and results of operations.
From time to time, we may be involved in various litigation matters and governmental or regulatory investigations or similar matters arising out of our business. Our insurance may not cover all claims that may be asserted against it, and any claims asserted against us, regardless of merit or eventual outcome, may harm our reputation. Should the ultimate judgments or settlements in any pending or future litigation or investigation significantly exceed our insurance coverage, they could adversely affect our business, financial condition and results of operations In addition, we may not be able to obtain appropriate types or levels of insurance in the future, nor may we be able to obtain adequate replacement policies with acceptable terms, if at all. In addition, the expense of defending litigation may be significant, the amount of time to resolve lawsuits is unpredictable and defending ourselves may divert management's attention from the day-to-day operations of our business, any of which could adversely affect our business, results of operations and cash flows.
Our inability to acquire and integrate other businesses, services or technologies could seriously harm our competitive position.
In order to remain competitive, obtain key competencies or accelerate our time to market, we may seek to acquire additional businesses or technologies and new products. To date, we have a limited history of acquisitions. Most recently, we completed the acquisition of the assets of iPAY and its associated merchant processing portfolio in 2008. If we identify an appropriate acquisition candidate, we may not be successful in negotiating the terms of the acquisition, financing the acquisition, or effectively integrating the acquired business, services or technology into our existing business and operations. We may have difficulty integrating acquired technologies or products with our existing services and solutions. Our due diligence may fail to identify all of the problems, liabilities or other shortcomings or challenges of an acquired business, services or technology, including issues related to intellectual property, quality, regulatory compliance practices, revenue recognition or other accounting practices or
33
employee or customer issues. If we finance acquisitions by issuing convertible debt or equity securities, our existing stockholders may be diluted which could affect the market price of shares of our common stock. In addition, any acquisitions we are able to complete may not result in the synergies or any other benefits we had expected to achieve, which could result in substantial write-offs. Contemplating or completing an acquisition and integrating an acquired business, services or technology will significantly divert management and employee time and resources. Further, if the integration process does not proceed smoothly, the following factors, among others, could reduce our revenue and earnings, increase our operating costs, and result in a loss of projected synergies:
- •
- if we are unable to successfully integrate the benefits, duties and responsibilities, and other factors of interest to the
management and employees of the acquired business, we could lose employees to our competitors in the region, which could significantly affect our ability to operate the business and complete the
integration; and
- •
- if the integration process causes any delays with the delivery of our services, or the quality of those services, we could lose customers to our competitors, which would reduce our revenue and earnings.
Our business is subject to changing regulations regarding corporate governance, disclosure controls, internal control over financial reporting and other compliance areas that will increase both our costs and the risk of noncompliance. If we fail to comply with these regulations or remediate the material weakness identified in our internal control over financial reporting, we could face difficulties in preparing and filing timely and accurate financial reports.
Upon completion of this offering, we will be subject to the reporting requirements of the Securities Exchange Act of 1934, as amended, or the Exchange Act, the Sarbanes-Oxley Act of 2002, or the Sarbanes-Oxley Act, the recently enacted Dodd-Frank Wall Street Reform and Consumer Protection Act, or the Dodd-Frank Act, and the rules and regulations of The NASDAQ Stock Market. In addition, we are currently listed on AIM and subject to AIM's admission and compliance requirements. Achieving and maintaining compliance with these rules and regulations will increase our legal, accounting and financial compliance costs, will make some activities more difficult, time-consuming and costly and may also place increased strain on our personnel, systems and resources.
The Sarbanes-Oxley Act requires, among other things, that we maintain effective disclosure controls and procedures and, in the future, internal control over financial reporting. Any failure to develop or maintain effective controls, or any difficulties encountered in their implementation or improvement, could harm our operating results or cause us to fail to meet our reporting obligations and may result in a restatement of our prior period financial statements. Any failure to implement and maintain effective internal controls also could adversely affect the results of periodic management evaluations and annual auditor attestation reports regarding the effectiveness of our internal control over financial reporting that we will be required to include in our periodic reports filed with the SEC, beginning for our year ending December 31, 2013 under Section 404 of the Sarbanes-Oxley Act. Ineffective disclosure controls and procedures and internal control over financial reporting could also cause investors to lose confidence in our reported financial and other information, which would likely have a negative effect on the trading price of shares of our common stock.
34
In connection with the restatement of our financial statements as of December 31, 2009 and 2010 and for the three years ended December 31, 2010, we received a letter from our independent registered public accounting firm stating that there was a material weakness in internal control over financial reporting under the standards established by the Public Company Accounting Oversight Board. The letter stated that our internal control regarding management's detailed review of our financial statements (including footnotes) was not operating effectively. In preparing our financial statements for the three years ended December 31, 2008, 2009 and 2010, there was a lack of adequate controls to ensure that the figures in the financial statements were reconciled to the underlying supporting schedules and that our significant accounting policies adhered to U.S. GAAP. The result of this specific internal control not operating effectively was an indication that (1) our internal control over financial reporting was not operating effectively to mitigate potential material misstatements and (2) additional misstatements in the financial statements may occur if this deficiency is not remediated.
A complete listing of the adjustments that led to the above conclusion, that there was a material weakness in our internal control over financial reporting, is set forth in Note 2 (Immaterial restatement) to our consolidated financial statements included elsewhere in this prospectus. If we are unable to appropriately maintain the remediation plan we have recently implemented and maintain any other necessary controls currently in place or that we implement in the future, or if any difficulties are encountered in their implementation or improvement, (1) our management might not be able to certify, and our independent registered public accounting firm might not be able to report on, the adequacy of our internal control over financial reporting, which would cause us to fail to meet our reporting obligations, and (2) additional misstatements in our financial statements may occur.
In addition to the remediation plan, in order to maintain the effectiveness of our disclosure controls and procedures and internal control over financial reporting going forward, we will need to expend significant resources and provide significant management oversight. We have a substantial effort ahead of us to implement appropriate processes, document our system of internal control over relevant processes, assess their design, remediate any deficiencies identified and test their operation. As a result, management's attention may be diverted from other business concerns, which could harm our business, operating results and financial condition. These efforts will also involve substantial accounting-related costs. Prior to this offering, we have never been required to test our internal controls within a specified period and, as a result, we may experience difficulty in meeting these reporting requirements in a timely manner, particularly if material weakness or significant deficiencies persist.
Implementing any appropriate changes to our internal controls may require specific compliance training of our directors, officers and employees, entail substantial costs in order to modify our existing accounting systems, and take a significant period of time to complete. Such changes may not, however, be effective in maintaining the adequacy of our internal controls, and any failure to maintain that adequacy, or consequent inability to produce accurate financial statements on a timely basis, could increase our operating costs and could materially impair our ability to operate our business. In the event that we are not able to demonstrate compliance with Section 404 of the Sarbanes-Oxley Act in a timely manner, our internal controls are perceived as inadequate or that we are unable to produce timely or accurate financial statements, our stock price could decline and we could be subject to sanctions or investigations by The NASDAQ Stock Market, the SEC or other regulatory authorities, which would require additional financial and management resources.
35
The Sarbanes-Oxley Act and the rules and regulations of The NASDAQ Stock Market may make it more difficult and more expensive for us to maintain directors' and officers' liability insurance, and we may be required to accept reduced coverage or incur substantially higher costs to maintain or increase coverage. If we are unable to maintain adequate directors' and officers' insurance, our ability to recruit and retain qualified directors, especially those directors who may be considered independent for purposes of The NASDAQ Stock Market rules, and officers may be curtailed.
Changes in financial accounting standards or practices may cause adverse, unexpected financial reporting fluctuations and affect our reported results of operations.
A change in accounting standards or practices can have a significant effect on our reported results and may even affect our reporting of transactions completed before the change is effective. New accounting pronouncements and varying interpretations of accounting pronouncements have occurred and may occur in the future. Changes to existing rules or the questioning of current practices may adversely affect our reported financial results or the way we conduct our business.
We may not be able to secure additional financing on favorable terms, or at all, to meet our future capital needs.
In the future, we may require additional capital to respond to business opportunities, challenges, acquisitions or unforeseen circumstances and may determine to engage in equity or debt financings or enter into credit facilities for other reasons. We may not be able to timely secure additional debt or equity financing on favorable terms, or at all. Any debt financing obtained by us in the future could involve restrictive covenants relating to our capital raising activities and other financial and operational matters, which may make it more difficult for us to obtain additional capital and to pursue business opportunities, including potential acquisitions. If we raise additional funds through further issuances of equity, convertible debt securities or other securities convertible into equity, our existing stockholders could suffer significant dilution in their percentage ownership of our company, and any new equity securities we issue could have rights, preferences and privileges senior to those of holders of our common stock, including shares of our common stock sold in this offering. If we are unable to obtain adequate financing or financing on terms satisfactory to us, when we require it, our ability to continue to grow or support our business and to respond to business challenges could be significantly limited.
We may not be able to utilize a significant portion of our net operating loss carryforwards, which could adversely affect our results.
As of December 31, 2010, we had federal and state net operating loss carryforwards of $66.7 million due to prior period losses, which expire between 2020 and 2029. Realization of these net operating loss carryforwards is dependent upon future income arising prior to the expiration dates and other factors under the relevant provisions of the Internal Revenue Code of 1986, as amended, or the Code. Our existing net operating loss carryforwards could expire and be unavailable to offset future income tax liabilities or that the use of our net operating loss carryforwards could be limited, which would adversely affect our results.
36
Our business and financial performance could be negatively impacted by the application of new tax regulations or changes in existing tax laws or regulations.
We could be subject to taxation by various jurisdictions on our net income or fees charged to customers for our services. New income, sales, use or other tax laws, statutes, rules, regulations or ordinances could be enacted at any time. Additionally, existing tax laws, statutes, rules, regulations or ordinances could be interpreted, changed, modified or applied adversely to us. These events could require us or our customers to pay additional tax amounts on a prospective or retroactive basis, as well as require us or our customers to pay fines and/or penalties and interest for past amounts deemed to be due. If we raise our prices to offset the costs of these changes, existing and potential future customers may elect not to continue or purchase our services and solutions in the future. If we are unable to pass these tax expenses on to our customers, our costs will increase, reducing our earnings. Any or all of these events could adversely impact our business and financial performance.
Risks related to this offering and ownership of our common stock
There has been only a limited prior market for our common stock in the United States and an active trading market for our common stock may not develop in the United States.
Prior to this offering, there has been a limited public market for shares of our common stock in the United States. In addition, since 2006, our common stock has traded on AIM under the symbols "PPT" and "PPTR," and immediately subsequent to this offering will continue to trade on AIM. Since 2008, our common stock has traded on the OTCQX in the United States under the symbol "PLPM," and immediately subsequent to this offering will cease to trade on the OTCQX. However, there is currently a limited volume of trading in our common stock on AIM and OTCQX, which affects the liquidity of our common stock. We cannot predict when or whether investor interest in our common stock might lead to an increase in its market price or the development of a more active trading market. The initial public offering price for our common stock will be determined through negotiations with the underwriters based on a number of factors, including the historic trading prices of our common stock on AIM, that might not be indicative of prices that will prevail in the trading market for our common stock in the United States. While our shares of common stock will be approved for trading on The NASDAQ Global Market, an active trading market for our shares in the United States may never develop or be sustained following this offering. If an active market for our common stock does not develop, it may be difficult to sell shares purchased in this offering without depressing the market price for the shares, or at all.
In addition, the stock markets have experienced extreme price and volume fluctuations that have affected and continue to affect the market prices of equity securities of listed companies. Stock prices of many newly public companies have fluctuated in a manner unrelated or disproportionate to the operating performance of those companies. In the past, stockholders have instituted securities class action litigation following periods of market volatility. If we were to become involved in securities litigation, it could subject us to substantial costs, divert resources and the attention of management from our business and adversely affect our business, financial condition and results of operations.
37
Upon the completion of this offering, our common stock will be traded on two separate stock markets and investors seeking to take advantage of price differences between such markets may create unexpected volatility in our share price; in addition, investors may not be able to easily move shares for trading between such markets.
Our shares of common stock are already admitted to and traded on AIM and will now be additionally listed and traded on The NASDAQ Global Market. Price levels for our common stock may fluctuate significantly on either market, independent of our common stock price on the other market. Investors could seek to sell or buy our common stock to take advantage of any price differences between the two markets through a practice referred to as arbitrage. Any arbitrage activity could create unexpected volatility in both our common stock prices on either exchange and the volumes of shares of our common stock available for trading on either exchange. In addition, holders of common stock in either jurisdiction will not be immediately able to transfer such common stock for trading on the other market without effecting necessary procedures with our transfer agent. This could result in time delays and additional cost for our stockholders. Further, if we are unable to continue to meet the regulatory requirements for admission to AIM or listing on The NASDAQ Global Market, we may lose our admission to AIM or listing on The NASDAQ Global Market, which could impair the liquidity of shares of our common stock. Investors whose source of funds for the purchase of shares of our common stock is denominated in a currency other than U.S. Dollars may be adversely affected by fluctuations in the exchange rate between such currency and the U.S. Dollar, even if the price of our common stock increases.
A significant portion of our total outstanding shares may be sold into the market in the near future. If there are substantial sales of shares of our common stock, the price of shares of our common stock could decline.
The price of shares of our common stock could decline if there are substantial sales of our common stock, particularly sales by our directors, executive officers and significant stockholders, or if there is a large number of shares of our common stock available for sale. After this offering, we will have outstanding shares of our common stock, based on 58,565,195 shares outstanding as of September 30, 2011. Upon listing shares of our common stock on The NASDAQ Global Market, stockholders who are not affiliates as such term is defined under Rule 144 and who have held their shares for more than one year may trade their shares on The NASDAQ Global Market. We, our officers, directors and certain other stockholders have entered into lock-up agreements with the underwriters that provide that for 180 days after the date of this prospectus neither we nor they will offer, pledge, sell or otherwise transfer or dispose of, directly or indirectly, any shares of our common stock or any securities convertible into or exercisable or exchangeable for shares of our common stock, or publicly disclose the intention to make any offer, sale, pledge or disposition, subject to limited exceptions. J.P. Morgan Securities LLC may, in its sole discretion, permit our officers, directors, employees and current stockholders who are subject to the 180-day contractual lock-up to sell shares prior to the expiration of the lock-up agreements. The 180-day lock-up period is subject to extension in some circumstances. Following the expiration of the lock-up period, all of these shares will be eligible for future sale, subject to the applicable volume, manner of sale, holding
38
period and other limitations of Rule 144. As a result, after this offering, shares of our common stock will be able to be sold in the near future as set forth below.
| Date available for sale into public market |
Number of shares and % of total outstanding |
|
|---|---|---|
Immediately after the date of this prospectus |
shares, or %, | |
181 days after the date of this prospectus |
shares, or %, of which , or %, shares will be subject to limitations under Rules 144 and 701 | |
After this offering, the holders of an aggregate of shares of our common stock outstanding as of September 30, 2011 will have rights, subject to some conditions, to require us to file registration statements covering their shares or to include their shares in registration statements that we may file for ourselves or our stockholders. All of these shares are subject to lock-up agreements restricting their sale for 180 days after the date of this prospectus. We also intend to register shares of common stock that we have issued and may issue under our employee equity incentive plans. Once we register these shares, they will be able to be sold freely in the public market upon issuance, subject to existing lock-up agreements. The market price of the shares of our common stock could decline as a result of sales of a substantial number of our shares in the public market or the perception in the market that the holders of a large number of shares intend to sell their shares.
We have broad discretion in the use of the net proceeds from this offering and may not use them effectively.
We cannot specify with any certainty the particular uses of the net proceeds that we will receive from this offering. Our management will have broad discretion in the application of the net proceeds, including working capital, possible acquisitions and other general corporate purposes, and we may spend or invest these proceeds in a way with which our stockholders disagree. The failure by our management to apply these funds effectively could harm our business and financial condition. Pending their use, we may invest the net proceeds from this offering in a manner that does not produce income or that loses value. These investments may not yield a favorable return to our investors.
If securities or industry analysts in the United States do not publish research or publish inaccurate or unfavorable research about our business, our stock price and trading volume could decline.
The trading market for our common stock will depend in part on the research and reports that securities or industry analysts publish about us or our business. We may never obtain research coverage by securities analysts in the United States, and industry analysts that currently cover us may cease to do so. If no securities analysts commence coverage of our company, or if industry analysts cease coverage of our company, the trading price for our stock would be negatively impacted. In the event we obtain securities analyst coverage, if one or more of the analysts who cover us downgrade our stock or publish inaccurate or unfavorable research about our business, our stock price would likely decline. If one or more of these analysts cease coverage of our company or fail to publish reports on us regularly, demand for our stock could decrease, which might cause our stock price and trading volume to decline.
39
Our directors, executive officers and principal stockholders will continue to have substantial control over us after this offering and could delay or prevent a change in corporate control.
After this offering, our directors, executive officers and holders of more than 5% of our common stock, together with their affiliates, will beneficially own, in the aggregate, % of our outstanding common stock. As a result, these stockholders, acting together, would have the ability to control the outcome of matters submitted to our stockholders for approval, including the election of directors and any merger, consolidation or sale of all or substantially all of our assets. In addition, these stockholders, acting together, would have the ability to control the management and affairs of our Company. Accordingly, this concentration of ownership might harm the market price of shares of our common stock by:
- •
- delaying, deferring or preventing a change of control of us;
- •
- impeding a merger, consolidation, takeover or other business combination involving us; or
- •
- discouraging a potential acquiror from making a tender offer or otherwise attempting to obtain control of us.
We do not intend to pay dividends for the foreseeable future.
We have never declared or paid cash dividends on our capital stock. We currently intend to retain any future earnings to finance the operation and expansion of our business, and we do not expect to declare or pay any dividends in the foreseeable future. As a result, you may only receive a return on your investment in our common stock if the market price of shares of our common stock increases.
If you purchase shares of our common stock in this offering, you will experience substantial and immediate dilution.
If you purchase shares of our common stock in this offering, you will experience substantial and immediate dilution in the pro forma net tangible book value per share after giving effect to this offering of $ per share as of September 30, 2011, based on an assumed initial public offering price of $ per share, which represents the midpoint of the estimated price range set forth on the cover page of this prospectus, because the price that you pay will be substantially greater than the pro forma net tangible book value per share of the common stock that you acquire. This dilution is due in large part to the fact that our earlier investors paid substantially less than the initial public offering price when they purchased their shares of our common stock. You will experience additional dilution upon exercise of warrants, upon exercise of options to purchase common stock under our equity incentive plans, if we issue restricted stock to our employees under our equity incentive plans or if we otherwise issue additional shares of our common stock. In addition, if the underwriters exercise their over-allotment option to purchase additional shares from us, investors in this offering will experience additional dilution. For a further description of the dilution that you will experience immediately after this offering, see "Dilution."
Delaware law and provisions in our amended and restated certificate of incorporation and bylaws could make a merger, tender offer or proxy contest difficult, thereby depressing the trading price of shares of our common stock.
We are a Delaware corporation and the anti-takeover provisions of the Delaware General Corporation Law may discourage, delay or prevent a change of control by prohibiting us from
40
engaging in a business combination with an interested stockholder for a period of three years after the person becomes an interested stockholder, even if a change of control would be beneficial to our existing stockholders. In addition, our restated certificate of incorporation and restated bylaws that will become effective immediately following the completion of this offering will contain provisions that may make the acquisition of our company more difficult without the approval of our Board of Directors, including the following:
- •
- our Board of Directors will continue to be classified into three classes of directors with staggered
three-year terms;
- •
- only our chairman of the board, our chief executive officer, our president or a majority of our Board of Directors will be
authorized to call a special meeting of stockholders;
- •
- our stockholders will only be able to take action at a meeting of stockholders and not by written consent;
- •
- vacancies on our Board of Directors will be able to be filled only by our Board of Directors and not by stockholders;
- •
- directors may be removed from office only for cause;
- •
- our restated certificate of incorporation will authorize undesignated preferred stock, the terms of which may be
established, and shares of which may be issued, without stockholder approval;
- •
- advance notice procedures will apply for stockholders to nominate candidates for election as directors or to bring matters
before an annual meeting of stockholders; and
- •
- if two-thirds of our Board of Directors approves the amendment of our certificate of incorporation and bylaws, or any provisions thereof, then such amendment need only be approved by stockholders holding a majority of our outstanding shares of common stock entitled to vote, otherwise, such amendment must be approved by stockholders holding two-thirds of our outstanding shares of common stock entitled to vote.
For information regarding these and other provisions, see "Description of capital stock."
41
Special note regarding forward-looking statements
and industry data
This prospectus includes forward-looking statements. All statements contained in this prospectus other than statements of historical fact, including statements regarding our future results of operations and financial position, our business strategy and plans and our objectives for future operations, are forward-looking statements. The words "believe," "may," "will," "estimate," "continue," "anticipate," "intend" and "expect" and similar expressions are intended to identify forward-looking statements. We have based these forward-looking statements largely on our current expectations and projections about future events and financial trends that we believe may affect our financial condition, results of operations, business strategy, short-term and long-term business operations and objectives, and financial needs. These forward-looking statements are subject to a number of risks, uncertainties and assumptions, including those described in "Risk factors." In light of these risks, uncertainties and assumptions, the future events and trends discussed in this prospectus may not occur and actual results could differ materially and adversely from those anticipated or implied in the forward-looking statements.
Although we believe that the expectations reflected in the forward-looking statements are reasonable, we cannot guarantee future results, levels of activity, performance or achievements. We are under no duty to update any of these forward-looking statements after the date of this prospectus or to conform these statements to actual results or revised expectations.
This prospectus also contains estimates and other data concerning our industry, including market size and growth rates of the markets in which we participate, that are based on industry publications, surveys and forecasts, including those generated by the International Data Corporation, The Nilson Report and the Economist Intelligence Unit. This information involves a number of assumptions and limitations, and you are cautioned not to give undue weight to this information. Although we believe the information in these industry publications, surveys and forecasts is reliable, any projections, assumptions and estimates, including market size and growth rates of the markets in which we participate, is necessarily subject to a high degree of uncertainty and risk due to a variety of factors, including those described in "Risk factors" and elsewhere in this prospectus. These and other factors could cause results to differ materially from those expressed in the estimates made by independent parties and by us.
42
Use of proceeds
We estimate that our net proceeds from the sale of the shares of common stock that we are offering will be approximately $ million, or $ million if the underwriters' over-allotment option is exercised in full, assuming an initial public offering price of $ per share (which represents the midpoint of the estimated price range set forth on the cover page of this prospectus), after deducting estimated underwriting discounts and commissions and estimated offering expenses payable by us. A $1.00 increase (decrease) in the assumed initial public offering price of $ per share would increase (decrease) the net proceeds to us from this offering by $ million, assuming the number of shares offered by us, as set forth on the cover page of this prospectus, remains the same, after deducting estimated underwriting discounts and commissions and estimated offering expenses payable by us. We will not receive any proceeds from the sale of shares of common stock by the selling stockholders.
The principal purposes of this offering are to obtain additional capital, create a more liquid public market for our common stock in the United States, facilitate our future access to the U.S. public equity markets, increase awareness of our company among potential customers and improve our competitive position. We plan to use the net proceeds of this offering for general corporate purposes, including working capital. Additionally, we may choose to expand our current business through acquisitions of or investments in other businesses, products or technologies, using cash or shares of our common stock. However, we have no commitments with respect to any such acquisitions or investments at this time.
Pending use of proceeds from this offering, we intend to invest the proceeds in short-term, interest-bearing, investment-grade securities. Our management will have broad discretion in the application of the net proceeds from this offering to us, and investors will be relying on the judgment of our management regarding the application of the proceeds.
Dividend policy
We have never declared or paid cash dividends on our capital stock. We currently intend to retain any future earnings and do not expect to declare or pay any dividends in the foreseeable future. Any further determination to pay dividends on our capital stock will be at the discretion of our Board of Directors and will depend on our financial condition, results of operations, capital requirements and other factors that our Board of Directors considers relevant.
43
The following table sets forth our cash and cash equivalents and capitalization as of September 30, 2011 on:
- •
- an actual basis;
- •
- a pro forma basis to give effect to (1) the automatic conversion of all outstanding shares of our convertible
preferred stock into 6,851,144 shares of common stock effective immediately prior to the completion of this offering, and (2) the effectiveness upon the completion of this offering of our
restated certificate of incorporation; and
- •
- a pro forma as adjusted basis to reflect the pro forma adjustments and give effect to the issuance and sale by us of shares of common stock in this offering, and the receipt of the net proceeds from our sale of these shares at an assumed initial public offering price of $ per share, which represents the midpoint of the estimated price range set forth on the cover page of this prospectus, after deducting estimated underwriting discounts and commissions and estimated offering expenses payable by us.
You should read this table in conjunction with the sections titled "Selected consolidated financial data" and "Management's discussion and analysis of financial condition and results of operations" and our consolidated financial statements and related notes included elsewhere in this prospectus.
| |
As of September 30, 2011 | ||||||||||||
|---|---|---|---|---|---|---|---|---|---|---|---|---|---|
| (Unaudited) |
Actual |
Pro forma |
Pro forma as adjusted(1) |
||||||||||
Cash and cash equivalents |
$ | 6,012,498 | $ | 6,012,498 | $ | ||||||||
Long-term portion of capital leases |
$ | 234,600 | $ | 234,600 | |||||||||
Stockholders' equity: |
|||||||||||||
Convertible preferred stock, par value $0.01, 4,000,000 authorized and 2,243,750 shares issued and outstanding (actual); 10,000,000 shares authorized and no shares issued or outstanding (pro forma and pro forma as adjusted) |
22,438 | — | — | ||||||||||
Common stock, par value $0.01, 80,000,000 shares authorized and 51,714,051 shares issued and outstanding (actual); 250,000,000 shares authorized and 58,565,195 shares issued and outstanding (pro forma); and 250,000,000 shares authorized and shares issued and outstanding (pro forma as adjusted) |
517,140 | 585,651 | |||||||||||
Additional paid-in capital |
93,926,548 | 93,880,475 | |||||||||||
Warrants |
1,622,651 | 1,622,651 | |||||||||||
Accumulated other comprehensive loss |
(44,255 | ) | (44,255 | ) | |||||||||
Accumulated deficit |
(79,245,357 | ) | (79,245,357 | ) | |||||||||
Total stockholders' equity |
16,799,165 | 16,799,165 | |||||||||||
Total capitalization |
$ | 17,033,765 | $ | 17,033,765 | $ | ||||||||
|
|||||||||||||
|
|||||||||||||
44
(1) A $1.00 increase (decrease) in the assumed initial public offering of $ per share would increase (decrease) each of cash and cash equivalents, additional paid-in capital, total stockholders' equity and total capitalization by $ million, assuming that the number of shares offered by us, as set forth on the cover page of this prospectus, remains the same, and after deducting the estimated underwriting discounts and commissions and estimated offering expenses payable by us. The pro forma information discussed above is illustrative only and following the completion of this offering will be adjusted based on the actual public offering price and other terms of this offering determined at pricing. If the underwriters' option to purchase additional shares to cover over allotments is exercised in full, the pro forma as adjusted amount of each of cash and cash equivalents, additional paid-in capital, total stockholders' equity and total capitalization would increase by $ million, after deducting estimated underwriting discounts and commissions and estimated offering expenses payable by us, and we would have shares of our common stock issued and outstanding, pro forma as adjusted.
The table above excludes the following shares:
- •
- 7,844,794 shares of common stock issuable upon the exercise of options outstanding as of September 30, 2011, with a
weighted-average exercise price of approximately $2.27 per share;
- •
- 741,576 shares of common stock issuable upon the exercise of warrants outstanding as of September 30, 2011, with a
weighted-average exercise price of approximately $2.25 per share, which warrants do not do not expire upon the completion of this offering;
- •
- 1,381,717 shares of common stock issuable upon the exercise of a warrant outstanding as of September 30, 2011, with
an exercise price of $1.31 per share, which will be automatically net exercised upon the completion of this offering, if not exercised before then;
- •
- 5,000,000 shares of common stock reserved for future issuance under our 2012 Equity Incentive Plan, which will become
effective upon the completion of this offering; and
- •
- 800,000 shares of common stock reserved for future issuance under our 2012 Employee Stock Purchase Plan, which will become effective upon the completion of this offering.
45
Dilution
If you invest in our common stock, your interest will be diluted to the extent of the difference between the initial public offering price per share of our common stock and the pro forma as adjusted net tangible book value per share of our common stock immediately after this offering.
Our pro forma net tangible book value as of September 30, 2011 was $11.0 million, or $0.19 per share of common stock. Our pro forma net tangible book value per share represents the amount of our total tangible assets reduced by the amount of our total liabilities and divided by the total number of shares of our common stock outstanding as of September 30, 2011, after giving effect to the automatic conversion of all outstanding shares of our convertible preferred stock into 6,851,144 shares of common stock effective upon the completion of this offering.
After giving effect to our sale in this offering of shares of common stock at an assumed initial public offering price of $ per share (which represents the midpoint of the estimated price range set forth on the cover page of this prospectus), after deducting estimated underwriting discounts and commissions and estimated offering expenses payable by us, our pro forma net tangible book value as of September 30, 2011 would have been approximately $ million, or $ per share of common stock. This represents an immediate increase in pro forma net tangible book value of $ per share to our existing stockholders and an immediate dilution of $ per share to investors purchasing shares in this offering. The following table illustrates this per share dilution:
Assumed initial offering price per share |
$ | |||||||
Pro forma net tangible book value per share as of September 30, 2011 |
$ | 0.19 | ||||||
Increase in pro forma net tangible book value per share attributable to investors purchasing shares in this offering |
||||||||
Pro forma as adjusted net tangible book value per share after this offering |
||||||||
Dilution in pro forma net tangible book value per share to investors in this offering |
$ | |||||||
A $1.00 increase (decrease) in the assumed initial public offering of $ per share would increase (decrease) our pro forma as adjusted net tangible book value per share after this offering by $ ($ ), assuming that the number of shares offered by us, as set forth on the cover page of this prospectus, remains the same, and after deducting the estimated underwriting discounts and commissions and estimated offering expenses payable by us.
If the underwriters exercise their over-allotment option in full, the pro forma net tangible book value per share after giving effect to this offering would be approximately $ per share, and the dilution in pro forma net tangible book value per share to investors in this offering would be approximately $ per share.
The following table summarizes, as of September 30, 2011, the differences between the number of shares of common stock purchased from us, after giving effect to the conversion of our convertible preferred stock into common stock, the total cash consideration paid and the average price per share paid by our existing stockholders and by our new investors purchasing
46
shares in this offering at the assumed initial public offering price of $ per share (which represents the midpoint of the estimated price range set forth on the cover page of this prospectus), before deducting estimated underwriting discounts and commissions and estimated offering expenses payable by us:
| |
Shares purchased | Total consideration | |
|||||||||||||
|---|---|---|---|---|---|---|---|---|---|---|---|---|---|---|---|---|
| |
Average price per share |
|||||||||||||||
| |
Number |
Percent |
Amount |
Percent |
||||||||||||
Existing stockholders |
% | $ | % | $ | ||||||||||||
New investors |
||||||||||||||||
Totals |
100 | % | $ | 100 | % | |||||||||||
|
||||||||||||||||
A $1.00 increase (decrease) in the assumed initial public offering price of $ per share would increase (decrease) total consideration paid by new investors by $ million, assuming that the number of shares offered by us, as set forth on the cover page of this prospectus, remains the same, and after deducting estimated underwriting discounts and commissions and estimated offering expenses payable by us.
If the underwriters exercise their over-allotment option in full, our existing stockholders would own % and our new investors would own % of the total number of shares of our common stock outstanding after this offering.
Sales of shares of common stock by the selling stockholders in this offering will reduce the number of shares of common stock held by existing stockholders to , or approximately % of the total shares of common stock outstanding after this offering, and will increase the number of shares held by new investors to , or approximately % of the total shares of common stock outstanding after this offering.
The table and discussion above exclude the following shares:
- •
- 7,844,794 shares of common stock issuable upon the exercise of options outstanding as of September 30, 2011, with a
weighted-average exercise price of approximately $2.27 per share;
- •
- 741,576 shares of common stock issuable upon the exercise of warrants outstanding as of September 30, 2011,
with a weighted-average exercise price of approximately $2.25 per share, which warrants do not do not expire upon the completion of this offering;
- •
- 1,381,717 shares of common stock issuable upon the exercise of a warrant outstanding as of September 30, 2011, with
an exercise price of $1.31 per share, which will be automatically net exercised upon the completion of this offering, if not exercised before then;
- •
- 5,000,000 shares of common stock reserved for future issuance under our 2012 Equity Incentive Plan, which will become
effective upon the completion of this offering; and
- •
- 800,000 shares of common stock reserved for future issuance under our 2012 Employee Stock Purchase Plan, which will become effective upon the completion of this offering.
47
Selected consolidated financial data
You should read the following selected historical consolidated financial data in conjunction with "Management's discussion and analysis of financial condition and results of operations" and the consolidated financial statements, related notes and other financial information appearing elsewhere in this prospectus. The selected consolidated financial data in this section is not intended to replace the consolidated financial statements and is qualified in its entirety by the consolidated financial statements and related notes included in this prospectus.
The consolidated statements of operations data for the years ended December 31, 2008, 2009 and 2010 and the consolidated balance sheet data as of December 31, 2009 and 2010 are derived from our audited consolidated financial statements included in this prospectus. The consolidated statements of operations data for the years ended December 31, 2006 and 2007 and the consolidated balance sheet data as of December 31, 2006, 2007 and 2008 are derived from our audited consolidated statements not included in this prospectus. The unaudited consolidated statements of operations data for the nine months ended September 30, 2010 and 2011, and the unaudited consolidated balance sheet data as of September 30, 2011, are derived from our unaudited financial statements that are included elsewhere in the prospectus. We have included, in our opinion, all adjustments, consisting only of normal recurring adjustments, which we consider necessary for a fair presentation of the financial information set forth in those statements. Our historical results are not necessarily indicative of the results to be expected in the future, and our interim results are not necessarily indicative of the results to be expected for the full year.
Certain adjustments and reclassifications have been made to the financial statements for the five years ended December 31, 2010 and the nine months ended September 30, 2010. For the years ended December 31, 2006 and 2007, the multi-currency processing services revenue was previously presented gross of amounts related to certain third party revenue share arrangements. These periods have been corrected to show the transaction fee that we earn for our multi-currency processing services. The effect of the correction resulted in a reduction of previously reported revenues and corresponding reductions in cost of revenue in those periods. For 2006 and 2007, the reductions in revenue and the corresponding reductions in cost of revenue were $2.6 million and $9.4 million, respectively. Please see "Management's discussion and analysis of financial condition and results of operations—Critical accounting policies and estimates—Revenue recognition" for further information regarding our accounting policy on revenue recognition. Please refer to the immaterial restatement disclosure located in Note 2 to the consolidated financial statements for further information regarding the adjustments made to the three years ended December 31, 2010.
48
| |
Year ended December 31, | Nine months ended September 30, |
|||||||||||||||||||||||
|---|---|---|---|---|---|---|---|---|---|---|---|---|---|---|---|---|---|---|---|---|---|---|---|---|---|
| |
2006 |
2007 |
2008 |
2009 |
2010 |
2010 |
2011 |
||||||||||||||||||
Consolidated statements of operations data: |
|||||||||||||||||||||||||
Revenue: |
|||||||||||||||||||||||||
Net revenue |
$ | 2,856,208 | $ | 8,859,349 | $ | 21,185,878 | $ | 26,319,319 | $ | 30,553,164 | $ | 21,026,680 | $ | 29,527,135 | |||||||||||
Operating expenses: |
|||||||||||||||||||||||||
Cost of revenue: |
|||||||||||||||||||||||||
Payment processing service fees |
831,457 | 2,367,447 | 9,808,434 | 10,175,430 | 10,051,640 | 7,423,046 | 8,273,579 | ||||||||||||||||||
Processing and service costs(1) |
4,702,893 | 6,581,177 | 6,434,693 | 6,282,743 | 6,980,981 | 5,175,096 | 6,758,294 | ||||||||||||||||||
Software licenses impairment |
— | — | — | — | 1,108,514 | — | — | ||||||||||||||||||
Total cost of revenue |
5,534,350 | 8,948,624 | 16,243,127 | 16,458,173 | 18,141,135 | 12,598,142 | 15,031,873 | ||||||||||||||||||
Selling general and administrative expenses(1) |
8,672,434 | 12,539,874 | 15,365,254 | 12,822,449 | 14,304,448 | 10,354,051 | 13,580,381 | ||||||||||||||||||
Goodwill impairment |
— | — | 129,887 | — | — | — | — | ||||||||||||||||||
Total operating expenses |
14,206,784 | 21,488,498 | 31,738,268 | 29,280,622 | 32,445,583 | 22,952,193 | 28,612,254 | ||||||||||||||||||
(Loss) income from operations |
(11,350,576 | ) | (12,629,149 | ) | (10,552,390 | ) | (2,961,303 | ) | (1,892,419 | ) | (1,925,513 | ) | 914,881 | ||||||||||||
Other (expense) income: |
|||||||||||||||||||||||||
Interest expense |
(388,699 | ) | (902,227 | ) | (1,015,633 | ) | (1,236,504 | ) | (1,169,578 | ) | (906,286 | ) | (307,796 | ) | |||||||||||
Interest income |
142,373 | 156,800 | 140,191 | 18,702 | 429 | 142 | 804 | ||||||||||||||||||
Other income |
— | — | — | — | — | — | 98,682 | ||||||||||||||||||
Total other expense, net |
(246,326 | ) | (745,427 | ) | (875,442 | ) | (1,217,802 | ) | (1,169,149 | ) | (906,144 | ) | (208,310 | ) | |||||||||||
(Loss) income from continuing operations before provision for income taxes |
(11,596,902 | ) | (13,374,576 | ) | (11,427,832 | ) | (4,179,105 | ) | (3,061,568 | ) | (2,831,657 | ) | 706,571 | ||||||||||||
Provision for income taxes |
(2,453 | ) | (3,618 | ) | (1,681 | ) | (4,095 | ) | (3,219 | ) | — | (106,260 | ) | ||||||||||||
(Loss) income from continuing operations |
(11,599,355 | ) | (13,378,194 | ) | (11,429,513 | ) | (4,183,200 | ) | (3,064,787 | ) | (2,831,657 | ) | 600,311 | ||||||||||||
(Loss) income from discontinued operations, net of taxes |
— | — | 272,847 | — | — | — | — | ||||||||||||||||||
Net (loss) income |
$ | (11,599,355 | ) | $ | (13,378,194 | ) | $ | (11,156,666 | ) | $ | (4,183,200 | ) | $ | (3,064,787 | ) | $ | (2,831,657 | ) | $ | 600,311 | |||||
Basic net (loss) income per share from continuing operations |
$ | (0.63 | ) | $ | (0.59 | ) | $ | (0.43 | ) | $ | (0.12 | ) | $ | (0.08 | ) | $ | (0.07 | ) | $ | 0.01 | |||||
Basic net (loss) income per share from discontinued operations |
$ | — | $ | — | $ | 0.01 | $ | — | $ | — | $ | — | $ | — | |||||||||||
Basic net (loss) income per share applicable to common stockholders |
$ | (0.63 | ) | $ | (0.59 | ) | $ | (0.42 | ) | $ | (0.12 | ) | $ | (0.08 | ) | $ | (0.07 | ) | $ | 0.01 | |||||
Diluted net (loss) income per share applicable to common stockholders |
$ | (0.63 | ) | $ | (0.59 | ) | $ | (0.42 | ) | $ | (0.12 | ) | $ | (0.08 | ) | $ | (0.07 | ) | $ | 0.01 | |||||
Weighted average common stock outstanding (basic) |
18,325,823 | 22,836,166 | 26,720,171 | 33,725,727 | 40,431,073 | 39,316,392 | 48,834,130 | ||||||||||||||||||
Weighted average common stock outstanding (diluted) |
18,325,823 | 22,836,166 | 26,720,171 | 33,725,727 | 40,431,073 | 39,316,392 | 51,593,111 | ||||||||||||||||||
Pro forma basic net (loss) income per share applicable to common stockholders(2) |
$ | (0.06 | ) | $ | 0.01 | ||||||||||||||||||||
Pro forma diluted net (loss) income per share applicable to common stockholders(2) |
$ | (0.06 | ) | $ | 0.01 | ||||||||||||||||||||
Pro forma weighted average common stock outstanding (basic)(2) |
51,756,993 | 55,685,274 | |||||||||||||||||||||||
Pro forma weighted average common stock outstanding (basic)(2) |
51,756,993 | 58,444,255 | |||||||||||||||||||||||
|
(footnotes on next page) |
||||||||||||||||||||||||
49
| |
Year ended December 31, | Nine months ended September 30, |
||||||||||||||||||||
|---|---|---|---|---|---|---|---|---|---|---|---|---|---|---|---|---|---|---|---|---|---|---|
| |
2006 |
2007 |
2008 |
2009 |
2010 |
2010 |
2011 |
|||||||||||||||
Key metrics: |
||||||||||||||||||||||
Consolidated gross billings(3) |
$ | 5,470,018 | $ | 18,216,436 | $ | 35,849,475 | $ | 47,045,268 | $ | 64,653,725 | $ | 43,225,609 | $ | 70,903,471 | ||||||||
Adjusted EBITDA (non-GAAP)(4) |
$ | (9,630,329 | ) | $ | (9,347,301 | ) | $ | (7,412,392 | ) | $ | 278,992 | $ | 1,815,478 | $ | (70,398 | ) | $ | 3,187,182 | ||||
Capitalized expenditures |
$ | 494,560 | $ | 1,546,202 | $ | 1,852,125 | $ | 2,069,497 | $ | 2,350,507 | $ | 1,712,944 | $ | 1,573,772 | ||||||||
Total active merchant locations (at period end)(5)(11) |
7,946 | 10,078 | 16,697 | 13,610 | 25,013 | |||||||||||||||||
Multi-currency processing services key metrics: |
||||||||||||||||||||||
Active merchant locations (at period end)(5)(11) |
4,530 | 6,624 | 12,157 | 9,982 | 15,036 | |||||||||||||||||
Settled transactions processed(6)(11) |
5,177,650 | 6,073,226 | 6,980,010 | 4,750,334 | 7,680,971 | |||||||||||||||||
Gross foreign currency mark-up(7) |
$ | 23,769,206 | $ | 33,322,683 | $ | 52,073,798 | $ | 34,072,645 | $ | 60,662,730 | ||||||||||||
Settled dollar volume processed(8)(11) |
$ | 688,808,842 | $ | 907,901,369 | $ | 1,377,308,710 | $ | 916,061,688 | $ | 1,612,753,388 | ||||||||||||
Average net mark-up percentage on settled dollar volume processed(9)(11) |
1.32 | % | 1.39 | % | 1.30 | % | 1.30 | % | 1.20 | % | ||||||||||||
Payment processing services key metrics: |
||||||||||||||||||||||
Active merchant locations (at period end)(5)(11) |
3,416 | 3,469 | 4,603 | 3,682 | 9,993 | |||||||||||||||||
Payment processing services revenue(10) |
$ | 1,031,188 | $ | 2,493,673 | $ | 12,080,269 | $ | 13,722,585 | $ | 12,579,927 | $ | 9,152,964 | $ | 10,240,741 | ||||||||
(1) Stock-based expense included in the statements of operations data above was as follows:
| |
Year ended December 31, | Nine months ended September 30, |
||||||||||||||||||||
|---|---|---|---|---|---|---|---|---|---|---|---|---|---|---|---|---|---|---|---|---|---|---|
| |
2006 |
2007 |
2008 |
2009 |
2010 |
2010 |
2011 |
|||||||||||||||
Processing and service costs |
$ | 245,350 | $ | 331,978 | $ | 421,405 | $ | 437,919 | $ | 211,582 | $ | 194,293 | $ | 107,503 | ||||||||
Selling general and administrative expenses |
531,411 | 992,220 | 1,385,062 | 1,007,106 | 618,151 | 448,435 | 327,651 | |||||||||||||||
Total stock-based expense |
$ | 776,761 | $ | 1,324,198 | $ | 1,806,467 | $ | 1,445,025 | $ | 829,733 | $ | 642,728 | $ | 435,154 | ||||||||
|
||||||||||||||||||||||
(2) Pro forma net (loss) income per share has been calculated to give effect, even if antidilutive, to (1) the automatic conversion of all outstanding shares of our convertible preferred stock into 6,851,144 shares of common stock effective immediately prior to the completion of this offering, and (2) the effectiveness upon the completion of this offering of our restated certificate of incorporation.
(3) Represents gross foreign currency mark-up (see footnote 7) plus payment processing services revenue (see footnote 10).
(4) We define Adjusted EBITDA as GAAP net (loss) income adjusted to exclude (1) interest expense, (2) interest income, (3) provision (benefit) for income taxes, (4) depreciation and amortization, (5) stock-based expense from options and warrants and (6) certain other items management believes affect the comparability of operating results. Please see "—Adjusted EBITDA" below for more information and for a reconciliation of Adjusted EBITDA to net (loss) income, the most directly comparable financial measure calculated and presented in accordance with GAAP.
(5) We consider a merchant location to be active as of a date if the merchant completed at least one revenue-generating transaction at the location during the 90-day period ending on such date. The total number of active merchant locations exceeds the total number of merchants, as merchants may have multiple locations. As of December 31, 2009 and 2010 and as of September 30, 2010 and 2011, there were 15, 63, 54 and 16 active merchant locations, respectively, that used both our multi-currency processing services and our payment processing services. These amounts are included in multi-currency and payment processing active merchant locations but are not included in total active merchant locations.
(6) Represents settled transactions processed using our multi-currency processing services.
(7) Represents the gross mark-up amount on settled dollar volume processed using our multi-currency processing services. Gross mark-up represents multi-currency processing services net revenue plus amounts paid to acquiring banks and their merchants associated with such multi-currency processing transactions. Management believes this metric is relevant because it provides the reader an indication of the gross mark-up derived from multi-currency transactions processed through our platform during a given period. Refer to our revenue recognition policy in Note 3 and segment disclosure in Note 18 of our consolidated financial statements for information on our net revenue from multi-currency processing services.
(footnotes continue
on next page)
50
(8) Represents the total settled dollar volume processed using our multi-currency processing services.
(9) Represents the average net mark-up percentage earned on settled dollar volume processed using our multi-currency processing services. The average net mark-up percentage on settled dollar volume processed is calculated by taking the reported total multi-currency processing services net revenue ($9.1 million, $12.6 million, and $18.0 million for the years ended December 31, 2008, 2009 and 2010, respectively, and $11.9 million and $19.3 million for the nine months ended September 30, 2010 and 2011, respectively) and dividing by settled dollar volume processed (see footnote 8).
(10) Represents revenue earned and reported on payment processing services.
(11) We started tracking active merchant locations, transactions processed and dollar volume processed beginning in January 2008.
| |
As of December 31, | As of September 30, | |||||||||||||||||
|---|---|---|---|---|---|---|---|---|---|---|---|---|---|---|---|---|---|---|---|
| |
2006 |
2007 |
2008 |
2009 |
2010 |
2011 |
|||||||||||||
Consolidated balance sheet data |
|||||||||||||||||||
Cash and cash equivalents |
$ | 1,860,186 | $ | 2,824,739 | $ | 246,848 | $ | 3,752,423 | $ | 5,182,499 | $ | 6,012,498 | |||||||
Working capital(1) |
502,884 | 8,031,440 | 206,869 | 1,396,446 | 6,908,916 | 7,877,958 | |||||||||||||
Total assets |
6,596,508 | 14,100,064 | 10,987,530 | 16,143,284 | 19,168,991 | 22,422,556 | |||||||||||||
Total liabilities |
6,218,174 | 11,863,408 | 17,763,148 | 17,022,589 | 13,492,281 | 5,623,391 | |||||||||||||
Accumulated deficit |
(48,062,821 | ) | (61,441,015 | ) | (72,597,681 | ) | (76,780,881 | ) | (79,845,668 | ) | (79,245,357 | ) | |||||||
Total stockholders' equity (deficit) |
378,334 | 2,236,656 | (6,775,618 | ) | (879,305 | ) | 5,676,710 | 16,799,165 | |||||||||||
(1) Working capital is defined as current assets less current liabilities.
Adjusted EBITDA
This prospectus includes information about Adjusted EBITDA that is not prepared in accordance with GAAP. Adjusted EBITDA is not based on any standardized methodology prescribed by GAAP and is not necessarily comparable to similar measures presented by other companies. A reconciliation of this non-GAAP measure is included below.
Adjusted EBITDA is a non-GAAP financial measure that represents GAAP net (loss) income adjusted to exclude (1) interest expense, (2) interest income, (3) provision (benefit) for income taxes, (4) depreciation and amortization, (5) stock-based expense from options and warrants and (6) certain other items management believes affect the comparability of operating results.
Management believes that Adjusted EBITDA, when viewed with our results under GAAP and the accompanying reconciliation, provides useful information about our period-over-period growth. Adjusted EBITDA is presented because management believes it provides additional information with respect to the performance of our fundamental business activities and is also frequently used by securities analysts, investors and other interested parties in the evaluation of comparable companies. We also rely on Adjusted EBITDA as a primary measure to review and assess the operating performance of our company and our management team in connection with our executive compensation.
51
The following table sets forth the reconciliation of Adjusted EBITDA to net (loss) income, our most directly comparable financial measure in accordance with GAAP:
| |
Year ended December 31, | Nine months ended September 30, |
||||||||||||||||||||
|---|---|---|---|---|---|---|---|---|---|---|---|---|---|---|---|---|---|---|---|---|---|---|
| |
2006 |
2007 |
2008 |
2009 |
2010 |
2010 |
2011 |
|||||||||||||||
Adjusted EBITDA: |
||||||||||||||||||||||
Net (loss) income |
$ | (11,599,355 | ) | $ | (13,378,194 | ) | $ | (11,156,666 | ) | $ | (4,183,200 | ) | $ | (3,064,787 | ) | $ | (2,831,657 | ) | $ | 600,311 | ||
Interest expense |
388,699 | 902,227 | 1,015,633 | 1,236,504 | 1,169,578 | 906,286 | 307,796 | |||||||||||||||
Interest income |
(142,373 | ) | (156,800 | ) | (140,191 | ) | (18,702 | ) | (429 | ) | (142 | ) | (804 | ) | ||||||||
Provision for income taxes |
2,453 | 3,618 | 1,681 | 4,095 | 3,219 | — | 106,260 | |||||||||||||||
Depreciation and amortization |
943,486 | 1,957,650 | 1,203,644 | 1,537,674 | 1,769,650 | 1,212,387 | 1,837,147 | |||||||||||||||
Stock-based expense |
776,761 | 1,324,198 | 1,806,467 | 1,445,025 | 829,733 | 642,728 | 435,154 | |||||||||||||||
Gain from discontinued operations(1) |
— | — | (272,847 | ) | — | — | — | — | ||||||||||||||
Write off of note receivable(1) |
— | — | — | 257,596 | — | — | — | |||||||||||||||
Goodwill impairment |
— | — | 129,887 | — | — | — | — | |||||||||||||||
Software licenses impairment(2) |
— | — | — | — | 1,108,514 | — | — | |||||||||||||||
Convertible debt prepayment(3) |
— | — | — | — | — | — | 601,318 | |||||||||||||||
Derecognition of note payable(4) |
— | — | — | — | — | — | (700,000 | ) | ||||||||||||||
Adjusted EBITDA (non-GAAP) |
$ | (9,630,329 | ) | $ | (9,347,301 | ) | $ | (7,412,392 | ) | $ | 278,992 | $ | 1,815,478 | $ | (70,398 | ) | $ | 3,187,182 | ||||
|
||||||||||||||||||||||
(1) In November 2008, we sold our interest in a joint venture for consideration of a five-year note receivable in the amount of $0.2 million with an annual interest rate of 7%. For the year ended December 31, 2008, we recorded $0.3 million as income from discontinued operations related to this joint venture. For the year ended December 31, 2009, we determined that the note receivable and accrued interest of $0.3 million was uncollectible and in accordance with SAB Topic 5-Z(5), the entire amount was written off to selling, general and administrative expenses within continuing operations. The debtor subsequently filed for bankruptcy in 2010.
(2) In the fourth quarter of 2010, due to our unsuccessful efforts to sell software licenses previously purchased for resale, we determined that the underlying undiscounted cash flow projections did not support the recorded value of the asset and wrote off the entire asset balance of $1.1 million to cost of revenue for the year ended December 31, 2010.
(3) In April 2011, the convertible debt holders converted the outstanding principal amount of $9.0 million under convertible notes issued in 2007 and 2008 into an aggregate of 4,049,776 shares of common stock. In addition, we issued 127,318 shares of common stock valued at $0.3 million in lieu of cash payments for accrued interest and 297,682 shares of common stock valued at $0.6 million as a prepayment fee negotiated at the time of conversion. The shares issued for the accrued interest and the prepayment fee were valued at the average closing price of our common stock on AIM under the symbol "PPTR" during the period immediately prior to the conversion.
(4) In 2003, we entered into an agreement with FHMS and FTB and recorded a liability. Due to a breach of the contractual terms by FHMS and FTB, we did not believe we were liable to repay these amounts. As of March 31, 2011, the statute of limitations had expired on $0.66 million of the $0.7 million balance and as of September 30, 2011, the statute of limitations had expired on the remaining $40,000. For the nine months ended September 30, 2011, we recorded other income due to the derecognition of the note payable in the amount of $0.7 million.
52
Management's discussion and analysis
of financial condition and results of operations
You should read the following discussion and analysis in conjunction with the information set forth under "Selected consolidated financial data" and our consolidated financial statements and related notes included elsewhere in this prospectus. Certain adjustments and reclassifications have been made to the financial statements for the three years ended December 31, 2010 and the nine months ended September 30, 2011. Please see Note 2 (Immaterial restatement) to our consolidated financial statements included elsewhere in this prospectus for further information regarding the adjustments and reclassifications made to the financial statements for the three years ended December 31, 2010 and the nine months ended September 30, 2011. The statements in this discussion regarding our expectations of our future performance, liquidity and capital resources, and other non-historical statements in this discussion, are forward-looking statements. These forward-looking statements are subject to numerous risks and uncertainties, including, but not limited to, the risks and uncertainties described under "Risk factors" and elsewhere in this prospectus. Our actual results may differ materially from those contained in or implied by any forward-looking statements.
Business overview
Planet Payment is a leading provider of international payment processing and multi-currency processing services. We provide our services to over 25,000 active merchant locations in 16 countries and territories across the Asia Pacific region, North America, the Middle East, Africa and Europe, primarily through our acquiring bank and processor customers, as well as through our own direct sales force. Our point-of-sale and e-commerce services help merchants sell more goods and services to consumers and enable our acquiring customers to process and reconcile payment transactions in multiple currencies, geographies and channels.
In 2010, we produced 51% of our revenue internationally and 49% in the United States, and in the first nine months of 2011, we produced 57% of our revenue internationally and 43% in the United States through a recurring revenue model that generates fees every time a purchase is made across our network. We manage our business through two operating segments: our multi-currency processing services and our payment processing services. Our multi-currency processing services, which include Pay In Your Currency and Multi-Currency Pricing, enable merchants to offer customized pricing in multiple currencies. Our payment processing services comprise end-to-end authorization, capture, clearing and settlement services to our customers along with localized language support and online access to advanced reconciliation, reporting and analytics services. Our multi-currency processing services represented approximately 65% of our revenue for the nine months ended September 30, 2011 and our payment processing services represented approximately 35% of our revenue.
For the years 2008, 2009, and 2010 and the nine months ended September 30, 2011, our net revenue was $21.2 million, $26.3 million, $30.6 million and $29.5 million, respectively. In the same periods, our net (loss) income was $(11.2) million, $(4.2) million, $(3.1) million and $0.6 million, respectively, and our Adjusted EBITDA was $(7.4) million, $0.3 million, $1.8 million and $3.2 million, respectively. Adjusted EBITDA is a financial measure not calculated in accordance with GAAP. For information on how we calculate Adjusted EBITDA, see "—Key metrics—Adjusted EBITDA."
53
Key milestones
In 1999, we founded the company with a vision of providing payment processing services to international merchants. Key milestones in our development include:
- •
- In 1999 and 2000, we launched our e-commerce payment processing services in New Zealand and received our first
institutional funding. Also in 2000, we signed our first contract for our Pay In Your Currency service in the United States.
- •
- In 2002, we implemented an initial trial for our multi-currency processing service in the United States.
- •
- In 2003 and 2004, we signed contracts with a number of acquiring banks and processors in the United States, including
Vital Processing Services LLC (now TSYS Acquiring Solutions) and Fifth Third Bank Corp.
- •
- In 2005, we launched our Pay In Your Currency service in the Asia Pacific region with Standard Chartered Bank in Hong
Kong.
- •
- In 2006 and 2007, we signed contracts with a number of acquiring banks and processors in China, Hong Kong, Macau, Malaysia
and Taiwan, including Hang Seng Bank and Global Payments Asia Pacific. Also, in 2006, our shares of common stock were admitted to trade on AIM and we acquired the assets of Transworld Payment
Solutions, which enabled us to become a full-service third-party processor.
- •
- In 2008, we acquired the iPAY business and related assets and our common stock was admitted to trading on the OTCQX. Also
in 2008, we expanded our Pay In Your Currency service into India.
- •
- In 2009, we expanded our full-service processing services into Canada and our Pay In Your Currency service
into the Philippines.
- •
- In 2010, we expanded our Pay In Your Currency service to Brunei, the Maldives, Singapore, South Africa, Sri Lanka, and the
United Arab Emirates. Also in 2010, we entered into agreements to provide multi-currency processing services to Global Payments, Inc. for the United States and Canada and renewed or extended
our agreements with Vantiv, LLC (formerly known as Fifth Third Processing Solutions) and TSYS Acquiring Solutions.
- •
- In 2011, we entered into a contract with Vantiv to provide our Pay In Your Currency service at ATMs. Also in 2011, we launched the MICROS Payment Gateway to facilitate the integration of MICROS property management systems in hotels and restaurants to our platform, and the first hotels using the new gateway went live in Hong Kong before the end of the year. Additionally, we integrated our iPAY gateway with VendorShop's Facebook shopping cart application creating a social commerce solution that allows Facebook merchants to accept credit cards through any participating acquiring bank integrated into our platform in 2011.
Key trends
Our financial results have been and we believe will continue to be impacted by trends in the international payment processing industry, including the global shift toward electronic-based
54
methods of payments and away from paper-based methods of payment, the increasing levels of international travel and commerce and the rapid adoption of e-commerce on a global scale. Our results are impacted by the changes in levels of international spending using electronic methods, and as a result, negative trends in the global economy may negatively impact the growth in total transaction volume processed using our platform. Since 2008, the United States and other global economies have been undergoing a period of economic uncertainty and stock markets are experiencing high levels of volatility, and it is difficult to predict how long this uncertainty and volatility will continue.
Despite these negative macro-economic trends, we plan to continue to grow our business by increasing the use of our services by the merchants of our existing and future acquiring bank and processor customers. If we are successful in increasing our share of this currently addressable market, as well as by adding new acquiring bank and processor customers and expanding into new geographies and business sectors, we would expect our revenue to continue to grow. In addition, based on the positive trends in the international payment processing industry noted above, we anticipate that as and when more payments are made using electronic methods, such as those that we offer, our revenue would also increase.
We expect that our payment processing service fees, which primarily represent fees, interchange and assessments, will continue to rise as our payment processing services revenue increases. We also expect that our processing and service costs, which include expenses related to running our platform infrastructure, and our selling, general and administrative expense will increase, but at a rate of increase that is substantially less than the growth of our revenue due to the leverage in our business model.
Key metrics
Our management relies on certain performance indicators to manage and assess our business. The key performance indicators set forth below help us evaluate growth trends, establish budgets, measure the effectiveness of our sales and marketing efforts and assess operational efficiencies. We believe that improvements in these metrics will result in improvements in our financial performance over time. We monitor our non-GAAP financial measures and other business statistics as a measure of operating performance in addition to net (loss) income and the other measures included in our consolidated financial statements.
55
The following is a table consisting of non-GAAP financial measures and certain other business statistics that management monitors:
| |
Year ended December 31, | Nine months ended September 30, |
||||||||||||||
|---|---|---|---|---|---|---|---|---|---|---|---|---|---|---|---|---|
| |
2008 |
2009 |
2010 |
2010 |
2011 |
|||||||||||
KEY METRICS: |
||||||||||||||||
Consolidated gross billings(1) |
$ | 35,849,475 | $ | 47,045,268 | $ | 64,653,725 | $ | 43,225,609 | $ | 70,903,471 | ||||||
Adjusted EBITDA (non-GAAP)(2) |
$ | (7,412,392 | ) | $ | 278,992 | $ | 1,815,478 | $ | (70,398 | ) | $ | 3,187,182 | ||||
Capitalized expenditures |
$ | 1,852,125 | $ | 2,069,497 | $ | 2,350,507 | $ | 1,712,944 | $ | 1,573,772 | ||||||
Total active merchant locations (at period end)(3) |
7,946 | 10,078 | 16,697 | 13,610 | 25,013 | |||||||||||
Multi-currency processing services key metrics: |
||||||||||||||||
Active merchant locations (at period end)(3) |
4,530 | 6,624 | 12,157 | 9,982 | 15,036 | |||||||||||
Settled transactions processed(4) |
5,177,650 | 6,073,226 | 6,980,010 | 4,750,334 | 7,680,971 | |||||||||||
Gross foreign currency mark-up(5) |
$ | 23,769,206 | $ | 33,322,683 | $ | 52,073,798 | $ | 34,072,645 | $ | 60,662,730 | ||||||
Settled dollar volume processed(6) |
$ | 688,808,842 | $ | 907,901,369 | $ | 1,377,308,710 | $ | 916,061,688 | $ | 1,612,753,388 | ||||||
Average net mark-up percentage on settled dollar volume processed(7) |
1.32 | % | 1.39 | % | 1.30 | % | 1.30 | % | 1.20 | % | ||||||
Payment processing services key metrics: |
||||||||||||||||
Active merchant locations (at period end)(3) |
3,416 | 3,469 | 4,603 | 3,682 | 9,993 | |||||||||||
Payment processing services revenue(8). |
$ | 12,080,269 | $ | 13,722,585 | $ | 12,579,927 | $ | 9,152,964 | $ | 10,240,741 | ||||||
(1) Represents gross foreign currency mark-up (see footnote 5) plus payment processing services revenue (see footnote 8).
(2) We define Adjusted EBITDA as GAAP net (loss) income adjusted to exclude (1) interest expense, (2) interest income, (3) provision (benefit) for income taxes, (4) depreciation and amortization, (5) stock-based expense from options and warrants and (6) certain other items management believes affect the comparability of operating results. Please see "—Adjusted EBITDA" below for more information and for a reconciliation of Adjusted EBITDA to net (loss) income, the most directly comparable financial measure calculated and presented in accordance with GAAP.
(3) We consider a merchant location to be active as of a date if the merchant completed at least one revenue-generating transaction at the location during the 90-day period ending on such date. The total number of active merchant locations exceeds the total number of merchants, as merchants may have multiple locations. As of December 31, 2009 and 2010 and as of September 30, 2010 and 2011, there were 15, 63, 54 and 16 active merchant locations, respectively, that used both our multi-currency processing services and our payment processing services. These amounts are included in multi-currency and payment processing active merchant locations but are not included in total active merchant locations.
(4) Represents settled transactions processed using our multi-currency processing services.
(5) Represents the gross mark-up amount on settled dollar volume processed using our multi-currency processing services. Gross mark-up represents multi-currency processing services net revenue plus amounts paid to acquiring banks and their merchants associated with such multi-currency processing transactions. Management believes this metric is relevant because it provides the reader an indication of the gross mark-up derived from multi-currency transactions processed through our platform during a given period. Refer to our revenue recognition policy in Note 3 and segment disclosure in Note 18 of our consolidated financial statements for information on our net revenue from multi-currency processing services.
(6) Represents the total settled dollar volume processed using our multi-currency processing services.
(footnotes continue
on next page)
56
(7) Represents the average net mark-up percentage earned on settled dollar volume processed using our multi-currency processing services. The average net mark-up percentage on settled dollar volume processed is calculated by taking the reported total multi-currency processing services net revenue ($9.1 million, $12.6 million, and $18.0 million for the years ended December 31, 2008, 2009 and 2010, respectively, and $11.9 million and $19.3 million for the nine months ended September 30, 2010 and 2011, respectively) and dividing by settled dollar volume processed (see footnote 6).
(8) Represents revenue earned and reported on payment processing services.
Adjusted EBITDA
This prospectus includes information about Adjusted EBITDA that is not prepared in accordance with GAAP. Adjusted EBITDA is not based on any standardized methodology prescribed by GAAP and is not necessarily comparable to similar measures presented by other companies. A reconciliation of this non-GAAP measure is included below.
Adjusted EBITDA is a non-GAAP financial measure that represents GAAP net (loss) income adjusted to exclude (1) interest expense, (2) interest income, (3) provision (benefit) for income taxes, (4) depreciation and amortization, (5) stock-based expense from options and warrants and (6) certain other items management believes affect the comparability of operating results.
Management believes that Adjusted EBITDA, when viewed with our results under GAAP and the accompanying reconciliations, provides useful information about our period-over-period growth. Adjusted EBITDA is presented because management believes it provides additional information with respect to the performance of our fundamental business activities and is also frequently used by securities analysts, investors and other interested parties in the evaluation of comparable companies. We also rely on Adjusted EBITDA as a primary measure to review and assess the operating performance of our company and our management team in connection with our executive compensation.
Adjusted EBITDA has limitations as an analytical tool, and you should not consider it in isolation from, or as a substitute for, analysis of our results as reported under GAAP. Some of these limitations are:
- •
- Adjusted EBITDA does not reflect our cash expenditures or future requirements for capital expenditures or contractual
commitments;
- •
- Adjusted EBITDA does not reflect changes in, or cash requirements for, our working capital needs;
- •
- although depreciation and amortization are non-cash charges, the assets being depreciated and amortized will
often have to be replaced in the future, and Adjusted EBITDA does not reflect any cash requirements for such replacements;
- •
- non-cash compensation is and will remain a key element of our long-term incentive compensation for
our employees, although we exclude it from Adjusted EBITDA when evaluating our ongoing performance for a particular period; and
- •
- Adjusted EBITDA does not include the impact of certain charges or gains resulting from matters we consider not to be indicative of our ongoing operations.
Because of these limitations, Adjusted EBITDA should not be considered as a measure of discretionary cash available to us to invest in the growth of our business. We compensate for these limitations by relying primarily on our GAAP results and using Adjusted EBITDA only as a supplement to our GAAP results.
57
The following table sets forth the reconciliation of Adjusted EBITDA to net (loss) income, our most directly comparable financial measure in accordance with GAAP:
| |
Year ended December 31, | Nine months ended September 30, |
||||||||||||||
|---|---|---|---|---|---|---|---|---|---|---|---|---|---|---|---|---|
| |
2008 |
2009 |
2010 |
2010 |
2011 |
|||||||||||
ADJUSTED EBITDA: |
||||||||||||||||
Net (loss) income |
$ | (11,156,666 | ) | $ | (4,183,200 | ) | $ | (3,064,787 | ) | $ | (2,831,657 | ) | $ | 600,311 | ||
Interest expense |
1,015,633 | 1,236,504 | 1,169,578 | 906,286 | 307,796 | |||||||||||
Interest income |
(140,191 | ) | (18,702 | ) | (429 | ) | (142 | ) | (804 | ) | ||||||
Provision for income taxes |
1,681 | 4,095 | 3,219 | — | 106,260 | |||||||||||
Depreciation and amortization |
1,203,644 | 1,537,674 | 1,769,650 | 1,212,387 | 1,837,147 | |||||||||||
Stock-based expense |
1,806,467 | 1,445,025 | 829,733 | 642,728 | 435,154 | |||||||||||
Gain from discontinued operations(1) |
(272,847 | ) | — | — | — | — | ||||||||||
Write off of note receivable(1) |
— | 257,596 | — | — | — | |||||||||||
Goodwill impairment |
129,887 | — | — | — | — | |||||||||||
Software licenses impairment(2) |
— | — | 1,108,514 | — | — | |||||||||||
Covertible debt prepayment(3) |
— | — | — | — | 601,318 | |||||||||||
Derecognition of note payable(4) |
— | — | — | — | (700,000 | ) | ||||||||||
Adjusted EBITDA (non-GAAP) |
$ | (7,412,392 | ) | $ | 278,992 | $ | 1,815,478 | $ | (70,398 | ) | $ | 3,187,182 | ||||
|
||||||||||||||||
(1) In November 2008, we sold our interest in a joint venture for consideration of a five-year note receivable in the amount of $0.2 million with an annual interest rate of 7%. For the year ended December 31, 2008, we recorded $0.3 million as income from discontinued operations related to this joint venture. For the year ended December 31, 2009, we determined that the note receivable and accrued interest of $0.3 million was uncollectible and in accordance with SAB Topic 5-Z(5), the entire amount was written off to selling, general and administrative expenses within continuing operations. The debtor subsequently filed for bankruptcy in 2010.
(2) In the fourth quarter of 2010, due to our unsuccessful efforts to sell software licenses previously purchased for resale, we determined that the underlying undiscounted cash flow projections did not support the recorded value of the asset and wrote off the entire asset balance of $1.1 million to cost of revenue for the year ended December 31, 2010.
(3) In April 2011, the convertible debt holders converted the outstanding principal amount of $9.0 million under convertible notes issued in 2007 and 2008 into an aggregate of 4,049,776 shares of common stock. In addition, we issued 127,318 shares of common stock valued at $0.3 million in lieu of cash payments for accrued interest and 297,682 shares of common stock valued at $0.6 million as a prepayment fee negotiated at the time of conversion. The shares issued for the accrued interest and the prepayment fee were valued at the average closing price of our common stock on AIM under the symbol "PPTR" during the period immediately prior to the conversion.
(4) In 2003, we entered into an agreement with FHMS and FTB and recorded a liability. Due to a breach of the contractual terms by FHMS and FTB, we did not believe we were liable to repay these amounts. As of March 31, 2011, the statute of limitations had expired on $0.66 million of the $0.7 million balance and as of September 30, 2011, the statute of limitations had expired on the remaining $40,000. For the nine months ended September 30, 2011, we recorded other income due to the derecognition of the note payable in the amount of $0.7 million.
58
Components of operating results
Sources of revenue
We derive our revenue principally through transaction fees earned under fixed contractual arrangements with customers who use our international payment and multi-currency processing services. We operate the business in two reportable segments:
- •
- Multi-currency processing services revenue. Revenue
derived from foreign currency transaction fees earned on processing and converting a credit or debit card transaction from one currency into another currency. Foreign currency transactions fees earned
under our agreements with our multi-currency processing services customers have traditionally been based on a fixed percentage applied to the net foreign currency margin earned, after deducting any
merchant revenue and other contractual costs.
- •
- Payment processing services revenue. Revenue derived from transaction fees earned on processing services provided in facilitating the sale of goods and services by means of credit and debit cards and other electronic payments.
Geographic and customer concentration
We conduct our business primarily in three geographical regions: Asia Pacific, or APAC, North America, and Central Europe, Middle East and Africa, or CEMEA. The following table provides multi-currency processing services revenue concentration by geographical region. Revenue by region is based upon where the transaction originated. We conduct our payment processing services primarily in North America.
Analysis of revenue by segment and geographical region:
| |
Year ended December 31, | Nine months ended September 30, |
||||||||||||||
|---|---|---|---|---|---|---|---|---|---|---|---|---|---|---|---|---|
| |
2008 |
2009 |
2010 |
2010 |
2011 |
|||||||||||
Revenue: |
||||||||||||||||
APAC |
$ | 6,619,856 | $ | 10,496,935 | $ | 15,198,058 | $ | 10,251,603 | $ | 13,354,312 | ||||||
North America |
2,485,753 | 2,065,284 | 2,647,547 | 1,592,787 | 2,994,155 | |||||||||||
CEMEA |
— | 34,515 | 127,632 | 29,326 | 2,937,927 | |||||||||||
Total multi-currency processing services revenue |
$ | 9,105,609 | $ | 12,596,734 | $ | 17,973,237 | $ | 11,873,716 | $ | 19,286,394 | ||||||
Payment processing services revenue |
12,080,269 | 13,722,585 | 12,579,927 | 9,152,964 | 10,240,741 | |||||||||||
Net revenue |
$ | 21,185,878 | $ | 26,319,319 | $ | 30,553,164 | $ | 21,026,680 | $ | 29,527,135 | ||||||
|
||||||||||||||||
A significant portion of our revenue is derived from agreements with a limited number of customers. Specifically, for the year ended December 31, 2010 and the nine months ended September 30, 2011, subsidiaries of Global Payments, Inc. represented 30% and 29%, respectively, of our revenue, and for the nine months ended September 30, 2011, Network International, LLC represented 10% of our revenue.
59
Operating expenses
Cost of revenue. Cost of revenue primarily consists of two categories: (1) payment processing services fees, which includes payment processing transactions fees such as sponsorship fees, interchange and card association fees and assessments; and (2) processing and service costs, which include expenses related to running our platform infrastructure, including: Internet connectivity, hosting and data storage expenses, amortization expense on acquired intangibles and capitalized software development costs, compensation and related benefits and a portion of general overhead expenses.
Selling, general and administrative expenses. Selling, general and administrative expenses consist primarily of compensation and related benefits, facility costs, public company costs and professional service fees for our sales, marketing, customer service, administrative functions, and a portion of general overhead expenses.
We allocate overhead such as occupancy, telecommunication charges and depreciation expense based on headcount, as we believe this to be the most accurate measure. As a result, a portion of general overhead expenses is reflected in both our cost of revenue and selling, general and administrative expenses.
Other (expense) income, net
Other (expense) income, net, primarily consists of interest expense related to our term debt and convertible debt and the derecognition of our note payable due to First Horizon Merchant Services and First Tennessee Bank.
Critical accounting policies and estimates
The discussion and analysis of our financial condition and results of operations are based upon our consolidated financial statements, which have been prepared in accordance with GAAP. These principles require us to make certain estimates and judgments that affect the amounts reported in our financial statements. We base our estimates on historical experience, future trends and other assumptions we believe to be reasonable under the circumstances. Because these accounting policies require significant judgment, our actual results may differ materially from our estimates.
We consider an accounting policy to be critical if it is important to our financial condition and results of operations, and if it requires significant judgment, subjectivity and complexity on the part of management in its application. We believe the following to be our critical accounting policies.
Revenue recognition
We derive revenue principally through fees earned under fixed contractual arrangements with customers who use our international payment and multi-currency processing services. We have two revenue streams:
Multi-currency processing services revenue
Multi-currency processing services revenue is the foreign currency transaction fee earned on processing and converting of a credit or debit card transaction from one currency into another
60
currency. Multi-currency transaction processing services revenue is recognized upon settlement of the transaction.
Payment processing services revenue
We follow the requirements of EITF 99-19, Reporting Revenue Gross as a Principal Versus Net as an Agent, included in the Revenue Recognition Topic of Accounting Standards Codification ("ASC") topic 605, in determining its payment processing services revenue reporting. Generally, where we have merchant portability, credit risk and ultimate responsibility for the merchant, revenue is reported at the time of settlement on a gross basis equal to the full amount of the discount charged to the merchant. This amount may include interchange paid to card issuing banks and assessments paid to payment card associations.
Payment processing services revenue is transaction based and priced either as a fixed fee per transaction or calculated based on a percentage of the transaction value. The fees are charged for processing services provided in facilitating the sale of goods and services by means of credit and debit cards and other electronic payments and do not include the gross sales price paid by the ultimate buyer. Payment processing services revenue is recognized upon settlement of the transaction.
Our revenue is presented net of a provision for sales credits, which is estimated based on historical results and established in the period in which services are provided. As of the periods presented, there were no such provisions.
Software development costs and amortization
We develop software that is used in providing payment processing services to customers. Capitalization of internally developed software, primarily associated with our operating platform, occurs when we have completed the preliminary project stage, management authorizes the project, management commits to funding the project, it is probable the project will be completed and the project will be used to perform the function intended. The preliminary project stage consists of the conceptual formulation of alternatives, the evaluation of alternatives, the determination of existence of needed technology and the final selection of alternatives.
We capitalize costs of materials and consultants, payroll and payroll-related costs incurred by employees involved in developing internal use computer software. Costs incurred during the preliminary project and post-implementation stages are charged to processing and service costs, which are included in cost of revenue as incurred. Software development costs are amortized to processing and service costs, which are included in cost of revenue on a straight-line basis over estimated useful lives of approximately three to five years. We perform periodic reviews to ensure that unamortized software costs remain recoverable from future cash flows. Capitalized software development costs, net, were $3.7 million, $4.6 million and $4.9 million as of December 31, 2009 and 2010 and September 30, 2011, respectively. Amortization expense totaled $0.7 million, $0.9 million and $1.1 million for the years ended December 31, 2008, 2009 and 2010, respectively. Amortization expense totaled $0.7 million and $1.2 million for the nine months ended September 30, 2010 and 2011, respectively.
61
Stock-based expense and assumptions
Stock-based expense is measured at the grant date based on fair value and recognized as an expense over the requisite service period, net of an estimated forfeiture rate.
The following summarizes stock-based expense recognized by income statement classification:
| |
Year ended December 31, | Nine months ended September 30, |
||||||||||||||
|---|---|---|---|---|---|---|---|---|---|---|---|---|---|---|---|---|
| |
2008 |
2009 |
2010 |
2010 |
2011 |
|||||||||||
Processing and service costs |
$ | 421,405 | $ | 437,919 | $ | 211,582 | $ | 194,293 | $ | 107,503 | ||||||
Selling, general and administrative expense |
1,385,062 | 1,007,106 | 618,151 | 448,435 | 327,651 | |||||||||||
Total stock-based expense |
$ | 1,806,467 | $ | 1,445,025 | $ | 829,733 | $ | 642,728 | $ | 435,154 | ||||||
The following summarizes stock-based expense recognized by type:
| |
Year ended December 31, | Nine months ended September 30, |
||||||||||||||
|---|---|---|---|---|---|---|---|---|---|---|---|---|---|---|---|---|
| |
2008 |
2009 |
2010 |
2010 |
2011 |
|||||||||||
Stock options |
$ | 1,487,493 | $ | 1,213,659 | $ | 739,992 | $ | 555,120 | $ | 420,226 | ||||||
Warrants(1) |
318,974 | 231,366 | 89,741 | 87,608 | 14,928 | |||||||||||
Total stock-based expense |
$ | 1,806,467 | $ | 1,445,025 | $ | 829,733 | $ | 642,728 | $ | 435,154 | ||||||
(1) For the periods indicated in the table above, we issued warrants as a partial payment for legal services rendered.
A summary of the unamortized stock-based expense and associated weighted average remaining amortization periods for stock options and warrants is presented below:
| |
As of December 31, 2010 |
As of September 30, 2011 |
|||||||||||
|---|---|---|---|---|---|---|---|---|---|---|---|---|---|
| |
Unamortized stock-based expense |
Weighted average remaining amortization period (in years) |
Unamortized stock-based expense |
Weighted average remaining amortization period (in years) |
|||||||||
Stock options |
$ | 708,091 | 2.16 | $ | 965,243 | 1.76 | |||||||
Warrants |
— | — | — | — | |||||||||
Stock-based expense assumptions and vesting requirements
Determining the appropriate fair value model and calculating the fair value of options and warrants require the input of highly subjective assumptions, including the expected life, expected stock price volatility, and the number of expected options and warrants that will be forfeited prior to the completion of the vesting requirements. We use the Black-Scholes Option Pricing Model to value our options and warrants.
We account for warrants issued to non-employees as expense at their fair value over the service period. Warrants issued to non-employees vest immediately upon issuance and are not required to be revalued.
62
Expected life
Due to the limited history of our common stock being publicly traded on AIM, the expected life for our options granted was determined based on the "simplified" method under the provisions of ASC 718-10, Compensation—Stock Compensation. The expected life of warrants granted was determined based on the warrants contractual life.
Expected stock price volatility
Due to our limited public company history, the expected volatility for our options and warrants was determined based upon the expected volatility of similar entities whose shares are publicly traded and have trading history commensurate with expected life.
Risk-free interest rate and dividend yield
The risk-free interest rates used for our options and warrants granted were the U.S. Treasury zero-coupon rates for bonds matching the expected life of an option or warrant on the date of grant.
The expected dividend yield is not applicable to any options or warrants granted as we have not paid any dividends and intend to retain any future earnings for use in our business.
Vesting requirements
Options granted to employees generally vest 1/3rd of the amount of shares subject to each option on each 12-month anniversary from the vesting commencement date over a three year period and expire ten years from the grant date.
A director's annual option grant vests and becomes exercisable as to 1/12th of the shares each month from the vesting commencement date. A director's initial grant vests and becomes exercisable as to 1/3rd of the shares on the 12-month anniversary from the vesting commencement date and then 1/36th of the shares each month thereafter, such that the grant vests in full after three years. All directors' options expire ten years from the grant date.
Our 2000 Stock Incentive Plan allows for acceleration of the vesting of outstanding options granted upon the occurrence of certain events related to change of control, merger, and the sale of substantially all of our assets or liquidation of the company, at the discretion of our Board of Directors. Our 2006 Equity Incentive Plan provides that if outstanding options are not assumed or replaced by a successor corporation, options shall immediately vest as to 100% of the shares at such time and on such conditions as our Board of Directors shall determine.
Warrants granted are issued for services performed by third parties or investments and are generally fully vested at grant and generally expire over a period of five years.
63
Black-Scholes assumptions used for options and warrants
The fair market value of each option and warrant granted for all periods presented has been estimated on the grant date using the Black-Scholes Option Pricing Model with the following assumptions:
| |
Year ended December 31, | Nine months ended September 30, |
||||||||
|---|---|---|---|---|---|---|---|---|---|---|
| |
2008 |
2009 |
2010 |
2010 |
2011 |
|||||
Expected life (in years) |
5.0 - 6.0 | 5.0 - 6.0 | 5.0 - 6.0 | 5.0 - 6.0 | 5.0 - 6.32 | |||||
Expected volatility (percentage) |
36.61 - 39.21 | 35.43 - 36.80 | 28.20 - 36.23 | 34.50 - 36.23 | 27.80 - 36.68 | |||||
Risk-free interest rate (percentage) |
1.89 - 3.77 | 2.31 - 2.57 | 1.59 - 3.04 | 2.22 - 3.04 | 1.58 - 2.72 | |||||
Expected dividend yield |
— | — | — | — | — | |||||
The following table summarizes stock options granted to our employees during the period July 1, 2010 through December 31, 2011:
| Grant date |
Number of options granted |
Exercise price |
|||||
|---|---|---|---|---|---|---|---|
November 9, 2010 |
15,000 | $ | 1.25 | ||||
November 30, 2010 |
100,000 | 1.25 | |||||
February 8, 2011 |
352,500 | 2.30 | |||||
March 23, 2011 |
105,000 | 2.17 | |||||
April 12, 2011 |
100,000 | 2.00 | |||||
April 27, 2011 |
50,000 | 2.02 | |||||
May 16, 2011 |
173,000 | 2.15 | |||||
July 22, 2011 |
144,000 | 2.19 | |||||
Our Board of Directors has historically set the exercise price of stock options based on a price per share not less than the fair value of our common stock on the date of grant. Since our shares of common stock began trading on AIM in 2006, our Board of Directors has determined that the fair value of the shares of common stock on the date of grant is the closing price of shares of our common stock that trade under the AIM symbol "PPTR." The underlying security for all issued and outstanding options and warrants is our common stock trading under "PPTR."
The number of warrants granted during the period July 1, 2010 through December 31, 2011 was inconsequential.
Long-term incentive restricted stock agreement assumptions and vesting requirements On July 26, 2011, we made a restricted stock grant of 915,000 shares of our common stock to Philip Beck, our Chairman of the Board, Chief Executive Officer and President, pursuant to a Long-Term Incentive Restricted Stock Agreement. The 915,000 shares vest in four separate tranches, each with a different long-term performance goal. The awards will accelerate in full upon a sale or merger of our company, if the consideration paid is at least $1 billion and there is a valuation or price equating to at least $15.00 per share. The performance goals for each tranche are outlined below:
- •
- Tranche one (expires 12/31/2014): Performance condition award consisting of 305,000 shares that vest based upon the achievement of adjusted EBITDA (as will be defined in our earnings releases for the relevant periods) per fully diluted share greater than or equal to $0.36 per share. The fair value of tranche one is $0.7 million.
64
- •
- Tranche two (expires 12/31/2017): Performance condition award consisting of 47,000 shares that vest based upon the
achievement of adjusted EBITDA (as will be defined in our earnings releases for the relevant periods) per fully diluted share greater than or equal to $0.64 per share. The fair value of tranche two is
$0.1 million.
- •
- Tranche three (expires 12/31/2017): Performance condition award consisting of 469,000 shares that vest based upon the
achievement of adjusted EBITDA (as will be defined in our earnings releases for the relevant periods) per fully diluted share greater than or equal to $0.71 per share. The fair value of tranche three
is $1.0 million.
- •
- Tranche four (expires 12/31/2017): Market condition award consisting of 94,000 shares that vest based upon the fair market value of our common stock being greater than or equal to $12.00 per share for 75 consecutive trading days in the United States. The fair value of tranche four is $5,600.
In accordance with ASC 718-10, we valued the performance condition and market condition awards using the Black-Scholes and binomial lattice models, respectively. The fair values of the performance condition awards are based upon the closing price of shares of our common stock that trade on AIM under the symbol "PPTR" on the date of grant. The total fair value of all three tranches of the performance condition awards is $1.8 million, of which no amounts have been expensed as it was not deemed probable that the performance conditions would be satisfied based on the financial assessment of September 30, 2011. We will reassess the probability of achieving each performance condition metric at each reporting period. The total fair value of the market condition award is $5,600. Given the inconsequential nature of the amount, we recorded the entire expense in the third quarter of 2011. The expense related to the market condition award is not reversed even if the market conditions are not satisfied.
The fair value of the market condition award has been estimated on the grant date using a binomial lattice-based valuation pricing model with the following assumptions:
| |
July 26, | |||
|---|---|---|---|---|
| |
2011 |
|||
Expected life (in years) |
5.3 | |||
Expected volatility (percentage) |
31.68 | |||
Risk-free interest rate (percentage) |
2.04 | |||
Expected dividend yield |
— | |||
Income taxes
We account for income taxes on the asset and liability method. Under this method, deferred tax assets and liabilities are recognized for the future tax consequence attributable to differences between the financial statements carrying amounts of existing assets and liabilities and their respective tax bases and operating loss and tax credit carry-forwards. Deferred tax assets and liabilities are measured using enacted tax rates expected to apply to taxable income in the years in which those temporary differences are expected to be recovered or settled. The effect on deferred tax assets and liabilities due to a change in tax rates is recognized in results of operations in the period during which the tax change occurs. Our operations are conducted in various geographies with different tax rates. As our operations evolve this may impact our future effective tax rate.
65
We are required to assess whether it is necessary to establish a valuation allowance to reduce the deferred tax assets if it is more likely than not that some portion or all of the deferred tax assets will not be realized. Our process includes evaluating both positive (for example, sources of taxable income) and negative (for example, historical losses) evidence and determining whether it is more likely than not that the deferred tax assets will not be realized.
ASC 740-10, Accounting for Income Taxes, prescribes a comprehensive model for how companies should recognize, measure, present, and disclose uncertain tax positions taken or expected to be taken on a tax return. We initially and subsequently measure such tax positions as the largest amount of tax benefit that is greater than 50% likely of being realized upon ultimate settlement with the tax authority assuming full knowledge of the position and all relevant facts. We reviewed and evaluated the relevant technical merits of each of our tax positions, for all periods presented, and determined that there are no uncertain tax positions that would have a material impact on our financial statements.
Results of operations
The following table sets forth our consolidated results of operations for the periods presented and as a percentage of our net revenue for those periods. The period-to-period comparison of financial results is not necessarily indicative of financial results to be achieved in future periods.
| |
Year ended December 31, | Nine months ended September 30, |
|||||||||||||||||||||||||||||||
|---|---|---|---|---|---|---|---|---|---|---|---|---|---|---|---|---|---|---|---|---|---|---|---|---|---|---|---|---|---|---|---|---|---|
| |
2008 | 2009 | 2010 | 2010 | 2011 | ||||||||||||||||||||||||||||
| |
$ amount |
% of revenue |
$ amount |
% of revenue |
$ amount |
% of revenue |
$ amount |
% of revenue |
$ amount |
% of revenue |
|||||||||||||||||||||||
Revenue: |
|||||||||||||||||||||||||||||||||
APAC |
$ | 6,619,856 | 31.3 | % | $ | 10,496,935 | 39.9 | % | $ | 15,198,058 | 49.7 | % | $ | 10,251,603 | 48.8 | % | $ | 13,354,312 | 45.2 | % | |||||||||||||
North America |
2,485,753 | 11.7 | 2,065,284 | 7.9 | 2,647,547 | 8.7 | 1,592,787 | 7.6 | 2,994,155 | 10.1 | |||||||||||||||||||||||
CEMEA |
— | — | 34,515 | 0.1 | 127,632 | 0.4 | 29,326 | 0.1 | 2,937,927 | 10.0 | |||||||||||||||||||||||
Total multi-currency processing services revenue |
9,105,609 | 43.0 | 12,596,734 | 47.9 | 17,973,237 | 58.8 | 11,873,716 | 56.5 | 19,286,394 | 65.3 | |||||||||||||||||||||||
Payment processing services revenue |
12,080,269 | 57.0 | 13,722,585 | 52.1 | 12,579,927 | 41.2 | 9,152,964 | 43.5 | 10,240,741 | 34.7 | |||||||||||||||||||||||
Net revenue |
21,185,878 | 100.0 | 26,319,319 | 100.0 | 30,553,164 | 100.0 | 21,026,680 | 100.0 | 29,527,135 | 100.0 | |||||||||||||||||||||||
Operating expenses: |
|||||||||||||||||||||||||||||||||
Cost of revenue: |
|||||||||||||||||||||||||||||||||
Payment processing services fees |
9,808,434 | 46.3 | 10,175,430 | 38.6 | 10,051,640 | 32.9 | 7,423,046 | 35.3 | 8,273,579 | 28.0 | |||||||||||||||||||||||
Processing and service costs |
6,434,693 | 30.4 | 6,282,743 | 23.9 | 6,980,981 | 22.9 | 5,175,096 | 24.6 | 6,758,294 | 22.9 | |||||||||||||||||||||||
Software licenses impairment |
— | — | — | — | 1,108,514 | 3.6 | — | — | — | — | |||||||||||||||||||||||
Total cost of revenue |
16,243,127 | 76.7 | 16,458,173 | 62.5 | 18,141,135 | 59.4 | 12,598,142 | 59.9 | 15,031,873 | 50.9 | |||||||||||||||||||||||
Selling, general and administrative expenses |
15,365,254 | 72.5 | 12,822,449 | 48.8 | 14,304,448 | 46.8 | 10,354,051 | 49.3 | 13,580,381 | 46.0 | |||||||||||||||||||||||
Goodwill impairment |
129,887 | 0.6 | — | — | — | — | — | — | — | — | |||||||||||||||||||||||
Total operating expenses |
31,738,268 | 149.8 | 29,280,622 | 111.3 | 32,445,583 | 106.2 | 22,952,193 | 109.2 | 28,612,254 | 96.9 | |||||||||||||||||||||||
(Loss) income from operations |
(10,552,390 | ) | (49.8 | ) | (2,961,303 | ) | (11.3 | ) | (1,892,419 | ) | (6.2 | ) | (1,925,513 | ) | (9.2 | ) | 914,881 | 3.1 | |||||||||||||||
|
(table continues on next page) |
||||||||||||||||||||||||||||||||
66
| |
Year ended December 31, | Nine months ended September 30, |
||||||||||||||||||||||||||||||
|---|---|---|---|---|---|---|---|---|---|---|---|---|---|---|---|---|---|---|---|---|---|---|---|---|---|---|---|---|---|---|---|---|
| |
2008 | 2009 | 2010 | 2010 | 2011 | |||||||||||||||||||||||||||
| |
$ amount |
% of revenue |
$ amount |
% of revenue |
$ amount |
% of revenue |
$ amount |
% of revenue |
$ amount |
% of revenue |
||||||||||||||||||||||
Other (expense) income: |
||||||||||||||||||||||||||||||||
Interest expense |
$ | (1,015,633 | ) | (4.8 | )% | $ | (1,236,504 | ) | (4.7 | )% | $ | (1,169,578 | ) | (3.8 | )% | $ | (906,286 | ) | (4.3 | )% | $(307,796 | ) | (1.0 | )% | ||||||||
Interest income |
140,191 | 0.7 | 18,702 | 0.1 | 429 | 0.0 | 142 | 0.0 | 804 | 0.0 | ||||||||||||||||||||||
Other income, net |
— | — | — | — | — | — | — | — | 98,682 | 0.3 | ||||||||||||||||||||||
Total other expense, net |
(875,442 | ) | (4.1 | ) | (1,217,802 | ) | (4.6 | ) | (1,169,149 | ) | (3.8 | ) | (906,144 | ) | (4.3 | ) | (208,310 | ) | (0.7 | ) | ||||||||||||
(Loss) income from continuing operations before provision for income taxes |
(11,427,832 | ) | (53.9 | ) | (4,179,105 | ) | (15.9 | ) | (3,061,568 | ) | (10.0 | ) | (2,831,657 | ) | (13.5 | ) | 706,571 | 2.4 | ||||||||||||||
Provision for income taxes |
(1,681 |
) |
(0.0 |
) |
(4,095 |
) |
0.0 |
(3,219 |
) |
0.0 |
— |
— |
(106,260 |
) |
(0.4 |
) |
||||||||||||||||
(Loss) income from continuing operations |
(11,429,513 | ) | (53.9 | ) | (4,183,200 | ) | (15.9 | ) | (3,064,787 | ) | (10.0 | ) | (2,831,657 | ) | (13.5 | ) | 600,311 | 2.0 | ||||||||||||||
Income from discontinued operations, net of taxes |
272,847 |
1.3 |
— |
— |
— |
— |
— |
— |
— |
— |
||||||||||||||||||||||
Net (loss) income |
$ | (11,156,666 | ) | (52.7 | )% | $ | (4,183,200 | ) | (15.9 | )% | $ | (3,064,787 | ) | (10.0 | )% | $ | (2,831,657 | ) | (13.5 | )% | $600,311 | 2.0 | % | |||||||||
Comparison of the nine months ended September 30, 2011 and 2010
Revenue
| |
Nine months ended September 30, |
Variance | |||||||||||||
|---|---|---|---|---|---|---|---|---|---|---|---|---|---|---|---|
| |
2010 |
2011 |
Amount |
Percent |
|||||||||||
APAC |
$ | 10,251,603 | $ | 13,354,312 | $ | 3,102,709 | 30 | % | |||||||
North America |
1,592,787 | 2,994,155 | 1,401,368 | 88 | |||||||||||
CEMEA |
29,326 | 2,937,927 | 2,908,601 | * | |||||||||||
Total multi-currency processing services revenue |
11,873,716 | 19,286,394 | 7,412,678 | 62 | |||||||||||
Payment processing services revenue |
9,152,964 | 10,240,741 | 1,087,777 | 12 | |||||||||||
Net revenue |
$ | 21,026,680 | $ | 29,527,135 | $ | 8,500,455 | 40 | ||||||||
* Percentage not meaningful.
Net revenue increased $8.5 million, or 40%, to $29.5 million for the nine months ended September 30, 2011 from $21.0 million for the nine months ended September 30, 2010. The increase in revenue was primarily due to the overall increase by 84%, or 11,403, in total active merchant locations processing transactions through our multi-currency and payment processing services as of September 30, 2011. Additionally, we believe our business was positively impacted by the global shift toward electronic payment transactions, increased international travel and commerce and increased e-commerce on a global scale.
67
Multi-currency processing services revenue
APAC multi-currency processing services revenue. APAC multi-currency processing services revenue increased $3.1 million, or 30%, to $13.4 million for the nine months ended September 30, 2011 from $10.3 million for the nine months ended September 30, 2010. The increase in APAC multi-currency processing services revenue was driven by increases in the following key business metrics:
| |
Nine months ended September 30, |
Variance | |||||||||||
|---|---|---|---|---|---|---|---|---|---|---|---|---|---|
| |
2010 |
2011 |
Amount |
Percent |
|||||||||
APAC multi-currency processing active merchant locations (at period end) |
8,946 | 10,205 | 1,259 | 14 | % | ||||||||
APAC multi-currency processing settled transactions processed |
3,541,531 | 4,298,998 | 757,467 | 21 | |||||||||
APAC multi-currency processing gross foreign currency mark-up |
$ | 30,550,594 | $ | 42,204,281 | $ | 11,653,687 | 38 | ||||||
APAC multi-currency processing settled dollar volume processed |
$ | 820,496,241 | $ | 1,064,257,336 | $ | 243,761,095 | 30 | ||||||
APAC average net mark-up % on settled dollar volume processed |
1.25 | % | 1.25 | % | 0 | % | — | ||||||
The 30% increase in settled dollar volume processed resulted in a $3.1 million increase in revenue. The primary reasons for the increase in settled dollar volume processed were a 14% increase in active APAC merchant locations, which resulted from the addition of new active merchant locations in existing markets and our entering into five new APAC markets in the second quarter of 2010, and the continued improvement in the global economy. This resulted in a 21% increase in settled transactions processed through our multi-currency services.
North America multi-currency processing services revenue. North America multi-currency processing services revenue increased $1.4 million, or 88%, to $3.0 million for the nine months ended September 30, 2011 from $1.6 million for the nine months ended September 30, 2010. The increase in North America multi-currency processing services revenue was driven by increases in the following key business metrics:
| |
Nine months ended September 30, |
Variance | |||||||||||
|---|---|---|---|---|---|---|---|---|---|---|---|---|---|
| |
2010 |
2011 |
Amount |
Percent |
|||||||||
North America multi-currency processing active merchant locations (at period end) |
625 | 1,833 | 1,208 | 193 | % | ||||||||
North America multi-currency processing settled transactions processed |
1,200,235 | 2,322,137 | 1,121,902 | 93 | |||||||||
North America multi-currency processing gross foreign currency mark-up |
3,435,909 | 7,807,143 | 4,371,234 | 127 | |||||||||
North America multi-currency processing settled dollar volume processed |
$ | 92,819,456 | $ | 239,000,867 | $ | 146,181,411 | 157 | ||||||
North America average net mark-up % on settled dollar volume processed |
1.72 | % | 1.25 | % | (0.47 | )% | (27 | ) | |||||
68
The 157% increase in settled dollar volume processed resulted in a $1.8 million increase to revenue offset in part by a 27% decrease in our average net mark-up percentage on settled dollar volume processed, due to the different mark-ups applied to different customers and for a variety of services, which resulted in a $0.4 million decrease in revenue. The primary reason for the increase in settled dollar volume processed was a 193% increase in active North America merchant locations, which was driven by the addition of new active merchant locations in North America including the addition of a large national retailer. This resulted in a 93% increase in transactions processed through our multi-currency services.
CEMEA multi-currency processing services revenue. CEMEA multi-currency processing services revenue increased $2.9 million for the nine months ended September 30, 2011 as compared to the nine months ended September 30, 2010. The increase in CEMEA multi-currency processing services revenue was driven by changes in the following key business metrics:
| |
Nine months ended September 30, |
Variance | |||||||||||
|---|---|---|---|---|---|---|---|---|---|---|---|---|---|
| |
2010 |
2011 |
Amount |
Percent |
|||||||||
CEMEA multi-currency processing active merchant locations (at period end) |
411 | 2,998 | 2,587 | * | |||||||||
CEMEA multi-currency processing settled transactions processed |
8,568 | 1,059,836 | 1,051,268 | * | |||||||||
CEMEA multi-currency processing gross foreign currency mark-up |
86,141 | 10,651,306 | 10,565,165 | * | |||||||||
CEMEA multi-currency processing settled dollar volume processed |
$ | 2,745,992 | $ | 309,495,185 | $ | 306,749,193 | * | ||||||
CEMEA average net mark-up % on settled dollar volume processed |
1.07 | % | 0.95 | % | (0.12 | )% | * | ||||||
* Percentages not meaningful.
The $306.7 million increase in settled dollar volume processed was due to our entry into two new countries during the last quarter of 2010. The addition of the merchant locations from these new countries significantly impacted the number of transactions processed through our multi-currency services.
Payment processing services revenue
Payment processing services revenue is primarily earned from transactions originating in North America. Payment processing services revenue increased $1.1 million, or 12%, to $10.2 million for the nine months ended September 30, 2011 from $9.1 million for the nine months ended September 30, 2010. The increase was primarily due to increased transaction volume in the Canadian market for the nine months ended September 30, 2010 as compared to the nine months ended September 30, 2011.
Cost of revenue
| |
Nine months ended September 30, |
Variance | ||||||||||||
|---|---|---|---|---|---|---|---|---|---|---|---|---|---|---|
| |
2010 |
2011 |
Amount |
Percent |
||||||||||
Payment processing services fees |
$ | 7,423,046 | $ | 8,273,579 | $ | 850,533 | 11 | % | ||||||
Processing and service costs |
5,175,096 | 6,758,294 | 1,583,198 | 31 | ||||||||||
Total cost of revenue |
$ | 12,598,142 | $ | 15,031,873 | $ | 2,433,731 | 19 | |||||||
69
Payment processing services fees
Payment processing services fees primarily consist of third party transactions fees, which may include sponsorship fees, interchange and card association fees and assessments. The increase of $0.9 million, or 11%, to $8.3 million for the nine months ended September 30, 2011 from $7.4 million for the nine months ended September 30, 2010 is as a result of the increase in payment processing service revenue, coupled with pricing mix of services for the nine month period of 2011.
Processing and service costs
Processing and service costs increased $1.6 million or 31% to $6.8 million for the nine months ended September 30, 2011 from $5.2 million for the nine months ended September 30, 2010. The increase in processing and service costs was primarily the result of increased salary and compensation and related benefit costs of $0.6 million, an increase in technology expense of $0.4 million to support the growth in our existing business and the launches into new markets, and an increase in depreciation and amortization expense of $0.5 million primarily related to software development additions.
Selling, general and administrative expenses
| |
Nine months ended September 30, |
Variance | |||||||||
|---|---|---|---|---|---|---|---|---|---|---|---|
| |
2010 |
2011 |
Amount |
Percent |
|||||||
Selling, general and administrative expenses |
$ | 10,354,051 | $ | 13,580,381 | $ | 3,226,330 | 31% | ||||
Selling, general and administrative expenses increased $3.2 million, or 31%, to $13.6 million for the nine months ended September 30, 2011 from $10.4 million for the nine months ended September 30, 2010. The increase in selling, general and administrative expenses was primarily the result of increased salary compensation and related benefit costs of $2.6 million primarily due to general headcount additions to support the growth in our existing business, the launches into new markets and increased bonus compensation and other various selling general and administration expenses and recovery of $0.6 million of doubtful accounts in the first half of 2010, which reduced the selling, general and administrative expenses for the nine months ended September 30, 2010.
Other (expense) income, net
| |
Nine months ended September 30, |
Variance | ||||||||||||
|---|---|---|---|---|---|---|---|---|---|---|---|---|---|---|
| |
2010 |
2011 |
Amount |
Percent |
||||||||||
Interest expense |
$ | (906,286 | ) | $ | (307,796 | ) | $ | 598,490 | * | |||||
Interest income |
142 | 804 | 662 | * | ||||||||||
Other income |
— |
98,682 |
98,682 |
* |
||||||||||
Total other (expense) income, net |
$ | (906,144 | ) | $ | (208,310 | ) | $ | 697,834 | * | |||||
* Percentages not meaningful.
Total other expense, net, decreased $0.7 million, to $0.2 million for the nine months ended September 30, 2011 from a non-operating expense of $0.9 million for the nine months ended
70
September 30, 2010. The decrease was primarily due to recording nine months of interest expense on our convertible debt for the nine months ended September 30, 2010 compared to four months of interest expense for the nine months ended September 30, 2011, as the debt converted in April 2011. In addition, we recorded $0.7 million in other income due to the derecognition of a note payable for which the statute of limitations expired and that management did not believe we were liable to repay, which was almost entirely offset by the recognition of a $0.6 million prepayment fee negotiated at the time of conversion of our convertible debt in April 2011.
Comparison of the years ended December 31, 2010 and 2009
Revenue
| |
Year ended December 31, | Variance | |||||||||||||
|---|---|---|---|---|---|---|---|---|---|---|---|---|---|---|---|
| |
2009 |
2010 |
Amount |
Percent |
|||||||||||
APAC |
$ | 10,496,935 | $ | 15,198,058 | $ | 4,701,123 | 45 | % | |||||||
North America |
2,065,284 | 2,647,547 | 582,263 | 28 | |||||||||||
CEMEA |
34,515 | 127,632 | 93,117 | * | |||||||||||
Total multi-currency processing services revenue |
12,596,734 | 17,973,237 | 5,376,503 | 43 | |||||||||||
Payment processing services revenue |
13,722,585 | 12,579,927 | (1,142,658 | ) | (8 | ) | |||||||||
Net revenue |
$ | 26,319,319 | $ | 30,553,164 | $ | 4,233,845 | 16 | ||||||||
* Percentage not meaningful.
Net revenue increased $4.2 million, or 16%, to $30.5 million for the year ended December 31, 2010 from $26.3 million for the year ended December 31, 2009. The year over year increase in revenue was primarily due to the overall increase by 66%, or 6,619, in total active merchant locations processing transactions through our multi-currency and payment processing services. Additionally, we believe our business was positively impacted by the global shift toward electronic payment transactions, increased international travel and commerce, and increased e-commerce on a global scale.
Multi-currency processing services revenue
APAC multi-currency processing services revenue. APAC multi-currency processing services revenue increased $4.7 million, or 45%, to $15.2 million for the year ended December 31, 2010
71
from $10.5 million for the year ended December 31, 2009. The increase in APAC multi-currency processing services revenue was driven by increases in the following key business metrics:
| |
Year ended December 31, | Variance | |||||||||||
|---|---|---|---|---|---|---|---|---|---|---|---|---|---|
| |
2009 |
2010 |
Amount |
Percent |
|||||||||
APAC multi-currency processing active merchant locations (at period end) |
6,084 | 9,539 | 3,455 | 57 | % | ||||||||
APAC multi-currency processing settled transactions processed |
3,363,631 | 5,044,204 | 1,680,573 | 50 | |||||||||
APAC multi-currency processing gross foreign currency mark-up |
$ | 28,246,668 | $ | 45,768,876 | $ | 17,522,208 | 62 | ||||||
APAC multi-currency processing settled dollar volume processed |
$ | 781,848,962 | $ | 1,201,455,560 | $ | 419,606,598 | 54 | ||||||
APAC average net mark-up % on settled dollar volume processed |
1.34 | % | 1.26 | % | (0.08) | % | (6 | ) | |||||
The 54% increase in settled dollar volume processed resulted in a $5.3 million increase to revenue, offset by a 6% decrease in our average net mark-up percentage on settled dollar volume processed, which resulted in a $0.6 million increase to revenue. The primary reasons for the increase in total dollar volume processed were a 57% increase in active APAC merchant locations, which resulted from the addition of new active merchant locations in existing markets and our entering into five new APAC markets in the second quarter of 2010, and the continued improvement in the global economy. This resulted in a 50% increase in settled transactions processed through our multi-currency services. The decrease in average net mark-up percentage on settled dollar volume processed was primarily due to the different mark-ups applied to different customers and for a variety of services.
North America multi-currency processing services revenue. North America multi-currency processing services revenue increased $0.6 million, or 28%, to $2.6 million for the year ended December 31, 2010 from $2.0 million for the year ended December 31, 2009. The $0.6 million increase in North America multi-currency processing services revenue was driven by increases in the following key business metrics:
| |
Year ended December 31, | Variance | |||||||||||
|---|---|---|---|---|---|---|---|---|---|---|---|---|---|
| |
2009 |
2010 |
Amount |
Percent |
|||||||||
North America multi-currency processing active merchant locations (at period end) |
530 | 1,528 | 998 | 188 | % | ||||||||
North America multi-currency processing settled transactions processed |
2,708,041 | 1,899,198 | (808,843 | ) | (30 | ) | |||||||
North America multi-currency processing gross foreign currency mark-up |
$ | 4,935,961 | $ | 5,867,264 | $ | 931,303 | 19 | ||||||
North America multi-currency processing settled dollar volume processed |
$ | 123,048,213 | $ | 162,032,780 | $ | 38,984,567 | 32 | ||||||
North America average net mark-up % on settled dollar volume processed |
1.68 | % | 1.63 | % | (0.05 | )% | (3 | ) | |||||
72
The 32% increase in settled dollar volume processed resulted in a $0.6 million increase to revenue slightly offset by a 3% decrease in our average net mark-up percentage on settled dollar volume processed which resulted in a $50,000 decrease to revenue. The primary reason for the increase in settled dollar volume processed was a 188% increase in active North America merchant locations, which resulted from the addition of new active merchant locations in existing markets including a large national retailer. The decrease in settled transactions processed was caused by the transition of a low transaction fee, high transaction volume customer away from our multi-currency processing service to our payment processing service. The decrease in average net mark-up percentage on settled dollar volume processed was primarily due to the different mark-ups applied to different customers and for a variety of services.
Payment processing services revenue
Payment processing services revenue is primarily based on transactions originating in North America. Payment processing services revenue decreased $1.1 million, or 8%, to $12.6 million for the year ended December 31, 2010 from $13.7 million for the year ended December 31, 2009. The $1.1 million decrease was primarily due to the loss of certain merchant customers acquired as part of the asset acquisition of the iPAY business in 2008.
Cost of revenue
| |
Year ended December 31, | Variance | |||||||||||
|---|---|---|---|---|---|---|---|---|---|---|---|---|---|
| |
2009 |
2010 |
Amount |
Percent |
|||||||||
Payment processing services fees |
10,175,430 | 10,051,640 | (123,790 | ) | (1)% | ||||||||
Processing and service costs |
6,282,743 | 6,980,981 | 698,238 | 11 | |||||||||
Software licenses impairment |
— | 1,108,514 | 1,108,514 | * | |||||||||
Total cost of revenue |
$ | 16,458,173 | $ | 18,141,135 | $ | 1,682,962 | 10 | ||||||
* Percentage not meaningful.
Payment processing services fees
The decrease of $0.1 million, or 1%, to $10.1 million for the year ended December 31, 2010 from $10.2 million for the year ended December 31, 2009 is as a result of the pricing mix of services for 2010.
Processing and service costs
Processing and service costs increased $0.7 million, or 11%, to $7.0 million for the year ended December 31, 2010 from $6.3 million for the year ended December 31, 2009. The increase in processing and service costs was primarily the result of increased salary and compensation and related benefit costs of $0.3 million primarily due to technology headcount additions to support the growth in our existing business, the launches into new markets, increased bonus compensation and an increase in depreciation and amortization expense of $0.2 million primarily related to software development additions.
Software licenses impairment charge
In the fourth quarter of 2010, due to our unsuccessful efforts to sell software licenses previously purchased for resale, management determined that the underlying undiscounted
73
cash flows projections did not support the recorded value of the asset and wrote-off the entire balance of $1.1 million to cost of revenue for the year ended December 31, 2010.
Selling, general and administrative expenses
| |
Year ended December 31, | Variance | |||||||||
|---|---|---|---|---|---|---|---|---|---|---|---|
| |
2009 |
2010 |
Amount |
Percent |
|||||||
Selling, general and administrative expenses |
$ | 12,822,449 | $ | 14,304,448 | $ | 1,481,999 | 12% | ||||
Selling, general and administrative expenses increased $1.5 million, or 12%, to $14.3 million for the year ended December 31, 2010 from $12.8 million for the year ended December 31, 2009. The increase in selling, general and administrative expenses was primarily the result of increased salary compensation and related benefit costs of $1.5 million, and travel costs, facility costs, insurance costs and other general and administrative costs of $0.8 million. These increases are primarily due to the reinstatement of the 2008 corporate-wide salary decrease and general head count additions to support the growth in our existing business and the launches into new markets. These increases in selling, general and administrative expenses were partially offset by a $0.5 million recovery of a previously written-off receivable during 2010 and $0.3 million write off of a note receivable in 2009.
Other expense, net
| |
Year ended December 31, | Variance | ||||||||||||
|---|---|---|---|---|---|---|---|---|---|---|---|---|---|---|
| |
2009 |
2010 |
Amount |
Percent |
||||||||||
Interest expense |
$ | (1,236,504 | ) | $ | (1,169,578 | ) | $ | 66,926 | (5 | )% | ||||
Interest income |
18,702 | 429 | (18,273 | ) | (98 | ) | ||||||||
Total other expense, net |
$ | (1,217,802 | ) | $ | (1,169,149 | ) | $ | 48,653 | 4 | |||||
Total other expense, net, primarily consists of interest expense related to our term debt and convertible debt. In November 2010, the outstanding $4.0 million balance on the term debt was repaid in full and in April 2011, the convertible debt holders converted their entire $9.0 million in principal under their notes and accrued interest into an aggregate of 4,049,776 shares of common stock. In addition, we issued 127,318 shares of common stock valued at $0.3 million in lieu of cash payments for accrued interest and 297,682 shares of common stock valued at $0.6 million as a prepayment fee negotiated at the time of conversion. The shares issued for the accrued interest and the prepayment fee were valued at the average closing price of our common stock on AIM under the symbol "PPTR" during the period immediately prior to the conversion.
74
Comparison of the years ended December 31, 2009 and 2008
Revenue
| |
Year ended December 31, | Variance | |||||||||||||
|---|---|---|---|---|---|---|---|---|---|---|---|---|---|---|---|
| |
2008 |
2009 |
Amount |
Percent |
|||||||||||
APAC |
$ | 6,619,856 | $ | 10,496,935 | $ | 3,877,079 | 59 | % | |||||||
North America |
2,485,753 | 2,065,284 | (420,469 | ) | (17 | ) | |||||||||
CEMEA |
— | 34,515 | 34,515 | * | |||||||||||
Total multi-currency processing services revenue |
9,105,609 | 12,596,734 | 3,419,125 | 38 | |||||||||||
Payment processing services revenue |
12,080,269 | 13,722,585 | 1,642,316 | 14 | |||||||||||
Net revenue |
$ | 21,185,878 | $ | 26,319,319 | $ | 5,133,441 | 24 | ||||||||
* Percentage not meaningful.
Net revenue increased $5.1 million, or 24%, to $26.3 million for the year ended December 31, 2009 from $21.2 million for the year ended December 31, 2008. Net revenue increased year over year despite the global recession and was primarily due to the overall 27% or 2,132 increase in total active merchant locations processing transactions through our multi-currency services.
Multi-currency processing services revenue
APAC multi-currency processing services revenue increased $3.9 million, or 59%, to $10.5 million for the year ended December 31, 2009 from $6.6 million for the year ended December 31, 2008. The increase in APAC multi-currency processing services revenue was driven by the increase in the following key business metrics:
| |
Year ended December 31, | Variance | |||||||||||
|---|---|---|---|---|---|---|---|---|---|---|---|---|---|
| |
2008 |
2009 |
Amount |
Percent |
|||||||||
APAC multi-currency processing active merchant locations (at period end) |
4,050 | 6,084 | 2,034 | 50 | % | ||||||||
APAC multi-currency processing settled transactions processed |
2,262,505 | 3,363,631 | 1,101,126 | 49 | |||||||||
APAC multi-currency processing gross foreign currency mark-up |
$ | 18,323,596 | $ | 28,246,668 | $ | 9,923,072 | 54 | ||||||
APAC multi-currency processing settled dollar volume processed |
$ | 576,412,301 | $ | 781,878,962 | $ | 205,466,661 | 36 | ||||||
APAC average net mark-up % on settled dollar volume processed |
1.15 | % | 1.34 | % | 0.19 | % | 17 | ||||||
The 36% increase in settled dollar volume processed resulted in a $2.8 million increase to revenue, coupled with a 17% increase in our average net mark-up percentage on settled dollar volume processed which resulted in a $1.1 million increase to revenue. The primary reason for the increase in settled dollar volume processed was a 50% increase in active merchant locations, resulting from the addition of new active merchant locations in existing markets and
75
two new markets. This resulted in a 49% increase in settled transactions processed through our multi-currency services.
Payment processing services revenue
Payment processing services revenue increased $1.6 million, or 14%, to $13.7 million for the year ended December 31, 2009 from $12.1 million for the year ended December 31, 2008. The $1.6 million increase was primarily due to a full year of revenue in 2009 resulting from the acquisition of the assets of the iPAY business in April 2008.
Cost of revenue
| |
Year ended December 31, | Variance | ||||||||||||
|---|---|---|---|---|---|---|---|---|---|---|---|---|---|---|
| |
2008 |
2009 |
Amount |
Percent |
||||||||||
Payment processing services fees |
$ | 9,808,434 | 10,175,430 | 366,996 | 4 | % | ||||||||
Processing and service costs |
6,434,693 | 6,282,743 | (151,950 | ) | (2 | ) | ||||||||
Total cost of revenue |
$ | 16,243,127 | $ | 16,458,173 | $ | 215,046 | 1 | |||||||
|
||||||||||||||
Payment processing services fees
The increase of $0.4 million, or 4%, to $10.2 million for the year ended December 31, 2009 from $9.8 million for the year ended December 31, 2008 is as a result of the pricing mix of services for 2009.
Processing and service costs
Processing and service costs decreased $0.1 million, or 2%, to $6.3 million for the year ended December 31, 2009 from $6.4 million for the year ended December 31, 2008. The decrease in processing and service costs was primarily the result of decreased salary and compensation and related benefit costs of $0.3 million resulting from corporate-wide salary and related benefits reduction and a decrease in technology expense of $0.3 million due to cost containment efforts in response to the global recession. These decreases were partially offset by an increase in depreciation and amortization expense of $0.3 million, primarily related to software development additions in the second half of 2008.
Selling, general and administrative expenses
| |
Year ended December 31, | Variance | |||||||||||
|---|---|---|---|---|---|---|---|---|---|---|---|---|---|
| |
2008 |
2009 |
Amount |
Percent |
|||||||||
Selling, general and administrative expenses |
$ | 15,365,254 | $ | 12,822,449 | $ | (2,542,805 | ) | (17 | )% | ||||
Selling, general and administrative expenses decreased $2.5 million, or 17%, to $12.8 million for the year ended December 31, 2009 from $15.3 million for the year ended December 31, 2008. The decrease in selling, general and administrative expenses was primarily the result of a salary and related benefit costs decrease of $1.0 million, due to a corporate-wide salary and related benefits reduction, a $1.7 million decrease resulting from cost containment efforts in response to the global recession and a decrease in bad debt expense, offset by a $0.2 million increase in various minor expenses.
76
Other expense, net
| |
Year ended December 31, | Variance | ||||||||||||
|---|---|---|---|---|---|---|---|---|---|---|---|---|---|---|
| |
2008 |
2009 |
Amount |
Percent |
||||||||||
Interest expense |
$ | (1,015,633 | ) | $ | (1,236,504 | ) | $ | (220,871 | ) | 22 | % | |||
Interest income |
140,191 | 18,702 | (121,489 | ) | (87 | ) | ||||||||
Total other expense, net |
$ | (875,442 | ) | $ | (1,217,802 | ) | $ | (342,360 | ) | 39 | ||||
Total other expense, net, primarily relates to the interest associated with our term debt and convertible debt. Interest expense increased $0.2 million, or 22%, primarily due to the increase in the weighted-average outstanding balance of our convertible debt in 2009 as compared to 2008.
Income from discontinued operations
In January 2008, we terminated a joint venture relationship by mutual agreement. In November 2008, we sold our interest in the joint venture for consideration of a five-year note receivable in the amount of $0.2 million with an annual interest rate of 7%. For the year ended December 31, 2009, we determined that the note receivable and interest of $0.3 million was uncollectible and the entire amount was written off to selling, general and administrative expenses within continuing operations.
77
Quarterly results of operations
The following tables set forth selected unaudited quarterly statements of operations data for the last 7 fiscal quarters. The information for each of these quarters has been prepared on the same basis as the audited annual financial statements included elsewhere in this prospectus and, in the opinion of management, includes all adjustments, which consist only of normal recurring adjustments, necessary for the fair presentation of the results of operations for these periods. This data should be read in conjunction with our audited consolidated financial statements and related notes included elsewhere in this prospectus. These quarterly operating results are not necessarily indicative of our operating results for any future period.
| |
For the three months ended | |||||||||||||||||||||
|---|---|---|---|---|---|---|---|---|---|---|---|---|---|---|---|---|---|---|---|---|---|---|
| (unaudited) |
March 31, 2010 |
June 30, 2010 |
September 30, 2010 |
December 31, 2010 |
March 31, 2011 |
June 30, 2011 |
September 30, 2011 |
|||||||||||||||
Net revenue |
$ | 6,643,609 | $ | 6,904,979 | $ | 7,478,092 | $ | 9,526,484 | $ | 9,595,704 | $ | 10,271,303 | $ | 9,660,128 | ||||||||
Gross profit(1) |
2,385,314 | 2,812,049 | 3,231,175 | 3,983,491 | 4,565,930 | 5,270,040 | 4,659,292 | |||||||||||||||
(Loss) income from operations |
(1,229,163 | ) | (422,608 | ) | (273,742 | ) | 33,094 | 324,467 | 880,346 | (289,932 | ) | |||||||||||
Net (loss) income |
$ | (1,530,221 | ) | $ | (721,845 | ) | $ | (579,591 | ) | $ | (233,130 | ) | $ | 768,956 | $ | 206,769 | $ | (375,414 | ) | |||
Basic net (loss) income per share applicable to common stockholders(2) |
$ | (0.04 | ) | $ | (0.02 | ) | $ | (0.01 | ) | $ | (0.01 | ) | $ | 0.02 | $ | 0.00 | $ | (0.01 | ) | |||
Diluted net (loss) income per share applicable to common stockholders(2) |
$ | (0.04 | ) | $ | (0.02 | ) | $ | (0.01 | ) | $ | (0.01 | ) | $ | 0.02 | $ | 0.00 | $ | (0.01 | ) | |||
Weighted average common stock (basic) |
39,176,921 | 39,185,354 | 39,487,252 | 43,447,659 | 46,147,557 | 49,509,756 | 50,794,219 | |||||||||||||||
Weighted average common stock (diluted) |
39,176,921 | 39,185,354 | 39,487,252 | 43,447,659 | 47,725,757 | 52,511,732 | 50,794,219 | |||||||||||||||
|
||||||||||||||||||||||
- (1)
- For
the purposes of this table, gross profit is defined as net revenue less total cost of revenue.
- (2)
- The addition of earnings per share by quarter may not equal total earnings per share for the year or interim period.
Liquidity and capital resources
We intend to use the net proceeds to us from this offering for working capital and other general corporate purposes and may use cash to fund acquisitions or invest in other businesses or technologies. We currently anticipate that the net proceeds from this offering, together with our available cash balances, will be sufficient to meet our presently anticipated working capital, capital expenditure and business expansion requirements for at least the next twelve months. However, we may be required to raise additional funds through public or private debt or equity financing to meet additional working capital requirements. There can be no assurance that this additional financing will be available, or if available, will be on reasonable terms and not dilutive to our stockholders. If adequate funds are not available on acceptable terms, our business and operating results could be adversely affected.
78
Sources of liquidity
Since inception, we have funded our operations primarily through private placements of preferred stock, common stock and convertible and non-convertible debt, including the offering of our common stock on AIM in 2006, and, to a lesser extent, through lease financing and proceeds from the exercise of warrants and stock options.
The offering of our common stock on AIM provided us with aggregate net proceeds of approximately $10.0 million. Through September 30, 2011, private placements of common stock since our offering on AIM provided us with aggregate net proceeds of approximately $27.2 million and the issuance of convertible debt provided us with aggregate net proceeds of approximately $8.5 million. As of September 30, 2011, we had approximately $6.0 million in cash and cash equivalents.
Convertible debt
In April 2011, the convertible debt holders converted the outstanding principal amount of $9.0 million under convertible notes issued in 2007 and 2008 into an aggregate of 4,049,776 shares of our common stock. In addition, we issued 127,318 shares of common stock valued at $0.3 million in lieu of cash payments for accrued interest and 297,682 shares of common stock valued at $0.6 million as a prepayment fee negotiated at the time of conversion. The shares issued for the accrued interest and the prepayment fee were valued at the average closing price of our common stock on AIM under the symbol "PPTR" during the period immediately prior to the conversion.
Capital expenditures
Our capital expenditures related to property and equipment, software development costs, and intangible assets were $1.9 million in 2008, $2.1 million in 2009, $2.4 million in 2010, and $1.6 million during the first nine months of 2011. The year over year increases were primarily the result of capital expenditures to significantly enhance and maintain our processing platform.
Cash flows
| |
Year ended December 31, | Nine months ended September 30, |
||||||||||||||
|---|---|---|---|---|---|---|---|---|---|---|---|---|---|---|---|---|
| |
2008 |
2009 |
2010 |
2010 |
2011 |
|||||||||||
Cash (used in) provided by operating activities |
$ | (7,926,781 | ) | $ | (818,422 | ) | $ | 280,594 | $ | (260,708 | ) | $ | 3,102,479 | |||
Cash provided by (used in) investing activities |
2,418,848 | (2,564,764 | ) | (2,350,507 | ) | (2,212,870 | ) | (1,446,538 | ) | |||||||
Cash provided by (used in) financing activities |
2,897,522 | 6,879,238 | 3,527,589 | (135,985 | ) | (825,942 | ) | |||||||||
Operating activities
Cash provided by operating activities during the nine months ended September 30, 2011 was $3.1 million, primarily comprising $3.1 million cash generated by operations and a net decrease in our operating assets and liabilities of less than $0.1 million. This net decrease in our operating assets and liabilities of less than $0.1 million primarily consisted of a $1.5 million increase in accounts receivable and other current assets, driven by an increase in activity in our multi-currency processing services business during the period, offset by a $1.4 million increase
79
in accounts payable and accrued expenses. Cash generated by operations of $3.1 million was inclusive of net income of $0.6 million and total net non-cash charges of $2.5 million. Significant non-cash adjustments to net income primarily included: (i) depreciation and amortization expense of $1.8 million, (ii) non-cash interest expense on convertible and term debt of $0.3 million, (iii) stock option expense of $0.4 million, and (iv) prepayment fee negotiated at the time of conversion of convertible debt of $0.6 million, offset by the derecognition of other income of $0.7 million related to the expiration of the statute of limitations on a note payable.
Cash used in operating activities during the nine months ended September 30, 2010 was $0.3 million, primarily comprising $0.2 million cash used in operations and a net decrease in our operating assets and liabilities of $0.1 million. This net decrease in our operating assets and liabilities of $0.1 million primarily consisted of: (i) $0.7 million increase in accounts receivable and other current assets, driven by an increase in activity in our multi-currency processing services business during the period, offset by an increase due to merchants of $0.6 million due to increased transaction volume in our ACH business. Cash used in operations of $0.3 million was inclusive of a net loss of $2.8 million, offset by total non-cash charges of $2.7 million. Significant non-cash adjustments to net loss primarily included: (i) depreciation and amortization expense of $1.2 million, (ii) non-cash interest expense on convertible and term debt of $0.9 million and (iii) stock option expense of $0.6 million.
Cash provided by operating activities during the year ended December 31, 2010 was $0.3 million, primarily comprising $1.7 million cash generated by operations offset by a net increase in our operating assets and liabilities of $1.4 million. This net increase in our operating assets and liabilities of $1.4 million primarily consisted of: $1.8 million increase in accounts receivable and other current assets, driven by an increase in activity in our multi-currency processing services business during the period, offset by (i) a net increase due to merchants of $0.2 million due to growth in the ACH processing business and an increase in reserves held on behalf of merchants using our credit card acquiring services as security deposits and (ii) an increase in accounts payable and accrued expenses of $0.2 million due to timing of payments. Cash generated by operations of $1.7 million was inclusive of a net loss of $3.1 million, offset by total non-cash charges of $4.8 million. Significant non-cash adjustments to net loss primarily included: (i) depreciation and amortization expense of $1.8 million, (ii) a software license impairment charge of $1.1 million due to our unsuccessful efforts to sell licenses previously purchased for resale and the write off of the entire asset balance of $1.1 million to operating expenses for the year ended December 31, 2010, (iii) non-cash interest expense on convertible and term debt of $1.1 million and (iv) stock option and warrant expense of $0.8 million.
Cash used in operating activities during the year ended December 31, 2009 was $0.8 million, primarily comprising $0.3 million cash generated by operations offset by a net increase in our operating assets and liabilities of $1.1 million. This net increase in our operating assets and liabilities of $1.1 million primarily consisted of: (i) a decrease in accounts payable and accrued expenses of $1.1 million due to timing of payments, (ii) a $0.5 million increase in settlement assets due to growth in our ACH processing business in 2009 and (iii) a $0.2 million increase in accounts receivable and other current assets, driven by an increase in activity in our multi-currency processing services business during the period, offset by (i) a increase in due to merchants of $0.6 million due to the increase in the business processed in 2009 and an increase in reserves held on behalf of merchants using our credit card acquiring services as security deposits and (ii) a $0.2 million decrease in software licenses. Cash generated by operations of
80
$0.3 million was inclusive of a net loss of $4.2 million, offset by total non-cash charges of $4.4 million. Significant non-cash adjustments to net loss primarily included (i) depreciation and amortization expense of $1.5 million, (ii) non-cash interest expense on convertible and term debt of $1.1 million, (iii) stock option and warrant expense of $1.4 million and (iv) an impairment of a note receivable of $0.3 million.
Cash used in operating activities during the year ended December 31, 2008 was $8.0 million, primarily comprising $6.8 million cash used in operations and a net increase in our operating assets and liabilities of $1.2 million. This net increase in our operating assets and liabilities of $1.2 million primarily included (i) $1.5 million increase in accounts receivable and other current assets, driven by an increase in activity in our multi-currency and payment processing services businesses during the period, (ii) an increase of $1.3 million in settlement assets driven by the acquisition of iPay in 2008 and (iii) an increase in security deposits and other assets of $0.2 million offset by (i) an increase of $1.5 million in due to merchants driven by the acquisition of iPay in 2008 and (ii) an increase in accounts payable and accrued expenses of $0.3 million due to timing of payments. Cash used in operations of $6.8 million was inclusive of a net loss of $11.2 million, offset by total non-cash charges of $4.4 million. Significant non-cash adjustments to net loss primarily included (i) depreciation and amortization expense of $1.2 million, (ii) non-cash interest expense on convertible and term debt of $0.9 million, (iii) stock option and warrant expense of $1.8 million and (iv) bad debt expense recorded of $0.6 million related to trade receivables that were subject to litigation, offset by the recognition of a gain on sale of joint venture of $0.3 million.
Investing activities
Cash used in investing activities for the nine months ended September 30, 2010 and 2011 was $2.2 million and $1.4 million, respectively, which was primarily attributable to our investment in the business through capital expenditures for network infrastructure and investments in software development.
Cash used in investing activities for the year ended December 31, 2010 was $2.4 million, which was primarily attributable to our investment in the business through capital expenditures for network infrastructure and investments in software development.
Cash used in investing activities for the year ended December 31, 2009 was $2.6 million. Of the $2.6 million, $2.0 million was attributable to our investment in the business through capital expenditures for network infrastructure and investments in software development and $0.5 million was attributable to cash contractually restricted under certain acquiring bank sponsor agreements.
Cash provided by investing activities for the year ended December 31, 2008 was $2.4 million. The $2.4 million was attributable to $6.0 million in proceeds from the redemption of investments, partially offset by $1.7 million attributable to our investment in the business through capital expenditures for network infrastructure and investments in software development, $1.2 million attributable to the payment for the acquisition of the iPAY business and $0.5 million attributable to cash held under contract with certain customers.
Financing activities
Cash used in financing activities for the nine months ended September 30, 2010 was not meaningful. Cash used in financing activities for the nine months ended September 30, 2011 primarily consisted of $0.9 million in paid IPO costs.
81
Cash provided by financing activities for the year ended December 31, 2010 was $3.5 million, primarily consisting of $5.7 million in net proceeds from a private placement of 4.5 million shares of our common stock, partially offset by $2.0 million used to pay off term debt.
Cash provided by financing activities for the year ended December 31, 2009 was $6.9 million, primarily attributable to net proceeds from a private placement of 9.7 million shares of our common stock and the issuance of convertible debt. The net proceeds from the private placement and issuance of convertible debt were used for working capital purposes.
Cash provided by financing activities for the year ended December 31, 2008 was $2.9 million, primarily attributable to the issuance of a $3.0 million convertible note. The $3.0 million in proceeds were used for working capital purposes. On April 26, 2011, the convertible debt holders converted the note into shares of our common stock.
Off-balance sheet arrangements
We do not have any off-balance sheet arrangements or relationships with unconsolidated entities or financial partnerships, such as entities often referred to as structured finance or variable interest entities, which are typically established for the purpose of facilitating off-balance sheet arrangements or other contractually narrow or limited purpose.
Effects of inflation
Our monetary assets consist primarily of cash and cash equivalents and receivables, and our non-monetary assets consist primarily of property and equipment, software development and intangible assets, which are not affected significantly by inflation. We believe the replacement costs of property and equipment will not materially affect our operations. However, the rate of inflation affects our expenses, which may not be readily recoverable in the prices of services we offer.
Contractual obligations and commitments
The following table summarizes our contractual obligations as of December 31, 2010:
| |
Total |
Less than 1 year |
1 - 3 years |
3 - 5 years |
More than 5 years |
|||||||||||
|---|---|---|---|---|---|---|---|---|---|---|---|---|---|---|---|---|
Operating lease obligations |
$ | 4,737,892 | $ | 1,479,857 | $ | 1,673,275 | $ | 1,048,313 | $ | 536,447 | ||||||
Capital lease obligations |
500,966 | 265,718 | 225,952 | 9,296 | — | |||||||||||
Acquiring bank sponsorship agreement obligations |
1,209,418 | 206,918 | 377,500 | 600,000 | 25,000 | |||||||||||
Total contractual cash obligations |
$ | 6,448,276 | $ | 1,952,493 | $ | 2,276,727 | $ | 1,657,609 | $ | 561,447 | ||||||
Term debt
In 2003, we entered into an agreement with FHMS and FTB and recorded a liability. Due to a breach of the contractual terms by FHMS and FTB, we did not believe we were liable to repay these amounts. As of March 31, 2011, the statute of limitations had expired on $0.66 million of the $0.7 million balance and as of September 30, 2011, the statute of limitations had expired on the remaining $40,000. For the nine months ended September 30, 2011, we recorded other income due to the derecognition of the note payable in the amount of $0.7 million.
82
Convertible debt
In April 2011, the convertible debtholders converted the outstanding principal amount of $9.0 million under convertible notes issued in 2007 and 2008 into an aggregate of 4,049,776 shares of our common stock. In addition, we issued 127,318 shares of common stock valued at $0.3 million in lieu of cash payments for accrued interest and 297,682 shares of common stock valued at $0.6 million as a prepayment fee negotiated at the time of conversion. The shares issued for the accrued interest and the prepayment fee were valued at the average closing price of our common stock on AIM under the symbol "PPTR" during the period immediately prior to the conversion.
Employment agreements
Pursuant to employment agreements with certain employees, we had a commitment to pay severance of approximately $1.8 million as of September 30, 2011 in the event of termination without cause, as defined in the agreements. Additionally, in the event of termination upon a change of control, as defined in the agreements, we had a commitment to pay severance of $1.9 million as of September 30, 2011.
Uncertain tax positions
We have reviewed and evaluated the relevant technical merits of each of our tax positions and determined that there are no uncertain tax positions that would have a material impact on our financial statements.
Recent accounting pronouncements
In May 2011, the Financial Accounting Standards Board (FASB) issued guidance resulting in common fair value measurement disclosure requirements between U.S. GAAP and International Financial Reporting Standards. Consequently, the amendments change the wording used to describe many of the requirements in U.S. GAAP for measuring fair value and disclosing information about fair value measurements. Some of the requirements clarify the FASB's intent about the application of existing fair value measurement requirements while other amendments change a particular principle or requirement for measuring fair value or for disclosing information about fair value measurements. The amendments in this guidance are effective prospectively for interim and annual periods beginning after December 15, 2011, with no early adoption permitted. This standard will be effective for us beginning with the quarter ending March 31, 2012. We do not expect the adoption to have a material impact on our consolidated financial statements.
In June 2011, the FASB issued an accounting pronouncement that provides new guidance on the presentation of comprehensive income (FASB ASC Topic 220) in financial statements. Entities are required to present total comprehensive income either in a single, continuous statement of comprehensive income or in two separate, but consecutive, statements. Under the single-statement approach, entities must include the components of net income, a total for net income, the components of other comprehensive income and a total for comprehensive income. Under the two-statement approach, entities must report an income statement and, immediately following, a statement of other comprehensive income. Under either method, entities must display adjustments for items reclassified from other comprehensive income to net income in both net income and other comprehensive income. The provisions for this pronouncement are effective for fiscal years, and interim periods within those years, beginning after December 15, 2011, with early adoption permitted. This standard will be effective for us
83
beginning with the quarter ending March 31, 2012. The adoption of this guidance is not expected to have an impact on our consolidated financial statements.
In December 2011, the FASB issued accounting standards update ASU No. 2011-12, Deferral of the Effective Date for Amendments to the Presentation of Reclassifications of Items Out of Accumulated Other Comprehensive Income in Accounting Standards Update No. 2011-05, which defers the effective date pertaining to reclassification adjustments out of accumulated other comprehensive income in Accounting Standards Update 2011-05, Comprehensive Income (FASB ASC Topic 220): Presentation of Comprehensive Income. The provisions for this update are effective for the fiscal years, and interim periods within those years, beginning after December 15, 2011, with early adoption permitted. This standard will be effective for us beginning with the three months ending March 31, 2012. The adoption of this guidance is not expected to have an impact on our consolidated financial statements.
Quantitative and qualitative disclosures about market risk
Interest rate risk
We had cash and cash equivalents totaling $3.8 million, $5.2 million and $6.0 million as of December 31, 2009, December 31, 2010 and September 30, 2011, respectively. Our exposure to interest rate risk primarily relates to the interest income generated by excess cash invested in highly liquid investments. The cash and cash equivalents are held for working capital purposes. We did not have any derivative financial instruments as of December 31, 2009, December 31, 2010 or September 30, 2011. We are not exposed, nor do we anticipate being exposed, to material risks due to changes in market interest rates given the historic low levels of interest being earned on the short-term fixed-rate cash operating accounts.
Foreign currency exchange risk
We have foreign currency risks related to our revenue and operating expenses denominated in currencies other than the U.S. Dollar, principally the Hong Kong Dollar. The volatility of exchange rates depends on many factors that we cannot forecast with reliable accuracy. Although we have experienced and will continue to experience fluctuations in our net income (loss) as a result of transactions gains (losses), we believe such a change would not have a material impact on our results of operations as Hong Kong is not considered to be a highly inflationary or deflationary economy and historically the Hong Kong Dollar has traded in a very narrow band of exchange rates against the U.S. Dollar. Based upon our historical financial statements, for every 1% change in the exchange rate between the U.S. Dollar and the Hong Kong Dollar, our net income (loss) would be impacted by approximately $5,000 and the carrying value of assets on our balance sheet would be impacted by approximately $25,000.
In the event our foreign sales and expenses increase and expand into other currencies, our operating results may be more greatly affected by fluctuations in the exchange rates of the currencies in which we do business. At this time we do not enter into derivatives or other financial activities in an attempt to hedge our foreign currency exchange risk, but may do so in the future. It is difficult to predict the impact any hedging activities would have on our results of operations.
84
Overview
Planet Payment is a leading provider of international payment processing and multi-currency processing services. We provide our services to over 25,000 active merchant locations in 16 countries and territories across the Asia Pacific region, North America, the Middle East, Africa and Europe, primarily through our acquiring bank and processor customers, as well as through our own direct sales force. We provide banks and their merchants with innovative services to accept, process and reconcile electronic payments. Our point-of-sale multi-currency payment processing services are designed for merchants in the retail, restaurant, and hospitality environments. We also provide payment services for e-commerce and mail and telephone order merchants. Our point-of-sale and e-commerce services help merchants sell more goods and services to consumers, and are integrated within the international payment card transaction process enabling our acquiring customers to process and reconcile payment transactions in multiple currencies, geographies and channels. We are a registered third party processor with the major card associations and operate in accordance with industry standards, including the Payment Card Industry, or PCI, Security Council's Data Security Standards.
Our services help banks, processors and merchants enhance revenue, broaden their product set and open new sales channels. Our payment processing services enable the authorization and settlement of payment transactions by providing the connections between the merchant, its bank and the card association. In addition, we provide online access to advanced reconciliation and reporting services and localized language support to our customers. Our flagship offerings are our multi-currency processing services, which include Pay In Your Currency and Multi-Currency Pricing. These services enable merchants to offer customized pricing in multiple currencies. Additionally, acquiring banks, processors and merchants all benefit from the ease of settlement and reporting in their local currency.
Our proprietary, currency-neutral payment processing technology platform enables us to develop and deliver a broad range of international payment services, quickly enter new markets and provide a range of differentiated solutions and analytical tools that are easily integrated within our customers' existing business processes. We provide our customers with worldwide connectivity to our payments infrastructure that is secure, compliant and regularly updated with the latest capabilities, services and functionalities. Our secure platform was developed with next-generation technology, free of many of the traditional legacy constraints of older platforms. It is highly scalable to facilitate growth and meet the needs of new large volume customers, and flexible to provide a broad range of capabilities, including the unique regional requirements of the various markets in which we operate.
We distribute and cross sell our services across a variety of points of sale and e-commerce payment channels with customized solutions in specific verticals, such as hospitality, restaurants and retail. We believe our business model creates powerful network effects which will help drive growth and operating leverage in our business while our contracts, which generally have an initial term of three to five years, offer stability to and enhanced visibility of our financial performance. In 2010, we produced 51% of our revenue internationally and 49% in the United States, and in the first nine months of 2011, we produced 57% of our revenue internationally and 43% in the United States through a recurring revenue model that generates fees every time a purchase is made across our network. We manage our business through two operating
85
segments. For the nine months ended September 30, 2011, our multi-currency processing services represented approximately 65% of our revenue and our payment processing services represented approximately 35% of our revenue.
For the years 2008, 2009, and 2010 and the nine months ended September 30, 2011, our net revenue was $21.2 million, $26.3 million, $30.6 million and $29.5 million, respectively. In the same periods, our net (loss) income was $(11.2) million, $(4.2) million, $(3.1) million and $0.6 million, respectively, and our Adjusted EBITDA was $(7.4) million, $0.3 million, $1.8 million and $3.2 million, respectively. Adjusted EBITDA is a financial measure not calculated in accordance with GAAP. For information on how we calculate Adjusted EBITDA, see "Selected consolidated financial data."
Our history
We were incorporated in Delaware as Planet Group, Inc. in October 1999. In 1999 and 2000, we launched our e-commerce payment processing services in New Zealand and received our first institutional funding. In 2002, we implemented an initial trial for our multi-currency processing service in the United States. In March 2006, our common stock began trading on AIM under the symbols "PPT" and "PPTR." In 2006 and 2007, we signed contracts with a number of acquiring banks and processors in China, Hong Kong, Macau, Malaysia and Taiwan, including Hang Seng Bank and Global Payments Asia Pacific. Also, in 2006, we acquired the assets of Transworld Payment Solutions, which enabled us to become a full-service third-party processor. In 2008, we acquired the iPAY business and related assets, and expanded our Pay In Your Currency service into India. In November 2008, our common stock began trading on the OTCQX under the symbol "PLPM." In 2009, we expanded our full-service processing services into Canada and our Pay In Your Currency service into the Philippines. In 2010, we expanded our Pay In Your Currency service to Brunei, the Maldives, Singapore, South Africa, Sri Lanka, and the United Arab Emirates. Also in 2010, we entered into agreements to provide multi-currency processing services to Global Payments, Inc. for the United States and Canada and renewed or extended our agreements with Vantiv, LLC (formerly known as Fifth Third Processing Solutions) and TSYS Acquiring Solutions. In 2011, we entered into a contract with Vantiv to provide our Pay In Your Currency service at ATMs.
The global payments industry
Industry trends
We operate in the global payments industry, with a specific focus on international payment processing. We believe there are three primary trends which drive growth in our industry:
- •
- continued global shift toward electronic payment transactions;
- •
- increased international travel and commerce; and
- •
- increased e-commerce on a global scale.
Continued global shift toward electronic payment transactions
There has been a significant global shift away from paper-based methods of payment, including cash and checks, towards electronic-based methods of payment, including mobile payments. A growing number of merchants are accepting electronic payments to improve sales and customer convenience. According to The Nilson Report, global card purchase volume is projected to reach $21.9 trillion in 2015, representing a compound annual growth rate, or
86
CAGR, of approximately 15.8% from 2007 global card purchase volume of $6.7 trillion, and, according to the Economic Intelligence Unit, total global consumer spending is projected to reach $45.6 trillion in 2015 from $30.6 trillion in 2007, which represents a projected increase in global card purchase volume from 22.0% of total global consumer spending in 2007 to 47.9% in 2015.
Growth in global card spending
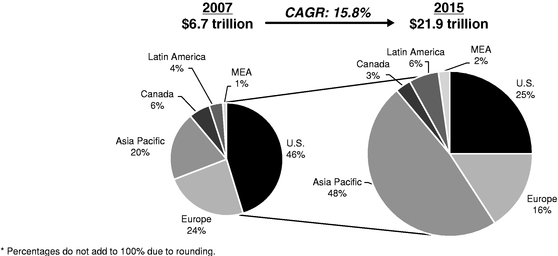
We believe that while card usage growth is a global phenomenon, many large markets are still highly underpenetrated. For example, in 2010, according to The Nilson Report, there was an aggregate of 1,921.9 million payment cards in circulation in Canada, Europe and the United States and, according to the Economist Intelligence Unit, those regions had an aggregate population of 671.4 million people, which represents an average of 2.86 payment cards per person. However, in 2010, according to The Nilson Report, there was an aggregate of 3,983.6 million payments cards in circulation in the Asia Pacific region, Latin America, the Middle East and Africa and, according to the Economist Intelligence Unit, those regions had an aggregate population of 4,889.2 million people, which represents an average of 0.81 payment cards per person.
Increased international travel and commerce
We believe a primary driver of growth in international spending is increasing international travel and commerce. According to United Nations World Tourism Organization, international arrivals are expected to increase by approximately 66% to approximately 1.56 billion by 2020, up from approximately 940 million in 2010. According to the World Tourism and Travel Council, international travelers will spend approximately $1.4 trillion annually by 2014 compared to $1.1 trillion annually in 2010. Visa reported that, for the twelve months ended September 30, 2011, cross-border payments and cash volume grew 14% year-over-year on a constant U.S. Dollar basis and MasterCard reported that, for the three months ended September 30, 2011, cross-border payments and cash volume grew 19% compared with the three months ended September 30, 2010, on a local currency basis.
87
Increased e-commerce on a global scale
With the rapid increase in the number of Internet buyers worldwide, competition among e-commerce merchants is growing and becoming more global. International Data Corporation forecasts that the number of Internet buyers worldwide will expand from 705 million in 2010 to approximately 1.2 billion in 2015 and that the amount of worldwide commerce conducted over the Internet will increase from $8.8 trillion in 2010 to approximately $15.7 trillion in 2015, representing a CAGR of 12.2%. As a result of this rapid growth and the resulting competitive pressures, merchants must focus their resources on attracting consumers to their websites and making the buying decision as convenient and easy as possible.
Industry challenges
As a result of the trends that are driving growth and change in our industry, we believe acquiring banks and processors and merchants are facing new challenges and competitive pressures and are demanding secure, reliable and differentiated solutions to more efficiently and effectively process payments. In addition, we believe consumers are increasingly seeking a more transparent and convenient way to pay.
Acquiring banks and processors
We believe that acquiring banks and processors are eager to secure new revenue streams, expand their customer portfolios and reduce costs, while meeting the dynamic challenges of a rapidly growing global payment processing industry, including keeping pace with heightened security standards and evolving rules and regulations. Growing and retaining a strong and loyal customer base requires acquiring banks and processors to secure competitive differentiators by regularly upgrading their offerings with the latest services, capabilities and functionality. However, many of these acquiring banks and processors may have limited in-house resources to commit to such upgrades and may be constrained in their ability to do so by their older legacy processing systems.
These challenges are compounded as an acquiring bank's merchant portfolio expands, diversifies and becomes more global, due to the increased costs and risks associated with adapting to and complying with the varied business, legal and regulatory environments of different geographies and industries. Acquiring banks seek to enter new markets to increase sales and drive future expansion opportunities. However, when an acquiring bank expands into a new geography or industry, the initial revenue stream derived from that expansion is often not significant enough to justify the major investment required to build their own solutions, and as a result, an acquiring bank may be deterred from expanding into certain geographies or sales channels.
Merchants
To survive and thrive in an increasingly competitive and global marketplace, we believe merchants need electronic payment solutions that improve sales, attract international consumers, enhance the consumer experience at the point of sale and reduce costs. Merchants with global reach may struggle to manage multiple acquiring relationships, processing solutions and point-of-sale systems across geographies. We believe it is important for these merchants, as well as merchants with an online presence or a significant number of international consumers, to capitalize on the continued global shift toward electronic payment transactions, increased international travel and commerce and increased e-commerce on a global scale. Merchants who
88
fail to do so may lose the opportunity to make sales to international consumers and are at risk of losing consumers to competitors that offer native currency pricing.
In the current environment, we believe that merchants want to focus on their core competency of making sales and consider international sales to be too difficult or expensive. In many cases, international payment processing results in additional fees and costs while the additional revenue associated with the foreign exchange margin is captured by the card issuing bank and/or card associations rather than the merchant. As a result, there is no incremental revenue stream to offset the merchant's associated additional costs of international sales.
Consumers
International payment card transactions typically represent an obscure and costly event for the consumer because consumers are often not aware of the final cost of the transaction in their native currency, the exchange rate that will be applied or the additional fees that they will be charged by the card issuing bank. This lack of clarity may cause delay and inconvenience at the point of sale and create difficulties with reimbursement for international business travelers. We believe consumers are also seeking greater transparency regarding transaction fees and are increasingly concerned with the protection of their personal information.
Our solution
Our payment processing and multi-currency processing services are designed to enable acquiring banks and processors and merchants to meet these challenges by integrating our secure and reliable processing platform into their existing systems with advanced services such as consolidated reporting and data analytics. These services are designed to expand the market reach and merchant portfolio of our acquiring bank customers, increase sales and provide an attractive new revenue stream for merchants, and improve the buying experience for consumers.
Acquiring banks and processors
Through our platform, acquiring banks and processors are able to offer differentiated services to merchant customers that enhance merchant loyalty, attract new merchants, and open new sales channels. In addition, by securing a share of the foreign exchange rate margin, our customers gain access to a new, high-margin revenue stream. By partnering with us, our customers get access to our next-generation technology and are able to cost-effectively enhance the processing services they offer to merchants. Our acquiring bank customers also gain a competitive advantage by being able to more easily expand their merchant portfolio and open new sales channels without incurring the significant up-front costs associated with developing an in-house solution to meet the specific business, legal and regulatory needs of a new geography, industry or merchant type. We provide our customers with worldwide connectivity to our leading payments infrastructure that is secure, compliant and regularly updated with the latest capabilities, services and functionalities.
Merchants
Merchants can use our services to attract more international customers, and make the buying experience more convenient and transparent and share in additional fees. Merchants that use our services are also able to provide customized solutions that are adapted for their specific shopping experience. For example, in the restaurant vertical where the payment card is
89
frequently swiped at a location away from the customer, we developed our patented "Cardholder Choice" service, which presents the two currency amounts and disclosure information on the receipt itself and allows the customer to make their selection on that same receipt. Because of the flexibility and scalability of our platform, merchants can enjoy a single processing solution that is integrated and consistent across multiple locations. Our solution also provides merchants with access to valuable reporting data that helps them better understand and capitalize on the purchasing patterns and form-of-payment preferences of their customers.
Consumers
Consumers benefit from the advanced multi-currency services we provide to our customers, enjoying greater clarity as to the final cost of the transaction in their native currency for point-of-sale purchases or online transactions.
Our competitive strengths
Domain leadership in international payments
Since our founding in 1999, we have established deep domain knowledge of international payments and multi-currency payment processing. Our domain leadership position is based on our multi-currency capabilities, patented, per-transaction foreign currency markup technology, our proprietary transaction-level reconciliation, global reporting and data analytics services, and our support for local language and market requirements. Given the breadth of our offerings, the global scope of our services, our brand recognition in the industry and the proprietary nature of our technology, we believe we are one of the leading providers of international payment processing in the world.
Broad international footprint and distribution
We provide our services to more than 45 acquiring banks and processors who offer our payment and multi-currency services to their own network of merchants. We utilize our direct sales force and have leveraged the geographic footprints and distribution capabilities of our acquiring customers to build a diversified base of over 25,000 active merchant locations in 16 countries and territories across the Asia Pacific region, North America, the Middle East, Africa, and Europe. In North America, we offer our payment processing services directly to merchants in certain channels.
Versatile and scalable proprietary technology platform
We have developed and operate a single, currency-neutral payment processing platform that enables us to quickly enter new markets and respond to new opportunities. Our proprietary platform is highly scalable to meet the needs of large volume customers, is highly flexible to provide a broad range of capabilities, and meets the regional requirements of the various markets in which we operate. Given the unified architecture of our single platform, once new enhancements and solutions have been implemented, they are available to all of our customers around the world. Planet Switch is our front-end system, which communicates with the merchant's system and provides transaction authorization, switching and security services. These security services include tokenization, encryption and region specific offerings. Additionally, Planet Switch uses our patented foreign currency-rate setting methodology to enhance flexibility for us and our customers. Merchant Accounting System, or MAS, is our back-end system, which makes a financial record of transactions as between a merchant, acquirer and a
90
card association; calculates, effects settlement and prepares statements of payments, costs, losses and adjustments with respect to transactions. MAS also comprises our reconciliation, reporting and transaction settlement system, which provides settlement services in any currency supported by the card associations, fraud and risk management services, as well as web-based reporting and email alerts with local language support. Our platform has dedicated endpoints which allow us to connect directly to Visa, MasterCard, American Express and JCB, and provide an end-to-end service for our customers, without the need for third-party processors. We also provide a proprietary Internet payment gateway service, iPAY Gateway, which we acquired in 2008 and is fully integrated into our platform, to provide a range of online payment processing services to e-commerce customers.
Differentiated and innovative suite of payment services
Our proprietary platform offers a broad range of domestic and international point-of-sale and e-commerce processing services, which utilize our patented rate mark-up methodology. Our suite of services is comprised of our:
- •
- Payment processing service that provides end-to-end processing of both
domestic and multi-currency transactions, including authorization, capture, clearing and settlement services, to our customers along with support for local language and market requirements and online
access to our advanced reconciliation, reporting and analytics services.
- •
- Pay In Your Currency service that enables international consumers to make
purchases in their own currency for greater transparency, while merchants enjoy the ease of settlement and reporting in their local currency. Additionally, we expect to launch a new service in the
first quarter of 2012 that will enable international consumers to view the final amount in their native currency when withdrawing local currency at an ATM.
- •
- FX Assured service that utilizes our patented foreign currency exchange
rate-calculation methodology that enables merchants to offer their consumers a lower individualized exchange rate than would otherwise have been charged to the consumer by their credit card provider.
- •
- Multi-Currency Pricing service that enables Internet, point-of-sale, and
mail order and telephone order, or MOTO, merchants to target international consumers by allowing them to view pricing and make purchases in their home currencies.
- •
- iPAY Gateway that provides fully-integrated domestic and multi-currency
processing services with connectivity to a range of processors that enables acceptance of all major payment types and methods. iPAY also provides other card-not-present payment services such as
subscription and recurring billing services, fraud and security tools and a virtual terminal.
- •
- Global Consolidated Reporting and Data Analytics that provide merchants with valuable insights into their operations, with in-depth profiles of customer spending habits and country of origin and enables them to create personalized marketing programs to attract international consumers.
Customized vertical specific solutions
We leverage our platform and services to create a suite of customized solutions for specific verticals and channels that we believe provide a differentiated value proposition for our customers. For example in the hospitality vertical, we have developed multi-currency solutions
91
that accommodate the complexities associated with payments at check-in and check-out. Within the retail vertical, we designed a service that enables a consumer to view and select side-by-side pricing in two currencies utilizing customer-facing signature capture devices. We have also created solutions for specific point-of-sale systems, such as support for MICROS integrated systems, which enable merchants to utilize our multi-currency processing services easily without any further integration. For the e-commerce vertical, our iPAY service provides customers with fully integrated domestic and multi-currency processing services.
Business model with network effects
We believe there are significant and powerful network effects in our business model, which will help drive growth and operating leverage in our business. We believe that these network effects are at an early stage of development and will be a material driver of growth in the future. As we continue to add new acquiring bank and processing customers, we gain the benefits of their sales force and distribution capabilities as well as their network of merchants. As we gain additional market penetration, our customers' competitors have recognized the value we provide and have sought to partner with us to provide our services. As we board new merchants, we gain additional market penetration and we are able to demonstrate the benefits of our services to other merchants who may also choose to implement our services.
Our strategy
We seek to extend our leading position and enhance the network effects in our business model by continuing to penetrate our existing markets and expand in new geographies and market segments. Our goal is to continue to deliver innovative payment services to our customers that help merchants sell more goods and services and improve their business efficiencies. The key components of our strategy include:
Continued focus on existing customer base
We intend to continue to collaborate with our existing acquiring bank and processor customers in order to increase participation by merchants in the various services that we offer together. We believe that based solely on our existing acquiring bank and processor customers, we have a large addressable market, which consists of their existing pool of merchants, as well as additional merchants that they may acquire in the future. Our relationship sales and marketing staff are continuously working with our customers to help these channels achieve increased sales, as well as improve usage and opt-in to our services among existing merchants.
Cross-sell to existing customers
We intend to continue to cross sell our innovative services to our acquiring banks and processors, and merchants. Our range of services and solutions enable cross-selling opportunities that are intended to increase revenue from our existing customers by helping them broaden their product set with additional value-add services. We intend to continue to demonstrate to our customers how they can leverage our unified global platform and enhanced services to improve operational efficiency. For example, an existing customer for Pay In Your Currency at the point of sale has recently agreed to expand their use of our services to include Pay In Your Currency at ATMs, which we expect to launch in the first quarter of 2012. We believe these cross-sale opportunities are at a very early stage of penetration and represent a significant incremental margin opportunity for us because there are lower customer acquisition and integration expenses.
92
Add new customers
Our sales and business development group will continue to target new acquiring banks and processors and merchants in existing regions. We believe acquiring banks and processors are seeking differentiated turnkey solutions, such as ours, to provide them with international payment processing services and multi-currency processing capabilities, which they can offer to merchants. We believe merchants are increasingly seeking global payment processing services, such as ours, that are integrated into their existing business processes, enabling them to consolidate reporting and data from different international business units, regardless of geographic location or sales channel. Additionally, we believe merchants are seeking services such as ours to streamline their operations by reducing the number of different point-of-sale technologies that they need to support their global businesses.
Enter new markets
We are leveraging our platform to enter new geographies and business sectors. We are working to implement our services in new countries to expand our footprint and support the growth of our customers. We are targeting geographies with higher levels of international purchase volume, such as in the Latin American region. We are in discussions with a number of prospective customers in the region, some of which we anticipate may lead to contractual arrangements in the near future. We are also expanding into additional business sectors where we can offer our differentiated technology and services, such as our recent announcement of our Pay In Your Currency service at ATMs. We believe the expansion of our services will increase our market opportunity and continue to facilitate our growth into the future.
Enhance our technology platform capabilities
We will continue to use our technology resources to develop advanced platform capabilities in order to enhance our market position and enable our customers to retain and attract new business. We believe that platform enhancements, whether driven by changes in the marketplace or regulatory requirements, will lead to increased revenue. For example, adding support for the EMV international payment card standard, also known as "chip and PIN," as required in certain regions, significantly opened the market opportunity for our multi-currency processing services around the world. We have also developed platform improvements, such as card data tokenization and encryption, support for local and regional interchange, and broadening support for integrated point-of-sale systems, such as MICROS, which we believe will continue to expand the addressable market for our services.
Develop new services and solutions
As the payment industry continues to evolve, we aim to be at the forefront by developing new services and solutions that leverage our platform and core competencies and thereby enable us to enter new markets, attract new customers and retain existing ones. We believe the development of new services and solutions will be an important revenue source in the future, enable us to continue to differentiate our platform and capabilities, and accelerate the network effects of our business model. For example, we are developing innovative mobile payment and mobile commerce solutions for our partners and channels that leverage the core competencies of our payment processing platform. We have also leveraged our platform and services to develop new solutions for our customers. Additionally, we have begun to host the MICROS Payment Gateway to enable users of MICROS integrated point-of-sale systems around
93
the world to directly access our international payment processing and multi-currency processing services.
Pursue selective acquisitions
We intend to selectively pursue acquisitions that will help us achieve our strategic goals, enhance our technology and capabilities, and accelerate growth. For example, in 2008, we acquired the assets of iPAY and its associated merchant processing portfolio, which provided us with an Internet payment gateway and enabled us to offer end-to-end e-commerce payment processing. We believe pursuing these types of acquisitions will increase our ability to work with existing customers, add new customers, enter new markets, develop new services and enhance our processing platform capabilities. However, we have no commitments with respect to any such acquisitions at this time.
Our services
We provide a range of international payment processing and multi-currency processing services that are integrated within the payment card transaction flow. Our services enable our customers to process and reconcile payment transactions in multiple currencies, geographies and channels at the point-of-sale and through e-commerce, including:
Payment processing
Our advanced payment processing services provide an end-to-end solution for our customers. When a merchant wishes to accept a payment using a payment card, we receive an authorization request from a merchant's point of sale. In real time, we submit that transaction to the card associations for authorization by the card issuer. Upon receipt of an authorization (or decline) we return the message to the merchant, which then completes the transaction with the cardholder. At the end of each day, we capture all of the transactions processed during the day for each merchant and submit them to the card associations as part of the clearing and settlement process. Thereafter, we reconcile and provide reporting to our customers on the transactions that have been processed. We provide these services for major credit and debit card types, for both EMV and magnetic stripe transactions. While our primary differentiator is in the area of international payment processing, we also provide value-add domestic processing that utilizes the same authorization, settlement and reporting systems for local currency payment card transactions.
On the front end, our authorization and capture processing services are integrated into the transaction flow of acquiring banks and processors to provide seamless support to merchants in card-present and card-not-present environments with multi-currency functionality. Our processing services support authorization of various regional card and debit payments, including: Visa; MasterCard; American Express; Discover; Diners Club International; JCB; Interac; and Maestro.
Using our front-end processing services, merchants are able to: accept many forms of payment, including major credit cards, debit cards and Automated Clearing House, or ACH, payments; accept payments online or at physical points of sale; and provide fraud and security protection, including customized access control, fraud monitoring tools and post-clearing exception flag generation.
94
On the back-end, we deploy a single, flexible and scalable platform that supports acquiring banks, processors and merchants across multiple geographies and payment systems. The key functions of our Merchant Accounting System, or MAS, include:
- •
- clearing to the major card associations;
- •
- intra-country, intra-regional and international interchange support;
- •
- flexible merchant pricing structures, including bundled, unbundled, pass through, 2-tier and
3-tier pricing;
- •
- online exception and chargeback management tools;
- •
- per-transaction FX markup methodology that calculates exchange rates, which vary by region, and by merchant;
- •
- flexible exchange rate sourcing; and
- •
- multiple language support for acquirers and merchants, including the ability to support double-byte character sets, such as for Mandarin and Cantonese.
As part of our processing services we also offer our acquiring bank and processor customers advanced transaction reconciliation and reporting services, including the capability for segregated reporting by region, market and currency, available via the Internet, at all times, at the touch of a button.
Multi-currency processing
Our flagship offering is multi-currency processing, which empowers acquiring banks, processors and merchants to provide Pay In Your Currency and Multi-Currency Pricing by means of our single, currency-neutral proprietary payment processing technology platform.
Our multi-currency processing services are designed for a variety of payment environments, from customer-facing terminals to fully integrated front-desk systems or through either our online e-commerce gateway or a third-party e-commerce gateway. In addition, Vantiv, LLC has recently agreed to expand its use of our services to include Pay In Your Currency at ATMs, which we expect to launch in the first quarter of 2012.
Pay In Your Currency
Pay In Your Currency is a customer service feature in which a payment card purchase initially priced in the merchant's local currency is converted, after the card is presented, in real time at the point of sale into the consumer's native currency while the merchant continues to receive settlement in its local currency. We believe this creates a personalized shopping experience and allows international consumers to enjoy the clarity and convenience of paying for their purchase or ATM withdrawal in their native currency.
95
To further illustrate the advantages of Pay In Your Currency, the chart below sets forth a representative transaction flow for processing: (1) a traditional card-based payment by a U.S. consumer to a Hong Kong merchant; and (2) a card-based payment by a U.S. consumer to a Hong Kong merchant using our multi-currency service:
| |
Traditional cross-border transaction (U.S. Dollars and Hong Kong Dollars) |
Planet Payment Pay In Your Currency transaction (U.S. Dollars and Hong Kong Dollars) |
||
|---|---|---|---|---|
| Consumer |
The U.S. consumer presents the Hong Kong merchant with a payment card. The consumer will not know the final cost of the transaction in U.S. Dollars (the sum of fees, foreign exchange rate and cost of the purchased item) until receipt of his or her card statement. | The U.S. consumer presents the Hong Kong merchant with a payment card and the merchant offers the consumer a choice of paying in U.S. Dollars or Hong Kong Dollars. The consumer knows the final transaction amount in U.S. Dollars before the sale is completed. | ||
Merchant |
The merchant terminal transmits the card information and transaction amount (in Hong Kong Dollars) to the acquiring bank or its third-party processor. |
If U.S. Dollars are selected, the merchant (1) uses our technology to show the consumer the price in U.S. Dollars and the exchange rate with a margin agreed to by Planet Payment and the acquiring bank and (2) transmits the card information and transaction amount (in U.S. Dollars) to Planet Payment (on behalf of the acquiring bank). |
||
Acquiring Bank/Processor |
The acquiring bank or its third-party processor submits the authorization request (in Hong Kong Dollars) to the card association. Upon eventual settlement of the transaction by the card association, the card association pays the acquiring bank the amount of the charge in Hong Kong Dollars, so that the acquiring bank can pay the merchant what it expects to be paid in the merchant's local currency. |
We (on behalf of the acquiring bank) submit the authorization request (in U.S. Dollars) to the card association. Upon eventual settlement of the transaction by the card association, the card association converts the amount back to Hong Kong Dollars and pays the acquiring bank, so that the acquiring bank can pay the merchant what it expects to be paid in its local currency. The margin that was included in the exchange rate is shared by the acquiring bank, the merchant and Planet Payment. |
||
Card Association (Visa or MasterCard) |
The card association typically (1) converts the amount from Hong Kong Dollars into U.S. Dollars using their internal treasury rates and (2) routes the authorization request in U.S. Dollars to the card issuing bank for response. |
The card association routes the authorization request in U.S. Dollars to the card issuing bank for response. |
||
Card Issuing Bank |
The card issuing bank approves or declines the transaction and that response is transmitted back through the chain to the merchant. Upon eventual settlement of the transaction (1) the card association charges the card issuing bank and the acquiring bank certain fees for the international transaction and (2) the card issuing bank reflects the final cost of the transaction (the sum of fees, foreign exchange rate and cost of the purchased item) on the consumer's card statement in U.S. Dollars. |
The card issuing bank approves or declines the transaction and that response is transmitted back through the chain to the merchant. Upon eventual settlement of the transaction (1) the card association charges the card issuing bank and the acquiring bank certain fees for the international transaction and (2) the card issuing bank reflects the final cost of the transaction on the consumer's card statement in the consumer's native currency, U.S. Dollars, as agreed to by the consumer at the point of sale. |
||
FX Assured
FX Assured is an enhanced customer service feature for merchants that couples the convenience and clarity of Pay In Your Currency with the added benefit of our "Best Rate Guarantee" service. Using our patented rate-calculation methodology, we offer consumers
96
individualized exchange rates calculated, in real time, to be better than the effective exchange rate that would have been charged by the consumer's card issuing bank.
Multi-Currency Pricing
Merchants use Multi-Currency Pricing, primarily in e-commerce, to target and reach international markets more effectively by offering their customers the ability to view pricing in multiple currencies and pay in the currency of their choice. With Multi-Currency Pricing, the merchant continues to receive settlement in its preferred currency, thereby enabling each party to the sale to transact business in the currency of their choice.
With Multi-Currency Pricing, the merchant prices its goods and services in various currencies and the customer makes the decision to purchase the goods and services in the currency of their choice. The consumer then presents his or her card at the point of sale and completes the transaction in the chosen currency as displayed by the merchant, and as far as the consumer is concerned no conversion takes place. The transaction is submitted to the card associations in the chosen transaction currency. Upon settlement by the card association to the acquiring bank, the transaction is converted back into the merchant's settlement currency so that the acquiring bank can pay the merchant what it expected to be paid for the transaction in its local currency.
iPAY Gateway
Our iPAY service, which we acquired in 2008, provides PCI-compliant payment gateway services for e-commerce, call center, mail-order and telephone order merchants. iPAY provides our customers with fully integrated domestic and multi-currency processing services, which we believe are highly differentiated in the marketplace. iPAY enables acceptance of all major payment types and methods and offers merchants flexibility in configuring iPAY to meet their business and processing needs. We are currently providing iPAY to customers in the United States and Canada and have recently made it available to our customers in all other regions where we operate.
Our broad range of services to both business-to-business and business-to-consumer merchant platforms include credit card, purchase card, and debit card acceptance and multi-currency processing. Using the iPAY recurring billing engine, merchants can track various customer billing and payment data, define payment schedules and offer trial periods. Our secure tokenization and sophisticated fraud and chargeback management tools help merchants manage the risks of conducting business in a card-not-present environment. In 2011, we integrated our iPAY gateway with VendorShop's Facebook shopping cart application creating a social commerce solution that allows Facebook merchants to accept credit cards through any participating acquiring bank integrated into our platform. All of the above services can be supported as a fully-integrated solution within our platform or can be integrated with the platforms of other supported processors.
Mobile payment solutions
As payment systems quickly move to mobile devices, a multitude of mobile payment solutions and technology are competing in the marketplace. Our early-stage mobile commerce application, BuyVoice, uses voice-recognition technology to accept payment from any mobile phone. In the future, we also intend to develop additional international mobile payment solutions that leverage our core multi-currency processing capabilities and are hand-set or technology agnostic.
97
Global consolidated reporting and data analytics
Our global consolidated reporting and data analytics offer merchants valuable insights into their operations. These services provide in-depth profiles of consumers' spending habits and country of origin. We also offer customer dashboards that allow merchants to create personalized marketing programs to attract international customers. We have identified a growing need for information and content management, as businesses are generating data from a wide range of internal and external sources. Expansion into new foreign markets frequently complicates a business' information streams, due to additional factors such as the introduction of different reporting systems and languages. Our centralized reporting platform can provide transactional data in a uniform, consolidated on-line format across a merchant's international operations with the ability to focus upon selected data according to a merchant's particular requirements.
Customer service
We offer a full service customer support center based in our Delaware and Hong Kong facilities. Calls are answered and we respond to critical issues 24 hours a day, seven days a week. The call center is divided into consumer, merchant and corporate services teams to help streamline the process. These teams are trained to deal with Level I type issues, which involve support for our direct merchant portfolio in North America, where we are the first point of contact. Level II type issues, where we are supporting our acquiring bank and processor customers on their technical issues and in response to more difficult Level I type issues our customers receive from their merchants, are escalated to the appropriate support team (in the United States or Hong Kong) for resolution via a problem ticket management system. All calls are entered as cases into a customer relationship management case management system to ensure integrity and continuity of service.
Our acquiring banks and processors
We provide our services to more than 45 acquiring banks and processors in 16 countries and territories across the Asia Pacific region, North America, the Middle East, Africa and Europe. Our relationship with acquiring banks and processors provides us with broad market coverage by leveraging their distribution network and global portfolio of merchants. Our acquiring bank and processor customers include: Global Payments, Inc., Network International LLC, Vantiv, LLC (formerly known as Fifth Third Processing Solutions), Standard Chartered and TSYS Acquiring Solutions. In 2010, Global Payments, Inc. represented 30% of our revenue and in the first nine months of 2011, Global Payments, Inc. and Network International LLC represented 29% and 10% of our revenue, respectively.
We typically enter into three to five year contracts with our acquiring banks and processors, which contain "evergreen" renewal clauses, so that they automatically renewed for a further period, unless one party positively terminates the contract. Our acquiring banks and processors typically either renew or extend their contracts at the expiration of the term.
Our sponsor banks
In order to offer card acquiring services for Visa, MasterCard and Discover transactions, we must be sponsored by a financial institution that is a principal member of the Visa, MasterCard and Discover networks. The sponsor bank must register us with Visa as an independent sales organization and with MasterCard as a member service provider. We have therefore entered into sponsorship agreements with member banks of the Visa, MasterCard and
98
Discover networks, which we refer to as our sponsor banks, that allow us to offer card acquiring services directly to merchants.
The sponsorship agreements with our sponsor banks require, among other things, that we abide by the laws and regulations of the Visa, MasterCard and Discover networks. Pursuant to the sponsorship agreements, we are required to pay bank sponsorship fees. These fees are included in our consolidated statements of operations as "payment processing service fees." If we breach a sponsorship agreement, our sponsor bank may terminate the agreement and, under the terms of the agreement, we are entitled to a reasonable transitional period to make arrangements with an alternative sponsor bank.
Our merchants
We provide our services to over 25,000 active merchant locations around the world. We serve these merchant locations, either indirectly through our acquiring banks and processors or directly through our sales force, and deliver innovative payment services that help merchants sell more goods and services. As of September 30, 2011, our active merchant locations grew 84% compared to September 30, 2010. 26% of the multi-currency processing services transaction volume processed in September 2011 was attributed to new merchants activated in the 12 months ended September 30, 2011. For the 12 months ended September 30, 2011, multi-currency services processing transaction volume from retail, lodging, e-commerce, restaurant, and MOTO merchant locations composed 45%, 40%, 7%, 7%, and 1%, respectively, of the total multi-currency processing transaction volume we processed during that period.
Sales and marketing
Our sales force is comprised of business development, key account relationship management and direct sales professionals responsible for developing and maintaining our relationships with our customers. Our sales force is focused on supporting our current customers, as well as nurturing relationships with prospective customers in key international markets. Our relationship managers support the development of sales presentation materials and training of our customers' sales personnel to assist them in marketing our services, either directly or indirectly, to merchants. We also directly train and support selected key merchants' employees and technology providers in order to grow active merchant locations, increase utilization of our services and solidify relationships. In addition, we employ a direct sales force which targets merchants in North America for our payment processing services.
Our marketing staff is focused on marketing our company, our services and our acquiring bank and processor customers' services. Managing our corporate website presence is a key responsibility for the marketing team, with a focus on acquiring bank and processor acquisition and describing our services to merchants. Since we allow our acquiring bank and processor customers to market our services under their own brands, our marketing team also assists our customers with the development of marketing materials to encourage adoption of our multi-currency processing services.
As of December 31, 2011, our sales and marketing team consisted of 32 full-time employees supported by outside marketing and design professionals.
Technology
We believe that our wholly owned, currency-neutral processing platform is a major reason why leading international banks and processors use our services. The platform enables us to operate
99
as an international independent third-party processor with direct connectivity to card associations around the world. Since our platform is maintained internally, we are able to efficiently respond to customer needs and market opportunities. Our platform consists of seven synchronized processing centers linked by a global telecommunications network. Our primary data centers are located in secure facilities in Elmsford, New York, and New Castle, Delaware. We also host facilities in Bermuda, Shanghai and Macau and host two facilities in Hong Kong, through co-location arrangements. The following is a summary of key attributes of our processing platform:
- •
- Singular platform. We operate a single platform that supports all the
currencies, languages and regional card products that we offer our customers. Our platform is built on a unified architecture with a centralized database as opposed to the processing platforms of some
of our primary competitors that use a regionalized architecture and regionalized database. Our singular platform enables consistency in our services, rapid response to emerging technologies and
changing industry standards, and allows us to efficiently offer our services across geographies. Merchants operating across multiple territories can conveniently access a consolidated view of their
transaction activity and use their preferred point-of-sale technology. As a result, our merchants can deliver a consistent customer experience in any region, which reduces implementation costs and
customer training for both sales and operations.
- •
- Individualized exchange rates. Our acquiring banks and merchants can use
our patented technology to offer individualized exchange rates for each transaction based on a number of different factors, including merchant location, the customer's native currency and any special
offers. The platform can also accept multiple exchange rate sources and provide rate guarantees for a specific time period; for example, for e-commerce merchants where delivery of the
product may take place several days after the payment transaction.
- •
- Scalability. Our platform can expand to add new banks and merchants,
increase transaction volumes and enter new markets. Our unified global platform utilizes a distributed architecture, which improves flexibility and scalability. The number of payment card transactions
that we can process is limited by the number of transactions per second that can be processed by our authorization system and the storage limits of our MAS. We have developed sophisticated exception
management processes and procedures that are critical to maintaining our ability to scale effectively by allowing us to monitor and fine-tune our processes as transaction volumes increase. We have
been able to increase the capacity of both systems by installing additional hardware on a managed, modular basis on a single platform without significant increases in capital expenditures.
- •
- High level of security. Given the sensitive nature of the consumer data
that we process and the strict security requirements of our acquiring bank customers, we built our platform with a strong focus on system security. We utilize next generation security safeguards using
third party hardware and software encryption, as well as our proprietary tokenization services. Our platform is compliant with the PCI Security Council's Data Security Standards and is annually
audited and certified by an independent security assessor. We proactively monitor our systems and network for any security threat and we are constantly maintaining and improving the security features
of our platform to help our customers minimize risk.
- •
- Reliability. Our global telecommunications network and processing centers are designed for redundancy and fail-over. During the two years ended December 31, 2011, our two core processing platform components, MAS and Planet Switch, each had average system uptime availability of at least 99.9%.
100
Processing platform components
The platform was designed with a modular architecture to enhance scalability and easily offer additional components. The primary components of our processing platform include (1) MAS, (2) Planet Switch, (3) iPAY, and (4) our card association endpoints.
Merchant Accounting System. MAS creates end-of-day clearing files to the card associations, reports on merchant and acquiring bank transaction activity, creates and transmits payment instructions for our acquiring banks, and serves as the system of record for our Pay In Your Currency and multi-currency payment processing services. MAS tracks foreign exchange fluctuations on a daily basis to facilitate comprehensive reconciliation of each aspect of the credit card authorization and settlement processes.
MAS is a unified transaction processing system, for all regions, all currencies and all languages that we support, with a web-based management and reporting interface for use by our back-office staff, acquiring bank back-office staff, and merchants. The customer facing web-application and reporting infrastructure currently supports Cantonese, English, French, Canadian French, Mandarin, Portuguese and Spanish. MAS also provides acquiring banks and processors and merchants with comprehensive reporting of the status of their transactions and funding cycles as well as other pertinent credit card operational needs including image processing, chargebacks, retrievals and representments.
Planet Switch. Planet Switch is an authorization host for both domestic and foreign transactions. Planet Switch also functions as a point-of-sale terminal and integrated system driver and end-of-day reconciliation host for credit card transactions. Planet Switch was designed for multi-currency payment processing and supports our real-time foreign exchange logic at the point of sale. Planet Switch receives the inbound authorization request, converts the sale amount into the consumer's home billing currency, and forwards the request to the card association endpoints for completion.
iPAY Gateway. We offer a fully integrated e-commerce gateway differentiated by its multi-currency capabilities that processes all major card brands and ACH transactions. Additionally, iPAY has a virtual terminal payment application for MOTO transactions and enables recurring payments. Given the increased risk of fraud associated with a card-not-present environment, we offer our own and third party advanced fraud monitoring, tokenization and other security tools to protect acquiring banks, merchants and consumers.
Card association endpoints. We have the capability to submit transaction data directly to Visa, MasterCard, American Express and JCB in the regions in which we do business, through leased hardware provided by Visa or MasterCard and certified interfaces to American Express and JCB. This capability enables us to control the transaction flow and eliminates the need to use third-party processors. In order to utilize these endpoints, we have built support for interchange qualification in the United States, Canada, the Asia Pacific region, the European Union, the Middle East and Africa and have the ability to quickly and effectively develop support for additional local card brands and regional interchange regimes.
Platform innovation
We will continue to use our technology resources to develop advanced platform capabilities in order to enhance our market position and enable our customers to retain and attract new business. Given the unified architecture of our single platform, once new enhancements and solutions have been implemented, they are available to all of our customers around the world. During 2011, we continued to enhance our proprietary systems in order to offer acquiring
101
banks, processors, and merchants increased opportunities to capture additional revenue with new services. For example, in 2011:
- •
- we developed multi-currency processing support for ATMs hosted by acquiring banks, certified through the Cirrus
(MasterCard) network;
- •
- we developed a hosted process for Verified by Visa and MasterCard Securecode authorization for e-commerce merchants;
- •
- we integrated with and launched our hosted MICROS Payment Gateway; and
- •
- we added additional language support, including Canadian French, building on our existing support in Canada, as well as and Spanish and Portuguese to support our expansion initiatives in Latin America.
In 2012, we are continuing to use our technology resources to develop enhanced platform capabilities, including both hosted and non-hosted ATMs, money transfer and integrating into China UnionPay.
Technology partners
In order to facilitate the provision of our services, technology and service providers to the electronic payments industry, including point-of-sale system providers, such as e-commerce gateways, terminal manufacturers and other processors, have certified their solutions to our platform. Our technology partners, once integrated to our platform, have the ability to support merchants wherever they are, without having to replicate development efforts to connect to different regional platforms. We have comprehensive implementation documents to guide our technology partners through development and a team of implementation and certification specialists to assist in the process.
Competition
We compete in the global payments processing marketplace, with segments of our services competing against international payment processors, multi-currency payment service providers and global e-commerce payment service providers.
International payment processors
Currently, there is a high level of concentration in the international payment processing industry, with a few large processors providing payment card processing services to acquiring banks on a multi-national and multi-regional basis. The payment processing industry is mostly regionalized, with many acquiring banks and processors providing services focused specifically on their local region or country. International processors with whom we compete include: First Data Corporation, with its OmniPay Limited subsidiary operating a multi-currency platform; Elavon, Inc., a wholly owned subsidiary of U.S. Bancorp, that operates in North America and Europe; and WorldPay (UK) Limited, formerly owned by Royal Bank of Scotland Group, PLC, that also primarily services the North American and European markets. We compete with these entities primarily based on the specialized solutions and quality of services that we provide. While we compete with international payment processors for acquiring bank customers, in certain situations, we also work cooperatively with them to process transactions. International processors with whom we currently partner under multi-currency processing agreements, include Global Payments, Inc. in the Asia Pacific region, the United States and Canada, and First Data Corporation under its Merchant Solutions joint venture with Standard Chartered Bank in the Asia Pacific region. We also work with large, regional processors under multi-currency processing agreements, including TSYS Acquiring Solutions in the United States, Vantiv, LLC
102
(formerly known as Fifth Third Processing Solutions) in the United States, and Network International LLC in the Middle East. We may also compete against prospective acquiring bank customers that may prefer to develop and offer their own payment processing solution. We believe the payment industry will continue to consolidate and outsource processing to benefit from access to new services without significant investment or modifications to their existing systems.
Multi-currency payment service providers
The multi-currency payment service industry is largely segmented among large, international processors, which provide multi-currency processing services as part of their broader international payment processing service, including those referenced above, and smaller companies who work on a regional or local basis to provide DCC or multi-currency processing services on behalf of acquiring banks or merchants. Specialized DCC providers include: FEXCO Holdings; Travelex Holdings Limited; Global Blue; Monex Financial Services Limited; Pure Commerce Pty Ltd; Fintrax Group Holdings; and Continuum Commerce Ltd. (formerly known as GCX—(Global Currency Exchange Limited)). Since many of these competitors come from the foreign exchange sector, their business models are based upon trading settlement currencies. As a result, many of these companies work with a multi-currency enabled acquiring bank or processor, which we believe gives rise to additional complexity and inefficiencies in implementation and processing. We compete with these companies primarily based on the quality of our offerings and process efficiencies. Some of these competitors may attempt to compete with us by significantly undercutting our prices or offering substantial incentives.
Global e-commerce payment service providers
In the global e-commerce payment space, our Multi-Currency Pricing and iPAY services compete with several international online payment service providers, including CyberSource Corporation, a subsidiary of Visa, MasterCard International Gateway Services, or MIGS, PayPal, Inc., GlobalCollect, WorldPay (UK) Limited, and Payvision. In the Asia Pacific region, we compete against regional providers, including AsiaPay Limited, JETCO, and eNETS Pty Ltd, but also support MIGS. We compete with these entities primarily based on the specialized solutions and quality of services that we can provide, in addition to price. In North America, a number of locally-focused payment gateway providers primarily concentrate on delivering domestic online payment services. Our iPAY service competes with them based on the specialized multi-currency solutions we offer. We also work cooperatively with several payment gateway providers to offer multi-currency pricing services online, including USAePAY and Plug'n Pay.
Regulatory and legal environment
Our customers are subject to numerous laws and regulations applicable to banks and other financial institutions in the United States and elsewhere and, as a consequence, our business is affected by such laws and regulations. Our contracts with acquiring banks and processor customers mandate us to comply with applicable laws and regulations in the United States and in the various locations in which we and our customers operate, including:
- •
- banking regulations, and monetary and other governmental authority requirements relating to the processing of payment card
transactions;
- •
- anti-money laundering laws, regulations and related requirements, such as the USA PATRIOT Act in the United States;
103
- •
- privacy and data security regulations, including rules regarding safeguarding personal information, such as rules
implementing the privacy provisions of Gramm-Leach-Bliley Act, or GLBA, in the United States;
- •
- U.S. Internal Revenue Service, or IRS, and other taxing authority reporting requirements;
- •
- card association and payment network organization rules; and
- •
- other laws and regulations.
Banking regulations
The financial services industry is subject to significant legislative and regulatory scrutiny. Interchange fees, which are typically paid by the acquiring bank to the card issuing bank in connection with transactions, are being reviewed by regulatory authorities and central banks in a number of jurisdictions in which we operate and are subject to increasingly intense legal, regulatory, and legislative scrutiny worldwide. For instance, in the United States, the Dodd-Frank Wall Street Reform and Consumer Protection Act, or Dodd-Frank Act, will, through regulations adopted by the Federal Reserve Board in June 2011, regulate the fees charged or received by issuers for processing debit card transactions. Regulatory actions such as this one, even if not directed at us, may have a significant and negative impact on our customers in the United States because they may require significant efforts to change our systems and services and may require changes to how we price our services and solutions to our current and potential customers. We do not expect that the Dodd-Frank Act or other regulations governing interchange fees will have a significant negative effect on our business, as our business model is predominantly based on credit cards and we are primarily serving acquiring banks outside of the United States that are not subject to the Dodd-Frank Act. However, we cannot predict the effect of these and any prospective regulatory changes on our customers, our operations and financial condition.
In 2010, the Canadian Ministry of Finance issued a voluntary Code of Conduct relating to various issues for payment card industry participants in Canada. Visa and MasterCard adopted the Code of Conduct, effective in February 2011, in the form proposed by the Canadian government. The purpose of the Code of Conduct is to demonstrate the industry's commitment to:
- •
- ensuring that merchants are fully aware of the costs associated with accepting credit and debit card payments, thereby
allowing merchants to reasonably forecast their monthly costs related to accepting such payments;
- •
- providing merchants with increased pricing flexibility to encourage consumers to choose the lowest-cost payment option;
and
- •
- allowing merchants to freely choose which payment options they will accept.
The requirements for increased transparency and disclosure to merchants have required us to change the formats of our merchant statement and certain other documentation in order to enable our customers in Canada to comply with the new Code of Conduct. At this time, it is not possible to predict what effect the other provisions of the Code of Conduct will have on our customers, our operations and financial condition.
104
The banking and/or monetary authorities of some jurisdictions, such as the Hong Kong Monetary Authority, require acquiring banks to obtain their permission before outsourcing processing services to us. In accordance with our agreements with our customers, we are subject to compliance audits by our customers and by their regulators, as well as by the card associations. Although most of our customers conduct annual or other periodic reviews of various aspects of our services, we have not been subject to any audit or inspection by any government regulator to date. MasterCard has conducted periodic reviews of our operations under its Fraud Management Program (formerly known as Risk Assessment Management Program) and found that we are a risk aware service provider with the tools and knowledge required to assist member banks in the mitigation of fraud losses. Government regulators and regulatory bodies, such as the card associations, could change or impose additional requirements on us and our customers with respect to outsourcing, or the introduction of new services could require additional authorization from such regulators.
In April 2005, the People's Bank of China along with other Chinese government authorities issued the Various Opinions Concerning the Promotion of the Bank Card Industry, or the Opinions. One of the goals set out in the Opinions is to strengthen bank card risk management and to establish a risk prevention mechanism. As one of the measures to be taken to achieve this goal, the Opinions call for Chinese government authorities to strengthen access and supervision with respect to the outsourcing of bank card data processing and related operations. The Opinions specifically note the need for specific regulations with respect to foreign-invested organizations that engage in related services in China. Notwithstanding the Opinions, we are not aware of any regulations directly applicable to bank card data processing operations or operators, whether domestic or foreign-invested, which have been publicly promulgated to date.
In January 2011, the China Bank Regulatory Commission, or CBRC, issued the Measures for the Supervision and Administration of Credit Card Business of Commercial Banks, or the Measures. The Measures impose a number of requirements on commercial banks involving credit card businesses, particularly in relation to information security and the ability to ensure the integrity and security of customer information and operational data. These requirements are applicable to acquiring banks and not their service providers, such as us. However, we cannot rule out the possibility that CBRC and other relevant authorities may decide to issue new laws or regulations or otherwise extend the reach of the Measures or other existing regulations in a manner that will impact the operations of third-party data processors, such as us.
Anti-money laundering laws
Most jurisdictions in which we and our customers operate have implemented, amended or have pending anti-money laundering and anti-terrorism regulation. We are subject to the provisions of the USA PATRIOT Act, which requires the creation and implementation of comprehensive anti-money laundering programs. In general, this requires that we make certain efforts to prevent the use of our payment processing system to facilitate money laundering and the financing of terrorist activities, including, for example, the designation of a compliance officer, training of employees, adoption of internal policies and procedures to mitigate money laundering risks, and periodic audits. As are all U.S. citizens and U.S. entities, we are subject to regulations imposed by the U.S. Treasury Office Department of Foreign Assets Control, or OFAC, which prohibit or restrict financial and other transactions with specified countries, and designated individuals and entities, such as terrorists and narcotics traffickers.
105
As a payments processor that does not handle customer funds, our primary responsibilities in this area relate to the underwriting and monitoring of merchants in our direct merchant portfolio. Our acquiring bank customers have the sole responsibility for underwriting merchants in their own portfolios, for which we are just acting as the processor, and the primary responsibility for monitoring unusual transactions. We have procedures and controls in place that are designed to protect against having direct business dealings with countries, individuals or entities that are subject to OFAC-administered sanctions. However, due to the complexity of the payments systems to which our customers belong, such as MasterCard and Visa, it is possible our computer systems may be used in the processing of transactions involving countries or parties subject to OFAC-administered sanctions.
Anti-money laundering regulations are constantly evolving, and we cannot predict how future regulations or changes thereto might affect us. Therefore, we continuously monitor our compliance with anti-money laundering regulations to ensure that we comply with the most current legal requirements. Complying with future regulation could be expensive or require us to change the way we operate our business.
Privacy and data security regulation
We collect and store consumers' personally identifiable information on behalf of our customers, including names, card account numbers and expiration dates, and maintain a database of consumer data relating to specific transactions, including card numbers, in order to process transactions and assist our customers with retrieval requests, chargebacks and refunds. We also collect and store personally identifiable information about merchants and individual principals of these merchants, in connection with the underwriting of merchants in our direct merchant business, including names, addresses, social security numbers and employer identification numbers. As a result, we are required to comply with the privacy provisions of GLBA and its implementing regulations, various other federal, state and foreign privacy statutes and regulations, and the PCI Security Council's Data Security Standards, each of which is subject to change at any time. We may only use and disclose the personal information we receive on behalf of our customers for the purposes for which it was provided to us and consistent with each acquiring bank and processor's own data privacy and security obligations.
In order to comply with our obligations under GLBA, applicable state and foreign laws and our contractual agreements with our acquiring banks and processors, we are required to safeguard and protect the privacy of personally identifiable information we receive. As part of their compliance with the requirements, each of our U.S. customers is expected to have a program in place for responding to unauthorized access to, or use of, consumer information that could result in substantial harm or inconvenience to consumers. A majority of U.S. states have enacted security breach legislation, requiring varying levels of consumer notification in the event of a security breach, which could result in significant costs to us and significant damage to our reputation. Outside of the United States, most of the jurisdictions in which we or our customers operate have laws regulating the protection of personal data. We may be subject to these laws as a result of our contractual arrangement with our customers.
The interpretation of pending and existing laws and regulations is evolving and, therefore, these laws and regulations may be applied inconsistently. It is possible that our current data protection policies and practices may be deemed inconsistent with new legal requirements or
106
interpretations thereof, and breaches in the security of our payment processing platform and technology could result in a violation of these laws and regulations.
Internal Revenue Service regulations
The IRS recently adopted Section 1.6050W-1 of the Code requiring acquiring banks and processors to file Form 1099-K reports regarding sales volumes processed on behalf of merchants using payment cards, commencing January 2012. This regulation imposes obligations on us to collect and report on information regarding the sales activities of merchants in the United States for which we process transactions. This regulation requires us to modify our systems and processes and may result in additional costs, require substantial internal development work, or impose additional requirements on the way we provide our services to our customers. This regulation may be subject to change or may be supplemented by additional regulations and it is not possible to predict the impact of such new regulations on our business and operations.
Card association and payment network organization rules
The acquiring banks that are our customers, or that sponsor the bank identification numbers for Visa transactions and interbank card association number for MasterCard transactions that our customers use, whether or not such acquiring banks are our customers, must register us with Visa and MasterCard as a third party processor. Visa and MasterCard set the standards with which we and the acquiring banks must comply. As a result of being registered as a third-party processor, we are subject to card association rules and standards, and if we fail to comply with those rules and standards, the card association or network organization may subject our acquiring banks to a variety of fines or other penalties for which we could be responsible, including the termination of our ability to process transactions routed through these entities. Each card association and network organization has the power to audit us, as well as our merchant and acquiring bank customers, from time to time to ensure compliance with their rules and standards. We continue to work with our acquiring banks and processors to implement and maintain appropriate policies and programs, as well as adapt our business practices in order to comply with all applicable rules and standards.
The card association rules and standards have included and may in the future include rules impacting DCC and multi-currency pricing services such as ours. For example, Visa maintains a prohibition on performing DCC services on cash withdrawal transactions performed at ATMs with Visa cards and card associations other than Visa and MasterCard, such as JCB and American Express, only permit multi-currency pricing services on transactions undertaken with their cards in certain circumstances. We currently have a limited agreement with JCB that enables us to offer our Multi-Currency Pricing service only in North America for Japanese Yen and U.S. Dollars and we do not currently offer our Multi-Currency Pricing service on any American Express transactions.
Visa and MasterCard operating rules are subject to change at any time and in particular include twice yearly "compliance updates" each April and October. Such changes or updates often require us to modify our systems and processes and may result in additional costs, require substantial internal development work and change, or impose additional requirements on, the way we provide our services. For example, in April 2010, Visa announced a moratorium on all new acquiring banks and merchants offering DCC services, including our Pay In Your Currency service. In October 2010, Visa lifted the moratorium and also established certain rule changes
107
that removed a prior prohibition on offering DCC services in certain regions, namely Central Europe, the Middle East, Africa, Latin America and the Caribbean.
Currently, rules issued by both Visa and MasterCard require DCC service providers to make certain disclosures regarding the currency conversion information and to offer consumers a choice as to whether to accept the currency conversion. The specific disclosure requirements and procedures vary for each card type and may also differ according to the merchant's industry vertical. In addition, Visa has recently established a certification regime that requires all new DCC services, and all changes to certified DCC solutions, to undergo a certification process and be approved by Visa. Visa also charges acquiring banks an annual fee of $45,000 for each country and territory in which they offer a DCC service.
Other laws and regulations
As we develop new services and solutions, we may become subject to additional laws or regulations. These additional laws or regulations could substantially restrict the nature of the business in which we may engage. In addition, changes in current or future laws or regulations may restrict our ability to operate our business and may have a material adverse effect on our business, results of operations and financial condition.
In addition, changes to laws and regulations, or the interpretation or enforcement thereof, could have a negative financial effect on our business. Even an inadvertent failure to comply with laws and regulations could damage our business or our reputation. We cannot predict the substance or impact of pending or future legislation or regulation, or the application thereof, although enactment of such legislation would affect how we and our customers operate and could significantly increase costs, impede the efficiency of internal business processes and limit our ability to pursue business opportunities in an efficient manner.
Intellectual property
Our intellectual property rights are a key component of our business success. We rely on a combination of patent, trademark, copyright, unfair competition and trade secret laws, as well as confidentiality procedures and contractual restrictions, to establish, maintain and protect our proprietary rights. These laws, procedures and restrictions provide only limited protection and any of our intellectual property rights may be challenged, invalidated, circumvented, infringed or misappropriated. Further, the laws of certain countries do not protect proprietary rights to the same extent as the laws of the United States and, therefore, in certain jurisdictions, we may be unable to protect our proprietary technology. We generally require employees, consultants, customers, suppliers and partners to execute confidentiality agreements with us that restrict the disclosure of our intellectual property. We also generally require our employees and consultants to execute invention assignment agreements with us that protect our intellectual property rights. Despite these precautions, third parties may obtain and use without our consent intellectual property that we own or license. Any unauthorized use of our intellectual property by third parties, and the expenses incurred in protecting our intellectual property rights, may adversely affect our business.
As of December 31, 2011, we had one issued patent and two patent applications in the United States, and multiple issued patents in India, New Zealand, the Philippines, Singapore and Sri Lanka and patent applications pending in several other jurisdictions, all of which are counterparts to our patent and patent applications in the United States. We cannot ensure that
108
any of our pending patent applications will be granted or that any of our issued patents will adequately protect our intellectual property. Any patents that may be issued to us may be contested, circumvented, found unenforceable or invalidated and we may not be able to prevent third parties from infringing them. The patent laws in the United States and foreign countries in which we have issued patents and/or pending applications may change, making it more difficult or impossible to obtain or enforce patent rights related to our business. In addition, third parties could claim invalidity, co-inventorship or make similar claims with respect to any of our currently issued patents or any patents that may be issued to us in the future. Any such claims, whether or not successful, could be extremely costly to defend, divert management's time, attention and resources, damage our reputation and brand, and substantially harm our business. Therefore, the exact effect of having a patent cannot be predicted with certainty.
We own and use distinctive trademarks on or in connection with our products and services, including both unregistered common law marks and issued trademark registrations in the United States, Canada, Hong Kong and the European Union. We also have trademark applications pending to register marks in the United States, Canada and China. We have also registered numerous Internet domain names.
While we actively take steps to protect our proprietary rights, such steps may not be sufficient to prevent third parties from infringing or misappropriating our intellectual property. Trade secrets are difficult to protect.
From time to time, we may become involved in disputes over rights and obligations concerning intellectual property. Although we believe that our product offerings do not infringe the intellectual property rights of any third party, we have not performed any significant freedom-to-operate analyses with respect to U.S. or foreign patent rights, nor can we be certain that we will prevail in any intellectual property dispute. If we do not prevail in these disputes, we may lose some or all of our intellectual property protection, be enjoined from further sales of our products that are determined to infringe the rights of others, and/or be forced to pay substantial license fees or royalties to a third party, any of which would adversely affect our business, financial condition and results of operations.
Employees
As of December 31, 2011, we had a total of 161 regular full-time employees, including 56 employees located outside the United States. None of our employees are represented by a union or covered by a collective bargaining agreement. We consider our employee relations to be good.
Facilities
Our corporate headquarters are located in Long Beach, New York, where we occupy facilities totaling approximately 16,300 square feet under a lease that expires on December 31, 2016. We have an option to renew the lease for an additional five-year term if we give notice to the landlord at least 180 days prior to December 31, 2016. We use our headquarter facilities for administration, marketing and sales, research and development, operations and information technology. We also lease office space for our subsidiaries around the world, including Delaware, which also hosts one of our data centers, and Georgia in the United States,
109
Bermuda, Beijing and Shanghai in China, Hong Kong, Singapore, the United Arab Emirates and the United Kingdom. In addition, we rent space for one of our data centers in a secure facility in New York, and also host facilities in Bermuda, Shanghai, Macau and Hong Kong through co-location arrangements.
We may procure additional space as we add employees and expand geographically. We believe that our facilities are adequate to meet our needs for the immediate future, and that, should it be needed, suitable additional space will be available to accommodate any such expansion of our operations.
Legal proceedings
From time to time, we may be subject to legal proceedings and claims in the ordinary course of business. We currently have no material legal proceedings pending.
110
Executive officers and directors
The following table provides information regarding our executive officers and directors as of December 31, 2011:
| Name |
Age |
Position(s) |
||
|---|---|---|---|---|
Executive Officers: |
||||
Philip D. Beck(1) |
51 | Chairman of the Board of Directors, Chief Executive Officer and President | ||
Graham N. Arad |
52 | Director, Senior Vice President and General Counsel | ||
Robert J. Cox III |
46 | Senior Vice President, Chief Financial Officer and Treasurer | ||
Kieth W. Flaherty |
45 | Senior Vice President, Operations and Project Management | ||
Alan M. Lubitz |
61 | Chief Technology Officer and Senior Vice President, Product Development | ||
E. Drew Soinski |
52 | Senior Vice President, Managing Director, Americas | ||
Jason A. Taylor |
40 | Chief Information Officer | ||
Other Directors: |
||||
Lady Barbara T. Judge(2) |
65 | Director | ||
Jonathan Kaiden(2)(3) |
45 | Director | ||
Shane H. Kim(3) |
35 | Director | ||
Cameron R. M. McColl(1)(2)(3) |
52 | Director | ||
(1) Member of the Nomination and Governance Committee.
(2) Member of the Compensation Committee.
(3) Member of the Audit Committee.
Philip D. Beck founded our company in 1999, and has since then served as Chairman of our Board of Directors and our Chief Executive Officer and President. Mr. Beck previously practiced for almost 20 years as an international banking and corporate lawyer. Mr. Beck holds an L.L.B. from Queen Mary, the University of London, and is admitted to practice law in England and Wales, and the state of New York. Mr. Beck serves on our Board of Directors due to his in-depth knowledge and understanding of our business and its development, the perspective and experience he brings as our Chief Executive Officer, and his extensive background in the payments industry, which give him unique insight into our company's challenges, opportunities and business.
Graham N. Arad has served as a director and our Senior Vice President and General Counsel since our company's founding in 1999. From 1993 to June 2007, Mr. Arad was a partner at Beck & Arad, LLP, a New York law firm, and from February 1996 to January 2008, Mr. Arad was a partner at Hewlett Beck & Arad, a British Virgin Islands law firm, as an international corporate and commercial law attorney, working in a limited capacity at both law firms after our company was founded. Mr. Arad holds an L.L.B. from the London School of Economics, University of London, and is admitted to practice in England and Wales, and the state of New York. Mr. Arad brings to our Board of Directors in-depth knowledge and understanding of our business and his expansive experience in advising businesses operating internationally.
111
Robert J. Cox III has served as our Senior Vice President, Chief Financial Officer and Treasurer since November 2009. From June 2009 to November 2009, Mr. Cox served as the Chief Financial Officer of Harris Interactive, Inc., a market research firm. From 2001 to May 2009, Mr. Cox served as the Chief Financial Officer of DealerTrack Holdings, Inc., an automotive retail software solution provider. Prior to that, Mr. Cox served as Chief Financial Officer at Triton International Inc. and Green Stamp America Inc. He is a New York State licensed Certified Public Accountant and began his career in the audit practice at KPMG LLP. Mr. Cox holds a B.A. in Accounting from St. Bonaventure University and an M.B.A. from Columbia Business School.
Kieth W. Flaherty has served as our Senior Vice President, Operations and Project Management since November 2006. From April 2002 to November 2006, Mr. Flaherty served as the Chief Technology Officer at Transworld Payment Solutions, a provider of payment solutions. Prior to that, Mr. Flaherty held various senior positions with Bank of Bermuda, Arab National Bank and First Ecommerce Data Services.
Alan M. Lubitz has served as our Chief Technology Officer since November 2003 and our Senior Vice President, Product Development since July 2008. Prior to joining us, Mr. Lubitz spent over 17 years holding various senior positions at Paymentech, TermNet Merchant Services, National Card Processing Systems and Chase Merchant Services. Mr. Lubitz holds a B.S. in Electrical Engineering from the City College of New York, an M.S. in Electrical Engineering from the Polytechnic Institute of New York, and an M.B.A. from the Boston College School of Management.
E. Drew Soinski has served as our Senior Vice President, Managing Director, Americas since May 2011. From May 2010 to May 2011, Mr. Soinski was the Vice President of Sales, Payments at Voltage Security and from May 2009 to May 2010, he served as the Vice President of Business Development at Hypercom, each of which provides encryption and security software and services for transaction processing. From August 2007 to November 2008, Mr. Soinski served as the Chief Marketing Officer and President of Global Swift Funding, a provider of financing solutions for small and middle market business. From September 2005 to July 2007, Mr. Soinski served as Chief Marketing Officer of Cardtronics, Inc., an owner and operator of ATMs. Prior to that, he held various senior positions with First Horizon Merchant Services, National Processing Corporation (now Bank of America Merchant Services), Dassault Electronique, TransGlobal Systems (now part of Chase Paymentech), and NaBanco (now Chase/Paymentech Merchant Services). Mr. Soinski holds a B.S. in Marketing from the University of Central Florida.
Jason A. Taylor has served as our Chief Information Officer since June 2009 and from November 2006 until his promotion in June 2009, served as our Senior Vice President of Card Systems and Quality Assurance. From October 2001 to October 2006, Mr. Taylor was Manager, Card Systems, at TransWorld Payment Solutions, a third party payment processor. Mr. Taylor holds a B.S. in Business from Kwantlen University.
Lady Barbara T. Judge has served as a director since May 2006. Lady Judge has been the Chairman of the U.K. Pension Protection Fund since July 2010. Lady Judge was a member of the Board of the United Kingdom Atomic Energy Authority from 2002 to 2004 and served as the Chairman from 2004 to 2010. During her Chairmanship, Lady Judge established the United Kingdom Atomic Energy Authority's new consulting division, which advises foreign governments and private operators on construction of new nuclear plants, and expanded its existing plant decommissioning services into international markets. Lady Judge was the deputy chairman of the United Kingdom Financial Reporting Council in London from 2004 to 2007.
112
From 2002 to 2004, Lady Judge was a director of the Energy Group of the United Kingdom's Department of Trade and Industry and previously served as a commissioner of the U.S. Securities and Exchange Commission. Lady Judge serves as a director of Magna International Inc. and Statoil ASA and previously served on the board for ATP Oil & Gas Corporation and Alpha Appalachia Holdings, Inc. (formerly known as Massey Energy Company). Lady Judge holds a B.A. in history from the University of Pennsylvania and a J.D. from New York University School of Law. Lady Judge's extensive experience and service on boards of directors of a broad range of public and private companies around the world is a valuable perspective for our business since a substantial majority of our revenue comes from our international operations. In addition, her recent and current service on other public company boards of directors and governmental or regulatory organizations provides our Board of Directors with important perspectives on executive compensation and corporate governance matters.
Jonathan Kaiden has served as a director since January 2006. Mr. Kaiden has been a principal and founding member of Sopris Capital Associates, a private equity firm, since 2002. Mr. Kaiden currently sits on the board of directors for Apollidon Inc., Enhanced Capital Partners, Inc., ethology Inc., Healthcare Data Solutions Corp., International Art Galleries LLC, Mountain Temp Services LLC, SRSsoft, Inc., and Tallwave LLC, and was an advisor to the boards of iCrossing, Inc. and Valutec Card Solutions, Inc. Mr. Kaiden holds a B.A. in Government from Cornell University, an M.B.A. from Columbia Business School and a J.D. from Brooklyn Law School. As a director, Mr. Kaiden contributes to our Board of Directors his deep experience with the investment and investment banking industry, providing guidance and counsel to a variety of technology companies and service on the boards of directors of a number of companies.
Shane H. Kim has served as a director since April 2011. Mr. Kim has been a managing member of Camden Partners Holdings, LLC, a private equity firm, since May 1999. He currently serves on the board of Santa Rose Consulting, Inc. and was previously a director on the board of Vantage Oncology, Inc. Mr. Kim also previously served on the MBA Advisory Council for the Eller College of Management at the University of Arizona. Mr. Kim holds a B.S. in Finance from University of Maryland, Robert H. Smith School of Business. Mr. Kim was an observer to our Board of Directors from February 2007 and contributed his counsel and insights during an important stage of our development. Mr. Kim's sophisticated knowledge of information technology companies, including investments in payment industry companies, companies that have completed public offerings and experience serving as a director of several companies, brings a valuable perspective to our Board of Directors in connection with this offering and as a publicly-traded company.
Cameron R. M. McColl has served as a director since January 2006 and as our Lead Director since July 2011 and previously served as a director and Chairman of our Board of Directors from 1999 to 2000. Mr. McColl is an owner and has served as the Executive Chairman of Nanny Cay Resort & Marina Limited since 2000. Mr. McColl co-founded and served on the board of directors of Telecom Service Centres from 1994 to 2003. Mr. McColl co-founded and served as the chief executive officer of Memory Corporation Plc from 1993 to 1996. Mr. McColl holds a B.Sc. in Electrical and Electronic Engineering from Edinburgh University. Mr. McColl was an early investor in our company and was selected as a director because of his extensive business experience as a successful entrepreneur and his leadership of private and public companies. Mr. McColl is an experienced executive officer with the skills necessary to lead our Audit Committee. His service as chief executive officer at a publicly traded corporation, as well as serving as a director on several others, has provided him with extensive financial and accounting experience, including evaluating financial results and generally overseeing the financial reporting process at a public company.
113
Our executive officers are elected by, and serve at the discretion of, our Board of Directors. There are no family relationships among any of our directors or executive officers.
Board of Directors
Our business and affairs are managed under the direction of our Board of Directors. We currently have six directors divided into three classes with members of each class of directors serving three-year terms. Our Board of Directors consists of two Class III directors (Messrs. Arad and Beck), two Class I directors (Messrs. Kaiden and McColl) and two Class II directors (Lady Judge and Mr. Kim) whose initial terms will expire at the annual meetings of our stockholders held in 2012, 2013 and 2014, respectively. The classification of our Board of Directors and provisions described above may have the effect of delaying or preventing changes in our control or management. See "Description of capital stock—Anti-takeover provisions—Restated certificate of incorporation and restated bylaw provisions."
Upon the completion of this offering, our common stock will be listed on The NASDAQ Global Market. The NASDAQ Marketplace Rules require that a majority of the members of our Board of Directors be independent within specified periods following the completion of this offering. Our Board of Directors has determined that four of our directors are "independent" as determined under The NASDAQ Marketplace Rules: Lady Judge and Messrs. Kaiden, Kim and McColl.
Mr. Beck serves as both our Chairman of our Board of Directors and Chief Executive Officer. This leadership structure is commonly utilized by public companies in the United States, and we believe that this leadership structure has been effective for us. Mr. Beck has a unique insight into our company's challenges, opportunities and business and having one person serve as both chief executive officer and chairman of our Board of Directors shows our employees, customers and other constituencies that we are under strong leadership, with a single person setting the tone and having primary responsibility for managing our operations. We also believe that this eliminates the potential for duplication of efforts and inconsistent actions.
Our Board of Directors has established, as a position on our Board of Directors, a Lead Director who shall be a non-executive director. Mr. McColl was appointed Lead Director in July 2011. The Lead Director has the non-exclusive authority to preside over meetings of the non-executive directors of our Board of Directors, to supervise the self-evaluations of directors and our Board of Directors' determination of the independence of its directors and to hold such other powers and carry out such other duties as are also granted by our Board of Directors.
Board committees
Our Board of Directors has an Audit Committee, a Compensation Committee and a Nomination and Governance Committee, each of which has the composition and responsibilities described below as of the completion of this offering. Members serve on these committees until their resignations or until otherwise determined by our Board of Directors.
Audit Committee
Our Audit Committee is comprised of Mr. McColl, who is the chair of the Audit Committee, and Messrs. Kaiden and Kim. The composition of our Audit Committee meets the requirements for independence under The NASDAQ Marketplace Rules and SEC rules and regulations. Each member of our Audit Committee is financially literate. In addition, our Board of Directors has
114
determined that Mr. McColl is an "audit committee financial expert" as defined in Item 407(d)(5)(ii) of Regulation S-K promulgated under the Securities Act of 1933, as amended, or the Securities Act. The designation does not impose on Mr. McColl any duties, obligations or liabilities that are greater than are generally imposed on members of our Audit Committee and our Board of Directors. All audit services to be provided to us and all permissible non-audit services to be provided to us by our independent registered public accounting firm will be approved in advance by our Audit Committee. We anticipate that the charter for our Audit Committee to be adopted by our Board of Directors will provide that our Audit Committee, among other things, will:
- •
- select a firm to serve as the independent registered public accounting firm to audit our financial statements;
- •
- help to ensure the independence of the independent registered public accounting firm;
- •
- discuss the scope and results of the audit with the independent registered public accounting firm, and review, with
management and that firm, our interim and year-end operating results;
- •
- develop procedures for employees to submit anonymously concerns about questionable accounting or audit matters;
- •
- consider the adequacy of our internal accounting controls and audit procedures; and
- •
- approve or, as permitted, pre-approve all audit and non-audit services to be performed by the independent registered public accounting firm.
Compensation Committee
Our Compensation Committee, which was previously known as the Remuneration Committee, is comprised of Mr. McColl, who is the chair of the Compensation Committee, and Lady Judge and Mr. Kaiden. The composition of our Compensation Committee meets the requirements for independence under The NASDAQ Marketplace Rules. The purpose of our Compensation Committee is to discharge the responsibilities of our Board of Directors relating to compensation of our executive officers. We anticipate that the charter for our Compensation Committee to be adopted by our Board of Directors will provide that our Compensation Committee, among other things, will:
- •
- review and approve, or recommend that our Board of Directors approve, the compensation of our executive officers;
- •
- review and recommend to our Board of Directors the compensation of our directors;
- •
- review and approve the terms of any material agreements with our executive officers;
- •
- administer our stock and equity incentive plans;
- •
- review and make recommendations to our Board of Directors with respect to incentive compensation and equity plans; and
- •
- establish and review our overall compensation philosophy.
Nomination and Governance Committee
Our Nomination and Governance Committee, which was previously known as the Nomination Committee, is comprised of Mr. Beck, who is the chair of the Nomination and Governance Committee, and Mr. McColl. The composition of our Nomination and Governance Committee
115
will meet the requirements for independence under The NASDAQ Marketplace Rules in accordance with the applicable transition rules. We anticipate that the charter for our Nomination and Governance Committee to be adopted by our Board of Directors will provide that our Nomination and Governance Committee, among other things, will:
- •
- identify, evaluate and recommend nominees to our Board of Directors and committees of our Board of Directors;
- •
- conduct searches for appropriate directors;
- •
- evaluate the performance of our Board of Directors;
- •
- consider and make recommendations to our Board of Directors regarding the composition of our Board of Directors and its
committees;
- •
- review related party transactions and proposed waivers of the code of conduct;
- •
- review developments in corporate governance practices; and
- •
- evaluate the adequacy of our corporate governance practices and reporting.
Following the completion of this offering, the charters of our Audit, Compensation, and Nomination and Governance Committees, and any amendments that may be adopted from time to time, will be available on the investor relations portion of our website, www.planetpayment.com.
Compensation Committee interlocks and insider participation
During 2011, our Compensation Committee consisted of Lady Judge and Messrs. Kaiden and McColl. None of them has at any time in the last year been one of our officers or employees, and none has had any relationships with our company of the type that is required to be disclosed under Item 404 of Regulation S-K. None of our executive officers served as a member of the board of directors, or as a member of the compensation or similar committee, of any entity that has one or more executive officers who served on our Board of Directors or Compensation Committee during fiscal 2011.
Code of business conduct and ethics
We expect our Board of Directors to adopt a code of business conduct and ethics to become effective immediately following the completion of this offering that applies to all of our employees, officers and directors. The full text of our code of business conduct and ethics will be posted on our website. If we make substantive amendments to, or grant any waivers from, the code of business conduct and ethics for any director or executive officer, we will disclose the nature of such amendment or waiver on our website and/or in a current report on Form 8-K.
The U.K. Corporate Governance Code
The U.K. Corporate Governance Code, or U.K. Code, is the key source of corporate governance recommendations for companies in the United Kingdom admitted to the Official List of the London Stock Exchange, but it does not apply to companies whose shares are admitted for trading on AIM. However, as is common practice with many AIM-traded companies, we recognize the importance of the U.K. Code and aim to comply with the main provisions of the U.K. Code insofar as is practicable and appropriate for a company of our size and nature.
116
The U.K. Code consists of principles of good governance, most of which have their own set of more detailed provisions which, in most cases, amplify the principles. The principles deal with the following areas: board leadership and effectiveness, accountability, directors' compensation, and relations with stockholders. A copy of the U.K. Code is available from the website of the Financial Reporting Council at http://www.frc.org.uk/corporate/ukcgcode.cfm. We do not incorporate the information available on the website of the Financial Reporting Council into this prospectus and you should not consider any such information on, or that can be accessed through, such website as part of this prospectus.
Director compensation
The following table provides information for 2011 regarding all plan and non-plan compensation awarded to, earned by or paid to each person who served as a non-employee director during fiscal 2011. Other than as set forth in the table and the narrative that follows it, we did not pay any fees to our directors, make any equity or non-equity awards to directors, or pay any other compensation to directors. All compensation that we paid to Messrs. Beck and Arad, our only employee directors, are set forth in the tables summarizing executive officer compensation below. No compensation was paid to Messrs. Beck and Arad in their capacity as directors.
| Name |
Fees earned or paid in cash ($) |
Option awards ($)(1) |
Total ($) |
|||||||
|---|---|---|---|---|---|---|---|---|---|---|
Lady Barbara T. Judge |
$ | 50,000 | $ | 26,000 | $ | 76,000 | ||||
Jonathan Kaiden |
50,000 | 26,000 | 76,000 | |||||||
Shane H. Kim(2) |
34,018 | 49,600 | 83,618 | |||||||
Cameron R. M. McColl |
50,000 | 26,000 | 76,000 | |||||||
(1) Represents fair value based on our market price as of the respective option grant date. For a discussion of our methodology for determining the fair value of our common stock, see "Management's discussion and analysis of financial condition and results of operations—Critical accounting policies and estimates—Stock-based expense and assumptions." The assumptions used in the valuation of these awards are consistent with the valuation methodologies specified in Note 2 to our Consolidated Financial Statements included elsewhere in this prospectus. As of December 31, 2011, each director held outstanding options to purchase the following number of shares: Lady Barbara T. Judge: 224,250; Jonathan Kaiden: 224,250; Shane H. Kim: 74,000; and Cameron R. M. McColl: 224,250.
(2) Mr. Kim was appointed as a director in April 2011.
We also reimbursed the customary and reasonable travel expenses of our directors in attending meetings of our Board of Directors.
Our Board of Directors has a compensation policy pursuant to which independent directors are entitled to receive the following compensation:
- •
- An annual cash retainer of $50,000, to be paid monthly with each payment made at the end of the calendar month except that
the monthly payment shall be pro-rated based on the percentage achieved by dividing (1) the number of meetings of our Board of Directors and committees that the independent director
is a member of that the independent director attended, or missed as a result of illness, by (2) the total number of meetings of our Board of Directors and committees that the independent
director is a member of that were held during the month.
- •
- Each independent director who becomes a member of our Board of Directors will be granted an initial option to purchase 50,000 shares of our common stock upon election to our Board of Directors. On the date of each annual stockholder meeting subsequent to initial election
117
to our Board of Directors, each independent director who continues to serve on our Board of Directors immediately following such meeting will be granted an option to purchase 40,000 shares of our common stock unless the independent director was first elected to our Board of Directors less than six months prior to the annual stockholder meeting, in which case such independent director shall instead receive an option to purchase 24,000 shares of our common stock. The annual grants shall be made automatically, as of the close of business on the date of the annual stockholder meeting unless the date occurs during a closed period under AIM, in which case, the option grant shall occur automatically upon the termination of the closed period. Each option will have an exercise price equal to the fair market value of our common stock on the date of grant. Since our shares of common stock began trading on AIM in 2006, our Board of Directors determined that the fair market value of the shares of common stock was the closing price of our common stock under the AIM symbol PPTR on the date of grant. Following the completion of this offering, each option will have an exercise price equal to the closing price of our common stock on The NASDAQ Global Market on the date of grant. Each initial option grant vests and becomes exercisable as to 1/3rd of the shares on the 12-month anniversary from the vesting commencement date and 1/36th of the shares each month thereafter, such that the grant vests in full after three years. Each annual option grant vests and becomes exercisable as to 1/12th of the shares each month from the vesting commencement date. All options shall become fully vested and exercisable immediately prior to a change of control. Additionally, an independent director's initial option grant shall become fully vested and exercisable in the event that the independent director fails to serve on our Board of Directors for the duration of the vesting term solely as a result of our Board of Directors' failure to re-nominate the independent director for election by our stockholders, other than a failure to re-nominate the independent director for cause.
Following the completion of this offering, we expect to retain a compensation consultant to help us review our policy for compensating the independent members of our Board of Directors based on an analysis of market data about comparable companies.
Compensation discussion and analysis
The following discussion and analysis of compensation arrangements of our executive officers should be read together with the compensation tables and related disclosures set forth below. This discussion contains forward-looking statements that are based on our current plans, considerations, expectations and determinations regarding future compensation programs. The actual amount and form of compensation and the compensation programs that we adopt may differ materially from currently planned programs as summarized in this discussion.
This section discusses the principles underlying our executive compensation policies and decisions and the most important factors relevant to an analysis of these policies and decisions. It provides qualitative information regarding the manner and context in which compensation is awarded to and earned by our executive officers and places in perspective the data presented in the tables and narrative that follow.
118
The following discussion describes and analyzes our compensation program for the five executive officers who are identified in the "—2011 summary compensation table" below and who we refer to as our named executive officers. For 2011, our named executive officers were:
- •
- Philip D. Beck, Chairman of our Board of Directors, Chief Executive Officer, or CEO, and President;
- •
- Robert J. Cox III, Senior Vice President, Chief Financial Officer, or CFO, and Treasurer;
- •
- Graham N. Arad, Director, Senior Vice President and General Counsel;
- •
- Alan M. Lubitz, Chief Technology Officer and Senior Vice President, Product Development; and
- •
- Kieth W. Flaherty, Senior Vice President, Operations and Project Management.
For 2011, Messrs. Beck, Cox and Arad were also Persons Discharging Managerial Responsibility, or PDMRs, in accordance with the AIM Rules for Companies published by the London Stock Exchange plc, or the AIM Rules, which apply by virtue of our admission to trading on AIM. Under our Compensation Committee charter, our Compensation Committee determined the compensation of our PDMRs.
Compensation philosophy and objectives
Our executive compensation program is designed to:
- •
- attract and retain talented and experienced executives;
- •
- motivate and reward executives whose knowledge, skills and performance are critical to our success;
- •
- link compensation to corporate performance and individual achievement;
- •
- link specific cash-based elements of compensation to our near-term financial performance; and
- •
- align the interests of our executive officers and those of our stockholders by providing our executive officers with long-term incentives to increase stockholder value.
We have endeavored to create an executive compensation program that provides a mix of short-term and long-term payments and awards, cash payments and equity awards, and fixed and variable payments and awards that we believe appropriately motivates our executive officers and discourages them from taking excessive or unnecessary risks. We view these components of compensation as related but distinct. Although our Compensation Committee considers the value of total compensation of our executive officers, neither our Board of Directors nor our Compensation Committee believes that significant compensation derived from one component of compensation should negate or reduce compensation derived from other components. Except as described below, neither our Compensation Committee nor our Board of Directors has adopted any formal or informal policies or guidelines for allocating total target compensation between short-term and long-term compensation, between cash payments and equity awards, or between fixed and variable payments and awards. However, in general, our Compensation Committee and our Board of Directors believe a significant portion of the value of total target compensation for each of our named executive officers should be in the form of performance-based compensation. In addition, our Compensation Committee and our
119
Board of Directors strive to keep cash compensation at a competitive level while providing executive officers with the opportunity to be well rewarded through equity awards if our company performs well over time.
Historical compensation decision process
Historically, our Compensation Committee has overseen the compensation of our PDMRs, our company-wide incentive based compensation programs and initiatives and equity based compensation for all employees. Our Compensation Committee typically reviews PDMR compensation, including base salary levels and the target levels for variable cash incentive awards, near the beginning of each year. In connection with this review, our Compensation Committee considers any input it may receive from our CEO (with respect to executive officers other than himself) in evaluating the performance of each PDMR and sets each PDMR's total target cash compensation for the current year based on this review and the other factors described below. With respect to our executive officers who are not also PDMRs, their base salary levels and target levels for cash incentive compensation awards have generally been determined by our CEO. We pay cash awards under our company cash incentive compensation plans, which are designed to compensate our employees, including PDMRs and other named executive officers, for their contribution to achieving annual financial goals contained in our company financial plan and in achieving individual goals, as explained in further detail below. The cash incentive compensation plan goals are determined near the beginning of each year when our Board of Directors approves our company financial plan for the next year. In connection with its annual review and any reviews that occur during the year, our Compensation Committee also recommends to our Board of Directors any equity compensation to be awarded to our named executive officers. Authority to make equity award grants to all employees, including to our named executive officers, rests with our Board of Directors, which has delegated such authority to our Compensation Committee.
We have based our prior compensation determinations, including those made for 2011, on a variety of factors, including our performance, our financial condition and available resources, individual performance, our need for a particular position to be filled and the recommendations of our CEO (other than with respect to his own compensation). In addition, we have based our prior compensation determinations on our Compensation Committee's and/or our Board of Directors' evaluation of the competitive market based on their respective members' experience with other companies and the competitive market, and, to a lesser degree, the compensation levels of our other executive officers, each as of the time of the applicable compensation decision. As a result, our Compensation Committee members have not formally benchmarked executive compensation against a particular set of comparable companies or used a formula to set the compensation for our executives in relation to any survey data. In establishing compensation for PDMRs other than our CEO, our Compensation Committee gives weight to the recommendations of our CEO, which are communicated to the chair of our Compensation Committee, but final decisions about the compensation of our PDMRs and equity based compensation for all named executive officers are typically made solely by our Compensation Committee. Cash compensation for other named executive officers, has been typically determined by the CEO based on similar methods to our Compensation Committee.
120
We expect that the specific direction, emphasis and components of our executive compensation program will continue to evolve and our Compensation Committee's processes and procedures will become more formalized as we gain experience operating as a U.S. public company. Thus, the compensation paid to our named executive officers for 2011 is not necessarily indicative of how we will compensate our named executive officers following this offering. In the fall of 2011, our Compensation Committee engaged an independent compensation consultant, Frederic W. Cook & Co., or Cook, and our Compensation Committee will consider the report and any recommendations of Cook with respect to future compensation plans for our executive officers and other employees. Our Compensation Committee considered certain data provided by Cook with respect to the relative proportions of equity-based awards made by comparable companies, as a percentage of issued and outstanding shares and certain outstanding common stock equivalents following this offering, in considering the number of shares of common stock that should be reserved under our 2012 Equity Incentive Plan.
Elements of compensation
Our current executive compensation program consists of the following primary components:
- •
- base salary;
- •
- annual cash incentive awards linked to corporate and individual objectives; and
- •
- periodic grants of long-term equity-based awards.
Base salaries
We seek to provide each named executive officer with a base salary that is appropriate for his roles and responsibilities, and that provides him with a level of income stability. Our Compensation Committee reviews the base salaries of our PDMRs annually, with significant input from our CEO (for executive officers other than the CEO), to determine whether any adjustment is warranted. In addition, our CEO annually reviews the base salaries of our other named executive officers. In considering a base salary adjustment, our Compensation Committee or CEO, as applicable, considers our overall performance and the individual named executive officer's performance, individual contribution, changes in responsibilities and prior experience. Our Compensation Committee and CEO, as applicable, may also take into account the named executive officer's current salary and equity ownership and the amounts paid to other executive officers. Our Compensation Committee relies upon its members' experience with the compensation practices of other companies and its members' familiarity with the competitive market. Our CEO makes his compensation decisions based on similar methods as our Compensation Committee.
For 2011, we determined the base salaries of each of our named executive officers by evaluating our overall performance and his performance, contributions and prior experience. Our Compensation Committee made its compensation decisions for 2011 based on its subjective judgment taking into account the available information, including our CEO's recommendations (for executive officers other than the CEO) and the experience of the members of our Compensation Committee with the compensation practices of other companies and their familiarity with the competitive market. Our CEO made his compensation decisions based on similar methods to the Compensation Committee.
In November 2008, our senior management took a 20% reduction in base salary in response to the global recession and in order to conserve our cash resources. These reductions were
121
intended to be temporary in nature. In November 2009 and January 2010, we returned all of our senior management to salary levels held prior to the 20% salary reduction in November 2008. The final reinstatements in the annual base salaries of Messrs. Beck, Arad, Lubitz and Flaherty on January 1, 2010 were by $31,780 (to $317,797), $19,934 (to $199,345), $19,934 (to $199,345), and $16,995 (to $169,950), respectively. Additionally in January and April 2010, after careful consideration, our Compensation Committee increased the annual base salaries of Messrs. Beck and Arad by $52,203 (to $370,000) and $30,655 (to $230,000), respectively. Our Compensation Committee made these adjustments to make these base salaries more competitive and to compensate these named executive officers for increased responsibilities associated with our growth.
In connection with the hiring of Mr. Cox as our Chief Financial Officer in November 2009, we entered into an employment arrangement with him that provided for an annual base salary of $260,000 for the first six months of his employment and an annual base salary of $290,000 beginning on May 1, 2010. In negotiating Mr. Cox's base salary, we offered him the amount of compensation we believed was necessary to attract a qualified candidate.
The Compensation Committee with respect to the PDMRs, and our CEO with respect to the other executive officers, determined that none of our executive officers would receive an increase in their 2011 base salary over their 2010 base salary in order to maintain a lower fixed overhead and in anticipation of higher bonus levels in 2011 under the 2011 Cash Incentive Compensation Plan. The actual salaries paid to our named executive officers in 2011 are set forth in the "—2011 summary compensation table" below.
Cash incentive awards
We utilize cash bonuses to incentivize our executive officers to achieve company and/or individual performance goals on an annual basis, and to reward extraordinary accomplishments. We establish bonus targets for cash incentive awards at the beginning of each year, and we pay bonuses following the end of the year. Each executive officer's potential bonus range is a pre-determined amount that is intended to provide a competitive level of compensation if we achieve our corporate goals and the executive officer achieves his individual performance targets, if any. Performance targets consist of our corporate performance objectives as determined by our Compensation Committee and/or individual objectives established by our CEO for the particular executive officer. In general, we use performance targets to ensure that our executive compensation program aligns the interests of each of our named executive officers with those of our stockholders and that we provide our named executive officers with incentives to maximize their efforts throughout the year.
2011 Cash Incentive Compensation Plan
We will calculate all cash incentive awards earned under our 2011 Cash Incentive Compensation Plan by multiplying each individual named executive officer's potential bonus amount by the percentage of achievement of corporate objectives and, if applicable, by the percentage of achievement of individual objectives. The final determination of each bonus amount is subject to completion of the audit of our financial statements for the year ended December 31, 2011.
For 2011, our Compensation Committee set the annual potential bonus targets and payout amounts for each PDMR and the CEO set the annual potential bonus target and payout amounts for other executive officers at a level that they believed would provide a competitive
122
amount of compensation if the company achieved a certain level of performance and the executive officer achieved his performance targets, if any. For 2011, the maximum individual potential bonus amounts for our named executive officers ranged from 29% to 95% of their respective base annual salaries. The potential bonus amounts for our named executive officers for 2011 were as follows:
| Executive officer |
Target bonus amount |
Maximum bonus amount |
|||||
|---|---|---|---|---|---|---|---|
Philip D. Beck |
$ | 175,750 | $ | 351,500 | |||
Robert J. Cox III |
68,885 | 137,769 | |||||
Graham N. Arad |
54,625 | 109,250 | |||||
Alan M. Lubitz |
33,141 | 66,282 | |||||
Kieth W. Flaherty |
24,218 | 48,436 | |||||
As explained below, the actual amount of any cash incentive award paid to a named executive officer could be less than maximum bonus amount, depending on the percentage of achievement of corporate and individual objectives. Our 2011 Cash Incentive Compensation Plan provides that the amount of the actual bonus payment cannot exceed the maximum bonus amount.
Our Board of Directors approves a financial plan at the beginning of each year and then resets the corporate objectives for our cash incentive compensation plan for that year. For 2011, the bonus targets for the 2011 Cash Incentive Compensation Plan were generally set based upon attainment of the annual goals contained in our financial plan for Adjusted EBITDA. Adjusted EBITDA shall be calculated by adding the amounts of depreciation and amortization, stock-based expense, impairment charges and other non-cash items to the amount of income before interest and income taxes reflected in our consolidated statements of operations. Adjusted EBITDA was chosen as the corporate objective because we believed it to be the best indicator of financial success and stockholder value creation for our company. We also believe that the focus on Adjusted EBITDA as the corporate objective discourages inappropriate risk taking by our executives as it encourages them to take a balanced approach that focuses on corporate profitability. The Adjusted EBITDA targets were set at levels that were intended to reward our named executive officers for achieving results that met our expectations. We believe that, to provide for an appropriate incentive effect, the goals should be such that to achieve the objective, the performance for the applicable period must be aligned with our company financial plan, and that our named executive officers should not be rewarded for company performance that did not approximate our company financial plan. The final determination of the achievement of the Adjusted EBITDA targets in 2011 and bonus payments with respect to 2011 is subject to completion of the audit of our financial statements for the year ended December 31, 2011. We anticipate that such determinations will be made in the first quarter of 2012.
For 2011, the pre-bonus Adjusted EBITDA threshold target under the 2011 Cash Incentive Compensation Plan was $7.9 million (339% year-over-year growth) up to a maximum of $11.1 million (517% year-over-year growth) for named executive officers.
Our CEO set individual goals for our named executive officers under the 2011 Cash Incentive Compensation Plan. Mr. Cox was to improve our internal reporting and management information, improve internal accounting and financial systems and ready the company for a
123
public listing in the United States. Mr. Arad was to improve the efficiency of the legal department, in particular with respect to the servicing of other departments requirements and budgeting of outside legal costs. Mr. Lubitz was to achieve improvements in certain developmental delivery timescales and continue the process of bringing together activities of different technology and development groups to achieve greater synergy and efficiency. Mr. Flaherty was to improve certain aspects of the workings and efficiency of the operations department and improve coordination in day to day activities with other departments. Mr. Beck did not have separate individual goals beyond the corporate objectives described above. If our Compensation Committee determines that we have achieved the minimum Adjusted EBITDA target, then our Compensation Committee will review the individual performance of the named executive officers with respect to their individual objectives. The potential bonus to be paid to the named executive officers will be determined based on the percentage of achievement of the Adjusted EBITDA targets and individual objectives.
Long-term equity-based awards
We utilize equity awards, historically comprising stock options, to ensure that our named executive officers have a continuing stake in our long-term success. We established the 2006 Equity Incentive Plan, or 2006 Plan, which provides for the grant of various types of equity-based awards to executives and other employees. Because we award stock options with an exercise price equal to or greater than the fair market value of our common stock on the date of grant, the determination of which is discussed below, these options will have value to our named executive officers only if the market price of our common stock increases after the date of grant. Typically, our stock options vest and become exercisable as to one-third of the shares underlying the option on each of the first, second and third anniversary of the vesting commencement date. Our Board of Directors believes that these features of the awards align the interests of our named executive officers with those of the stockholders because they create the incentive to build stockholder value over the long-term. In addition, equity awards improve our ability to attract and retain our executives by providing compensation that is competitive with market levels.
We typically grant stock options to executive officers upon hiring or promotion, in connection with a significant change in responsibilities, to recognize performance, or to achieve internal equity. At least annually, our Compensation Committee reviews the equity ownership of our executive officers and considers whether to make additional awards. In making its determination, our Compensation Committee takes into account, on a subjective basis, various factors. These factors include the responsibilities, past performance and anticipated future contributions of the executive officer, and the competitiveness of the executive officer's overall compensation package, as well as the executive officer's existing equity holdings, the extent to which these holdings are vested, the potential reward to the executive officer if the market value of our common stock appreciates, and the recommendations of our CEO (for executive officers other than the CEO).
We grant stock options with an exercise price equal to or greater than the fair market value of our stock on the applicable date of grant. During 2011, our Board of Directors determined the value of our common stock based on the methodologies and other relevant factors discussed under "Management's discussion and analysis of financial condition and results of operations—Critical accounting policies and estimates—Stock-based expense and assumptions." Upon completion of this offering, we expect to determine fair market value for purposes of stock
124
option pricing based on the closing price of our common stock on the The NASDAQ Stock Market on the date of grant.
During 2011, our Compensation Committee reviewed equity compensation for our named executive officers and, with input from our CEO (for executive officers other than the CEO), determined that it was appropriate to provide additional incentive for our named executive officers to help us achieve our long-term growth objectives. In February 2011, our Compensation Committee approved grants of options to purchase 25,000 shares of our common stock to each of Messrs. Lubitz and Flaherty with an exercise price of $2.30 per share; in March 2011, our Compensation Committee approved grants of options to purchase 60,000 shares and 45,000 shares of our common stock to Messrs. Beck and Arad, respectively, with an exercise price of $2.17 per share; and in April 2011, our Compensation Committee approved the grant of an option to purchase 100,000 shares of our common stock to Mr. Cox with an exercise price of $2.00 per share. The determination of the number of shares of our common stock underlying each stock option grant was made with reference to a specified percentage of equity ownership in our company based on our Compensation Committee's recommendation in light of those individuals' respective performances, equity ownership and level of vesting and the equity positions of our other named executive officers.
In the case of each of the stock option grants described above for our named executive officers, the exercise price of the stock option equaled the fair market value on the date of grant determined in accordance with the terms of our 2006 Plan. Because our shares of common stock are publicly traded on AIM, our Board of Directors has determined that the fair value of the shares of common stock is the closing price of our common stock under the AIM symbol PPTR on the date of grant. Each stock option vests and becomes exercisable as to one-third of the shares underlying the option on each of the first, second and third anniversaries of the vesting commencement date. Each of these stock options has a ten-year term, subject to continued employment of the executive with us.
All currently outstanding stock option grants to executives have been made under our 2006 Plan. We expect to adopt a new equity incentive plan and a new employee stock purchase plan in connection with this offering. The 2012 Equity Incentive Plan will replace our 2006 Plan. The 2012 Employee Stock Purchase Plan will enable eligible employees to purchase shares of our common stock periodically at a discount during periods following this offering. Participation in the 2012 Employee Stock Purchase Plan will be available to all executive officers following this offering on the same basis as our other employees. See "—Employee benefit plans" below for descriptions of our 2006 Plan, 2012 Equity Incentive Plan and 2012 Employee Stock Purchase Plan.
On July 26, 2011, we made a restricted stock grant of 915,000 shares of our common stock to Mr. Beck, pursuant to a Long-Term Incentive Restricted Stock Agreement. The 915,000 shares vest in four separate tranches, each with a different long-term performance goal. The awards will accelerate in full upon a sale or merger of our company, if the consideration paid is at least $1 billion and there is a valuation or price equating to at least $15.00 per share. The performance goals for each tranche are outlined below:
- •
- Tranche one (expires 12/31/2014): Performance condition award consisting of 305,000 shares that vest based upon the achievement of adjusted EBITDA (as will be defined in our earnings
125
releases for the relevant periods) per fully diluted share greater than or equal to $0.36 per share.
- •
- Tranche two (expires 12/31/2017): Performance condition award consisting of 47,000 shares that vest based upon the
achievement of adjusted EBITDA (as will be defined in our earnings releases for the relevant periods) per fully diluted share greater than or equal to $0.64 per share.
- •
- Tranche three (expires 12/31/2017): Performance condition award consisting of 469,000 shares that vest based upon the
achievement of adjusted EBITDA (as will be defined in our earnings releases for the relevant periods) per fully diluted share greater than or equal to $0.71 per share.
- •
- Tranche four (expires 12/31/2017): Market condition award consisting of 94,000 shares that vest based upon the fair market value of our common stock being greater than or equal to $12.00 per share for 75 consecutive trading days in the United States.
Severance and change of control agreements
Pursuant to executive retention agreements entered into with Messrs. Beck, Arad and Cox, we have agreed to provide severance benefits if their employment is terminated in connection with a change of control (as defined in the agreements) or due to an involuntary termination (as defined in the agreements). In such an event, the executive would be entitled to payment of his base salary for twelve months in the case of an involuntary termination and eighteen months if terminated in the case of a change of control. In addition, in the event of termination in connection with a change of control or pursuant to an involuntary termination, the executive is to receive the target bonus amount the executive would potentially be able to receive for the year in which he is terminated, pro-rated for the amount of months the executive was actually employed by us. The executive retention agreements also include provisions for full accelerated vesting of equity awards. These arrangements were designed to improve retention of our most senior executive team. Details of each of our named executive officer's severance arrangements, including estimates of amounts payable in specified circumstances, are disclosed under "—Potential payments upon termination or change of control" below. The value of our severance arrangements for our named executive officers was not a material factor in the determination of our Compensation Committee or our Board of Directors of the level of any other element of their compensation.
Other executive benefits and perquisites
We provide the following benefits to our executive officers on the same basis as our other eligible employees:
- •
- health insurance;
- •
- vacation, personal holidays and sick days;
- •
- life insurance and supplemental life insurance;
- •
- short-term and long-term disability insurance; and
- •
- a 401(k) retirement plan (currently without a matching contribution).
We believe these benefits are generally consistent with those offered by other companies and specifically with those companies with which we compete for employees.
126
Other compensation practices and policies
Tax considerations
Section 162(m) of the Internal Revenue Code of 1986, as amended, or the Code, disallows a tax deduction by any publicly-held corporation for individual compensation exceeding $1.0 million in any taxable year for its chief executive officer and each of our other named executive officers (other than its chief financial officer), unless compensation is performance-based. As we are not currently publicly-held, our Board of Directors has not previously taken the deductibility limit imposed by Section 162(m) into consideration in setting compensation. We expect, however, that our Compensation Committee will adopt a policy that, where reasonably practicable, we will seek to qualify the variable compensation paid to our executive officers for an exemption from the deductibility limitations of Section 162(m). Thus, in approving the amount and form of compensation for our executive officers in the future, our Compensation Committee will consider all elements of the cost to us of providing this compensation, including the potential impact of Section 162(m). However, our Compensation Committee may, in its judgment, authorize compensation payments that do not comply with the exemptions in Section 162(m) when it believes these payments are appropriate to attract and retain executive talent.
Policy regarding the timing of equity awards
Since 2006, we have been admitted to trading on AIM and as such we are subject to the AIM Rules regarding directors and PDMRs "dealings" in the shares of the company, as defined under AIM Rules. Those rules prohibit the granting of options or other equity-based awards to directors and PDMRs during close periods. Close periods are those times when the company or the relevant individuals are in possession of material non-public, price-sensitive information and specifically include the periods of two months prior to the announcement of our annual financial results and one month prior to the announcement of quarterly, or half-yearly results. We have adopted a Share Dealing Policy to ensure compliance with AIM Rules. Accordingly, our Compensation Committee and our Board of Directors have as a matter of policy ensured that any grants of equity-based awards to directors and PDMRs are subject to the proviso that no grants shall take legal effect and no pricing of any options or other awards shall occur until after the expiration of any close period that may exist, although generally, our Compensation Committee avoids making any such grants during a close period. We also intend to amend our existing insider trading policy to meet the requirements for trading of securities under U.S. securities law, effective upon the completion of this offering.
127
2011 summary compensation table
The table below summarizes the total compensation awarded to, paid to or earned by each of our named executive officers for services rendered to us for the year ended December 31, 2011.
| Name and principal position |
Salary ($) |
Stock awards ($)(1) |
Option awards ($)(1) |
Non-equity incentive plan compensation ($)(2) |
Total ($) |
||||||||||||
|---|---|---|---|---|---|---|---|---|---|---|---|---|---|---|---|---|---|
Philip D. Beck |
$ | 370,000 | $ | 1,811,840 | $ | 42,000 | $ | 2,223,840 | |||||||||
Chief Executive |
|||||||||||||||||
Officer and |
|||||||||||||||||
President |
|||||||||||||||||
Robert J. Cox III |
290,041 |
— |
67,000 |
357,041 |
|||||||||||||
Senior Vice |
|||||||||||||||||
President, Chief |
|||||||||||||||||
Financial Officer |
|||||||||||||||||
and Treasurer |
|||||||||||||||||
Graham N. Arad |
230,000 |
— |
31,500 |
261,500 |
|||||||||||||
Senior Vice |
|||||||||||||||||
President and |
|||||||||||||||||
General Counsel |
|||||||||||||||||
Alan M. Lubitz |
199,345 |
— |
19,000 |
218,345 |
|||||||||||||
Chief Technology |
|||||||||||||||||
Officer and |
|||||||||||||||||
Senior Vice |
|||||||||||||||||
President, |
|||||||||||||||||
Product |
|||||||||||||||||
Development |
|||||||||||||||||
Kieth W. Flaherty |
169,950 |
— |
19,000 |
188,950 |
|||||||||||||
Senior Vice |
|||||||||||||||||
President, |
|||||||||||||||||
Operations and |
|||||||||||||||||
Project |
|||||||||||||||||
Management |
|||||||||||||||||
(1) The amounts in this column represent the aggregate grant date fair value computed in accordance with ASC 718. For a discussion of the assumptions used in determining the fair value of stock and option awards in the above table, see Note 3 to our Consolidated Financial Statements.
(2) In 2010, the Compensation Committee established the 2011 Cash Incentive Compensation Plan, which provided for payment of bonus amounts based on our achievement of certain Adjusted EBITDA targets and individual performance targets for fiscal 2011. Our Compensation Committee with respect to the PDMRs, and our CEO with respect to the other executive officers, have not yet made determinations with respect to our achievement of the Adjusted EBITDA targets in 2011 or bonus payments with respect to 2011, but we anticipate that such determinations will be made in the first quarter of 2012. For a description of our 2011 bonus program, refer to the discussion under "—Elements of compensation—2011 Cash Incentive Compensation Plan" above.
128
2011 grants of plan-based awards table
The table below summarizes grants made to each of our named executive officers for the year ended December 31, 2011.
| |
|
Possible payouts under non-equity incentive plan awards(1) |
|
All other option awards: number of securities underlying options (#)(3) |
|
|
|||||||||||||
|---|---|---|---|---|---|---|---|---|---|---|---|---|---|---|---|---|---|---|---|
| |
|
All other stock awards: number of shares of stock or units (#)(2) |
|
|
|||||||||||||||
| |
|
Exercise or base price of option awards ($/share)(4) |
Grant date fair value of stock and option awards ($)(5) |
||||||||||||||||
| Name |
Grant date |
Target ($) |
Maximum ($) |
||||||||||||||||
Philip D. Beck |
$ | 175,750 | $ | 351,500 | |||||||||||||||
|
3/23/2011 | 60,000 | $2.17 | $42,000 | |||||||||||||||
|
7/26/11 | 915,000 | 1,811,840 | ||||||||||||||||
Robert J. Cox III |
68,885 | 137,769 | |||||||||||||||||
|
4/12/2011 | 100,000 | 2.00 | 67,000 | |||||||||||||||
Graham N. Arad |
54,625 | 109,250 | |||||||||||||||||
|
3/23/2011 | 45,000 | 2.17 | 31,500 | |||||||||||||||
Alan M. Lubitz |
33,141 | 66,282 | |||||||||||||||||
|
2/8/2011 | 25,000 | 2.30 | 19,000 | |||||||||||||||
Kieth W. Flaherty |
24,218 | 48,436 | |||||||||||||||||
|
2/8/2011 | 25,000 | 2.30 | 19,000 | |||||||||||||||
(1) Amounts represent the target and maximum payout amount for each named executive officer under the 2011 Cash Incentive Compensation Plan. The plan provided for payment of the bonus amounts based on our achievement of certain Adjusted EBITDA targets and individual performance targets for fiscal 2011. Our Compensation Committee with respect to the PDMRs and our CEO with respect to the other executive officers have not yet made determinations with respect to our achievement of the Adjusted EBITDA targets in 2011 or bonus payments with respect to 2011, but we anticipate that such determinations will be made in the first quarter of 2012. For a description of our 2011 bonus program, refer to the discussion under "—Elements of compensation—2011 Cash Incentive Compensation Plan" above.
(2) On July 26, 2011, we made a restricted stock grant of 915,000 shares of our common stock to Mr. Beck, pursuant to a Long-Term Incentive Restricted Stock Agreement. Please see "—Compensation discussion and analysis—Elements of compensation—Long-term equity based awards" for more information on Mr. Beck's restricted stock grant.
(3) Number of shares underlying stock option grants made under our 2006 Equity Incentive Plan. These option awards vest as to one-third of the original number of shares on each anniversary of the vesting commencement date until fully vested on the third anniversary of the vesting commencement date.
(4) Represents the fair market value of our common stock as determined by the Compensation Committee on the respective option grant date. For a discussion of our methodology for determining the fair market value of our common stock, see "Management's discussion and analysis of financial condition and results of operations—Critical accounting policies and estimates—Stock-based expense and assumptions." The assumptions used in the valuation of these awards are consistent with the valuation methodologies specified in Note 3 to our Consolidated Financial Statements.
(5) The amounts in this column represent the aggregate grant date fair value computed in accordance with ASC 718. For a discussion of the assumptions used in determining the fair value of stock and option awards in the above table, see Note 3 to our Consolidated Financial Statements.
129
2011 outstanding equity awards at year-end
The table below summarizes outstanding equity awards held by each of our named executive officers at December 31, 2011.
| |
Option awards | Stock awards | ||||||||||||||
|---|---|---|---|---|---|---|---|---|---|---|---|---|---|---|---|---|
| Name |
Number of securities underlying unexercised options (#) exercisable |
Number of securities underlying unexercised options (#) unexercisable |
Option exercise price ($) |
Option expiration date |
Number of shares of stock that have not yet vested (#)(1) |
Market value of shares of stock that have not yet vested ($)(2) |
||||||||||
Philip D. Beck |
483,600 | $2.50 | 12/31/2012 | |||||||||||||
|
17,000 | 2.50 | 12/31/2013 | |||||||||||||
|
69,063 | 2.50 | 1/1/2015 | |||||||||||||
|
69,063 | 2.50 | 1/1/2015 | |||||||||||||
|
78,654 | 2.50 | 1/26/2016 | |||||||||||||
|
76,513 | 2.88 | 2/19/2017 | |||||||||||||
|
75,999 | 3.01 | 12/30/2017 | |||||||||||||
|
68,099 | 1.20 | 12/10/2018 | |||||||||||||
|
50,000 | 25,000 | (3) | 1.70 | 1/1/2020 | |||||||||||
|
20,000 | 40,000 | (3) | 2.17 | 3/22/2021 | |||||||||||
|
915,000 | $ | 2,077,050 | |||||||||||||
Robert J. Cox III |
133,333 |
66,667 |
(3) |
1.65 |
11/30/2019 |
|||||||||||
|
33,333 | 66,667 | (3) | 1.25 | 11/29/2020 | |||||||||||
|
100,000 | (3) | 2.00 | 4/11/2021 | ||||||||||||
Graham N. Arad |
148,800 |
2.50 |
12/31/2012 |
|||||||||||||
|
27,625 | 2.50 | 1/1/2015 | |||||||||||||
|
27,625 | 2.50 | 1/1/2015 | |||||||||||||
|
17,041 | 2.50 | 1/26/2016 | |||||||||||||
|
51,009 | 2.88 | 2/19/2017 | |||||||||||||
|
47,047 | 3.01 | 12/30/2017 | |||||||||||||
|
42,717 | 1.20 | 12/10/2018 | |||||||||||||
|
13,333 | 26,667 | (3) | 2.13 | 5/26/2020 | |||||||||||
|
15,000 | 30,000 | (3) | 2.17 | 3/22/2021 | |||||||||||
Alan M. Lubitz |
42,500 |
2.50 |
12/31/2012 |
|||||||||||||
|
42,500 | 2.50 | 6/30/2014 | |||||||||||||
|
41,438 | 2.50 | 1/1/2015 | |||||||||||||
|
41,438 | 2.50 | 1/1/2015 | |||||||||||||
|
34,083 | 2.50 | 1/26/2016 | |||||||||||||
|
36,435 | 2.88 | 2/19/2017 | |||||||||||||
|
36,190 | 3.01 | 12/30/2017 | |||||||||||||
|
42,717 | 1.20 | 12/10/2018 | |||||||||||||
|
13,333 | 26,667 | (3) | 2.13 | 4/6/2020 | |||||||||||
|
8,334 | 16,666 | (3) | 2.30 | 2/7/2021 | |||||||||||
Kieth W. Flaherty |
70,000 |
2.53 |
11/21/2016 |
|||||||||||||
|
7,238 | 3.01 | 12/30/2017 | |||||||||||||
|
10,000 | 3.01 | 12/30/2017 | |||||||||||||
|
36,418 | 1.20 | 12/10/2018 | |||||||||||||
|
13,333 | 26,667 | (3) | 2.13 | 4/6/2020 | |||||||||||
|
8,334 | 16,666 | (3) | 2.30 | 2/7/2021 | |||||||||||
(1) See footnote (2) to the "2011 grants of plan-based awards" table.
(2) The amounts in this column are calculated by multiplying the number of shares of stock that have not yet vested by the closing price of our common stock traded on AIM under the symbol "PPTR" on December 31, 2011.
130
(3) The option vests and becomes exercisable as to one-third of the original number of shares on each anniversary of the vesting commencement date until fully vested on the third anniversary of the vesting commencement date.
2011 option exercises
No options were exercised by our named executive officers during 2011.
Pension benefits
None of our named executive officers participates in or has account balances in qualified or non-qualified defined benefit plans sponsored by us.
Non-qualified deferred compensation
None of our named executive officers participates in or has account balances in non-qualified defined contribution plans or other deferred compensation plans maintained by us.
Compensation and risk
We have reviewed our compensation policies and practices to ensure that they do not encourage our employees to, or reward our employees for, taking inappropriate or excessive risks or create risks that are reasonably likely to have a material adverse effect on our company. Our Compensation Committee considered various factors that have the effect of mitigating risk and reviewed our compensation policies and practices for our employees, including the elements of our executive compensation program, to determine whether any portion of such compensation encourages excessive risk-taking. The following characteristics of our compensation programs work to reduce the possibility of our employees, including our executive officers, either individually or as a group, making excessively risky business decisions that could maximize short-term results at the expense of long-term value:
- •
- We base our compensation policies and practices on a well-defined and appropriate pay philosophy, our Board of
Directors' evaluation of the competitive market based on their respective members' experience with other companies and the competitive market, and, to a lesser degree, the compensation levels of our
other executive officers.
- •
- We attempt to structure employee compensation packages to reflect an effective balance between cash and equity-based
compensation, and short- and long-term performance focus, based on the nature of each employee groups' responsibilities and market practices.
- •
- Performance objectives are set with a reasonable probability of achievement and tied to the operating budget and long-term strategic planning objectives approved by our Board of Directors.
Potential payments upon termination or change of control
In November 2009, we entered into an executive retention agreement with Mr. Cox, and, in February 2010, we entered into similar executive retention agreements with Messrs. Beck and Arad. We currently have no other arrangements regarding potential payments upon termination or change of control with our other named executive officers. Under these executive retention agreements, we have agreed to pay Messrs. Beck, Cox and Arad specified severance and bonus amounts and to accelerate the vesting on their equity awards upon each of their termination upon a change of control or an involuntary termination, as each term is defined in the agreements.
131
Change of control
In the event of a termination upon a change of control, Messrs. Beck, Arad and Cox are entitled to receive an amount equal to 18 months of the executive officer's base salary and the target bonus then in effect for the executive officer for the year in which such termination occurs, such bonus payment to be pro-rated to reflect the full number of months the executive remained in our employ. In addition, the vesting on any stock option and other equity awards held by the executive officer will be accelerated in full. At the election of the executive officer, we will also continue to provide our health related employee insurance coverage for twelve months, at our expense. The following table sets forth the potential (estimated) payments and benefits to which Messrs. Beck, Cox and Arad would have been entitled assuming a change of control as of December 31, 2011, as specified under their respective executive retention agreement.
| Name |
Severance amount |
COBRA premiums |
Bonus amount |
Accelerated stock options(1) |
Total |
||||||||
|---|---|---|---|---|---|---|---|---|---|---|---|---|---|
Philip D. Beck |
$555,000 | $21,633 | $ | 175,750 | $ | $ | |||||||
Robert J. Cox III |
435,000 | 21,633 | 68,885 | ||||||||||
Graham N. Arad |
345,000 | 21,633 | 54,625 | ||||||||||
(1) Assumes the fair market value of our common stock on December 31, 2011 was the offering price of $ per share, which represents the midpoint of the estimated price range set forth on the cover page of this prospectus.
Involuntary termination payments
In the event of an involuntary termination, Messrs. Beck, Arad and Cox are entitled to receive an amount equal to 12 months of the executive officer's base salary and the target bonus then in effect for the executive officer for the year in which such termination occurs, such bonus payment to be pro-rated to reflect the full number of months the executive remained in our employ. In addition, the vesting on any stock option and other equity awards held by the executive officer will be accelerated in full. At the election of the executive officer, we will also continue to provide our health related employee insurance coverage for twelve months, at our expense. The following table sets forth the potential (estimated) payments and benefits to which Messrs. Beck, Cox and Arad would have been entitled assuming an involuntary termination as of December 31, 2011, as specified under their respective executive retention agreement.
| Name |
Severance amount |
COBRA premiums |
Bonus amount |
Accelerated stock options(1) |
Total |
||||||||
|---|---|---|---|---|---|---|---|---|---|---|---|---|---|
Philip D. Beck |
$370,000 | $21,633 | $ | 175,750 | $ | $ | |||||||
Robert J. Cox III |
290,000 | 21,633 | 68,885 | ||||||||||
Graham N. Arad |
230,000 | 21,633 | 54,625 | ||||||||||
(1) Assumes the fair market value of our common stock on December 31, 2011 was the offering price of $ per share, which represents the midpoint of the estimated price range set forth on the cover page of this prospectus.
Employee benefit plans
2000 stock incentive plan
Background. Our Board of Directors adopted and our stockholders approved our 2000 Stock Incentive Plan on December 23, 1999. Our 2000 Stock Incentive Plan provides for the grant of
132
stock options to our employees or any parent or subsidiary's employees, and for the grant of stock options to non-employees. Our 2000 Stock Incentive Plan also allows for awards and sales of shares of restricted stock. We ceased issuing awards under our 2000 Stock Incentive Plan upon the adoption of our 2006 Equity Incentive Plan.
Share reserve. Our 2000 Stock Incentive Plan has terminated and awards are no longer granted under it. As of December 31, 2011, options to purchase 273,519 of these shares had been exercised and options to purchase 70,000 of these shares remained outstanding. The options outstanding as of December 31, 2011 had a weighted average exercise price of $4.11 per share. Our 2012 Equity Incentive Plan (described below) will be effective upon the date of this prospectus. However, any outstanding options granted under our 2000 Stock Incentive Plan will remain outstanding, subject to the terms of our 2000 Stock Incentive Plan and stock option agreements, until they are exercised or until they terminate or expire by their terms.
Administration. Our Board of Directors administered our 2000 Stock Incentive Plan and had complete discretion to make all decisions relating to the plan, including the power to determine the terms of the awards, including who will receive awards, the exercise price, the number of shares subject to each award, the term of awards, the vesting schedule and exercisability of awards and the form of consideration payable upon exercise.
Stock options. Under the terms of our 2000 Stock Incentive Plan, the exercise price of stock options must be at least equal to 75% of the fair market value of our common stock on the date of grant and the term of the stock options may not exceed 10 years. Upon termination of an employee's employment with us, he or she may exercise his or her stock option for the period of time stated in the stock option agreement, to the extent his or her stock option is vested on the date of termination. If termination is due to death or disability, the remainder of the unvested shares shall immediately vest and the stock option will remain exercisable for a period of not more than 12 months. If termination is for cause, the stock option will terminate in its entirety within 30 days or at such later times and on such conditions as determined by our Board of Directors. In all other cases, the stock option will remain exercisable for a period not more than 12 months after the date on which the employee's employment terminates or such shorter period as may be prescribed in the stock option agreement. Subject to the requirements of all applicable laws, rules or regulations, each stock option agreement shall contain provisions relating to early termination of the stock option based upon termination of the holder's service to us as determined by our Board of Directors. A stock option may never be exercised later than the expiration of its term.
Effect of certain corporate transactions. In the event we experience a merger or consolidation, all awards granted under our 2000 Stock Incentive Plan shall be subject to the agreement evidencing such merger or consolidation, and with respect to a stock option, our Board of Directors may choose to either take no action at all, or to:
- •
- arrange for the surviving, new or acquiring entity to assume the outstanding options;
- •
- give each holder of outstanding options the right to exercise all or a portion of their option; or
- •
- take such other action as is reasonable in order to permit optionees to realize the value of their rights.
133
Our 2000 Stock Incentive Plan provides for adjustment of awards in the event of a stock split, stock dividend and certain other corporate events.
Payment. The exercise price for options granted under our 2000 Stock Incentive Plan may not be less than 75% of the fair market value of our common stock on the grant date. Optionees may pay the exercise price of options by using cash or a promissory note, with the exercised shares being pledged to secure the obligations of the promissory note.
Transferability. Our 2000 Stock Incentive Plan does not allow for the sale or transfer of stock option awards, except by will or the laws of descent and distribution.
Additional provisions. Our Board of Directors has the authority to amend, suspend or terminate our 2000 Stock Incentive Plan, provided our stockholders approve actions that:
- •
- increase the number of shares of our common stock that may be issued under our 2000 Stock Incentive Plan;
- •
- change the designation of employees eligible to receive incentive stock option awards under our 2000 Stock Incentive Plan;
or
- •
- require their approval pursuant to the Code or the regulations promulgated under the Code or pursuant to any other applicable rule or law.
2006 equity incentive plan
Background. Our Board of Directors adopted and our stockholders approved our 2006 Equity Incentive Plan on January 6, 2006. Our 2006 Equity Incentive Plan provides for the grant of incentive stock options, within the meaning of Section 422 of the Code to our employees or any parent or subsidiary's employees, and for the grant of nonstatutory stock options to our employees, officers, directors, consultants, independent contractors and advisors and any parent and subsidiary corporations' officers, directors, consultants, independent contractors and advisors. Our 2006 Equity Incentive Plan also allows for awards and sales of shares of restricted stock, stock bonuses, stock appreciation rights, and restricted stock units. We will cease issuing awards under our 2006 Equity Incentive Plan upon our 2012 Equity Incentive Plan becoming effective upon the completion of this offering. Instead we will grant equity awards under our 2012 Equity Incentive Plan.
Share reserve. As of December 31, 2011, we had reserved 11,130,683 shares of our common stock for issuance under our 2006 Equity Incentive Plan. As of December 31, 2011, options to purchase 182,869 of these shares had been exercised, options to purchase 7,706,948 of these shares remained outstanding and 2,325,866 shares remained available for future grant. The options outstanding as of December 31, 2011 had a weighted average exercise price of $2.26 per share. Our 2012 Equity Incentive Plan will be effective upon the completion of this offering. As a result, we will not grant any additional options under our 2006 Equity Incentive Plan following that date. However, any outstanding options granted under our 2006 Equity Incentive Plan will remain outstanding, subject to the terms of our 2006 Equity Incentive Plan and stock option agreements, until they are exercised or until they terminate or expire by their terms. Shares of common stock reserved for issuance pursuant to this plan will be rolled into our 2012 Equity Incentive Plan.
Administration. Our Compensation Committee currently administers our 2006 Equity Incentive Plan and makes recommendations to our Board of Directors regarding grants of options or other awards permitted under our 2006 Equity Incentive Plan. Our Board of Directors has
134
complete discretion to make all decisions relating to the plan, including the power to determine the terms of the awards, including who will receive awards, the exercise price, the number of shares subject to each award, the term of awards, the vesting schedule and exercisability of awards and the form of consideration payable upon exercise.
Stock options. The exercise price of stock options must be at least equal to the fair market value of our common stock on the date of grant and the term of the stock options may not exceed 10 years. With respect to stock options granted to any employee who owns 10% or more of the voting power of all classes of our outstanding stock as of the grant date, the term must not exceed 5 years and the exercise price must equal at least 110% of the fair market value on the grant date. Upon termination of an employee's employment with us, he or she may exercise his or her stock option for the period of time stated in the stock option agreement, to the extent his or her stock option is vested on the date of termination. If termination is due to death or disability, the stock option will remain exercisable for a period of not more than 12 months. If termination is for cause, the stock option will immediately terminate in its entirety or at such later times and on such conditions as determined by our Board of Directors. In all other cases, the stock option will remain exercisable for a period of three months after the date on which the employee's employment terminates or such shorter or longer period as may be prescribed in the stock option agreement. Subject to the requirements of all applicable laws, rules or regulations, each nonstatutory stock option agreement shall contain provisions relating to early termination of the nonstatutory stock option based upon termination of the holder's service to us as determined by our Board of Directors. A stock option may never be exercised later than the expiration of its term.
Effect of certain corporate transactions. In the event we experience a merger or consolidation, all awards granted under our 2006 Equity Incentive Plan shall be subject to the agreement evidencing such merger or consolidation, and with respect to a stock option or shares of restricted stock, such agreement shall provide for one or more of the following:
- •
- the continuation or assumption of such outstanding stock options by the surviving corporation or its parent;
- •
- the substitution by the surviving corporation or its parent of new options for such outstanding stock options; or
- •
- the issuance of substantially similar shares or other property subject to repurchase restrictions no less favorable than those imposed on the shares originally issued.
In the event the surviving corporation fails to assume or substitute all awards granted under our 2006 Equity Incentive Plan, all awards will immediately become vested as to 100% of the shares and such awards will expire at the closing of the transaction.
Our 2006 Equity Incentive Plan provides for adjustment of awards in the event of a stock split, stock dividend and certain other corporate events.
Payment. The exercise price for options granted under our 2006 Equity Incentive Plan may not be less than 100% of the fair market value of our common stock on the grant date. Optionees may pay the exercise price of options by using:
- •
- cash or cash equivalents;
- •
- cancellation of indebtedness owed by the company to the holder (in cases of termination by death or disability only);
135
- •
- waiver of compensation due or accrued to the holder by the company (in cases of termination by death or disability only);
- •
- a broker-assisted "cashless" exercise program; or
- •
- a net exercise method whereby the shares are purchased with shares being exercised.
Additional provisions. Our Board of Directors has the authority to amend, suspend or terminate our 2006 Equity Incentive Plan, provided our stockholders also approve actions that:
- •
- increase the number of shares of our common stock that may be issued under our 2006 Equity Incentive Plan;
- •
- change the designation of employees eligible to receive stock option awards under our 2006 Equity Incentive Plan; or
- •
- require their approval pursuant to the Code or the regulations promulgated under the Code or pursuant to any other applicable rule or law.
2012 equity incentive plan
Background. In December 2011, our Board of Directors adopted and in January 2012, our stockholders approved, our 2012 Equity Incentive Plan that will become effective upon the completion of this offering and will serve as the successor to our 2000 Stock Incentive Plan and 2006 Equity Incentive Plan.
Share reserve. We have initially reserved 5,000,000 shares of our common stock for issuance under our 2012 Equity Incentive Plan plus (i) any shares reserved but not issued or subject to outstanding awards under our 2006 Equity Incentive Plan and (ii) shares that are subject to outstanding awards under our 2000 Stock Incentive Plan and 2006 Equity Incentive Plan which cease to be subject to such awards. The number of shares reserved for issuance under our 2012 Equity Incentive Plan will increase automatically on the first day of January of each of 2013 through 2016 by a number of shares equal to (i) the lesser of 4% of the total outstanding shares our common stock as of the immediately preceding December 31st or (ii) a number of shares determined by our Board of Directors. In addition, the following shares will again be available for grant or issuance under our 2012 Equity Incentive Plan:
- •
- shares subject to options or stock appreciation rights granted under our 2012 Equity Incentive Plan that cease to be
subject to the options or stock appreciation rights for any reason other than exercise of the option or stock appreciation right;
- •
- shares subject to awards granted under our 2012 Equity Incentive Plan that are subsequently forfeited or repurchased by us
at the original issue price;
- •
- shares surrendered pursuant to an exchange program; and
- •
- shares subject to awards granted under our 2012 Equity Incentive Plan that otherwise terminate without shares being issued.
Term. Our 2012 Equity Incentive Plan terminates ten years from the date our Board of Directors approved the plan, unless it is terminated earlier by our Board of Directors.
Eligibility. Our 2012 Equity Incentive Plan authorizes the award of stock options, restricted stock awards, stock appreciation rights, restricted stock units, performance awards and stock bonuses. No person will be eligible to receive more than 4,000,000 shares in any calendar year
136
under our 2012 Equity Incentive Plan other than a new employee of ours, who will be eligible to receive no more than 8,000,000 shares in the calendar year in which the employee commences employment.
Administration. Our 2012 Equity Incentive Plan will be administered by our Compensation Committee, all of the members of which are non-employee directors under applicable federal securities laws and outside directors as defined under applicable federal tax laws. Our Compensation Committee will have the authority to construe and interpret our 2012 Equity Incentive Plan, grant and determine the terms of each award, including the exercise price, the number of shares subject to the award, the exercisability of the award and the form of consideration payable upon exercise the award, and make all other determinations necessary or advisable for the administration of the plan. The Compensation Committee will also have the authority to institute an exchange program whereby outstanding awards may be surrendered, cancelled or exchanged. Awards under the 2012 Equity Incentive Plan may be made subject to "performance factors" and other terms in order to qualify as performance based compensation for the purposes of Internal Revenue Code Section 162(m).
Stock options. Our 2012 Equity Incentive Plan provides for the grant of incentive stock options that qualify under Section 422 of the Code only to our employees and those of any parent or subsidiary of ours. We may only grant non-qualified stock options to our directors, consultants, independent contractors and advisors, provided the awards to directors, consultants, independent contractors and advisors are not made in connection with services related to the offer and sale of securities in a capital-raising transaction. We may also grant non-qualified stock options to employees. The exercise price of each stock option must be at least equal to the fair market value of our common stock on the date of grant. The exercise price of incentive stock options granted to 10% stockholders must be at least equal to 110% of the fair market value of our common stock on the date of grant.
Our Compensation Committee may provide for options to be exercised only as they vest or to be immediately exercisable with any shares issued on exercise being subject to our right of repurchase that lapses as the shares vest. Stock options may vest based on time or achievement of performance conditions. In general, options will vest over a three-year period. The maximum term of options granted under our 2012 Equity Incentive Plan is ten years, with a maximum term of five years for incentive stock options granted to 10% or greater stockholders.
Restricted stock awards. A restricted stock award is an offer by us to sell shares of our common stock subject to restrictions. The price (if any) of a restricted stock award will be determined by our Compensation Committee. Unless otherwise determined by the Compensation Committee at the time of award, vesting will cease on the date the participant no longer provides services to us and unvested shares will be forfeited to or repurchased by us. Restricted stock awards may vest based on time or achievement of performance conditions.
Stock appreciation rights. Stock appreciation rights provide for a payment, or payments, in cash or shares of our common stock, to the holder based upon the difference between the fair market value of our common stock on the date of exercise and the stated exercise price up to a maximum amount of cash or number of shares. The payment may occur upon the exercise of a stock appreciation right or deferred with such interest or dividend equivalent, if any, as our Compensation Committee determines, provided that the terms of the stock appreciation right and any deferral satisfy the requirements of Section 409A of the Code. Stock appreciation
137
rights may vest based on time or achievement of performance conditions. The maximum term of stock appreciation rights under our 2012 Equity Incentive Plan is ten years.
Restricted stock units. Restricted stock units represent the right to receive shares of our common stock at a specified date in the future, subject to forfeiture of that right because of termination of the holder's services to us or the holder's failure to achieve certain performance conditions. If a restricted stock unit has not been forfeited, then on the date specified in the restricted stock unit agreement, we may deliver to the holder of the restricted stock unit whole shares of our common stock, which may be subject to additional restrictions, cash or a combination of our common stock and cash. Our Compensation Committee may also permit the holders of the restricted stock units to defer payment to a date or dates after the restricted stock unit is earned, provided that the terms of the restricted stock unit and any deferral satisfy the requirements of Section 409A of the Code.
Performance awards. A performance award is a cash bonus or an award that covers a number of shares of our common stock that may be settled upon achievement of the pre-established performance conditions in cash or by issuance of the underlying shares. These awards are subject to forfeiture prior to settlement because of termination of employment or failure to achieve the performance conditions.
Stock bonus awards. Stock bonus awards may be granted as additional compensation for services and/or performance. Payment from the holder is not required for stock bonuses, and stock bonuses are not generally subject to vesting.
Effect of certain corporate transactions. If we experience a change of control transaction, outstanding awards, including any vesting provisions, may be assumed or substituted by the successor company. Outstanding awards that are not assumed or substituted will expire upon the closing of a change of control transaction. Outstanding awards that are not assumed or substituted shall have their vesting accelerate as to all shares subject to such awards (and any applicable right of repurchase fully lapse) immediately prior to the change in control transaction. Our 2012 Equity Incentive Plan provides for adjustment of awards in the event of a stock split, stock dividend and certain other corporate events.
Additional provisions. Awards granted under our 2012 Equity Incentive Plan may not be transferred in any manner other than by will or by the laws of descent and distribution or as determined by our Compensation Committee. Our Compensation Committee has the discretion and authority to determine and implement the terms and conditions of an award transfer program and shall have the authority to amend the terms of any award participating, or otherwise eligible to participate in, the award transfer program. Unless otherwise restricted by our Compensation Committee, awards that are nonstatutory stock options may be exercised during the lifetime of the optionee only by the optionee, the optionee's guardian or representative, or a family member of the optionee who has acquired the option by a permitted transfer. Awards that are incentive stock options may be exercised during the lifetime of the optionee only by the optionee or the optionee's guardian or legal representative. Options granted under our 2012 Equity Incentive Plan generally may be exercised for a period of three months after the termination of the optionee's service to us, except in the case of death or permanent disability, in which case the options may be exercised for up to 12 months following termination of the optionee's service to us.
138
2012 employee stock purchase plan
Background. In December 2011, our Board of Directors adopted and in January 2012, our stockholders approved, our 2012 Employee Stock Purchase Plan that will become effective upon the completion of this offering and will enable eligible employees to periodically purchase shares of our common stock at a discount. Purchases will be accomplished through participation in discrete offering periods. We intend our 2012 Employee Stock Purchase Plan to qualify as an employee stock purchase plan under Section 423 of the Code.
Share reserve. We have initially reserved 800,000 shares of our common stock for issuance under our 2012 Employee Stock Purchase Plan. We anticipate that during the first seven years of the life of our 2012 Employee Stock Purchase Plan, the number of shares reserved for issuance will increase automatically on the first day of each January, starting with January 1, 2013, by the number of shares equal to one percent of our total outstanding shares as of the immediately preceding December 31st. Our Board of Directors will be able to reduce the amount of the increase in any particular year. No more than 8,000,000 shares of our common stock may be issued under our 2012 Employee Stock Purchase Plan and no other shares may be added to this plan without the approval of our stockholders.
Administration. Our Compensation Committee will administer our 2012 Employee Stock Purchase Plan. Our employees generally will be eligible to participate in our 2012 Employee Stock Purchase Plan if they are (i) employed by us or a subsidiary or parent of ours that we designate, for six months or more prior to the beginning of each offering period or prior to such other time period as specified by our Compensation Committee, (ii) regularly scheduled to work more than 20 hours per week and more than five months in a calendar year, and (iii) not 5% stockholders, or would become 5% stockholders as a result of their participation in our 2012 Employee Stock Purchase Plan. We may impose additional restrictions on eligibility as well. Under our 2012 Employee Stock Purchase Plan, eligible employees will be able to acquire shares of our common stock by accumulating funds through payroll deductions. Our eligible employees will be able to select a rate of payroll deduction between 1% and 10% of their cash compensation. We will also have the right to amend or terminate our 2012 Employee Stock Purchase Plan, except that, subject to certain exceptions, no such action may adversely affect any outstanding rights to purchase stock under the plan. Our 2012 Employee Stock Purchase Plan will terminate on the tenth anniversary of the first purchase date, unless it is terminated earlier by our Board of Directors or as a result of the issuance of all of the shares of our common stock reserved for issuance under our 2012 Employee Stock Purchase Plan.
Purchase rights. When an offering period commences, our employees who meet the eligibility requirements for participation in that offering period will automatically be granted a non-transferable option to purchase shares in that offering period. For subsequent offering periods, new participants will be required to enroll in a timely manner. Once an employee is enrolled, participation will be automatic in subsequent offering periods. Each offering period will run for no more than 24 months and consist of no more than five purchase periods. An employee's participation automatically ends upon termination of employment for any reason.
No participant will have the right to purchase our shares at a rate which, when aggregated with purchase rights under all our employee stock purchase plans that are also outstanding in the same calendar year(s), have a fair market value of more than $25,000, determined as of the first day of the applicable offering period, for each calendar year in which such right is outstanding. The purchase price for shares of our common stock purchased under our 2012 Employee Stock Purchase Plan will be 85% of the lesser of the fair market value of our
139
common stock on (1) the first trading day of the applicable offering period and (2) the last trading day of each purchase period in the applicable offering period.
Change of control. In the event of a corporate transaction, the successor company may assume or substitute the outstanding rights to purchase shares under our 2012 Employee Stock Purchase Plan. If the successor company refuses to assume or substitute the outstanding rights, the offering period for such purchase rights will be shortened and end on a new purchase date on or prior to the consummation of the corporate transaction and no new offering period will commence.
401(k) plan
We maintain a tax-qualified retirement plan that provides eligible employees with an opportunity to save for retirement on a tax-advantaged basis. Eligible employees are able to participate in the 401(k) plan as of the first day of the month on or following the date they begin employment and participants are able to defer their eligible compensation subject to applicable annual Code limits. The 401(k) plan permits us to make profit sharing contributions to eligible participants, although such contributions are not required and are not currently contemplated. Contributions are allocated to each participant's individual account and are then invested in selected investment alternatives according to the participants' directions. All accounts are 100% vested at all times. The 401(k) plan is intended to qualify under Sections 401(a) and 501(a) of the Code. As a tax-qualified retirement plan, contributions to the 401(k) plan and earnings on those contributions are not taxable to the employees until distributed from the 401(k) plan and all contributions are deductible by us when made.
Other
We currently have employees in Bermuda, Canada, China, Hong Kong, Mexico, Singapore, Taiwan, the United Arab Emirates, and the United Kingdom. In addition to providing statutorily mandated benefit programs in each country and territory, we contribute to private plans for health, pension and insurance benefits in the countries and territories where those contributions are customarily provided to employees.
Limitations on liability and indemnification matters
Our restated certificate of incorporation contains provisions that limit the liability of our directors for monetary damages to the fullest extent permitted by Delaware law. Consequently, our directors will not be personally liable to us or our stockholders for monetary damages for any breach of fiduciary duties as directors, except liability for:
- •
- any breach of the director's duty of loyalty to us or our stockholders;
- •
- any act or omission not in good faith or that involves intentional misconduct or a knowing violation of law;
- •
- unlawful payments of dividends or unlawful stock repurchases or redemptions as provided in Section 174 of the
Delaware General Corporation Law; or
- •
- any transaction from which the director derived an improper personal benefit.
Our restated certificate of incorporation provides that we are required to indemnify our directors and our restated bylaws provide that we are required to indemnify our directors and officers, in each case to the fullest extent permitted by Delaware law. Any repeal of or
140
modification to our restated certificate of incorporation or restated bylaws may not adversely affect any right or protection of a director or officer for or with respect to any acts or omissions of such director or officer occurring prior to such amendment or repeal. Our restated bylaws also provide that we shall advance expenses incurred by a director or officer in advance of the final disposition of any action or proceeding, and permit us to secure insurance on behalf of any officer, director, employee or other agent for any liability arising out of his or her actions in that capacity regardless of whether we would otherwise be permitted to indemnify him or her under the provisions of Delaware law. We have entered and expect to continue to enter into agreements to indemnify our directors, executive officers and other employees as determined by our Board of Directors. With certain exceptions, these agreements provide for indemnification for related expenses including, among other things, attorneys' fees, judgments, fines and settlement amounts incurred by any of these individuals in any action or proceeding. We believe that these bylaw provisions and indemnification agreements are necessary to attract and retain qualified persons as directors and officers. We also maintain directors' and officers' liability insurance.
The limitation of liability and indemnification provisions in our restated certificate of incorporation and restated bylaws may discourage stockholders from bringing a lawsuit against our directors for breach of their fiduciary duty. They may also reduce the likelihood of derivative litigation against our directors and officers, even though an action, if successful, might benefit us and other stockholders. Further, a stockholder's investment may be adversely affected to the extent that we pay the costs of settlement and damage awards against directors and officers as required by these indemnification provisions. At present, there is no pending litigation or proceeding involving any of our directors, officers or employees for which indemnification is sought, and we are not aware of any threatened litigation that may result in claims for indemnification.
141
Certain relationships and related party transactions
In addition to the executive officer and director compensation arrangements discussed above under "Management," the following is a description of transactions since January 1, 2008 to which we have been a participant, in which the amount involved in the transaction exceeds or will exceed $120,000 per year and in which any of our directors, executive officers or holders of more than 5% of our capital stock, or any immediate family member of, or person sharing the household with, any of these individuals, had or will have a direct or indirect material interest.
Issuance of convertible notes and shares of common stock to entities affiliated with Camden Partners
In April 2008, we issued and sold an aggregate of $3.0 million of convertible notes, or the 2008 Notes, to entities affiliated with Camden Partners, a beneficial owner of more than 5% of our capital stock following the conversion of the 2008 Notes into shares of our common stock. In addition, Shane Kim, an employee of Camden Partners, was appointed to our Board of Directors in April 2011. The 2008 Notes had an expiration date of April 21, 2012 and were initially convertible into 1,333,333 shares of common stock at any time at the option of the holders, or automatically upon the achievement of certain milestones, such as a qualified initial public offering in the United States (as defined in the 2008 Notes) or the attainment of a certain stock price and trading volume on AIM as set forth in the 2008 Notes. The initial interest rate on the 2008 Notes was 8% per annum, payable semi-annually, but as a result of the issuance of a convertible note of $100,000 to another party in December 2008, the interest rate on the 2008 Notes was increased to 9% per annum. Interest payments through December 31, 2008, totaling $168,870, were capitalized and added to the principal amount. In addition, interest payments through December 31, 2008, totaling $811,056, were capitalized and added to the principal amount of convertible notes issued to entities affiliated with Camden Partners and certain other persons in February 2007, or the 2007 Notes. As of April 25, 2011, the principal amount of convertible debt owed to entities affiliated with Camden Partners and certain other persons was $8,979,926. Prior to April 25, 2011, at our option, we had issued an aggregate of 1,452,138 shares of common stock in lieu of cash payments for interest payable under the 2007 Notes and 2008 Notes.
On April 25, 2011, entities affiliated with Camden Partners and certain other persons converted all of the 2007 Notes and the 2008 Notes into an aggregate of 4,049,776 shares of common stock. In addition, we issued 425,000 shares of common stock in lieu of cash payments for accrued interest and a prepayment fee negotiated at the time of conversion. The shares issued for the accrued interest and the prepayment fee were valued at the average closing price of our common stock on AIM under the symbol "PPTR" during the period immediately prior to the conversion.
Common stock issuances to Andrew Paul
In March 2009, we issued an aggregate of 6,659,000 shares of common stock at a per share purchase price of either £0.32 per share for investors located in the United Kingdom or $0.45 per share for investors located in the United States, including the issuance of 667,000 shares of common stock to Andrew Paul, a beneficial owner of more than 5% of our capital stock, for an aggregate purchase price of $300,150.
142
In November 2009, we issued an aggregate of 3,076,000 shares of common stock at a per share purchase price of $1.30 per share, including the issuance of 192,000 shares of common stock to an entity owned by Mr. Paul for an aggregate purchase price of $249,600.
Repayment of long-term debt and warrant exercise
In November 2010, we repaid in full the $4.0 million of long-term debt issued to Inter-Atlantic Fund L.P., or Inter-Atlantic, a beneficial owner of more than 5% of our capital stock, in 2005 under a note. In connection with the original issuance of the long-term debt, we granted a warrant to purchase 3,053,435 shares of common stock. In connection with the repayment, Inter-Atlantic partially exercised, at a per share price of $1.31, 1,526,718 shares of common stock pursuant to this warrant, which we issued in December 2010, and this warrant was amended to (i) extend the exercise period for the remaining unexercised shares subject to the warrant to November 30, 2015 from November 30, 2012 and (ii) reduce the remaining number of unexercised shares subject to the warrant by 145,000 shares to 1,381,717 shares.
From January 1, 2008 through the repayment of the long-term debt, we issued Inter-Atlantic an aggregate of 777,370 shares of common stock in lieu of cash payments for interest payable under this long-term debt.
Rental property payments
During 2008, 2009, 2010 and the nine months ended September 30, 2011, we paid rent pursuant to a lease for our headquarters to BDP Realty Associates, LLC of $416,047, $463,936, $493,037, and $365,291, respectively. Philip D. Beck, the Chairman of our Board of Directors, Chief Executive Officer and President, has a one-third membership interest in BDP Realty Associates, LLC.
Equity grants
Certain stock option and restricted stock grants to our executive officers and directors, and related stock option grant policies, are described in this prospectus under the caption "Management—Director compensation" and "Management—Executive compensation."
Employment arrangements and indemnification agreements
We have entered into employment arrangements with certain of our executive officers. See "Management—Executive compensation—Potential payments upon termination or change of control."
We entered or will enter into indemnification agreements with each of our directors and executive officers. The indemnification agreements and our restated certificate of incorporation and restated bylaws require us to indemnify our directors and executive officers to the fullest extent permitted by Delaware law. See "Management—Limitations on liability and indemnification matters."
Review, approval or ratification of transactions with related parties
We anticipate that our charters of our Audit Committee and our Nomination and Governance Committee to be adopted by our Board of Directors will require that any transaction with a related party that must be reported under applicable rules of the SEC, other than compensation related matters, must be reviewed and approved or ratified by our Audit Committee, unless the related party is, or is associated with, a member of that committee, in which event the transaction must be reviewed and approved by our Nomination and Governance Committee. These committees have not adopted policies or procedures for review of, or standards for approval of, these transactions.
143
Principal and selling stockholders
The following table sets forth certain information with respect to the beneficial ownership of our common stock as of December 31, 2011 and as adjusted to reflect the sale of common stock offered by us and the selling stockholders in this offering, for:
- •
- each person who we know beneficially owns more than 5% of our common stock;
- •
- each of our directors;
- •
- each of our named executive officers;
- •
- all of our directors and executive officers as a group; and
- •
- each selling stockholder.
Beneficial ownership in this table is determined in accordance with the rules of the SEC. Except as indicated by the footnotes below, we believe, based on the information available to us, that the persons and entities named in the table below have sole voting and investment power with respect to all shares of common stock that they beneficially own, subject to applicable community property laws.
Applicable percentage ownership is based on 58,615,549 shares of common stock outstanding at December 31, 2011, after giving effect to the automatic conversion of all outstanding shares of our convertible preferred stock into 6,851,144 shares of common stock effective upon the completion of this offering. For purposes of the table below, we have assumed that shares of common stock will be sold in this offering. In computing the number of shares of common stock beneficially owned by a person and the percentage ownership of that person, we deemed to be outstanding all shares of common stock subject to options, warrants or other convertible securities held by that person or entity that are currently exercisable or exercisable within 60 days of December 31, 2011. We did not deem these shares outstanding, however, for the purpose of computing the percentage ownership of any other person. Unless otherwise
144
indicated, the address of each beneficial owner listed in the table below is c/o Planet Payment, Inc., 670 Long Beach Blvd., Long Beach, New York 11561.
| |
Shares beneficially owned prior to this offering |
|
Shares beneficially owned after this offering |
||||||||||||||
|---|---|---|---|---|---|---|---|---|---|---|---|---|---|---|---|---|---|
| |
Number of shares being offered |
||||||||||||||||
| Name of beneficial owner |
Number |
Percentage |
|
Percentage |
|||||||||||||
Directors and executive officers: |
|||||||||||||||||
Philip D. Beck(1) |
3,443,119 | 5.8 | % | % | |||||||||||||
Graham N. Arad(2) |
1,535,603 | 2.6 | |||||||||||||||
Robert J. Cox III(3) |
266,667 | * | |||||||||||||||
Kieth W. Flaherty(4) |
145,323 | * | |||||||||||||||
Alan M. Lubitz(5) |
344,468 | * | |||||||||||||||
Lady Barbara T. Judge(6) |
265,917 | * | |||||||||||||||
Jonathan Kaiden(7) |
309,779 | * | |||||||||||||||
Shane H. Kim(8) |
6,763,056 | 11.5 | |||||||||||||||
Cameron R. M. McColl(9) |
570,337 | * | |||||||||||||||
All executive officers and directors as a group (11 persons)(10) |
13,853,329 | 23.5 | |||||||||||||||
5% stockholders: |
|||||||||||||||||
Entities affiliated with Camden Partners Strategic Manager, LLC(8) |
6,747,056 | 11.5 | |||||||||||||||
Entities affiliated with Kinderhook Partners, L.P.(11) |
5,502,165 | 9.4 | |||||||||||||||
Entities affiliated with Andwel Partners(12) |
5,034,776 | 8.6 | |||||||||||||||
Inter-Atlantic Fund, LP(13) |
4,502,065 | 7.5 | |||||||||||||||
Andrew Paul and affiliated entities(14) |
4,126,390 | 7.0 | |||||||||||||||
Entities affiliated with Blackrock Investment Management (UK) Limited(15) |
4,054,978 | 6.9 | |||||||||||||||
Entities affiliated with FIL Limited (Fidelity International)(16) |
3,840,300 | 6.6 | |||||||||||||||
Other selling stockholders: |
|||||||||||||||||
|
|||||||||||||||||
|
|||||||||||||||||
|
|||||||||||||||||
|
|||||||||||||||||
|
|||||||||||||||||
- *
- Less
than 1%.
- (1)
- Includes
(i) options exercisable for 1,007,991 shares of common stock within 60 days of December 31, 2011, (ii) 98,000 shares
beneficially owned by Mr. Beck through family members, (iii) 22,000 shares held by BDP Realty Associates, LLC in which Mr. Beck holds a one-third membership
interest, and (iv) 915,000 shares of restricted stock that are subject to a right of repurchase in our favor upon Mr. Beck's cessation of service prior to vesting or if performance goals are
not achieved.
- (2)
- Includes
(i) options exercisable for 390,197 shares of common stock within 60 days of December 31, 2011 and (ii) 33,900 shares
beneficially owned by Mr. Arad through family members.
- (3)
- Includes options exercisable for 166,667 shares of common stock within 60 days of December 31, 2011.
145
- (4)
- Represents
options exercisable for 145,323 shares of common stock within 60 days of December 31, 2011.
- (5)
- Includes
options exercisable for 338,968 shares of common stock within 60 days of December 31, 2011.
- (6)
- Includes
options exercisable for 210,917 shares of common stock within 60 days of December 31, 2011.
- (7)
- Include
(i) options exercisable for 210,917 shares of common stock within 60 days of December 31, 2011 and (ii) 42,550 shares
held by Kaiden Investment Group.
- (8)
- Includes
an option held by Mr. Kim exercisable for 16,000 shares of common stock within 60 days of December 31, 2011. Also includes
(i) 1,997,513 shares held by Camden Partners Strategic Fund II-A, L.P., (ii) 118,496 shares held by Camden Partners Strategic Fund II-B, L.P.,
(iii) 4,446,267 shares held by Camden Partners Strategic Fund III, L.P. and (iv) 184,780 shares held by Camden Partners Strategic Fund III-A, L.P. (together, the "Camden
Funds"). The general partner of Camden Partners Strategic Fund II-A, L.P. and Camden Partners Strategic Fund II-B, L.P. is Camden Partners Strategic
II, LLC ("Fund II GP"). The general partner of Camden Partners Strategic Fund III, L.P. and Camden Partners Strategic Fund III-A, L.P. is Camden Partners Strategic
III, LLC ("Fund III GP"). The managing member of Fund II GP and Fund III GP is Camden Partner Strategic Manager, LLC ("Managing Member"), which has the sole
voting and investment power over the shares held by the Camden Funds. The managing members of the Managing Member are David L. Warnock, Donald W. Hughes, Richard M. Johnston and
Richard M. Berkeley. Mr. Kim and the Managing Member disclaim beneficial ownership of the shares except to their pecuniary interest in each. The address for Mr. Kim and the
entities affiliated with the Managing Member is 500 East Pratt Street, Suite 1200, Baltimore, Maryland 21202.
- (9)
- Includes
options exercisable for 210,917 shares of common stock within 60 days of December 31, 2011.
- (10)
- Includes
(i) options exercisable for 2,839,457 shares of common stock within 60 days of December 31, 2011 that are held by our
directors and officers as a group and (ii) 915,000 shares of restricted stock that are subject to a right of repurchase in our favor upon Mr. Beck's cessation of service prior to vesting or if
performance goals are not achieved.
- (11)
- The
general partner of Kinderhook Partners, L.P. is Kinderhook GP, LLC and the managers of Kinderhook GP, LLC are Stephen J. Clearman and
Tushar Shah. Kinderhook GP, LLC, Stephen Clearman and Tushar Shah hold shared voting and investment power over the shares owned by Kinderhook Partners, L.P. The address of the entities affiliated with
Kinderhook Partners, L.P. is 1 Executive Drive, Suite 160, Fort Lee, New Jersey 07024.
- (12)
- Includes
4,325,813 shares of common stock issuable upon the conversion of Series A Preferred Stock. The owners and managers of Andwel Partners are
Patrick Welsh and Bruce Anderson, who hold shared voting and investment power over the shares held by Andwel Partners. The address of the entities affiliated with Andwel Partners is 320 Park Avenue,
25th Floor, New York, New York 10022.
- (13)
- Includes
(i) 3,120,348 shares of common stock and (ii) 1,381,717 shares of common stock issuable upon exercise of warrants. The general
partner of Inter-Atlantic Fund, LP is Inter-Atlantic Advisors, Ltd. The directors of Inter-Atlantic Advisors, Ltd are Andrew Lerner, Brett Baris, Frederick Hammer, Robert Lichten,
and Michael Esposito. The beneficial owners of Inter-Atlantic Advisors, Ltd. are Andrew Lerner, Robert Lichten, Frederick Hammer, Michael Esposito Jr., Brett Baris, Mike Mazzola, Thomas
Donahue, Eduardo Bohorquez, and Joseph Vadapalas. The directors and beneficial owners of Inter-Atlantic Advisors, Ltd share voting and investment power over the shares held by Inter-Atlantic Fund, LP.
The address of Inter-Atlantic Fund, LP is 142 West 57th Street, Floor 11, New York, New York 10019.
- (14)
- Includes
(i) 2,162,907 shares of common stock issuable upon the conversion of Series A Preferred Stock and (ii) 192,000 shares held by
Pondfield Holdings L.P. Mr. Paul is the managing member of Pondfield Holdings L.P. and holds sole voting and investment power. The address of Mr. Paul and his Pondfield
Holdings L.P. is 283 Pondfield Road, Bronxville, New York 10708.
- (15)
- BlackRock
Investment Management (UK) Limited is a subsidiary of BlackRock, Inc. The independent directors of BlackRock, Inc. are Laurence
Fink, Robert Kapito, James Rohr, Thomas O'Brien Jr., David Komansky, William Demchak, Dennis Dammerman, Mathis Cabiallavetta, Abdlatif Al-Hamad, Robert Diamond Jr., Ivan Seidenberg,
Kenneth Dunn, Murry Gerber, James Grosfeld, Sir Deryck Maughan, Thomas Montag, Linda Gosden Robinson, and John Varley. The directors of BlackRock Inc. hold shared voting and investment power over the
shares held by Blackrock Investment Management (UK) Limited. The address of the entities affiliated with Blackrock, Inc. is 40 East 52nd Street, New York,
New York 10022.
- (16)
- FIL Investments International holds the shares as an agent for Fidelity Funds SICAV in relation to Fidelity's European Smaller Companies Pool (F/ESM). FIL Investments International is managed by FIL Fund Management Limited, which is a subsidiary of FIL Limited (Fidelity Limited). The address of the entities affiliated with FIL Limited (Fidelity International) is Pembroke Hall, 42 Crow Lane, Hamilton, Bermuda.
146
Since March 20, 2006, shares of our common stock have traded on AIM under the symbols "PPT" and "PPTR," and immediately subsequent to this offering will continue to trade on AIM. Since November 19, 2008, shares of our common stock have traded on the OTCQX under the symbol "PLPM," and immediately subsequent to this offering will cease to trade on the OTCQX.
Upon the completion of this offering, our authorized capital stock will consist of 250,000,000 shares of common stock, $0.01 par value per share, and 10,000,000 shares of preferred stock, $0.01 par value per share. A description of the material terms and provisions of our restated certificate of incorporation and restated bylaws affecting the rights of holders of our capital stock is set forth below. The description is intended as a summary, and is qualified in its entirety by reference to the form of our restated certificate of incorporation and the form of our restated bylaws to be adopted prior to the completion of this offering, but to be effective only upon the completion of this offering, that will be filed with the registration statement relating to this prospectus.
As of December 31, 2011, and after giving effect to the automatic conversion of all of our outstanding preferred stock into common stock upon completion of this offering, there were outstanding 58,615,549 shares of our common stock held by approximately 265 stockholders of record.
Common stock
Dividend rights
Subject to preferences that may apply to shares of preferred stock outstanding at the time, the holders of outstanding shares of our common stock are entitled to receive dividends out of funds legally available if our Board of Directors, in its discretion, determines to issue dividends and only then at the times and in the amounts that our Board of Directors may determine.
Voting rights
Each holder of common stock is entitled to one vote for each share of common stock held on all matters submitted to a vote of stockholders. Our restated certificate of incorporation will not provide for the right to cumulate votes for the election of directors. Our restated certificate of incorporation will continue to provide for a classified Board of Directors, to be divided into three classes with staggered three-year terms. Only one class of directors will be elected at each annual meeting of our stockholders, with the other classes continuing for the remainder of their respective three-year terms.
No preemptive or similar rights
Our common stock is not entitled to preemptive rights and is not subject to conversion, redemption or sinking fund provisions.
Right to receive liquidation distributions
Upon our dissolution, liquidation or winding-up, the assets legally available for distribution to our stockholders are distributable ratably among the holders of our common stock, subject to prior satisfaction of all outstanding debt and liabilities and the preferential rights and payment of liquidation preferences, if any, on any outstanding shares of preferred stock.
147
Preferred stock
Immediately prior to the completion of this offering, all outstanding shares of our convertible preferred stock will convert into 6,851,144 shares of common stock.
Following this offering, we will be authorized, subject to limitations prescribed by Delaware law, to issue preferred stock in one or more series, to establish from time to time the number of shares to be included in each series and to fix the designation, powers, preferences and rights of the shares of each series and any of its qualifications, limitations or restrictions. Our Board of Directors also can increase or decrease the number of shares of any series, but not below the number of shares of that series then outstanding, without any further vote or action by our stockholders. Our Board of Directors may authorize the issuance of preferred stock with voting or conversion rights that could adversely affect the voting power or other rights of the holders of the common stock. The issuance of preferred stock, while providing flexibility in connection with possible acquisitions and other corporate purposes, could, among other things, have the effect of delaying, deferring or preventing a change of control of our company and may adversely affect the market price of our common stock and the voting and other rights of the holders of common stock. We have no current plan to issue any shares of preferred stock.
Options
As of December 31, 2011, we had options to purchase 7,776,948 shares of our common stock outstanding pursuant to our 2000 Stock Incentive Plan and our 2006 Equity Incentive Plan with a weighted-average exercise price of approximately $2.27 per share.
Warrants
As of December 31, 2011, we had outstanding warrants to purchase an aggregate of 726,858 shares of common stock with a weighted-average exercise price of approximately $2.29 per share, which warrants do not expire upon the completion of this offering, and a warrant to purchase 1,381,717 shares of common stock with an exercise price of $1.31 per share, which will be automatically net exercised upon the completion of this offering, if not exercised before then. The exercise price of each warrant may be paid either in cash or by surrendering the right to receive shares of common stock having a value equal to the exercise price.
Registration rights
Pursuant to the terms of a registration rights agreement, dated as of November 10, 2004, as amended, entered into by us and certain of our investors, as of December 31, 2011, the holders of shares of our common stock are entitled to rights with respect to the registration of their shares following this offering under the Securities Act, as described below.
Demand registration rights
At any time beginning six months after the effective date of this offering, upon the written request of at least a majority of the holders of shares having registration rights that we file a registration statement under the Securities Act, we will be obligated to effect, as soon as practicable, the registration of such shares. We are required to effect no more than two registration statements upon exercise of these demand registration rights in accordance with the terms of the registration rights agreement, provided, that, in the event that the
148
underwriters reduce the number of shares that may be registered by over 50%, we will be required to effect one additional registration statement upon the exercise of these demand registration rights. We may postpone the filing of a registration statement for up to 120 days once in a 12-month period if we determine that the filing would be seriously detrimental to us.
Piggyback registration rights
If we register any of our securities for public sale, the stockholders with registration rights will have the right to include their shares in the registration statement. However, this right does not apply to a registration relating to any of our employee benefit plans, corporate reorganization, any other transaction covered by Rule 145 promulgated under the Securities Act, or a registration on any registration form that does not permit secondary sales or does not include substantially the same information as would be required to be included in a registration statement covering the sale of shares held by stockholders with registration rights. The underwriters of any underwritten offering will have the right to limit, due to marketing factors, the number of shares registered by these holders to 30% of the total shares covered by the registration statement, except for this offering from which the underwriters can limit all of the shares held by stockholders with registration rights.
Form S-3 registration rights
The holders of at least a majority of shares having registration rights can request that we register all or a portion of their shares on Form S-3 if we are eligible to file a registration statement on Form S-3 and the aggregate price to the public of the shares offered is at least $3,000,000. We are required to file no more than one registration statement on Form S-3 upon exercise of these rights per 12-month period. We may postpone the filing of a registration statement on Form S-3 for up to 120 days once in a 12-month period if we determine that the filing would be seriously detrimental to us.
Registration expenses
We will pay all expenses incurred in connection with each of the registrations described above, including the reasonable fees and disbursements of one counsel for the holders of registration rights, but excluding underwriters' and brokers' discounts and commissions. However, we will not pay for any expenses of any demand registration if the request is subsequently withdrawn by a majority of the holders requesting that we file such a registration statement, subject to limited exceptions.
Expiration of registration rights
The registration rights described above will expire five years after this offering is completed. The registration rights will terminate earlier with respect to a particular stockholder to the extent all of the shares held by such holder may be sold under Rule 144 of the Securities Act in any three month period.
149
Anti-takeover provisions
The provisions of Delaware law, our restated certificate of incorporation and our restated bylaws may have the effect of delaying, deferring or discouraging another person from acquiring control of our company.
Delaware law
We are governed by the provisions of Section 203 of the Delaware General Corporation Law regulating corporate takeovers. This section prevents some Delaware corporations from engaging, under some circumstances, in a business combination, which includes a merger or sale of at least 10% of the corporation's assets with any interested stockholder, meaning a stockholder who, together with affiliates and associates, owns or, within three years prior to the determination of interested stockholder status, owned 15% or more of the corporation's outstanding voting stock, unless:
- •
- the transaction is approved by the board of directors prior to the time that the interested stockholder became an
interested stockholder;
- •
- upon consummation of the transaction which resulted in the stockholder's becoming an interested stockholder, the
interested stockholder owned at least 85% of the voting stock of the corporation outstanding at the time the transaction commenced; or
- •
- at or subsequent to such time that the stockholder became an interested stockholder the business combination is approved by the board of directors and authorized at an annual or special meeting of stockholders by at least two-thirds of the outstanding voting stock which is not owned by the interested stockholder.
A Delaware corporation may opt out of these provisions with an express provision in its original certificate of incorporation or an express provision in its certificate or incorporation or bylaws resulting from a stockholders' amendment approved by at least a majority of the outstanding voting shares. We do not plan to opt out of these provisions. The statute could prohibit or delay mergers or other takeover or change of control attempts and, accordingly, may discourage attempts to acquire us.
Restated certificate of incorporation and restated bylaw provisions
Our restated certificate of incorporation and our restated bylaws will include a number of provisions that may have the effect of deterring hostile takeovers or delaying or preventing changes in control of our management team, including the following:
- •
- Board of directors vacancies. Our restated certificate of
incorporation and restated bylaws will authorize only our Board of Directors to fill vacant directorships. Similarly, under our current certificate of incorporation and bylaws, only our Board of
Directors is authorized to fill vacant directorships. In addition, the number of directors constituting our Board of Directors will be set only by resolution adopted by a majority vote of our entire
Board of Directors. These provisions prevent a stockholder from increasing the size of our Board of Directors and gaining control of our Board of Directors by filling the resulting vacancies with its
own nominees.
- •
- Classified board. Our restated certificate of incorporation and restated bylaws will provide that our Board of Directors is classified into three classes of directors. Similarly, under our
150
current certificate of incorporation and bylaws, our Board of Directors is already classified into three classes of directors. The existence of a classified board could delay a successful tender offeror from obtaining majority control of our Board of Directors, and the prospect of that delay might deter a potential offeror.
- •
- Stockholder action; special meeting of stockholders. Our
restated certificate of incorporation will provide that our stockholders may not take action by written consent, but may only take action at annual or special meetings of our stockholders.
Stockholders will not be permitted to cumulate their votes for the election of directors. Our restated bylaws will further provide that special meetings of our stockholders may be called only by our
chairman of the board, our chief executive officer, our president or a majority of our Board of Directors.
- •
- Advance notice requirements for stockholder proposals and director
nominations. Our restated bylaws will provide advance notice procedures for stockholders seeking to bring business before our annual
meeting of stockholders, or to nominate candidates for election as directors at our annual meeting of stockholders. Our restated bylaws also will specify certain requirements regarding the form and
content of a stockholder's notice. These provisions may preclude our stockholders from bringing matters before our annual meeting of stockholders or from making nominations for directors at our annual
meeting of stockholders.
- •
- Issuance of undesignated preferred stock. After the filing
of our restated certificate of incorporation, our Board of Directors will have the authority, without further action by the stockholders, to issue up to 10,000,000 shares of undesignated preferred
stock with rights and preferences, including voting rights, designated from time to time by our Board of Directors. The existence of authorized but unissued shares of preferred stock enables our Board
of Directors to render more difficult or to discourage an attempt to obtain control of us by means of a merger, tender offer, proxy contest or otherwise.
- •
- Super majority vote to amend certificate of incorporation and bylaws. Our restated certificate of incorporation will provide that if two-thirds of our Board of Directors approves the amendment of our certificate of incorporation and bylaws, or any provisions thereof, then such amendment need only be approved by stockholders holding a majority of our outstanding shares of common stock entitled to vote. Otherwise, such amendment must be approved by stockholders holding two-thirds of our outstanding shares of common stock entitled to vote.
Stock exchange listing
We have applied to list our common stock on The NASDAQ Global Market under the symbol "PLPM." Since March 20, 2006, shares of our common stock have traded on AIM under the symbols "PPT" and "PPTR," and immediately subsequent to this offering will continue to trade on AIM. Since November 19, 2008, shares of our common stock have traded on the OTCQX under the symbol "PLPM," and immediately subsequent to this offering will cease to trade on the OTCQX.
Transfer agent and registrar
The transfer agent and registrar for our common stock is Computershare Investor Services. Affiliates of our transfer agent in each of the United States and the United Kingdom are collectively responsible for managing both our legal share register in the United States and the United Kingdom and our interaction, including moving our shares into and out of, both the United Kingdom's CREST electronic clearing system, or CREST, and Depositary Trust Company, or DTC, systems.
151
Our common stock and trading in the United States
and the United Kingdom
All of our issued and outstanding shares of common stock will be listed for trading on both The NASDAQ Global Market and AIM in the United Kingdom. Our common stock has traded, and immediately subsequent to this offering will cease to trade, on the OTCQX.
Our common stock in the United States which is being sold in this offering
Our common stock to be sold through this offering will be registered with the SEC. In the United States, participating brokerage firms hold freely-tradable shares electronically (also referred to as "book-entry" or in "street name") through DTC, a third party that was founded and is owned by member brokerage firms. DTC then establishes an account in its electronic system and allocates interests in the shares among the brokerage firms, which in turn credit the accounts of brokerage customers. In accordance with market practice in the United States and system requirements of stock markets, the underwriters have designated that the common stock sold in this offering by us and our selling stockholders be issued or transferred, as applicable, to DTC. There is no contractual arrangement between Planet Payment and DTC.
Accordingly, the common stock sold in this offering, by us and the selling stockholders, will be reflected as a book entry in the ledgers maintained by DTC. Beneficial interests in the common stock therefore will be eligible for trading through a member brokerage firm and will be held in electronic form through DTC. DTC will then establish an electronic account and allocate the beneficial interests in the certificated shares among its member brokerage firm accounts, who will in turn credit the beneficial interests to the accounts of the brokerage customers.
If you purchase common stock in the offering, you must look solely to your broker or bank for the payment of all dividends, the exercise of voting rights attaching to our shares of common stock and all other rights arising in respect of our shares of common stock. Your broker or bank must, in turn, look solely to DTC for the payment of all dividends, the exercise of voting rights attaching to our shares of common stock and all other rights arising with respect to our shares of common stock.
You may request through your broker to hold shares in registered form instead of holding shares indirectly through DTC. Your broker may obtain on your behalf a Direct Registration Transaction advice through Computershare. Please consult with your broker or bank to determine those procedures. If you hold your beneficial interests in our shares through DTC, because you are not an actual stockholder, you may only look to your broker or bank for recourse related to your beneficial interest in the shares.
Our common stock in the United States which is not being sold in this offering
All of our shares of common stock that are not issued and registered for sale by us or by the selling stockholders through this offering are considered "restricted securities" in the United States under the rules of the SEC, although our shares of common stock are currently trading, and will continue to trade after the completion of this offering, on AIM, without the restriction described below. In general, restricted securities are eligible for resale in the United States under Rule 144, as promulgated by the SEC under the Securities Act. Among other things, Rule 144 requires holders of securities not registered in the United States to have held
152
such securities for a minimum holding period and, in certain cases, to be subject to certain volume limitations, prior to selling such securities in the United States. Under the rules of the SEC, resales under Rule 144 are not eligible until this prospectus has been effective for 90 days. Even then, resales under Rule 144 may not be available for certain stockholders for a further 90 days until restrictions imposed by the underwriters of this offering through contractual lock-up agreements have lapsed. In addition, subject to any contractual lock-up agreement, if such a person is not an affiliate of ours and has beneficially owned the shares proposed to be sold for at least one year, including the holding period of any prior owner other than our affiliates, then that person is entitled to sell those shares immediately without complying with any of the requirements of Rule 144. For a more detailed description of Rule 144, see "Shares eligible for future sale" in this prospectus.
Shares of common stock which are restricted securities may contain a restrictive legend and may only be transferred or exchanged in the United States pursuant to an effective registration statement under the Securities Act or an available exemption from the registration requirements of the Securities Act, such as in accordance with Rule 144. All holders of common stock that are restricted securities are entitled to the same rights and privileges as all of our other stockholders.
Our common stock traded on AIM in the United Kingdom
All of the shares of our common stock are admitted for trading on AIM and will be listed for trading on The NASDAQ Global Market. Our shares that trade on AIM under the ticker "PPT" are held in certificated form by individual stockholders or by Computershare, which acts as a depositary, pursuant to a trust deed with us. Computershare Company Nominees Limited, in turn, issues Depositary Interests, or DIs, to each of the brokerage firms that are members of CREST, which hold interests in shares on behalf of their clients who are stockholders. DIs are traded through CREST, operated by Euroclear U.K. & Ireland Limited. Our shares that trade on AIM under the ticker "PPTR" are held in certificated form, as will all shares held by Cede & Co. for DTC. Shares of our common stock that trade under the ticker "PPT" are unrestricted. Shares of our common stock that trade under the ticker "PPTR" are restricted under Regulation S of the Securities Act and are considered "restricted securities" under Rule 144. The legends on "PPTR" shares require the seller and seller's broker to provide standard letters in connection with a sale of stock, under which they represent that the sale is in compliance with the offshore resale requirements of Rule 904 of the Securities Act. We expect that in due course after the completion of this offering, our shares will cease trading on AIM under the ticker "PPTR" but will continue to trade on AIM under the ticker "PPT."
The AIM Rules
For so long as any of our common stock is admitted for trading on AIM, we are subject to the AIM Rules. A copy of the AIM Rules may be obtained at the London Stock Exchange's website at www.londonstockexchange.com. The information on, or that can be accessed through, this website is not part of this prospectus.
153
The AIM Rules regulate the admission of shares to trading on AIM and impose various continuing obligations on AIM-listed companies. Under the AIM Rules, we are obliged, among other things, to:
- •
- disclose to the public details of certain transactions and various corporate and other information relating to our
business and our stockholders;
- •
- seek the approval of our stockholders for certain corporate transactions, such as reverse takeovers, transactions
resulting in fundamental changes in our business or a cancellation of our AIM listing;
- •
- publish half-yearly and annual accounts within certain time periods and in accordance with prescribed
accounting standards; and
- •
- ensure that our directors and certain employees do not deal in our shares during prescribed periods prior to the publication of our financial results or when we are in possession of material non-public information.
The AIM Rules also require us to retain the services of a nominated advisor, or Nomad, and a broker. The Nomad is a full time corporate finance advisor approved by the London Stock Exchange to act in this capacity. The Nomad assesses our overall suitability for AIM and assists us in meeting our continuing obligations under the AIM Rules, maximizing the benefits of our AIM quotation and dealing with market issues as they arise. The Nomad also has responsibilities to the London Stock Exchange itself and must comply with the AIM Rules for Nominated Advisers. A broker is a securities house that is a member of the London Stock Exchange and is responsible for facilitating and promoting trading in a company's shares on the market. Often an AIM company will choose the same firm to act as both Nomad and broker and Canaccord Genuity Ltd acts in this joint capacity for us.
The AIM Rules also enable the London Stock Exchange to take various steps to fine or censure us or impose other sanctions, including suspending or cancelling the trading of our shares on AIM, should we breach the AIM Rules or in order to preserve the integrity of the market or protect investors.
Disclosure and transparency rules
We are required to notify AIM if we are notified that the percentage of voting rights a stockholder holds in us (or are deemed to hold through their direct or indirect holding of financial instruments) reaches, exceeds or falls below 3% of our total outstanding voting rights, or any 1% increment above the 3% threshold. Since we are not subject to Chapter 5 of the Disclosure and Transparency Rules of the Financial Services Authority, our stockholders are not required to provide us notification upon reaching, exceeding or falling below these thresholds. However, our restated bylaws provide that any stockholder that becomes the beneficial owner of 3% or more of our outstanding shares must submit notice within three business days of reaching or exceeding such beneficial ownership threshold, or thereafter upon acquiring additional shares representing 1% or more of our outstanding shares. In addition, we may issue a disclosure notice to any stockholder at any time and the stockholder shall be obliged to respond in writing confirming such details as the disclosure notice requires within 14 days of receipt of the disclosure notice.
154
Moving our shares of common stock between the United States and the United Kingdom
If a holder of our common stock in certificated form, other than shares which are registered in this offering, or as DIs in uncertificated form in the CREST system, wishes to sell its shares on The NASDAQ Global Market, the holder needs to use an eligible U.S. brokerage firm and, in general, abide by Rule 144. Upon sale of the common stock on The NASDAQ Global Market through an eligible U.S. brokerage firm, such firm will need to contact our transfer agent, who will either take possession of the share certificate(s) or remove the shares from the CREST system and, in turn, convert such shares to certificated form in the name of Cede & Co, as nominee for DTC. The common stock held by Cede & Co. for DTC will be then be transferred by DTC to the purchaser.
Conversely, if a holder of common stock in the United States wishes to sell its common stock via AIM using the CREST system, the holder will need to contact Computershare and request that the shares be removed from the DTC system and converted to certificated form in the name of Computershare Company Nominees Limited, who will deposit such common stock in the CREST system.
Please note that the arrangements described above may be difficult or unavailable due to:
- •
- temporary delays that may arise because the transfer books for the common stock are closed;
- •
- obligations to pay fees, taxes and similar charges that would arise; or
- •
- restrictions imposed because of laws or regulations applicable to shares of common stock in the United States or the United Kingdom.
Price range of our common stock
Since March 20, 2006, shares of our common stock have traded on AIM under the symbols "PPT" and "PPTR," and immediately subsequent to this offering will continue to trade on AIM. Since November 19, 2008, shares of our common stock have traded on the OTCQX under the symbol "PLPM," and immediately subsequent to this offering will cease to trade on the OTCQX. The following table sets forth, for the quarters indicated, the high and low intra-day sales prices per share of our common stock on AIM under the symbols "PPT" and "PPTR" and on the
155
OTCQX under the symbol "PLPM" for each quarter of our two most recent fiscal years as well as the first quarter of fiscal year 2012:
| |
Shares Traded on AIM under the ticker "PPT" (British Pound) |
Shares Traded on AIM under the ticker "PPTR" (British Pound) |
Shares Traded on the OTCQX under the ticker "PLPM" (US Dollars) |
|||||||||||||||||
|---|---|---|---|---|---|---|---|---|---|---|---|---|---|---|---|---|---|---|---|---|
| Fiscal Period |
High |
Low |
High |
Low |
High |
Low |
||||||||||||||
Fiscal Year ending December 31, 2012 |
||||||||||||||||||||
First Quarter (through January 27, 2012) |
£1.68 | £1.35 | £1.72 | £1.25 | $ | 2.75 | $ | 2.20 | ||||||||||||
Fiscal Year ended December 31, 2011 |
||||||||||||||||||||
First Quarter |
1.80 | 0.80 | 1.53 | 0.75 | 3.50 | 1.60 | ||||||||||||||
Second Quarter |
2.20 | 1.42 | 1.40 | 1.23 | 3.95 | 2.60 | ||||||||||||||
Third Quarter |
2.85 | 2.00 | 1.74 | 1.15 | 4.96 | 2.30 | ||||||||||||||
Fourth Quarter |
2.15 | 1.57 | 1.74 | 1.25 | 3.75 | 2.41 | ||||||||||||||
Fiscal Year ended December 31, 2010 |
||||||||||||||||||||
First Quarter |
1.37 | 0.95 | 1.35 | 1.05 | 2.50 | 1.60 | ||||||||||||||
Second Quarter |
1.50 | 0.75 | 1.45 | 0.85 | 2.69 | 1.25 | ||||||||||||||
Third Quarter |
0.88 | 0.35 | 0.88 | 0.58 | 1.49 | 0.80 | ||||||||||||||
Fourth Quarter |
1.08 | 0.45 | 0.88 | 0.58 | 1.75 | 0.95 | ||||||||||||||
156
Shares eligible for future sale
There has been only a limited public market for our common stock in the United States prior to this offering. Since 2006, shares of our common stock have been listed for trading on AIM in London, and since 2008 shares of our common stock have been listed for trading on the OTCQX in the United States. For further information regarding the trading of our common stock on AIM following the completion of this offering, see "Our common stock and trading in the United States and the United Kingdom." Future sales of substantial amounts of shares of our common stock, including shares issued upon the exercise of outstanding options and warrants, in the public market after the completion of this offering, or the possibility of these sales occurring, could cause the prevailing market price for our common stock to fall or impair our ability to raise equity capital in the future.
Upon the completion of this offering, a total of shares of common stock will be outstanding, assuming 58,615,549 shares outstanding as of December 31, 2011 after giving effect to the automatic conversion of all of our outstanding preferred stock into 6,851,144 shares of common stock upon completion of this offering, and assuming that there are no exercises of options or warrants after December 31, 2011. Of these shares, all shares of common stock sold in this offering by us and the selling stockholders will be freely tradable in the public market without restriction or further registration under the Securities Act, unless these shares are held by "affiliates," as that term is defined in Rule 144 under the Securities Act.
The remaining shares of common stock will be "restricted securities," as that term is defined in Rule 144 under the Securities Act. These restricted securities are eligible for public sale only if they are registered under the Securities Act or if they qualify for an exemption from registration under Rule 144 or Rule 701 under the Securities Act, which are summarized below.
As a result of the lock-up agreements described below and subject to the provisions of Rules 144 and 701 under the Securities Act, these restricted securities will be available for sale in the public market as follows:
- •
- on the date of this prospectus, of the shares will be available for sale in the public market without
restriction; and
- •
- beginning 181 days after the date of this prospectus, subject to extension as described in "Underwriting," shares will become eligible for sale in the public market, of which shares will be freely tradable under Rule 144, and shares will be freely tradable, subject to the limitations under Rules 144 and 701.
In addition, of the 9,885,523 shares of our common stock that were subject to stock options and warrants outstanding as of December 31, 2011, options and warrants to purchase 8,436,514 shares of common stock were vested as of December 31, 2011 and will be eligible for sale 181 days following the effective date of this prospectus, subject to extension as described in "Underwriting."
157
Rule 144
In general, under Rule 144, once we have been subject to public company reporting requirements for at least 90 days, a person who is not deemed to have been one of our affiliates for purposes of the Securities Act at any time during the 90 days preceding a sale and who has beneficially owned the shares proposed to be sold for at least six months, including the holding period of any prior owner other than our affiliates, is entitled to sell those shares without complying with the manner of sale, volume limitation or notice provisions of Rule 144, subject to compliance with the public information requirements of Rule 144. If such a person has beneficially owned the shares proposed to be sold for at least one year, including the holding period of any prior owner other than our affiliates, then that person is entitled to sell those shares immediately without complying with any of the requirements of Rule 144.
In general, under Rule 144, as currently in effect, our affiliates or persons selling shares on behalf of our affiliates are entitled to sell upon the expiration of the lock-up agreements described below, within any three-month period beginning 90 days after the date of this prospectus, a number of shares that does not exceed the greater of:
- •
- 1% of the number of shares of common stock then outstanding, which will equal approximately shares
immediately after the offering, or
- •
- the average weekly trading volume of the common stock on The NASDAQ Global Market during the four calendar weeks preceding the filing of a notice on Form 144 with respect to such sale.
Sales under Rule 144 by our affiliates or persons selling shares on behalf of our affiliates are also subject to certain manner of sale provisions and notice requirements and to the availability of current public information about us.
Rule 701
In general, under Rule 701 as currently in effect, any of our employees, consultants or advisors who purchase shares from us in connection with a compensatory stock or option plan or other written agreement in a transaction before the effective date of this offering that was completed in reliance on Rule 701 and complied with the requirements of Rule 701 will be eligible to resell such shares 90 days after the date of this prospectus in reliance on Rule 144, but without compliance with certain restrictions, including the holding period, contained in Rule 144.
Lock-up agreements
We and each of our directors, officers and certain stockholders, including the selling stockholders, have agreed that, subject to certain exceptions, without the prior written consent of J.P. Morgan Securities LLC on behalf of the underwriters, we and they will not, during the period ending 180 days after the date of this prospectus, offer, pledge, sell or otherwise transfer or dispose of, directly or indirectly, any shares of our common stock or any securities convertible into or exercisable or exchangeable for shares of our common stock or publicly disclose the intention to make any offer, sale, pledge or disposition.
See "Underwriting" for a more complete description of the lock-up agreements.
158
Registration rights
Upon the completion of this offering, the holders of an aggregate of shares of our common stock, or their permitted transferees, will be entitled to rights with respect to the registration of these shares under the Securities Act. Registration of these shares under the Securities Act would result in these shares becoming fully tradable without restriction under the Securities Act immediately upon the effectiveness of the registration, except for shares purchased by affiliates. See "Description of capital stock—Registration rights" for additional information.
Registration statements
As soon as practicable after this offering, we intend to file a registration statement on Form S-8 under the Securities Act covering all of the shares of common stock subject to options outstanding and reserved for issuance under our equity incentive plans. However, none of the shares registered on Form S-8 will be eligible for resale until the expiration of the lock-up agreements to which they are subject.
159
Certain material United States federal tax considerations
for non-U.S. holders of common stock
This section summarizes certain material United States federal income tax considerations relating to the ownership and disposition of common stock by non-U.S. holders. This summary does not provide a complete analysis of all potential tax considerations. The information provided below is based upon provisions of the Code and Treasury regulations promulgated thereunder, administrative rulings and judicial decisions currently in effect. These authorities may change at any time, possibly on a retroactive basis, or the Internal Revenue Service, or IRS, might interpret the existing authorities differently. In either case, the tax considerations of owning or disposing of common stock could differ from those described below. For purposes of this summary, a "non-U.S. holder" is any holder other than:
- •
- an individual who is a citizen or resident of the United States;
- •
- a corporation, or other entity taxable as a corporation for United States federal income tax purposes, created or
organized under the laws of the United States, any state or the District of Columbia;
- •
- a trust that is (1) subject to the primary supervision of a United States court and one of more United States
persons have authority to control all substantial decisions of the trust or (2) has a valid election in effect under applicable United States Treasury regulations to be treated as a United
States person; or
- •
- an estate, the income of which is subject to United States income tax regardless of source.
If you are a non-U.S. citizen that is an individual, you may, in many cases, be deemed to be a resident alien, as opposed to a nonresident alien, by virtue of being present in the United States for at least 31 days in the calendar year and for an aggregate of at least 183 days during a three-year period ending in the current calendar year. For these purposes, all the days present in the current year, one-third of the days present in the immediately preceding year, and one-sixth of the days present in the second preceding year are counted. Resident aliens are subject to United States federal income tax as if they were United States citizens. Such an individual is urged to consult his or her own tax advisor regarding the United States federal income tax consequences of the sale, exchange of other disposition of common stock. If a partnership or other pass-through entity is a beneficial owner of common stock, the tax treatment of a partner in the partnership or an owner of the entity will depend upon the status of the partner or other owner and the activities of the partnership or other entity. Any partner in a partnership or member in a pass-through entity holding shares of our common stock should consult its own tax advisor.
This discussion assumes that a non-U.S. holder will hold our common stock as a capital asset (generally, property held for investment). This summary generally does not address tax considerations that may be relevant to particular investors because of their specific circumstances, or because they are subject to special rules, including if the investor is a United States expatriate, "controlled foreign corporation," "passive foreign investment company," corporation that accumulates earnings to avoid United States federal income tax, dealer in securities or currencies, financial institution, regulated investment company, real estate investment trust, tax-exempt entity, insurance company, person holding our common stock as
160
part of a hedging, integrated, conversion or constructive sale transaction or a straddle, trader in securities that elects to use a mark-to-market method of accounting, person liable for the alternative minimum tax, person whose functional currency is other than the U.S. dollar, person who acquired our common stock as compensation for services, and partner or beneficial owner in a pass-through entity. Finally, this summary does not describe the effects of any applicable foreign, state or local laws, or, except to the extent discussed below, the effects of any applicable gift or estate tax laws.
INVESTORS CONSIDERING THE PURCHASE OF COMMON STOCK SHOULD CONSULT THEIR OWN TAX ADVISORS REGARDING THE APPLICATION OF THE UNITED STATES FEDERAL INCOME AND ESTATE TAX LAWS TO THEIR PARTICULAR SITUATIONS AND THE CONSEQUENCES OF FOREIGN, STATE OR LOCAL LAWS, AND TAX TREATIES.
Dividends
We do not expect to declare or pay any dividends on our common stock in the foreseeable future. If we do pay dividends on shares of our common stock, however, such distributions will constitute dividends for United States federal income tax purposes to the extent paid from our current or accumulated earnings and profits, as determined under United States federal income tax principles. Distributions in excess of our current and accumulated earnings and profits will constitute a return of capital that is applied against and reduces, but not below zero, a non-U.S. holder's adjusted tax basis in shares of our common stock. Any remaining excess will be treated as gain realized on the sale or other disposition of our common stock. See "—Sale of common stock."
Any dividend paid to a non-U.S. holder on our common stock will generally be subject to United States withholding tax at a 30% rate. The withholding tax might not apply, however, or might apply at a reduced rate, under the terms of an applicable income tax treaty between the United States and the non-U.S. holder's country of residence. You should consult your tax advisors regarding your entitlement to benefits under a relevant income tax treaty. Generally, in order for us or our paying agent to withhold tax at a lower treaty rate, a non-U.S. holder must certify its entitlement to treaty benefits. A non-U.S. holder generally can meet this certification requirement by providing a Form W-8BEN (or any successor form) or appropriate substitute form to us or our paying agent. If the holder holds the stock through a financial institution or other agent acting on the holder's behalf, the holder will be required to provide appropriate documentation to the agent. The holder's agent will then be required to provide certification to us or our paying agent, either directly or through other intermediaries. For payments made to a foreign partnership or other pass-through entity, the certification requirements generally apply to the partners or other owners rather than to the partnership or other entity, and the partnership or other entity must provide the partners' or other owners' documentation to us or our paying agent. If you are eligible for a reduced rate of United States federal withholding tax under an income tax treaty, you may obtain a refund or credit of any excess amounts withheld by filing an appropriate claim for a refund with the IRS in a timely manner.
Dividends received by a non-U.S. holder that are effectively connected with a U.S. trade or business conducted by the non-U.S. holder, or, if an income tax treaty between the United States and the non-U.S. holder's country of residence applies, are attributable to a permanent establishment you maintain in the United States, are not subject to such withholding tax. To
161
obtain this exemption, a non-U.S. holder must provide us with an IRS Form W-8ECI properly certifying such exemption. Such effectively connected dividends, although not subject to withholding tax, are taxed at the same graduated rates applicable to U.S. persons, net of certain deductions and credits, subject to any applicable tax treaty providing otherwise. In addition to the graduated tax described above, dividends received by corporate non-U.S. holders that are effectively connected with a U.S. trade or business of the corporate non-U.S. holder may also be subject to a branch profits tax at a rate of 30% or such lower rate as may be specified by an applicable tax treaty.
Sale of common stock
Non-U.S. holders will generally not be subject to United States federal income tax on any gains realized on the sale, exchange or other disposition of common stock unless:
- •
- the gain (1) is effectively connected with the conduct by the non-U.S. holder of a United States trade
or business and (2) if an income tax treaty between the United States and the non-U.S. holder's country of residence applies, the gain is attributable to a permanent establishment
(or, in the case of an individual, a fixed base) maintained by the non-U.S. holder in the United States (in which case the special rules described below apply);
- •
- the non-U.S. holder is an individual who is present in the United States for 183 days or more in the
taxable year of the sale, exchange or other disposition of our common stock, and certain other requirements are met (in which case the gain would be subject to a flat 30% tax, or such reduced rate as
may be specified by an applicable income tax treaty, which may be offset by United States source capital losses, even though the individual is not considered a resident of the United States); or
- •
- the rules of the Foreign Investment in Real Property Tax Act, or FIRPTA, treat the gain as effectively connected with a United States trade or business.
The FIRPTA rules may apply to a sale, exchange or other disposition of common stock if we are, or were within the shorter of the five-year period preceding the disposition and the non-U.S. holder's holding period a "U.S. real property holding corporation," or USRPHC. In general, we would be a USRPHC if interests in United States real estate comprised at least half of our assets. We do not believe that we are a USRPHC and we do not anticipate becoming one in the future. Even if we become a USRPHC, as long as our common stock is regularly traded on an established securities market, such common stock will be treated as United States real property interests only if a non-U.S. holder actually or constructively owns more than 5% of our outstanding common stock.
If any gain from the sale, exchange or other disposition of common stock, (1) is effectively connected with a United States trade or business conducted by a non-U.S. holder and (2) if an income tax treaty between the United States and the non-U.S. holder's country of residence applies, is attributable to a permanent establishment (or, in the case of an individual, a fixed base) maintained by such non-U.S. holder in the United States, then the gain generally will be subject to United States federal income tax at the regular graduated rates. If the non-U.S. holder is a corporation, under certain circumstances, that portion of its earnings and profits that is effectively connected with its United States trade or business, subject to certain adjustments, generally would be subject to a "branch profits tax." The branch profits tax rate is
162
generally 30%, although an applicable income tax treaty between the United States and the non-U.S. holder's country of residence might provide for a lower rate.
United States federal estate tax
The estates of nonresident alien individuals generally are subject to United States federal estate tax on property with a United States situs. Because we are a United States corporation, our common stock will be United States situs property and therefore will be included in the taxable estate of a nonresident alien decedent, unless an applicable tax treaty between the United States and the decedent's country of residence provides otherwise.
Foreign Account Tax Compliance Act
Recent legislation will impose withholding at a rate of 30% on payments to certain foreign entities of dividends on and the gross proceeds of dispositions of U.S. common stock, unless various U.S. information reporting and due diligence requirements (generally relating to ownership by U.S. persons of interests in or accounts with those entities) have been satisfied. Non-U.S. holders should consult their tax advisors regarding the possible implications of this legislation on their investment in our common stock.
Backup withholding and information reporting
The Code and the Treasury regulations require those who make specified payments to report the payments to the IRS. Among the specified payments are dividends and proceeds paid by brokers to their customers. The required information returns enable the IRS to determine whether the recipient properly included the payments in income. This reporting regime is reinforced by "backup withholding" rules. These rules require the payors to withhold tax from payments subject to information reporting if the recipient fails to cooperate with the reporting regime by failing to provide his taxpayer identification number to the payor, furnishing an incorrect identification number, or failing to report interest or dividends on his returns. The backup withholding tax rate is currently 28% for all payments made through December 31, 2012, set to increase to 31% thereafter. The backup withholding rules do not apply to payments to corporations, whether domestic or foreign.
Payments to non-U.S. holders of dividends on common stock generally will not be subject to backup withholding, and payments of proceeds made to non-U.S. holders by a broker upon a sale of common stock will not be subject to information reporting or backup withholding, in each case so long as the non-U.S. holder certifies its nonresident status (and we or our paying agent do not have actual knowledge or reason to know the holder is a United States person or that the conditions of any other exemption are not, in fact, satisfied) or otherwise establishes an exemption. The certification procedures to claim treaty benefits described under "—Dividends" will satisfy the certification requirements necessary to avoid the backup withholding tax as well. We must report annually to the IRS any dividends paid to each non-U.S. holder and the tax withheld, if any, with respect to these dividends. Copies of these reports may be made available to tax authorities in the country where the non-U.S. holder resides.
Under the Treasury regulations, the payment of proceeds from the disposition of shares of our common stock by a non-U.S. holder made to or through a United States office of a broker
163
generally will be subject to information reporting and backup withholding unless the beneficial owner certifies, under penalties of perjury, among other things, its status as a non-U.S. holder (and we or our paying agent do not have actual knowledge or reason to know the holder is a United States person) or otherwise establishes an exemption. The payment of proceeds from the disposition of shares of our common stock by a non-U.S. holder made to or through a non-United States office of a broker generally will not be subject to backup withholding and information reporting, except as noted below. Information reporting, but not backup withholding, will apply to a payment of proceeds, even if that payment is made outside of the United States, if you sell our common stock through a non-United States office of a broker that is:
- •
- a United States person (including a foreign branch or office of such person);
- •
- a "controlled foreign corporation" for United States federal income tax purposes;
- •
- a foreign person 50% or more of whose gross income from certain periods is effectively connected with a United States
trade or business; or
- •
- a foreign partnership if at any time during its tax year (a) one or more of its partners are United States persons who, in the aggregate, hold more than 50% of the income or capital interests of the partnership or (b) the foreign partnership is engaged in a United States trade or business;
unless the broker has documentary evidence that the beneficial owner is a non-U.S. holder and certain other conditions are satisfied, or the beneficial owner otherwise establishes an exemption (and the broker has no actual knowledge or reason to know to the contrary).
Backup withholding is not an additional tax. Any amounts withheld from a payment to a holder of common stock under the backup withholding rules can be credited against any United States federal income tax liability of the holder and may entitle the holder to a refund, provided that the required information is furnished to the IRS in a timely manner.
THE PRECEDING DISCUSSION OF UNITED STATES FEDERAL TAX CONSIDERATIONS IS FOR GENERAL INFORMATION ONLY. IT IS NOT TAX ADVICE. EACH PROSPECTIVE INVESTOR SHOULD CONSULT ITS OWN TAX ADVISOR REGARDING THE PARTICULAR UNITED STATES FEDERAL, STATE, LOCAL AND FOREIGN TAX CONSEQUENCES OF PURCHASING, HOLDING AND DISPOSING OF OUR COMMON STOCK, INCLUDING THE CONSEQUENCES OF ANY PROPOSED CHANGE IN APPLICABLE LAWS.
164
Underwriting
We and the selling stockholders are offering the shares of common stock described in this prospectus through a number of underwriters. J.P. Morgan Securities LLC, William Blair & Company, L.L.C. and Jefferies & Company, Inc. are acting as joint book-running managers of the offering and as representatives of the underwriters. Needham & Company, LLC, Oppenheimer & Co. Inc. and Canaccord Genuity Limited are acting as co-managers of the offering. We and the selling stockholders have entered into an underwriting agreement with the underwriters. Subject to the terms and conditions of the underwriting agreement, we and the selling stockholders have agreed to sell to the underwriters, and each underwriter has severally agreed to purchase, at the public offering price less the underwriting discounts and commissions set forth on the cover page of this prospectus, the number of shares of common stock listed next to its name in the following table:
| Name |
Number of shares |
|
|---|---|---|
J.P. Morgan Securities LLC |
||
William Blair & Company, L.L.C. |
||
Jefferies & Company, Inc. |
||
Needham & Company, LLC |
||
Oppenheimer & Co. Inc. |
||
Canaccord Genuity Limited |
||
Total |
||
The underwriters are committed to purchase all the shares of our common stock offered by us if they purchase any shares. The underwriting agreement also provides that if an underwriter defaults, the purchase commitments of non-defaulting underwriters may also be increased or the offering may be terminated.
The underwriters propose to offer the shares of our common stock directly to the public at the initial public offering price set forth on the cover page of this prospectus and to certain dealers at that price less a concession not in excess of $ per share. Any such dealers may resell shares to certain other brokers or dealers at a discount of up to $ per share from the initial public offering price. After the initial public offering of the shares, the offering price and other selling terms may be changed by the underwriters. Sales of shares made outside of the United States may be made by affiliates of the underwriters. Canaccord Genuity Limited will participate in the distribution of the shares offered hereby only in jurisdictions within the United Kingdom and Europe and not within the United States. The representatives have advised us that the underwriters do not intend to confirm discretionary sales in excess of five percent of the shares of common stock offered in this offering.
The underwriters have an option to buy up to additional shares of common stock from us to cover sales of shares by the underwriters which exceed the number of shares specified in the table above. The underwriters have 30 days from the date of this prospectus to exercise this over-allotment option. If any shares are purchased with this over-allotment option, the underwriters will purchase shares in approximately the same proportion as shown in the table above. If any additional shares of common stock are purchased, the underwriters will offer the additional shares on the same terms as those on which the shares are being offered.
165
The underwriting fee is equal to the public offering price per share of common stock less the amount paid by the underwriters to us per share of common stock. The underwriting fee is $ per share.
The following table shows the per share and total underwriting discounts and commissions to be paid to the underwriters assuming both no exercise and full exercise of the underwriters' option to purchase additional shares.
| |
|
Total | |||||||||
|---|---|---|---|---|---|---|---|---|---|---|---|
| |
Per share |
Without over-allotment exercise |
With full over-allotment exercise |
||||||||
Public offering price |
$ | $ | $ | ||||||||
Underwriting discounts and commissions to be paid by: |
|||||||||||
Us |
|||||||||||
The selling stockholders |
|||||||||||
Proceeds, before expenses, to us |
|||||||||||
Proceeds, before expenses, to selling stockholders |
|||||||||||
We estimate that the total expenses of this offering, including registration, filing and listing fees, printing fees and legal and accounting expenses, but excluding the underwriting discounts and commissions, will be approximately $ .
A prospectus in electronic format may be made available on the web sites maintained by one or more underwriters, or selling group members, if any, participating in the offering. The underwriters may agree to allocate a number of shares to underwriters and selling group members for sale to their online brokerage account holders. Internet distributions will be allocated by the representatives to underwriters and selling group members that may make Internet distributions on the same basis as other allocations.
We and all of our directors and officers and certain other stockholders and holders of options and warrants to purchase shares of our common stock, who, as of the date of this prospectus, collectively owned shares of our common stock (including vested options and shares of common stock underlying warrants and excluding the shares of our common stock to be sold by selling stockholders in this offering), have agreed that, without the prior written consent of J.P. Morgan Securities LLC, we and they will not, with limited exceptions, during the period ending 180 days after the date of this prospectus:
- •
- offer, pledge, sell, contract to sell, sell any option or contract to purchase, purchase any option or contract to sell,
grant any option, right or warrant to purchase, or otherwise transfer or dispose of, directly or indirectly, any shares of our common stock or any securities convertible into or exercisable or
exchangeable for common stock, or publicly disclose the intention to make any offer, sale, pledge or disposition;
- •
- enter into any swap or other agreement that transfers, in whole or in part, any of the economic consequences of ownership
of our common stock or such other securities; or
- •
- make any demand for or exercise any right with respect to the registration of any shares of our common stock or any security convertible into or exercisable or exchangeable for shares of our common stock.
166
Notwithstanding the foregoing, if (1) during the last 17 days of the 180-day restricted period, we issue an earnings release or material news or a material event relating to our company occurs; or (2) prior to the expiration of the 180-day restricted period, we announce that we will release earnings results during the 16-day period beginning on the last day of the 180-day period, the restrictions described above shall continue to apply until the expiration of the 18-day period beginning on the issuance of the earnings release or the occurrence of the material news or material event.
We, the selling stockholders and the underwriters have agreed to indemnify each other against certain liabilities, including liabilities under the Securities Act.
We have applied to have our common stock approved for listing on The NASDAQ Global Market under the symbol "PLPM."
In connection with this offering, the underwriters may engage in stabilizing transactions, which involves making bids for, purchasing and selling shares of common stock in the open market for the purpose of preventing or retarding a decline in the market price of the common stock while this offering is in progress. These stabilizing transactions may include making short sales of the common stock, which involves the sale by the underwriters of a greater number of shares of common stock than they are required to purchase in this offering, and purchasing shares of common stock on the open market to cover positions created by short sales. Short sales may be "covered" shorts, which are short positions in an amount not greater than the underwriters' over-allotment option referred to above, or may be "naked" shorts, which are short positions in excess of that amount. The underwriters may close out any covered short position either by exercising their over-allotment option, in whole or in part, or by purchasing shares in the open market. In making this determination, the underwriters will consider, among other things, the price of shares available for purchase in the open market compared to the price at which the underwriters may purchase shares through the over-allotment option. A naked short position is more likely to be created if the underwriters are concerned that there may be downward pressure on the price of the common stock in the open market that could adversely affect investors who purchase in this offering. To the extent that the underwriters create a naked short position, they will purchase shares in the open market to cover the position.
The underwriters have advised us that, pursuant to Regulation M of the Securities Act of 1933, they may also engage in other activities that stabilize, maintain or otherwise affect the price of the common stock, including the imposition of penalty bids. This means that if the representatives of the underwriters purchase common stock in the open market in stabilizing transactions or to cover short sales, the representatives can require the underwriters that sold those shares as part of this offering to repay the underwriting discount received by them.
These activities may have the effect of raising or maintaining the market price of the common stock or preventing or retarding a decline in the market price of the common stock, and, as a result, the price of the common stock may be higher than the price that otherwise might exist in the open market. If the underwriters commence these activities, they may discontinue them at any time. The underwriters may carry out these transactions on The NASDAQ Global Market, in the over-the-counter market or otherwise.
The initial public offering price will be determined by negotiations between us and the representatives of the underwriters. In determining the initial public offering price, we and the representatives of the underwriters expect to consider a number of factors including:
- •
- the information set forth in this prospectus and otherwise available to the representatives;
167
- •
- our prospects and the history and prospects for the industry in which we compete;
- •
- an assessment of our management;
- •
- our prospects for future earnings;
- •
- the general condition of the securities markets at the time of this offering;
- •
- the recent market prices of, and demand for, publicly traded common stock of generally comparable companies;
- •
- the prices of our common stock on AIM and the OTCQX during recent periods; and
- •
- other factors deemed relevant by the underwriters and us.
Our common stock has traded on AIM since March 20, 2006 under the symbols "PPT" and "PPTR" and has traded on the OTCQX since November 19, 2008 under the symbol "PLPM." It should be noted however, that historically there has been a limited volume of trading in our common stock on AIM and the OTCQX. Therefore, the prices of our common stock on AIM and the OTCQX will only be some of the factors in determining the public offering price.
Neither we nor the underwriters can assure investors that an active trading market will develop for shares of our common stock, or that the shares will trade in the public market at or above the initial public offering price.
Other than in the United States, no action has been taken by us or the underwriters that would permit a public offering of the securities offered by this prospectus in any jurisdiction where action for that purpose is required. The securities offered by this prospectus may not be offered or sold, directly or indirectly, nor may this prospectus or any other offering material or advertisements in connection with the offer and sale of any such securities be distributed or published in any jurisdiction, except under circumstances that will result in compliance with the applicable rules and regulations of that jurisdiction. Persons into whose possession this prospectus comes are advised to inform themselves about and to observe any restrictions relating to the offering and the distribution of this prospectus. This prospectus does not constitute an offer to sell or a solicitation of an offer to buy any securities offered by this prospectus in any jurisdiction in which such an offer or a solicitation is unlawful.
Certain of the underwriters and their affiliates have provided in the past to us and our affiliates and may provide from time to time in the future certain commercial banking, financial advisory, investment banking and other services for us and such affiliates in the ordinary course of their business, for which they have received and may continue to receive customary fees and commissions.
On March 14, 2006, we entered into a nominated adviser and broker agreement with Canaccord Genuity Limited, one of the co-managers of this offering, under which Canaccord Genuity Limited was appointed to act as nominated adviser and broker to us for the purposes of the rules of AIM. Since the admission of our shares to AIM on March 20, 2006, we have paid Canaccord Genuity Limited a fee of £50,000 per annum for its services, plus reasonable expenses and VAT. The nominated adviser and broker agreement contains certain undertakings given by us in respect of, among other things, compliance with the AIM rules and provision of information. The engagement may be terminated with three months' written notice by either
168
party. On September 16, 2008, we entered into an engagement letter with Canaccord Genuity, Inc., under which Canaccord Genuity, Inc. was appointed to act as our financial adviser with respect to the trading of our shares on the OTCQX, including acting as Designated Advisor for Disclosure/Principal American Liaison. We pay Canaccord Genuity, Inc. a fee of $75,000 per annum for its services, plus reasonable expenses. The engagement may be terminated with ten days' written notice by either party. Canaccord Genuity Limited, an affiliate of Canaccord Genuity, Inc., is a co-manager of this offering. In addition, we paid Canaccord Genuity Limited fees for services related to the admission of our shares to AIM in 2006 and private placements of securities in 2009 and 2010.
In addition, from time to time, certain of the underwriters and their affiliates may effect transactions for their own account or the account of customers, and hold on behalf of themselves or their customers, long or short positions in our debt or equity securities or loans, and may do so in the future.
Notice to prospective investors in the European Economic Area
In relation to each Member State of the European Economic Area which has implemented the Prospectus Directive (each, a "Relevant Member State"), from and including the date on which the European Union Prospectus Directive (the "EU Prospectus Directive") is implemented in that Relevant Member State (the "Relevant Implementation Date") an offer of securities described in this prospectus may not be made to the public in that Relevant Member State prior to the publication of a prospectus in relation to the shares which has been approved by the competent authority in that Relevant Member State or, where appropriate, approved in another Relevant Member State and notified to the competent authority in that Relevant Member State, all in accordance with the EU Prospectus Directive, except that it may, with effect from and including the Relevant Implementation Date, make an offer of shares to the public in that Relevant Member State at any time:
- •
- to legal entities which are authorized or regulated to operate in the financial markets or, if not so authorized or
regulated, whose corporate purpose is solely to invest in securities;
- •
- to any legal entity which has two or more of (1) an average of at least 250 employees during the last financial
year, (2) a total balance sheet of more than €43,000,000 and (3) an annual net turnover of more than €50,000,000, as shown in its last annual or
consolidated accounts;
- •
- to fewer than 100 natural or legal persons (other than qualified investors as defined in the EU Prospectus Directive)
subject to obtaining the prior consent of the book-running manger(s) for any such offer; or
- •
- in any other circumstances which do not require the publication by the Issuer of a prospectus pursuant to Article 3 of the Prospectus Directive.
For the purposes of this provision, the expression an "offer of securities to the public" in relation to any securities in any Relevant Member State means the communication in any form and by any means of sufficient information on the terms of the offer and the securities to be offered so as to enable an investor to decide to purchase or subscribe for the securities, as the same may be varied in that Member State by any measure implementing the EU Prospectus Directive in that Member State and the expression EU Prospectus Directive means Directive 2003/71/EC and includes any relevant implementing measure in each Relevant Member State.
169
Notice to prospective investors in the United Kingdom
This document is only being distributed to and is only directed at (i) persons who are outside the United Kingdom or (ii) to investment professionals falling within Article 19(5) of the Financial Services and Markets Act 2000 (Financial Promotion) Order 2005 (the "Order") or (iii) high net worth entities, and other persons to whom it may lawfully be communicated, falling with Article 49(2)(a) to (d) of the Order (all such persons together being referred to as "relevant persons"). The securities are only available to, and any invitation, offer or agreement to subscribe, purchase or otherwise acquire such securities will be engaged in only with, relevant persons. Any person who is not a relevant person should not act or rely on this document or any of its contents.
Notice to prospective investors in the Dubai International Financial Centre
This document relates to an exempt offer in accordance with the Offered Securities Rules of the Dubai Financial Services Authority, or DFSA. This document is intended for distribution only to persons of a type specified in the Offered Securities Rules of the DFSA. It must not be delivered to, or relied on by, any other person. The DFSA has no responsibility for reviewing or verifying any documents in connection with exempt offers. The DFSA has not approved this document nor taken steps to verify the information set forth herein and has no responsibility for it. The shares to which this document relates may be illiquid and/or subject to restrictions on their resale. Prospective purchasers of the shares offered should conduct their own due diligence on the shares. If you do not understand the contents of this document you should consult an authorized financial advisor.
Notice to prospective investors in Hong Kong
This prospectus has not been approved by or registered with the Securities and Futures Commission of Hong Kong or the Registrar of Companies of Hong Kong. The shares will not be offered or sold in Hong Kong other than (i) to "professional investors" as defined in the Securities and Futures Ordinance (Cap. 571) of Hong Kong and any rules made under that Ordinance; or (ii) in other circumstances which do not result in the document being a "prospectus" as defined in the Companies Ordinance (Cap. 32) of Hong Kong or which do not constitute an offer to the public within the meaning of that Ordinance. No advertisement, invitation or document relating to the shares which is directed at, or the contents of which are likely to be accessed or read by, the public of Hong Kong (except if permitted to do so under the securities laws of Hong Kong) has been issued or will be issued in Hong Kong or elsewhere other than with respect to shares which are or are intended to be disposed of only to persons outside Hong Kong or only to "professional investors" as defined in the Securities and Futures Ordinance and any rules made under that Ordinance.
Notice to prospective investors in Japan
The shares have not been and will not be registered under the Financial Instruments and Exchange Law of Japan (Law No. 25 of 1948, as amended) and, accordingly, will not be offered or sold, directly or indirectly, in Japan, or for the benefit of any Japanese Person or to others for re-offering or resale, directly or indirectly, in Japan or to any Japanese Person, except in compliance with all applicable laws, regulations and ministerial guidelines promulgated by
170
relevant Japanese governmental or regulatory authorities in effect at the relevant time. For the purposes of this paragraph, "Japanese Person" shall mean any person resident in Japan, including any corporation or other entity organized under the laws of Japan.
Notice to prospective investors in Singapore
This prospectus has not been registered as a prospectus with the Monetary Authority of Singapore. Accordingly, this prospectus and any other document or material in connection with the offer or sale, or invitation for subscription or purchase, of the shares may not be circulated or distributed, nor may the shares be offered or sold, or be made the subject of an invitation for subscription or purchase, whether directly or indirectly, to persons in Singapore other than (i) to an institutional investor under Section 274 of the Securities and Futures Act (Chapter 289), or the SFA, (ii) to a relevant person, or any person pursuant to Section 275(1A), and in accordance with the conditions, specified in Section 275 of the SFA or (iii) otherwise pursuant to, and in accordance with the conditions of, any other applicable provision of the SFA. Where the shares are subscribed or purchased under Section 275 by a relevant person which is: (a) a corporation (which is not an accredited investor) the sole business of which is to hold investments and the entire share capital of which is owned by one or more individuals, each of whom is an accredited investor; or (b) a trust (where the trustee is not an accredited investor) whose sole purpose is to hold investments and each beneficiary is an accredited investor, then shares, debentures and units of shares and debentures of that corporation or the beneficiaries' rights and interest in that trust shall not be transferable for 6 months after that corporation or that trust has acquired the shares under Section 275 except: (i) to an institutional investor under Section 274 of the SFA or to a relevant person, or any person pursuant to Section 275(1A), and in accordance with the conditions, specified in Section 275 of the SFA; (ii) where no consideration is given for the transfer; or (iii) by operation of law.
Notice to prospective investors in Switzerland
The shares may not be publicly offered in Switzerland and will not be listed on the SIX Swiss Exchange, or the SIX, or on any other stock exchange or regulated trading facility in Switzerland. This document has been prepared without regard to the disclosure standards for issuance prospectuses under art. 652a or art. 1156 of the Swiss Code of Obligations or the disclosure standards for listing prospectuses under art. 27 ff. of the SIX Listing Rules or the listing rules of any other stock exchange or regulated trading facility in Switzerland. Neither this document nor any other offering or marketing material relating to the Shares or the offering may be publicly distributed or otherwise made publicly available in Switzerland.
Neither this document nor any other offering or marketing material relating to the offering, us or the shares have been or will be filed with or approved by any Swiss regulatory authority. In particular, this document will not be filed with, and the offer of shares will not be supervised by, the Swiss Financial Market Supervisory Authority and the offer of shares has not been and will not be authorized under the Swiss Federal Act on Collective Investment Schemes, or CISA. The investor protection afforded to acquirers of interests in collective investment schemes under the CISA does not extend to acquirers of the shares.
171
The validity of the shares of common stock offered hereby will be passed upon for us by Fenwick & West LLP, Mountain View, California. Certain legal matters in connection with this offering will be passed upon for the underwriters by Goodwin Procter LLP, Boston, Massachusetts.
The consolidated financial statements of Planet Payment, Inc. as of December 31, 2009 and 2010, and for each of the three years in the period ended December 31, 2010 and the related financial statement schedule appearing in this prospectus have been audited by Deloitte & Touche LLP, an independent registered public accounting firm, as set forth in their report thereon appearing elsewhere herein, and are included in reliance upon such report given on the authority of such firm as experts in accounting and auditing.
Where you can find additional information
We have filed with the SEC a registration statement on Form S-1 under the Securities Act with respect to the shares of common stock offered hereby. This prospectus, which constitutes a part of the registration statement, does not contain all of the information set forth in the registration statement or the exhibits filed therewith. For further information about us and the common stock offered hereby, reference is made to the registration statement and the exhibits filed therewith. Statements contained in this prospectus regarding the contents of any contract or any other document that is filed as an exhibit to the registration statement are not necessarily complete, and each such statement is qualified in all respects by reference to the full text of such contract or other document filed as an exhibit to the registration statement. We currently do not file periodic reports with the SEC. Upon completion of this offering, we will be required to file periodic reports, proxy statements and other information with the SEC pursuant to the Exchange Act. A copy of the registration statement and the exhibits filed therewith may be inspected without charge at the public reference room maintained by the SEC, located at 100 F Street, NE, Washington, DC 20549, and copies of all or any part of the registration statement may be obtained from that office. Please call the SEC at 1-800-SEC-0330 for further information about the public reference room. The SEC also maintains a website that contains reports, proxy and information statements and other information regarding registrants that file electronically with the SEC. The address of the website is www.sec.gov.
172
Index to consolidated financial statements
and financial statement schedule
F-1
Report of Independent Registered Public Accounting Firm
To
the Board of Directors and Stockholders of
Planet Payment, Inc.
We have audited the accompanying consolidated balance sheets of Planet Payment, Inc. and subsidiaries (the "Company") as of December 31, 2010 and 2009, and the related consolidated statements of operations, cash flows, and changes in convertible preferred stock and stockholders' equity (deficit) and comprehensive (loss) income for each of the three years in the period ended December 31, 2010. These financial statements are the responsibility of the Company's management. Our responsibility is to express an opinion on these financial statements based on our audits.
We conducted our audits in accordance with the standards of the Public Company Accounting Oversight Board (United States). Those standards require that we plan and perform the audit to obtain reasonable assurance about whether the financial statements are free of material misstatement. The Company is not required to have, nor were we engaged to perform, an audit of its internal control over financial reporting. Our audits included consideration of internal control over financial reporting as a basis for designing audit procedures that are appropriate in the circumstances, but not for the purpose of expressing an opinion on the effectiveness of the Company's internal control over financial reporting. Accordingly, we express no such opinion. An audit also includes examining, on a test basis, evidence supporting the amounts and disclosures in the financial statements, assessing the accounting principles used and significant estimates made by management, as well as evaluating the overall financial statement presentation. We believe that our audits provide a reasonable basis for our opinion.
In our opinion, such consolidated financial statements present fairly, in all material respects, the financial position of Planet Payment, Inc. and subsidiaries as of December 31, 2010 and 2009, and the results of their operations and their cash flows for each of the three years in the period ended December 31, 2010, in conformity with accounting principles generally accepted in the United States of America.
/s/ DELOITTE & TOUCHE LLP
New York, New York
July 21, 2011 (October 24, 2011 as to the effects of the restatement discussed in Note 2 and as to the effects of the subsequent events discussed in Note 1)
F-2
Planet Payment, Inc. consolidated balance sheets
| |
December 31, | September 30, | Pro forma at September 30, |
||||||||||||
|---|---|---|---|---|---|---|---|---|---|---|---|---|---|---|---|
| |
2009 |
2010 |
2011 |
2011 |
|||||||||||
| |
|
|
(Unaudited) |
||||||||||||
Current assets: |
|||||||||||||||
Cash and cash equivalents |
$ | 3,752,423 | $ | 5,182,499 | $ | 6,012,498 | |||||||||
Restricted cash |
2,263,498 | 2,060,357 | 1,908,651 | ||||||||||||
Accounts receivable, net of allowances of $1.9 million, $1.4 million and $1.4 million as of December 31, 2009 and 2010 and September 30, 2011 (unaudited), respectively |
1,868,713 | 3,326,111 | 4,331,803 | ||||||||||||
Prepaid expenses and other assets |
271,850 | 638,953 | 1,013,797 | ||||||||||||
Software licenses |
1,028,305 | — | — | ||||||||||||
Total current assets |
9,184,789 | 11,207,920 | 13,266,749 | ||||||||||||
Other assets: |
|||||||||||||||
Restricted cash |
500,000 | 750,000 | 622,766 | ||||||||||||
Property and equipment, net |
1,362,055 | 1,384,310 | 1,216,227 | ||||||||||||
Software development costs, net |
3,715,838 | 4,635,799 | 4,929,934 | ||||||||||||
Intangible assets, net |
1,083,074 | 945,681 | 839,357 | ||||||||||||
Security deposits and other assets |
297,528 | 245,281 | 210,807 | ||||||||||||
Deferred IPO costs |
— | — | 1,336,716 | ||||||||||||
Total other assets |
6,958,495 | 7,961,071 | 9,155,807 | ||||||||||||
Total assets |
$ | 16,143,284 | $ | 19,168,991 | $ | 22,422,556 | |||||||||
Liabilities and stockholders' (deficit) equity |
|||||||||||||||
Current liabilities: |
|||||||||||||||
Accounts payable |
$ | 620,576 | $ | 591,461 | $ | 418,437 | |||||||||
Accrued expenses |
234,574 | 495,457 | 2,572,914 | ||||||||||||
Due to merchants |
2,093,149 | 2,294,252 | 2,134,397 | ||||||||||||
Current portion of term debt and capital leases |
4,840,044 | 917,834 | 263,043 | ||||||||||||
Total current liabilities |
7,788,343 | 4,299,004 | 5,388,791 | ||||||||||||
Long-term liabilities: |
|||||||||||||||
Long-term portion of capital leases |
254,320 | 213,351 | 234,600 | ||||||||||||
Convertible debt |
8,979,926 | 8,979,926 | — | ||||||||||||
Total long-term liabilities |
9,234,246 | 9,193,277 | 234,600 | ||||||||||||
Total liabilities |
17,022,589 |
13,492,281 |
5,623,391 |
||||||||||||
Commitments and contingencies (Note 9) |
|||||||||||||||
Stockholders' (deficit) equity: |
|||||||||||||||
Convertible preferred stock—4,000,000 shares authorized, $0.01 par value: Series A—2,243,750 issued and outstanding as of December 31, 2009 and 2010 and September 30, 2011(unaudited); $8,975,000 aggregate liquidation preference |
22,438 | 22,438 | 22,438 | — | |||||||||||
Common stock—70,000,000 shares authorized as of December 31, 2009 and 2010 and 80,000,000 shares authorized as of September 30, 2011, $0.01 par value, 39,170,213, 46,068,496, 51,714,051 and 58,565,195, respectively, issued and outstanding as of December 31, 2009 and 2010, September 30, 2011 (unaudited), and September 30, 2011 (unaudited pro forma), respectively |
391,701 | 460,684 | 517,140 | 585,651 | |||||||||||
Additional paid-in capital |
73,969,455 | 83,459,133 | 93,926,548 | 93,880,475 | |||||||||||
Warrants |
1,517,982 | 1,607,723 | 1,622,651 | 1,622,651 | |||||||||||
Accumulated other comprehensive loss |
— | (27,600 | ) | (44,255 | ) | (44,255 | ) | ||||||||
Accumulated deficit |
(76,780,881 | ) | (79,845,668 | ) | (79,245,357 | ) | (79,245,357 | ) | |||||||
Total stockholders' (deficit) equity |
(879,305 | ) | 5,676,710 | 16,799,165 | 16,799,165 | ||||||||||
Total liabilities and stockholders' (deficit) equity |
$ | 16,143,284 | $ | 19,168,991 | $ | 22,422,556 | |||||||||
The accompanying notes are an integral part of these financial statements
F-3
Planet Payment, Inc. consolidated statements of operations
| |
Year ended December 31, |
Nine months ended September 30, |
|||||||||||||||||
|---|---|---|---|---|---|---|---|---|---|---|---|---|---|---|---|---|---|---|---|
| |
2008 |
2009 |
2010 |
2010 |
2011 |
||||||||||||||
| |
|
|
|
(Unaudited) |
|||||||||||||||
Revenue: |
|||||||||||||||||||
Net revenue |
$ | 21,185,878 | $ | 26,319,319 | $ | 30,553,164 | $ | 21,026,680 | $ | 29,527,135 | |||||||||
Operating expenses: |
|||||||||||||||||||
Cost of revenue: |
|||||||||||||||||||
Payment processing service fees |
9,808,434 | 10,175,430 | 10,051,640 | 7,423,046 | 8,273,579 | ||||||||||||||
Processing and service costs |
6,434,693 | 6,282,743 | 6,980,981 | 5,175,096 | 6,758,294 | ||||||||||||||
Software licenses impairment |
— | — | 1,108,514 | — | — | ||||||||||||||
Total cost of revenue |
16,243,127 | 16,458,173 | 18,141,135 | 12,598,142 | 15,031,873 | ||||||||||||||
Selling, general and administrative expenses |
15,365,254 | 12,822,449 | 14,304,448 | 10,354,051 | 13,580,381 | ||||||||||||||
Goodwill impairment |
129,887 | — | — | — | — | ||||||||||||||
Total operating expenses |
31,738,268 | 29,280,622 | 32,445,583 | 22,952,193 | 28,612,254 | ||||||||||||||
(Loss) income from operations |
(10,552,390 | ) | (2,961,303 | ) | (1,892,419 | ) | (1,925,513 | ) | 914,881 | ||||||||||
Other (expense) income: |
|||||||||||||||||||
Interest expense |
(1,015,633 | ) | (1,236,504 | ) | (1,169,578 | ) | (906,286 | ) | (307,796 | ) | |||||||||
Interest income |
140,191 | 18,702 | 429 | 142 | 804 | ||||||||||||||
Other income, net (Notes 7 and 8) |
— | — | — | — | 98,682 | ||||||||||||||
Total other expense, net |
(875,442 | ) | (1,217,802 | ) | (1,169,149 | ) | (906,144 | ) | (208,310 | ) | |||||||||
(Loss) income from continuing operations before provision for income taxes |
(11,427,832 | ) | (4,179,105 | ) | (3,061,568 | ) | (2,831,657 | ) | 706,571 | ||||||||||
Provision for income taxes |
(1,681 |
) |
(4,095 |
) |
(3,219 |
) |
— |
(106,260 |
) |
||||||||||
(Loss) income from continuing operations |
(11,429,513 | ) | (4,183,200 | ) | (3,064,787 | ) | (2,831,657 | ) | 600,311 | ||||||||||
Income from discontinued operations, net of taxes |
272,847 |
— |
— |
— |
— |
||||||||||||||
Net (loss) income |
$ | (11,156,666 | ) | $ | (4,183,200 | ) | $ | (3,064,787 | ) | $ | (2,831,657 | ) | $ | 600,311 | |||||
Basic net (loss) income per share from continuing operations |
$ | (0.43 | ) | $ | (0.12 | ) | $ | (0.08 | ) | $ | (0.07 | ) | $ | 0.01 | |||||
Basic net income per share from discontinued operations |
$ | 0.01 | $ | — | $ | — | $ | — | $ | — | |||||||||
Basic net (loss) income per share applicable to common stockholders |
$ | (0.42 | ) | $ | (0.12 | ) | $ | (0.08 | ) | $ | (0.07 | ) | $ | 0.01 | |||||
Diluted net (loss) income per share applicable to common stockholders |
$ | (0.42 | ) | $ | (0.12 | ) | $ | (0.08 | ) | $ | (0.07 | ) | $ | 0.01 | |||||
Weighted average common stock outstanding (basic) |
26,720,171 | 33,725,727 | 40,431,073 | 39,316,392 | 48,834,130 | ||||||||||||||
Weighted average common stock outstanding (diluted) |
26,720,171 | 33,725,727 | 40,431,073 | 39,316,392 | 51,593,111 | ||||||||||||||
Pro forma basic net (loss) income per share applicable to common stockholders (unaudited)(1) |
$ | (0.06 | ) | $ | 0.01 | ||||||||||||||
Pro forma diluted net (loss) income per share applicable to common stockholders (unaudited)(1) |
$ | (0.06 | ) | $ | 0.01 | ||||||||||||||
Pro forma weighted average common stock outstanding (basic) (unaudited)(1) |
51,756,993 | 55,685,274 | |||||||||||||||||
Pro forma weighted average common stock outstanding (diluted) (unaudited)(1) |
51,756,993 | 58,444,255 | |||||||||||||||||
(1) See Note 3 of these financial statements for pro forma earnings per share calculations.
The accompanying notes are an integral part of these financial statements
F-4
Planet Payment, Inc. consolidated statements of cash flows
| |
Year ended December 31, | Nine months ended September 30, |
|||||||||||||||||
|---|---|---|---|---|---|---|---|---|---|---|---|---|---|---|---|---|---|---|---|
| |
2008 |
2009 |
2010 |
2010 |
2011 |
||||||||||||||
| |
|
|
|
(Unaudited) |
|||||||||||||||
Cash flows from operating activities: |
|||||||||||||||||||
Net (loss) income |
$ | (11,156,666 | ) | $ | (4,183,200 | ) | $ | (3,064,787 | ) | $ | (2,831,657 | ) | $ | 600,311 | |||||
Adjustments to reconcile net (loss) income to net cash (used in) provided by operating activities: |
|||||||||||||||||||
Stock option expense |
1,487,493 | 1,213,659 | 739,992 | 555,120 | 420,226 | ||||||||||||||
Depreciation and amortization expense |
1,203,644 | 1,537,674 | 1,769,650 | 1,212,387 | 1,837,147 | ||||||||||||||
Provision (recovery) for doubtful accounts |
600,000 | 14,997 | (36,703 | ) | (36,703 | ) | 75,384 | ||||||||||||
Impairment charges |
129,887 | — | 1,108,514 | — | — | ||||||||||||||
Gain on sale of joint venture interest |
(272,847 | ) | — | — | — | — | |||||||||||||
Write off of note receivable |
— | 257,596 | — | — | — | ||||||||||||||
Non-cash interest expense on notes payable |
— | 34,174 | — | — | — | ||||||||||||||
Non-cash interest expense on convertible debt |
608,563 | 808,193 | 808,193 | 604,484 | 254,636 | ||||||||||||||
Non-cash interest expense on term debt |
338,887 | 337,926 | 295,743 | 252,750 | — | ||||||||||||||
Warrant expense |
318,974 | 231,366 | 89,741 | 87,608 | 14,928 | ||||||||||||||
Common stock issued for payment of account payable |
— | — | — | — | 20,000 | ||||||||||||||
Derecognition of note payable |
— | — | — | — | (700,000 | ) | |||||||||||||
Non-cash prepayment fee on conversion of convertible debt |
— | — | — | — | 601,318 | ||||||||||||||
Changes in operating assets and liabilities, net of effect of acquisition: |
|||||||||||||||||||
(Increase) decrease in settlement assets |
(1,310,368 | ) | (453,130 | ) | (46,859 | ) | 68,334 | 151,706 | |||||||||||
Increase in accounts receivables, prepaid expenses and other current assets |
(1,450,394 | ) | (229,105 | ) | (1,787,798 | ) | (741,438 | ) | (1,455,920 | ) | |||||||||
Decrease (increase) in software licenses |
— | 194,225 | (80,209 | ) | — | — | |||||||||||||
(Increase) decrease in security deposits and other assets |
(197,370 | ) | (110,570 | ) | 52,247 | 36,470 | 34,474 | ||||||||||||
Increase (decrease) in accounts payable and accrued expenses |
289,259 | (1,073,787 | ) | 231,768 | (44,070 | ) | 1,411,866 | ||||||||||||
Increase (decrease) in due to merchants |
1,484,157 | 608,992 | 201,103 | 561,973 | (159,855 | ) | |||||||||||||
Other |
— | (7,432 | ) | (1 | ) | 14,034 | (3,742 | ) | |||||||||||
Net cash (used in) provided by operating activities |
(7,926,781 | ) | (818,442 | ) | 280,594 | (260,708 | ) | 3,102,479 | |||||||||||
Cash flows from investing activities: |
|||||||||||||||||||
(Increase) decrease in restricted cash |
(504,733 | ) | (495,267 | ) | — | (499,926 | ) | 127,234 | |||||||||||
Proceeds from redemption of investments |
6,000,000 | — | — | — | — | ||||||||||||||
Acquisition of business, net of cash acquired |
(1,224,294 | ) | — | — | — | — | |||||||||||||
Purchase of property and equipment |
(237,362 | ) | (143,370 | ) | (300,540 | ) | (352,964 | ) | (80,935 | ) | |||||||||
Capitalized software development |
(1,496,738 | ) | (1,804,822 | ) | (1,970,349 | ) | (1,338,878 | ) | (1,431,347 | ) | |||||||||
Purchase of intangible assets |
(118,025 | ) | (121,305 | ) | (79,618 | ) | (21,102 | ) | (61,490 | ) | |||||||||
Net cash provided by (used in) investing activities |
2,418,848 | (2,564,764 | ) | (2,350,507 | ) | (2,212,870 | ) | (1,446,538 | ) | ||||||||||
Cash flows from financing activities: |
|||||||||||||||||||
Proceeds from issuance of common stock |
— | 6,999,161 | 6,058,702 | — | 247,764 | ||||||||||||||
Proceeds from convertible debt |
3,100,000 | 350,000 | — | — | — | ||||||||||||||
Principal payments on capital lease obligations |
(37,335 | ) | (101,789 | ) | (187,144 | ) | (135,985 | ) | (214,629 | ) | |||||||||
Payment of capital-raising expense |
— | (368,134 | ) | (343,969 | ) | — | — | ||||||||||||
Repayment of long-term debt |
(165,143 | ) | — | (2,000,000 | ) | — | — | ||||||||||||
Payment of IPO costs |
— | — | — | — | (859,077 | ) | |||||||||||||
Net cash provided by (used in) financing activities |
2,897,522 | 6,879,238 | 3,527,589 | (135,985 | ) | (825,942 | ) | ||||||||||||
Effect of exchange rate changes on cash and cash equivalents(*) |
32,519 | 9,523 | (27,600 | ) | — | — | |||||||||||||
Net (decrease) increase in cash and cash equivalents |
(2,577,892 | ) | 3,505,575 | 1,430,076 | (2,609,563 | ) | 829,999 | ||||||||||||
Beginning of period |
2,824,740 | 246,848 | 3,752,423 | 3,752,423 | 5,182,499 | ||||||||||||||
End of period |
$ | 246,848 | $ | 3,752,423 | $ | 5,182,499 | $ | 1,142,860 | $ | 6,012,498 | |||||||||
Supplemental disclosure: |
|||||||||||||||||||
Cash paid for: |
|||||||||||||||||||
Interest |
$ | 68,183 | $ | 56,211 | $ | 65,642 | $ | 49,052 | $ | 53,160 | |||||||||
Income taxes |
— | 2,917 | 142 | — | 106,260 | ||||||||||||||
Non cash investing and financing activities: |
|||||||||||||||||||
Convertible debt converted to common stock |
$ | — | $ | 450,000 | $ | — | $ | — | $ | 8,979,926 | |||||||||
Common stock issued to pay accrued interest |
337,926 | 1,519,336 | 1,103,936 | — | — | ||||||||||||||
Common stock issued as payment of accounts payable |
— | 34,125 | — | — | — | ||||||||||||||
Common stock issued for stock options exercised |
— | — | 19,661 | — | — | ||||||||||||||
Assets acquired under capital leases |
222,990 | 252,136 | 223,965 | 223,481 | 283,103 | ||||||||||||||
Derecognition of note payable |
— | — | — | — | 700,000 | ||||||||||||||
Prepayment fee on conversion of convertible debt |
— | — | — | — | 601,318 | ||||||||||||||
Common stock issued for warrants exercised |
— | — | 2,000,000 | — | — | ||||||||||||||
Reduction of long-term debt through exercise of warrants |
— | — | (2,000,000 | ) | — | — | |||||||||||||
Accrued IPO costs |
— | — | — | — | 477,639 | ||||||||||||||
- (*)
- For
the nine months ended September 30, 2010 and 2011, the effect of exchange rate changes on cash and cash equivalents was less than $1,000.
The accompanying notes are an integral part of these financial statements
F-5
Planet Payment, Inc. consolidated statements of changes in convertible preferred stock and
stockholders' equity (deficit) and comprehensive (loss) income
| |
|
|
Common stock $0.01 par value— 70,000,000 shares authorized as of December 31, 2007, 2008, 2009 and 2010 and 80,000,000 shares authorized as of September 30, 2011 |
|
|
|
|
|
|
|||||||||||||||||||||||
|---|---|---|---|---|---|---|---|---|---|---|---|---|---|---|---|---|---|---|---|---|---|---|---|---|---|---|---|---|---|---|---|---|
| |
Convertible preferred stock $0.01 par value— 4,000,000 shares authorized Series A |
|
|
|
|
|
|
|||||||||||||||||||||||||
| |
Additional paid-In capital |
|
Accumulated other comprehensive loss |
|
Total stockholders' equity (deficit) |
|
||||||||||||||||||||||||||
| |
Shares issued |
Shares par value |
|
Accumulated deficit |
Comprehensive (loss) income |
|||||||||||||||||||||||||||
| |
Issued |
Par value |
Warrants |
|||||||||||||||||||||||||||||
Balance—December 31, 2007 |
2,243,750 | $ | 22,438 | 26,375,518 | $ | 263,755 | $ | 62,020,354 | $ | 1,371,123 | $ | — | $ | (61,441,015 | ) | $ | 2,236,655 | |||||||||||||||
Stock issued |
— | — | 108,498 | 1,085 | 336,841 | — | — | — | 337,926 | |||||||||||||||||||||||
Options exercised |
— | — | 17,926 | 179 | (179 | ) | — | — | — | — | ||||||||||||||||||||||
Warrants exercised |
— | — | 429,065 | 4,291 | 399,190 | (403,481 | ) | — | — | — | ||||||||||||||||||||||
Warrant expense |
— | — | — | — | — | 318,974 | — | — | 318,974 | |||||||||||||||||||||||
Stock option expense |
— | — | — | — | 1,487,493 | — | — | — | 1,487,493 | |||||||||||||||||||||||
Cumulative translation adjustment(1) |
— | — | — | — | — | — | — | — | — | — | ||||||||||||||||||||||
Net Loss |
— | — | — | — | — | — | — | (11,156,666 | ) | (11,156,666 | ) | $ | (11,156,666 | ) | ||||||||||||||||||
Comprehensive loss |
(11,156,666 | ) | ||||||||||||||||||||||||||||||
Balance—December 31, 2008 |
2,243,750 | 22,438 | 26,931,007 | 269,310 | 64,243,699 | 1,286,616 | — | (72,597,681 | ) | (6,775,618 | ) | |||||||||||||||||||||
Stock issued |
— | — | 12,239,206 | 122,391 | 8,512,097 | — | — | — | 8,634,488 | |||||||||||||||||||||||
Options exercised |
— | — | — | — | — | — | — | — | — | |||||||||||||||||||||||
Warrant expense |
— | — | — | — | — | 231,366 | — | — | 231,366 | |||||||||||||||||||||||
Stock option expense |
— | — | — | — | 1,213,659 | — | — | — | 1,213,659 | |||||||||||||||||||||||
Cumulative translation adjustment(1) |
— | — | — | — | — | — | — | — | — | — | ||||||||||||||||||||||
Net loss |
— | — | — | — | — | — | — | (4,183,200 | ) | (4,183,200 | ) | (4,183,200 | ) | |||||||||||||||||||
Comprehensive loss |
(4,183,200 | ) | ||||||||||||||||||||||||||||||
Balance—December 31, 2009 |
2,243,750 | 22,438 | 39,170,213 | 391,701 | 73,969,455 | 1,517,982 | — | (76,780,881 | ) | (879,305 | ) | |||||||||||||||||||||
Stock issued |
— | — | 5,357,897 | 53,579 | 6,765,090 | — | — | — | 6,818,669 | |||||||||||||||||||||||
Warrants exercised |
— | — | 1,526,718 | 15,267 | 1,984,733 | — | — | — | 2,000,000 | |||||||||||||||||||||||
Options exercised |
— | — | 13,668 | 137 | (137 | ) | — | — | — | — | ||||||||||||||||||||||
Warrant expense |
— | — | — | — | — | 89,741 | — | — | 89,741 | |||||||||||||||||||||||
Stock option expense |
— | — | — | — | 739,992 | — | — | — | 739,992 | |||||||||||||||||||||||
Cumulative translation adjustment |
— | — | — | — | — | — | (27,600 | ) | — | (27,600 | ) | (27,600 | ) | |||||||||||||||||||
Net loss |
— | — | — | — | — | — | — | (3,064,787 | ) | (3,064,787 | ) | (3,064,787 | ) | |||||||||||||||||||
Comprehensive loss |
(3,092,387 | ) | ||||||||||||||||||||||||||||||
Balance—December 31, 2010 |
2,243,750 | 22,438 | 46,068,496 | 460,684 | 83,459,133 | 1,607,723 | (27,600 | ) | (79,845,668 | ) | 5,676,710 | |||||||||||||||||||||
Stock issued |
— | — | 4,484,776 | 44,848 | 9,811,033 | — | — | — | 9,855,881 | |||||||||||||||||||||||
Restricted stock |
— | — | 915,000 | 9,150 | — | — | — | — | 9,150 | |||||||||||||||||||||||
Warrants exercised |
— | — | 15,206 | 152 | (152 | ) | — | — | — | — | ||||||||||||||||||||||
Options exercised |
— | — | 230,573 | 2,306 | 236,308 | — | — | — | 238,614 | |||||||||||||||||||||||
Warrant expense |
— | — | — | — | — | 14,928 | — | — | 14,928 | |||||||||||||||||||||||
Stock option expense |
— | — | — | — | 420,226 | — | — | — | 420,226 | |||||||||||||||||||||||
Cumulative translation adjustment |
— | — | — | — | — | — | (16,655 | ) | — | (16,655 | ) | (16,655 | ) | |||||||||||||||||||
Net income |
— | — | — | — | — | — | — | 600,311 | 600,311 | 600,311 | ||||||||||||||||||||||
Comprehensive income |
$ | 583,656 | ||||||||||||||||||||||||||||||
Balance—September 30, 2011 (Unaudited) |
2,243,750 | $ | 22,438 | 51,714,051 | $ | 517,140 | $ | 93,926,548 | $ | 1,622,651 | $ | (44,255 | ) | $ | (79,245,357 | ) | $ | 16,799,165 | ||||||||||||||
- (1)
- Amount deemed inconsequential.
The accompanying notes are an integral part of these financial statements
F-6
Planet Payment, Inc.
Notes to consolidated financial statements
1. Business description and basis of presentation
Business description
Planet Payment, Inc. together with its wholly owned subsidiaries ("Planet Payment," the "Company," "we," or "our") is a provider of international payment processing and multi-currency processing services. The Company provides its services to over 25,000 active merchant locations in 16 countries and territories across the Asia Pacific region, North America, the Middle East, Africa and Europe, primarily through its acquiring bank and processor customers, as well as through its own direct sales force. The Company's point-of-sale and e-commerce services are integrated within the payment card transaction flow and enable its acquiring customers to process and reconcile payment transactions in multiple currencies, geographies and channels. The Company is a registered third party processor with the major card associations and operates in accordance with industry standards, including the Payment Card Industry, or PCI, Security Council's Data Security Standards.
Company structure
Planet Payment was incorporated in the State of Delaware on October 12, 1999 as Planet Group Inc. and changed its name to Planet Payment, Inc. on June 18, 2007.
Since March 20, 2006, shares of the Company's common stock have traded on the Alternative Investment Market of the London Stock Exchange, or AIM, under the symbols "PPT" and "PPTR." Since November 19, 2008, shares of the Company's common stock have traded on the OTCQX market tier operated by OTC Markets Group, Inc., or the OTCQX, in the United States under the symbol "PLPM."
Basis of presentation
The consolidated financial statements of the Company have been prepared in accordance with accounting principles generally accepted in the United States of America ("US GAAP").
The accompanying consolidated financial statements include the accounts of Planet Payment, Inc. and its wholly-owned subsidiaries. All intercompany transactions and balances have been eliminated.
The Company evaluated subsequent events through October 24, 2011, the date on which the December 31, 2009 and 2010 financial statements were available to be issued. There were no events or transactions other than those events disclosed in Notes 3 (Stock-based expense and assumptions), 7, 8, 11 and 15 occurring during this subsequent reporting period that require recognition or disclosure in the financial statements.
For the nine months ended September 30, 2011, the Company evaluated subsequent events through January 31, 2012, the date on which these interim financial statements were available to be issued. There were no events or transactions, other than those events disclosed in Note 19, occurring during this subsequent reporting period that require recognition or disclosure in the financial statements.
F-7
Planet Payment, Inc.
Notes to consolidated financial statements (Continued)
1. Business description and basis of presentation (Continued)
Unaudited consolidated interim financial information
The accompanying unaudited consolidated interim financial statements as of September 30, 2011 and for the nine months ended September 30, 2010 and 2011 are unaudited and have been prepared on the same basis as the annual consolidated financial statements. In the opinion of management, the unaudited financial information for the interim periods presented reflects all adjustments, which are normal and recurring, necessary for a fair presentation of a statement of results of operations, financial position and cash flows. Operating results for the nine months ended September 30, 2011 are not necessarily indicative of the results that may be expected for the year ending December 31, 2011.
Unaudited pro forma financial information
The pro forma balance sheet as of September 30, 2011 reflects the automatic conversion of all outstanding shares of our convertible preferred stock into 6,851,144 shares of common stock effective immediately prior to the completion of this offering. The carrying value of the convertible preferred stock as of September 30, 2011 was $9.0 million. The pro forma balance sheet does not give effect to the offering proceeds.
2. Immaterial restatement
Subsequent to the issuance of the Company's 2010 financial statements, the Company's management determined that it had an error in its presentation of multi-currency processing services revenue. Multi-currency processing services revenue was previously presented gross of amounts related to certain third party revenue share arrangements. The Company reconsidered the requirements of reporting revenue gross as a principal versus net as an agent included in the Revenue Recognition Topic Accounting Standards Codification ("ASC") topic 605 as it related to its multi-currency processing services revenue stream and concluded, based on the terms of its contractual arrangements that ASC 605-45 was not applicable to its facts and circumstances, that the Company was earning a processing fee for its services, and only the multi-currency processing services fee earned by the Company should be presented within the income statement without including the third party revenue sharing fees in either revenue or expense. In addition, as more fully described in the table below, the Company's management determined that it had certain other errors related to the presentation of goodwill impairment, discontinued operations, software license intangible asset, and restricted cash. Furthermore, the Company's management determined that it had not properly recorded certain capital leases and certain amounts due to merchants. Finally, the Company's management determined that there were errors in the amounts included within the disclosures for future minimum rental payments under noncancelable operating leases, future minimum rental payments under capital leases, future minimum payments under acquiring bank sponsorship agreements disclosures, disclosures in the tax footnote relating to the amount of net operating losses and the effective interest rate, disclosure for unamortized stock-based expense, and disclosures for the intrinsic value of options. The Company has corrected the amounts within each disclosure.
F-8
Planet Payment, Inc.
Notes to consolidated financial statements (Continued)
2. Immaterial restatement (Continued)
While the Company does not believe these errors to be material to its financial statements for any reported period, the Company's management concluded that the consolidated financial statements as of December 31, 2009 and 2010 and for the years ended December 31, 2008, 2009 and 2010 and for the nine months ended September 30, 2010 should be restated.
F-9
Planet Payment, Inc.
Notes to consolidated financial statements (Continued)
2. Immaterial restatement (Continued)
The following table sets forth the effects of the correcting adjustments (hereafter in this Note 2 referred to as "adjustments") on affected line items based on the Company's previously reported Consolidated Statements of Operations for the years ended December 31, 2008, 2009 and 2010 and for the nine months ended September 30, 2010.
| |
Year Ended December 31, | Nine Months Ended September 30, |
|||||||||||||||||||||||||
|---|---|---|---|---|---|---|---|---|---|---|---|---|---|---|---|---|---|---|---|---|---|---|---|---|---|---|---|
| |
2008 | 2009 | 2010 | 2010 | |||||||||||||||||||||||
| |
As Previously Reported |
As Adjusted |
As Previously Reported |
As Adjusted |
As Previously Reported |
As Adjusted |
As Previously Reported |
As Adjusted |
|||||||||||||||||||
| |
|
|
|
|
|
|
(unaudited) |
||||||||||||||||||||
Net revenue |
$ | 36,188,610 | $ | 21,185,878 | (1)(5) | $ | 47,254,706 | $ | 26,319,319 | (1)(5) | $ | 64,653,725 | $ | 30,553,164 | (1) | $ | 43,225,609 | $ | 21,026,680 | (1) | |||||||
Cost of revenue: |
|||||||||||||||||||||||||||
Processing services fees |
24,712,399 | 9,808,434 | (1)(5) | 30,962,835 | 10,175,430 | (1)(5) | 44,152,201 | 10,051,640 | (1) | 29,491,668 | 7,423,046 | (1) | |||||||||||||||
Processing and service costs |
6,434,693 | 6,434,693 | 6,282,743 | 6,282,743 | 6,980,981 | 6,980,981 | 5,175,096 | 5,175,096 | |||||||||||||||||||
Software licenses impairment |
— | — | — | — | — | 1,108,514 | (4) | — | — | ||||||||||||||||||
Total cost of revenue |
31,147,092 | 16,243,127 | 37,245,578 | 16,458,173 | 51,133,182 | 18,141,135 | 34,666,764 | 12,598,142 | |||||||||||||||||||
Selling, general and administrative expenses |
15,317,355 | 15,365,254 | (5) | 12,603,634 | 12,822,449 | (3)(5) | 14,594,231 | 14,304,448 | (5) | 10,381,476 | 10,354,051 | (5) | |||||||||||||||
Goodwill impairment |
— | 129,887 | (2) | — | — | — | — | — | — | ||||||||||||||||||
Total operating expenses |
46,464,447 | 31,738,268 | 49,849,212 | 29,280,622 | 65,727,413 | 32,445,583 | 45,048,240 | 22,952,193 | |||||||||||||||||||
Loss from operations |
(10,275,837 | ) | (10,552,390 | ) | (2,594,506 | ) | (2,961,303 | ) | (1,073,688 | ) | (1,892,419 | ) | (1,822,631 | ) | (1,925,513 | ) | |||||||||||
Other (expense) income: |
|||||||||||||||||||||||||||
Interest expense |
(988,510 | ) | (1,015,633) | (5) | (1,189,843 | ) | (1,236,504) | (5) | (1,134,786 | ) | (1,169,578) | (5) | (878,862 | ) | (906,286) | (5) | |||||||||||
Interest income |
140,191 | 140,191 | 18,702 | 18,702 | 429 | 429 | 142 | 142 | |||||||||||||||||||
Goodwill software licenses impairment |
(129,887 | ) | — | (2) | — | — | (1,108,514 | ) | — | (4) | — | — | |||||||||||||||
Total other expense, net |
(978,206 | ) | (875,442 | ) | (1,171,141 | ) | (1,217,802 | ) | (2,242,871 | ) | (1,169,149 | ) | (878,720 | ) | (906,144 | ) | |||||||||||
Loss from continuing operations, before provision for income taxes |
(11,254,043 | ) | (11,427,832 | ) | (3,765,647 | ) | (4,179,105 | ) | (3,316,559 | ) | (3,061,568 | ) | (2,701,351 | ) | (2,831,657 | ) | |||||||||||
Provision for income taxes |
(1,681 | ) | (1,681 | ) | (4,095 | ) | (4,095 | ) | (3,219 | ) | (3,219 | ) | — | — | |||||||||||||
Loss from continuing operations |
(11,255,724 | ) | (11,429,513 | ) | (3,769,742 | ) | (4,183,200 | ) | (3,319,778 | ) | (3,064,787 | ) | (2,701,351 | ) | (2,831,657 | ) | |||||||||||
Income (loss) from discontinued operations, net of taxes |
272,847 | 272,847 | (257,596 | ) | — | (3) | — | — | — | — | |||||||||||||||||
Net loss |
$ | (10,982,877 | ) | $ | (11,156,666 | ) | $ | (4,027,338 | ) | $ | (4,183,200 | ) | $ | (3,319,778 | ) | $ | (3,064,787 | ) | $ | (2,701,351 | ) | $ | (2,831,657 | ) | |||
Basic net loss per share from continuing operations |
$ | (0.42 | ) | $ | (0.43 | ) | $ | (0.11 | ) | $ | (0.12 | ) | $ | (0.08 | ) | $ | (0.08 | ) | $ | (0.07 | ) | $ | (0.07 | ) | |||
Basic net income (loss) per share from discontinued operations |
$ | 0.01 | $ | 0.01 | $ | (0.01 | ) | $ | — | $ | — | $ | — | $ | — | $ | — | ||||||||||
Basic and diluted net loss per share applicable to common stockholders |
$ | (0.41 | ) | $ | (0.42 | ) | $ | (0.12 | ) | $ | (0.12 | ) | $ | (0.08 | ) | $ | (0.08 | ) | $ | (0.07 | ) | $ | (0.07 | ) | |||
(1) Multi-currency processing services revenue was previously presented gross of amounts related to certain third party revenue share arrangements. The Company reconsidered the requirements of ASC 605-45 as it related to its multi-currency processing services revenue stream and concluded that based on the terms of its contractual arrangements ASC 605-45 was not applicable to its facts and circumstances, that the Company was earning a processing fee for its service, and that its multi-currency processing services revenue should be presented net of amounts related to
F-10
Planet Payment, Inc.
Notes to consolidated financial statements (Continued)
2. Immaterial restatement (Continued)
certain third party revenue share arrangements. All periods presented have been corrected to show the transaction fee that the Company earns for its processing services. The effect of the correction resulted in a reduction of previously reported revenues and corresponding reductions in cost of revenue in those periods. For 2008, 2009 and 2010 and the nine months ended September 30, 2010, the reduction in revenue and the corresponding reduction in cost of revenue is $14.7 million, $20.7 million, $34.1 million and $22.2 million, respectively. Refer to the Company's summary of significant accounting policies for further information regarding the Company's accounting policy on revenue recognition.
(2) A correction to reclassify the $0.1 million goodwill impairment charge from a component of Other (expense) income to its own line item as a component of Total operating expenses.
(3) A correction to reclassify the $0.3 million write-off of a note receivable from a component of Income (loss) from discontinued operations to SG&A under continuing operations in accordance with Staff Accounting Bulletin Topic 5-Z(5), Accounting and Disclosure Regarding Discontinued Operations. This correction resulted in the correction of the basic net loss per share from continuing and discontinued operations presented in the table above.
(4) A correction to reclassify the $1.1 million software licenses impairment charge from a component of Other (expense) income to its own line item as component of Total cost of revenue.
(5) For the year ended December 31, 2010, the Company recorded a $0.3 million out-of-period adjustment to increase the due to merchant liability and increase SG&A. A correction was made to adjust the 2010 out-of-period amount by reducing SG&A by $0.3 million in 2010 and to record the correct due to merchant liability in the proper periods. The correction resulted in an increase in the due to merchant liability of $0.1 million, a reduction to Net revenue of $0.3 million, a reduction to Processing services fees of $0.2 million, and an increase to SG&A of $0.1 million for 2008. The correction resulted in an increase to the liability of $0.2 million, a reduction to Net revenue of $0.2 million, and a reduction to Processing services fees of $0.1 million for 2009. In addition, the Company recorded various other inconsequential adjustments for each respective period affecting Interest expense and SG&A line items by less than $0.1 million.
The following table sets forth the effects of the adjustments on affected line items within our previously reported Consolidated Balance Sheets as of December 31, 2009 and 2010.
| |
As of December 31, | |||||||||||||
|---|---|---|---|---|---|---|---|---|---|---|---|---|---|---|
| |
2009 | 2010 | ||||||||||||
| |
As Previously Reported |
As Adjusted |
As Previously Reported |
As Adjusted |
||||||||||
Assets line items affected: |
||||||||||||||
Restricted cash (current) |
$ | 2,763,498 | $ | 2,263,498 | (6) | $ | 2,810,357 | $ | 2,060,357 | (6) | ||||
Total current assets |
9,684,789 | 9,184,789 | 11,957,920 | 11,207,920 | ||||||||||
Restricted cash (non-current) |
— | 500,000 | (6) | — | 750,000 | (6) | ||||||||
Property and equipment, net |
1,066,984 | 1,362,055 | (7) | 1,186,466 | 1,384,310 | (7) | ||||||||
Software development costs, net |
4,710,459 | 4,635,799 | (8) | |||||||||||
Total other assets |
6,163,424 | 6,958,495 | 7,087,887 | 7,961,071 | ||||||||||
Total assets |
15,848,213 | 16,143,284 | 19,045,807 | 19,168,991 | ||||||||||
Liability line items affected: |
||||||||||||||
Due to merchants |
$ | 1,763,498 | $ | 2,093,149 | (10) | $ | 2,294,252 | $ | 2,294,252 | |||||
Current portion of term debt and capital leases |
4,742,817 | 4,840,044 | (9) | 808,288 | 917,834 | (9) | ||||||||
Total current liabilities |
7,361,465 | 7,788,343 | 4,189,458 | 4,299,004 | ||||||||||
Long-term of term debt and capital leases |
56,476 | 254,320 | (11) | 125,053 | 213,351 | (12) | ||||||||
Total long-term liabilities |
9,036,402 | 9,234,246 | 9,104,979 | 9,193,277 | ||||||||||
Total liabilities |
16,397,867 | 17,022,589 | 13,294,437 | 13,492,281 | ||||||||||
Accumulated deficit |
(76,451,230 | ) | (76,780,881 | ) | (79,771,008 | ) | (79,845,668 | ) | ||||||
Total stockholders' (deficit) equity |
(549,654 | ) | (879,305 | ) | 5,751,370 | 5,676,710 | ||||||||
(6) Represents a correction to reclassify $0.5 million and $0.8 million, as of December 31, 2009 and 2010, respectively, of restricted cash from a component of current assets to a component of total other assets. Reclassification had no impact on other financial statements.
(7) Represents a correction to property and equipment related to previously unrecorded capital leases of $0.3 million and $0.2 million, as of December 31, 2009 and 2010, respectively, with a corresponding amount recorded to current and long-term portions of capital leases liabilities.
(8) Represents the adjustment of incorrectly capitalizing software development costs of $0.1 million.
(9) Represents a correction of $0.1 million liability related to the current portion of capital leases noted in note (7) above.
(10) Represents a correction of $0.3 million related to a previously unrecorded due to merchants' liability.
(11) Represents a correction of $0.2 million liability related to the long-term portion of capital leases noted in note (7) above.
(12) Represents a correction of $0.1 million liability related to the long-term portion of capital leases noted in note (7) above.
F-11
Planet Payment, Inc.
Notes to consolidated financial statements (Continued)
2. Immaterial restatement (Continued)
The following table sets forth the effects of the adjustments on affected line items within our previously reported Consolidated Statements of Cash Flows for the years ended December 31, 2008, 2009 and 2010, for which these financial statements are not being presented in this report and the nine months ended September 30, 2010.
| |
Year Ended December 31, | Nine Months Ended September 30, |
||||||||||||||||||||||||
|---|---|---|---|---|---|---|---|---|---|---|---|---|---|---|---|---|---|---|---|---|---|---|---|---|---|---|
| |
2008 | 2009 | 2010 | 2010 | ||||||||||||||||||||||
| |
As Previously Reported |
As Adjusted |
As Previously Reported |
As Adjusted |
As Previously Reported |
As Adjusted |
As Previously Reported |
As Adjusted |
||||||||||||||||||
| |
|
|
|
|
|
|
(unaudited) |
|||||||||||||||||||
Cash flow statement line items affected: |
||||||||||||||||||||||||||
Net loss |
$ | (10,982,877 | ) | $ | (11,156,666 | ) | $ | (4,027,338 | ) | $ | (4,183,200 | ) | $ | (3,319,778 | ) | $ | (3,064,787 | ) | $ | (2,701,351 | ) | $ | (2,831,657 | ) | ||
Depreciation and amortization expense |
1,166,309 | 1,203,644 | (13) | 1,456,042 | 1,537,674 | (13) | 1,672,423 | 1,769,650 | (13) | |||||||||||||||||
Write-off of note receivable |
212,629 | 257,596 | (15) | |||||||||||||||||||||||
Non-cash interest expense on term debt |
324,444 | 295,743 | (18) | |||||||||||||||||||||||
Warrant expense |
— | 318,974 | (14) | — | 231,366 | (14) | ||||||||||||||||||||
Increase (decrease) in accounts payable and accrued expenses |
608,233 | 289,259 | (14) | (797,452 | ) | (1,073,787) | (14)(15) | |||||||||||||||||||
Increase in due to merchants |
1,310,368 | 1,484,157 | (16) | 453,130 | 608,992 | (16) | 530,755 | 201,103 | (16) | |||||||||||||||||
Net cash (used in) provided by operating activities |
(7,964,116 | ) | (7,926,781 | ) | (900,050 | ) | (818,422 | ) | 287,842 | 280,594 | (1,234,531 | ) | (260,708) (24 (26 |
(13)(23) )(25) ) |
||||||||||||
Purchase of property and equipment |
(184,544 | ) | (143,370 | )(22) | (525,619 | ) | (300,540 | )(21) | ||||||||||||||||||
Capitalized software development |
(2,045,010 | ) | (1,970,349) | (17) | ||||||||||||||||||||||
Purchase of intangible assets |
(199,580 | ) | (121,305 | )(22) | ||||||||||||||||||||||
Net cash used in investing activities |
(2,684,213 | ) | (2,564,764 | ) | (2,650,247 | ) | (2,350,507 | ) | (1,933,020 | ) | (2,212,870) | (25)(27) | ||||||||||||||
Proceeds from issuance of common stock |
6,030,002 | 6,058,702 | (18) | 400,775 | — | (23) | ||||||||||||||||||||
Principal payments on capital lease obligations |
— | (37,335) | (13) | (20,157 | ) | (101,789) | (13) | (89,917 | ) | (187,144) | (13) | — | (135,985) | (13)(28) | ||||||||||||
Net cash provided by (used in) financing activities |
2,934,857 | 2,897,522 | 7,080,317 | 6,879,238 | 3,820,081 | 3,527,589 | 557,988 | (135,985) (28 |
(13)(23) )(29) |
|||||||||||||||||
Supplemental disclosure line items affected: |
||||||||||||||||||||||||||
Cash paid for interest |
41,059 | 68,183 | (19) | 9,549 | 56,211 | (19) | 30,850 | 65,642 | (19) | |||||||||||||||||
Common stock issued to pay accrued interest |
1,132,638 | 1,103,936 | (18) | |||||||||||||||||||||||
Assets acquired under capital leases |
— | 222,990 | (20) | — | 252,136 | (20)(22)(29) | — | 223,965 | (21)(29) | |||||||||||||||||
(13) Represents a correction to reclassify $37,000, $0.1 million, $0.1 million and $0.1 million for the years ended December 31, 2008, 2009, 2010 and the nine months ended September 30, 2010, respectively, from Principal payments on capital lease obligations to Depreciation and amortization expense in relation to the items within note (7) above.
(14) A correction to reclassify $0.3 million and $0.2 million for the years ended December 31, 2008 and 2009, respectively, of Warrant expense from a component of Changes in operating assets and liabilities to a component of Adjustments to reconcile net loss to net cash (used in) provided by operating activities.
(15) Represents a correction to reclassify $45,000 for the year ended December 31, 2009 of a write off of a note receivable from a component of Changes in operating assets and liabilities to a component of Adjustments to reconcile net loss to net cash (used in) provided by operating activities.
(16) Represents the correction of previously unrecorded amounts of due to merchants for the years ended December 31, 2008, 2009 and 2010 of $0.2 million, $0.1 million and $(0.3) million, respectively.
(17) Represents a correction of the capitalized software development costs associated with note (8) above.
(18) Represents a correction to reclassify approximately $28,000 from Non-cash interest expense on term debt to Proceeds from issuance of common stock. Item also impacts non-cash disclosure of Common stock issued to pay accrued interest by a reduction of approximately $28,000.
(19) Represents a correction of interest related to capital leases noted in note (7) above.
(20) Represents the correction of unrecorded capital lease assets acquired of $0.2 million and $0.1 million for the years ended December 31, 2008 and 2009, respectively.
(21) Represents a correction to reclassify capital lease assets acquired of $0.2 million from purchase of property and equipment to a non-cash investing activity.
(22) Represents the correction to reclassify capital lease assets acquired of $0.1 million from investing activities to a non-cash investing activity.
(23) Represent a correction to reclassify common stock issued to pay accrued interest on loans of $0.4 million from financing activity to non-cash financing activity and non-cash interest adjustment in operating activities.
F-12
Planet Payment, Inc.
Notes to consolidated financial statements (Continued)
2. Immaterial restatement (Continued)
(24) Represents the correction of a previously overstated due to merchants liability of $0.8 million.
(25) Represents the correction to reclassify $0.5 million of long-term restricted cash from an operating activity to an investing activity.
(26) Represents the correction of a previously overstated settlement asset of $0.9 million.
(27) Represents the correction of previously recording assets acquired under capital lease of $0.2 million as a purchase of property and equipment to a non-cash investing activity.
(28) Represents $0.1 million of principal payment on capital leases that was not previously recorded as a financing activity.
(29) Represents a correction that was made to remove the balances previously recorded as "Proceeds from loan payable" under cash flows from changes in Financing activities of $0.1 million, $0.2 million and $0.2 million for the years ended December 31, 2009 and 2010 and for the nine months ended September 30, 2010, respectively. Subsequently there is no "Proceeds from loan payable" line within the Consolidated Statements of Cash Flows.
3. Summary of significant accounting policies
Use of estimates
The preparation of consolidated financial statements in conformity with US GAAP requires management to make estimates and assumptions that affect the reported amounts and the disclosure of assets and liabilities at the date of the consolidated financial statements and the reported amounts of revenue and expenses during the period. Actual results could differ from those estimates.
On an on-going basis, the Company evaluates its estimates, including those related to the accounts receivable allowance, recoverability of long-lived assets, and other assets and liabilities; the useful lives of intangible assets, property and equipment, capitalized software development costs; assumptions used to calculate stock-based expense including volatility, expected life and forfeiture rate; and income taxes (including recoverability of deferred taxes), among others. The Company bases its estimates on historical experience and on other various assumptions that are believed to be reasonable, the results of which form the basis for making judgments about the carrying values of assets and liabilities.
Revenue recognition
The Company derives revenue principally through fees earned under fixed contractual arrangements with customers who use our international payment and multi-currency processing services. The Company has two revenue streams:
Multi-currency processing services revenue
Multi-currency processing services revenue is the foreign currency transaction fee earned on processing and converting of a credit or debit card transaction from one currency into another currency. Multi-currency transaction processing services revenue is recognized upon settlement of the transaction.
Payment processing services revenue
The Company follows the requirements of reporting revenue gross as a principal versus net as an agent included in the Revenue Recognition Topic of ASC topic 605, in determining its
F-13
Planet Payment, Inc.
Notes to consolidated financial statements (Continued)
3. Summary of significant accounting policies (Continued)
payment processing services revenue reporting. Generally, where the Company has merchant portability, credit risk and ultimate responsibility for the merchant, revenue is reported at the time of settlement on a gross basis equal to the full amount of the discount charged to the merchant. This amount may include interchange paid to card issuing banks and assessments paid to payment card associations.
Payment processing services revenue is transaction based and priced either as a fixed fee per transaction or calculated based on a percentage of the transaction value. The fees are charged for processing services provided in facilitating the sale of goods and services by means of credit and debit cards and other electronic payments and do not include the gross sales price paid by the ultimate buyer. Payment processing services revenue is recognized upon settlement of the transaction.
Our revenue is presented net of a provision for sales credits, which is estimated based on historical results and established in the period in which services are provided. As of the periods presented, there were no such provisions.
Cash and cash equivalents
Cash and cash equivalents consist of cash and highly liquid investments purchased with original maturity of three months or less.
Restricted cash
Restricted cash is primarily held by either processing partners where the Company holds a share of underwriting risk and for other potential liabilities under processing or by the Company on behalf of an automated clearing house, or ACH, transaction processing customer. The restricted cash balance related to the ACH transaction processing customer represents a contractual requirement with a sponsor bank to hold three times the daily average of the last thirty days of transactions. The long-term portion of restricted cash is contractually required to be held by some of the Company's processing partners and will remain restricted as long as the associated contracts are effective. As such, the Company classifies these portions as long-term.
Translation of non-U.S. currencies
The translation of assets and liabilities denominated in foreign currency into U.S. Dollars is made at the prevailing rate of exchange at the balance sheet date. Revenue and expenses are translated at the average exchange rates during the period. Translation adjustments are reflected in accumulated other comprehensive (loss) income on our consolidated balance sheets, while gains and losses resulting from foreign currency transactions are included in our consolidated statements of operations. Amounts resulting from foreign currency transactions included in our statement of operations were not material for the years ended December 31, 2008, 2009 and 2010 and for the nine months ended September 30, 2010 and 2011.
F-14
Planet Payment, Inc.
Notes to consolidated financial statements (Continued)
3. Summary of significant accounting policies (Continued)
Allowance for doubtful accounts
The Company maintains an allowance for doubtful accounts for estimated losses resulting from the inability of our customers to make payments due to the Company. The amount of the allowance is based on historical experience and our analysis of the accounts receivable balance outstanding. While credit losses have historically been within the Company's expectations and the provisions established, the Company cannot guarantee that it will continue to experience the same credit loss rates that it has in the past. If the financial condition of our customers were to deteriorate, resulting in their inability to make payments, additional allowances may be required which would result in an additional expense in the period that this determination was made. As of December 31, 2009 and 2010 and September 30, 2011, the Company has included an allowance for doubtful accounts of approximately $1.9 million, $1.4 million and $1.4 million, respectively.
Software licenses impairment
In the fourth quarter of 2010, due to the Company's unsuccessful efforts to sell software licenses previously purchased for resale, management determined that the underlying undiscounted cash flow projections did not support the recorded value of the asset and wrote-off the entire asset balance of $1.1 million to cost of revenue for the year ended December 31, 2010.
Property, equipment and depreciation
Property and equipment are stated at cost less accumulated depreciation, which is provided for by charges to income over the estimated useful lives of the assets using the straight-line method. Maintenance and repairs, which do not improve or extend the useful life of the respective asset, are charged to operating expenses as incurred. Upon sale or other disposition, the applicable amounts of asset cost and accumulated depreciation are removed from the accounts and the net amount, less proceeds from disposal, is charged or credited to income.
Software development costs and amortization
The Company capitalizes costs of materials, consultants and payroll and payroll-related costs incurred by employees involved in developing internal use computer software. Costs incurred during the preliminary project and post-implementation stages are charged to processing and service costs, which are included in cost of revenue as incurred. Software development costs are amortized to processing and service costs, which are included in cost of revenue on a straight-line basis over estimated useful lives of approximately three to five years. The Company performs periodic reviews to ensure that unamortized software costs remain recoverable from future cash flows. Capitalized software development costs, net, were $3.7 million, $4.6 million and $4.9 million as of December 31, 2009 and 2010 and September 30, 2011, respectively. Amortization expense totaled $0.7 million, $0.9 million and $1.1 million for the years ended December 31, 2008, 2009 and 2010, respectively. Amortization
F-15
Planet Payment, Inc.
Notes to consolidated financial statements (Continued)
3. Summary of significant accounting policies (Continued)
expense totaled $0.7 million and $1.2 million for the nine months ended September 30, 2010 and 2011, respectively.
Goodwill, intangibles and long-lived assets
The Company records as goodwill the excess of purchase price over the fair value of the tangible and identifiable intangible assets acquired. Goodwill is tested annually for impairment as well as whenever events or circumstances change that would make it more likely than not that an impairment may have occurred. Goodwill is tested for impairment using a two-step approach. The first step tests for potential goodwill impairment by comparing the fair value of identified reporting units to its carrying value. If the fair value of the reporting units are less than its carrying value the second step is to record an impairment loss to the extent that the implied fair value of the goodwill of each reporting unit is less than its carrying value. As of December 31, 2009 and 2010 and as of September 30, 2011, the Company had zero goodwill recorded. For the year ended December 31, 2008, the Company recorded a goodwill impairment charge of $0.1 million related to a 2005 acquisition.
The Company evaluates long-lived assets, including property and equipment and finite-lived intangible assets for potential impairment on an individual asset basis or at the lowest level asset grouping for which cash flows can be separately identified. Long-lived asset impairments are assessed whenever changes in circumstances could indicate that the carrying amounts of those productive assets exceed their projected undiscounted cash flows. When it is determined that impairment exists, the related asset group is written down to its estimated fair market value. The determination of future cash flows and the estimated fair value of long-lived assets, involve significant estimates on the part of management. In order to estimate the fair value of a long-lived asset, the Company may engage a third party to assist with the valuation.
The Company's process for assessing potential triggering events may include, but is not limited to, analysis of the following:
- •
- any sustained decline in the Company's stock price below book value;
- •
- results of the Company's goodwill impairment test (if applicable);
- •
- sales and operating trends affecting products and groupings;
- •
- the impact on current and future operating results related to industry statistics;
- •
- any losses of key acquired customer relationships; and
- •
- changes to or obsolescence of acquired technology, data, and trademarks.
The Company also evaluates the remaining useful life of its long-lived assets on a periodic basis to determine whether events or circumstances warrant a revision to the remaining estimated amortization period.
F-16
Planet Payment, Inc.
Notes to consolidated financial statements (Continued)
3. Summary of significant accounting policies (Continued)
Deferred initial public offering ("IPO") costs
Deferred IPO costs represent legal, accounting and other direct costs related to the Company's efforts to raise capital through an IPO. Future costs related to the Company's IPO activities will be deferred until the completion of the IPO, at which time they will be reclassified to additional paid-in capital as a reduction of the IPO proceeds. If the Company terminates its plan for an IPO, any deferred costs would be expensed at that time.
Due to merchants
Due to merchants represents funds collected on behalf of all the Company's acquired merchants using the iPAY gateway ACH product or funds collected on behalf of directly acquired merchants as security deposits. The ACH funds are generally held for an average of three days before payment to the merchant.
Income taxes
The Company accounts for income taxes on the asset and liability method. Under this method, deferred tax assets and liabilities are recognized for the future tax consequence attributable to differences between the financial statements carrying amounts of existing assets and liabilities and their respective tax bases and operating loss and tax credit carry-forwards. Deferred tax assets and liabilities are measured using enacted tax rates expected to apply to taxable income in the years in which those temporary differences are expected to be recovered or settled. The effect on deferred tax assets and liabilities due to a change in tax rates is recognized in results of operations in the period during which the tax change occurs. The Company's operations are conducted in various geographies with different tax rates. As the Company's operations evolve this may impact the Company's future effective tax rate.
The Company assesses whether it is necessary to establish a valuation allowance to reduce the deferred tax assets if it is more likely than not that some portion or all of the deferred tax assets will not be realized. The Company's process includes evaluating both positive (for example, sources of taxable income) and negative (for example, historical losses) evidence and determining whether it is more likely than not that the deferred tax assets will not be realized.
ASC topic 740-10, Accounting for Income Taxes, prescribes a comprehensive model for how companies should recognize, measure, present, and disclose uncertain tax positions taken or expected to be taken on a tax return. The company shall initially and subsequently measure such tax positions as the largest amount of tax benefit that is greater than 50% likely of being realized upon ultimate settlement with the tax authority assuming full knowledge of the position and all relevant facts. The Company has reviewed and evaluated the relevant technical merits of each of its tax positions, for all periods presented, and determined that there are no uncertain tax positions that would have a material impact on the financial statements of the Company.
F-17
Planet Payment, Inc.
Notes to consolidated financial statements (Continued)
3. Summary of significant accounting policies (Continued)
Concentration of credit risk
The Company's assets that are exposed to concentrations of credit risk consist primarily of cash, cash equivalents, restricted cash and receivables from clients. The Company places its cash, cash equivalents, and restricted cash with financial banking institutions that are insured by the Federal Depository Insurance Corporation ("FDIC") up to $250,000. The Company also maintains cash balances at foreign banking institutions, which are not insured by the FDIC. As of December 31, 2009 and 2010 and September 30, 2011, the Company's uninsured cash balances totaled $3.0 million, $3.8 million and $5.3 million, respectively. The Company maintains an allowance for uncollectible accounts receivable based on expected collectability and perform ongoing credit evaluations of customers' financial condition.
The Company's accounts receivable concentrations of 10% and greater are as follows:
| |
As of December 31, |
As of September 30, |
||||||||
|---|---|---|---|---|---|---|---|---|---|---|
| |
2009 |
2010 |
2011 |
|||||||
| |
|
|
(unaudited) |
|||||||
Customer A |
32% | 33% | 43% | |||||||
Customer B* |
20 | 22 | 16 | |||||||
Customer C |
10 | |||||||||
* Customer B is a sponsoring bank for certain merchants within the Company's payment processing services. Customer B serves as an aggregator of merchant transactions and therefore, there is a concentration risk relating to receivables. However, revenues are generated from individual merchants that individually do not exceed 10% of the Company's revenue.
The Company's revenue concentrations of 10% and greater are as follows:
| |
Year ended December 31, |
Nine months ended September 30, |
||||||||||||||
|---|---|---|---|---|---|---|---|---|---|---|---|---|---|---|---|---|
| |
2008 |
2009 |
2010 |
2010 |
2011 |
|||||||||||
| |
|
|
|
(unaudited) |
||||||||||||
Customer A |
14% | 24% | 30% | 30% | 29% | |||||||||||
Customer D |
11 | |||||||||||||||
Customer E |
10 | |||||||||||||||
F-18
Planet Payment, Inc.
Notes to consolidated financial statements (Continued)
3. Summary of significant accounting policies (Continued)
Net (loss) income per share
The Company computes net (loss) income per share in accordance with Financial Accounting Standards Board ("FASB") ASC 260, Earnings per Share ("ASC topic 260"). Under ASC topic 260, securities that contain rights to receive non-forfeitable dividends (whether paid or unpaid) are participating securities and should be included in the two-class method of computing earnings per share. The Company's preferred stockholders are entitled to participate in dividends and earnings when, and if, dividends are declared on the common stock. As such, the Company calculates net (loss) income per share using the two-class method. The two-class method is an earnings formula that treats a participating security as having rights to dividends that otherwise would have been available to common and preferred stockholders based on their respective rights to receive dividends. Losses are not allocated to the preferred stockholders for computing net loss per share under the two-class method because the preferred stockholders do not have contractual obligations to share in the losses of the Company.
Basic earnings per share is calculated by dividing net (loss) income, adjusted for amounts allocated to participating securities under the two-class method, if applicable, by the weighted average number of common stock outstanding during the period.
Diluted earnings per share is calculated by dividing net (loss) income by the weighted average number of shares of the Company's common stock outstanding, assuming dilution, during the period. The diluted earnings per share calculation assumes (i) all stock options and warrants which are in the money are exercised at the beginning of the period and (ii) each issue or series of issues of potential common stock are considered in sequence from the most dilutive to the least dilutive. That is, dilutive potential common stock with the lowest "earnings add-back per incremental share" shall be included in dilutive earnings per share before those with higher earnings add back per incremental share. For this purpose potential dilutive common stock include the stock options, warrants, shares of preferred stock and convertible debt.
F-19
Planet Payment, Inc.
Notes to consolidated financial statements (Continued)
3. Summary of significant accounting policies (Continued)
The following table sets forth the computation of basic and diluted net (loss) income per share:
| |
Year ended December 31, | Nine months ended September 30, |
||||||||||||||
|---|---|---|---|---|---|---|---|---|---|---|---|---|---|---|---|---|
| |
2008 |
2009 |
2010 |
2010 |
2011 |
|||||||||||
| |
|
|
|
(Unaudited) |
||||||||||||
Numerator: |
||||||||||||||||
(Loss) income from continuing operations, net of taxes |
$ | (11,429,513 | ) | $ | (4,183,200 | ) | $ | (3,064,787 | ) | $ | (2,831,657 | ) | $ | 600,311 | ||
Income from discontinued operations, net of taxes |
272,847 | — | — | — | — | |||||||||||
Net (loss) income |
$ | (11,156,666 | ) | $ | (4,183,200 | ) | $ | (3,064,787 | ) | $ | (2,831,657 | ) | $ | 600,311 | ||
Amounts allocated to participating preferred stockholders under the two-class method |
— | — | — | — | (72,491 | ) | ||||||||||
Net (loss) income applicable to common stockholders (basic and dilutive) |
$ | (11,156,666 | ) | $ | (4,183,200 | ) | $ | (3,064,787 | ) | $ | (2,831,657 | ) | $ | 527,820 | ||
Denominator: |
||||||||||||||||
Weighted average common stock outstanding (basic) |
26,720,171 | 33,725,727 | 40,431,073 | 39,316,392 | 48,834,130 | |||||||||||
Common equivalent shares from options and warrants to purchase common stock |
— | — | — | — | 2,758,981 | |||||||||||
Weighted average common stock outstanding (diluted) |
26,720,171 | 33,725,727 | 40,431,073 | 39,316,392 | 51,593,111 | |||||||||||
F-20
Planet Payment, Inc.
Notes to consolidated financial statements (Continued)
3. Summary of significant accounting policies (Continued)
| |
Year ended December 31, | Nine months ended September 30, |
||||||||||||||
|---|---|---|---|---|---|---|---|---|---|---|---|---|---|---|---|---|
| |
2008 |
2009 |
2010 |
2010 |
2011 |
|||||||||||
| |
|
|
|
(Unaudited) |
||||||||||||
Basic net (loss) income per share from continuing operations |
$ | (0.43 | ) | $ | (0.12 | ) | $ | (0.08 | ) | $ | (0.07 | ) | $ | 0.01 | ||
Basic net income (loss) per share from discontinued operations |
$ | 0.01 | $ | — | $ | — | $ | — | $ | — | ||||||
Basic net (loss) income per share applicable to common stockholders |
$ | (0.42 | ) | $ | (0.12 | ) | $ | (0.08 | ) | $ | (0.07 | ) | $ | 0.01 | ||
Diluted net (loss) income per share applicable to common stockholders |
$ | (0.42 | ) | $ | (0.12 | ) | $ | (0.08 | ) | $ | (0.07 | ) | $ | 0.01 | ||
|
||||||||||||||||
The following table sets forth the weighted securities outstanding that have been excluded from the diluted net (loss) income per share calculation because the effect would have been antidilutive:
| |
Year ended December 31, | Nine months ended September 30, |
||||||||||||||
|---|---|---|---|---|---|---|---|---|---|---|---|---|---|---|---|---|
| |
2008 |
2009 |
2010 |
2010 |
2011 |
|||||||||||
| |
|
|
|
(Unaudited) |
||||||||||||
Stock options |
5,826,661 | 6,605,583 | 7,264,204 | 7,231,781 | 958,876 | |||||||||||
Warrants |
5,423,118 | 4,279,472 | 3,661,083 | 3,800,435 | 182,539 | |||||||||||
Convertible debt |
3,513,608 | 4,867,730 | 4,049,776 | 4,049,776 | 1,759,582 | |||||||||||
Convertible preferred stock |
6,851,144 | 6,851,144 | 6,851,144 | 6,851,144 | 6,851,144 | |||||||||||
Total antidilutive securities |
21,614,531 | 22,603,929 | 21,826,207 | 21,933,136 | 9,752,141 | |||||||||||
|
||||||||||||||||
Unaudited pro forma (loss) income per share
Unaudited pro forma basic and diluted net (loss) income per share have been calculated to give effect, even if antidilutive, to (1) the automatic conversion of all outstanding shares of our convertible preferred stock into 6,851,144 shares of common stock effective immediately prior to the completion of this offering, and (2) the effectiveness upon the completion of this offering of our restated certificate of incorporation, on an as-if-converted basis for the year ended December 31, 2010 and the nine months ended September 30, 2011.
F-21
Planet Payment, Inc.
Notes to consolidated financial statements (Continued)
3. Summary of significant accounting policies (Continued)
The following table sets forth the computation of pro forma basic and diluted net (loss) income per share:
| |
Year ended December 31, 2010 |
Nine months ended September 30, 2011 |
|||
|---|---|---|---|---|---|
| |
|
(unaudited) |
|||
Numerator: |
|||||
Net (loss) income |
$ (3,064,787 | ) | $ 600,311 | ||
Denominator: |
|||||
Weighted average common stock outstanding (basic) |
40,431,073 | 48,834,130 | |||
Add: conversion of convertible debt |
4,474,776 | — | |||
Add: conversion of convertible preferred stock |
6,851,144 | 6,851,144 | |||
Total weighted average shares outstanding used in basic pro forma net (loss) income per share |
51,756,993 | 55,685,274 | |||
Dilutive effect of stock options and warrants |
— | 2,758,981 | |||
Total weighted average shares outstanding used in diluted pro forma net (loss) income per share |
51,756,993 | 58,444,255 | |||
Pro forma basic net (loss) income per share |
$ (0.06 | ) | $ 0.01 | ||
Pro forma diluted net (loss) income per share |
$ (0.06 | ) | $ 0.01 | ||
|
|||||
Stock-based expense and assumptions
Stock-based expense is measured at the grant date based on fair value and recognized as an expense over the requisite service period, net of an estimated forfeiture rate.
The following summarizes stock-based expense recognized by income statement classification:
| |
Year ended December 31, | Nine months ended September 30, |
||||||||||||||
|---|---|---|---|---|---|---|---|---|---|---|---|---|---|---|---|---|
| |
2008 |
2009 |
2010 |
2010 |
2011 |
|||||||||||
| |
|
|
|
(Unaudited) |
||||||||||||
Processing and service costs |
$ | 421,405 | $ | 437,919 | $ | 211,582 | $ | 194,293 | $ | 107,503 | ||||||
Selling, general and administrative expenses |
1,385,062 | 1,007,106 | 618,151 | 448,435 | 327,651 | |||||||||||
Total stock-based expense |
$ | 1,806,467 | $ | 1,445,025 | $ | 829,733 | $ | 642,728 | $ | 435,154 | ||||||
|
||||||||||||||||
F-22
Planet Payment, Inc.
Notes to consolidated financial statements (Continued)
3. Summary of significant accounting policies (Continued)
The following summarizes stock-based expense recognized by type:
| |
Year ended December 31, | Nine months ended September 30, |
||||||||||||||
|---|---|---|---|---|---|---|---|---|---|---|---|---|---|---|---|---|
| |
2008 |
2009 |
2010 |
2010 |
2011 |
|||||||||||
| |
|
|
|
(Unaudited) |
||||||||||||
Stock options |
$ | 1,487,493 | $ | 1,213,659 | $ | 739,992 | $ | 555,120 | $ | 420,226 | ||||||
Warrants(1) |
318,974 | 231,366 | 89,741 | 87,608 | 14,928 | |||||||||||
Total stock-based expense |
$ | 1,806,467 | $ | 1,445,025 | $ | 829,733 | $ | 642,728 | $ | 435,154 | ||||||
|
||||||||||||||||
(1) For the periods indicated in the table above, the Company issued warrants as a partial payment for legal services rendered.
A summary of the unamortized stock-based expense and associated weighted average remaining amortization periods for stock options and warrants is presented below:
| |
As of December 31, 2010 |
As of September 30, 2011 |
|||||||||||
|---|---|---|---|---|---|---|---|---|---|---|---|---|---|
| |
Unamortized stock-based expense |
Weighted average remaining amortization period (in years) |
Unamortized stock-based expense |
Weighted average remaining amortization period (in years) |
|||||||||
| |
|
|
(Unaudited) |
||||||||||
Stock options |
$ | 708,091 | 2.16 | $ | 965,243 | 1.76 | |||||||
Warrants |
$ | — | — | $ | — | — | |||||||
Stock-based expense assumptions and vesting requirements
Determining the appropriate fair value model and calculating the fair value of options and warrants require the input of highly subjective assumptions, including the expected life, expected stock price volatility, and the number of expected options and warrants that will be forfeited prior to the completion of the vesting requirements. The Company uses the Black-Scholes Option Pricing Model to value its options and warrants.
The Company accounts for warrants issued to non-employees as expense at their fair value over the service period. Warrants issued to non-employees vest immediately upon issuance and are not required to be revalued.
Expected life
Due to the limited history of the Company's common stock being publicly traded on AIM, the expected life for the Company's options granted was determined based on the "simplified" method under the provisions of ASC 718-10, Compensation—Stock Compensation. The expected life of warrants granted was determined based on the warrants contractual life.
F-23
Planet Payment, Inc.
Notes to consolidated financial statements (Continued)
3. Summary of significant accounting policies (Continued)
Expected stock price volatility
Due to the Company's limited public company history, the expected volatility for the Company's options and warrants was determined based upon the expected volatility of similar entities whose shares are publicly traded and have trading history commensurate with expected life.
Risk-free interest rate and dividend yield
The risk-free interest rates used for the Company's options and warrants granted were the U.S. Treasury zero-coupon rates for bonds matching its expected life of an option or warrant on the date of grant.
The expected dividend yield is not applicable to any options or warrants granted as the Company has not paid any dividends and intend to retain any future earnings for use in its business.
Vesting requirements
Options granted to employees generally vest 1/3rd of the amount of shares subject to each option on each 12-month anniversary from the vesting commencement date over a three year period and expire ten years from the grant date.
A director's annual grant vests and becomes exercisable as to 1/12th of the shares each month from the vesting commencement date. A director's initial grant vests and becomes exercisable as to 1/3rd of the shares on the 12-month anniversary from the vesting commencement date and then 1/36th of the shares each month thereafter, such that the grant vests in full after three years. All directors' options expire ten years from the grant date.
The Company's 2000 Stock Incentive Plan allows for acceleration of the vesting of outstanding options granted upon the occurrence of certain events related to change of control, merger, and the sale of substantially all of our assets or liquidation of the company, at the discretion of the Company's Board of Directors. The Company's 2006 Equity Incentive Plan provides that if outstanding options are not assumed or replaced by a successor corporation, options shall immediately vest as to 100% of the shares at such time and on such conditions as the Company's Board of Directors shall determine.
Warrants are generally issued for services performed by third parties or investments and are generally fully vested at grant and generally expire over a period of five years.
F-24
Planet Payment, Inc.
Notes to consolidated financial statements (Continued)
3. Summary of significant accounting policies (Continued)
Black-Scholes assumptions used for options and warrants
The fair market value of each option and warrant granted for all periods presented has been estimated on the grant date using the Black-Scholes Option Pricing Model with the following assumptions:
| |
Year ended December 31, | Nine months ended September 30, |
||||||||
|---|---|---|---|---|---|---|---|---|---|---|
| |
2008 |
2009 |
2010 |
2010 |
2011 |
|||||
| |
|
|
|
(Unaudited) |
||||||
Expected life (in years) |
5.0 - 6.0 | 5.0 - 6.0 | 5.0 - 6.0 | 5.0 - 6.0 | 5.0 - 6.32 | |||||
Expected volatility (percentage) |
36.61 - 39.21 | 35.43 - 36.80 | 28.20 - 36.23 | 34.50 - 36.23 | 27.80 - 36.68 | |||||
Risk-free interest rate (percentage) |
1.89 - 3.77 | 2.31 - 2.57 | 1.59 - 3.04 | 2.22 - 3.04 | 1.58 - 2.72 | |||||
Expected dividend yield |
— | — | — | — | — | |||||
The Company's Board of Directors has historically set the exercise price of stock options based on a price per share not less than the fair value of the Company's common stock on the date of grant. Since our shares of common stock began trading on AIM in 2006, the Company's Board of Directors has determined that the fair value of the shares of common stock on the date of grant is the closing price of the Company's common stock under the AIM symbol PPTR. The underlying security for all issued and outstanding options and warrants is the Company's common stock trading under PPTR.
Long-term incentive restricted stock agreement assumptions and vesting requirements
On July 26, 2011, the Company made a restricted stock grant of 915,000 shares of the Company's common stock to Philip Beck, its Chairman of the Board, Chief Executive Officer and President, pursuant to a Long-Term Incentive Restricted Stock Agreement. The 915,000 shares vest in four separate tranches, each with a different long-term performance goal. The awards will accelerate in full upon a sale or merger of the Company, if the consideration paid is at least $1 billion and there is a valuation or price equating to at least $15.00 per share. The performance goals for each tranche are outlined below:
- •
- Tranche one (expires 12/31/2014): Performance condition award consisting of 305,000 shares that vest based upon the
achievement of adjusted EBITDA (as will be defined in the Company's earnings releases for the relevant periods) per fully diluted share greater than or equal to $0.36 per share. The fair value of
tranche one is $0.7 million.
- •
- Tranche two (expires 12/31/2017): Performance condition award consisting of 47,000 shares that vest based upon the achievement of adjusted EBITDA (as will be defined in the
F-25
Planet Payment, Inc.
Notes to consolidated financial statements (Continued)
3. Summary of significant accounting policies (Continued)
Company's earnings releases for the relevant periods) per fully diluted share greater than or equal to $0.64 per share. The fair value of tranche two is $0.1 million.
- •
- Tranche three (expires 12/31/2017): Performance condition award consisting of 469,000 shares that vest based upon the
achievement of adjusted EBITDA (as will be defined in the Company's earnings releases for the relevant periods) per fully diluted share greater than or equal to $0.71 per share. The fair value of
tranche three is $1.0 million.
- •
- Tranche four (expires 12/31/2017): Market condition award consisting of 94,000 shares that vest based upon the fair market value of the Company's stock being greater than or equal to $12.00 per share for 75 consecutive trading days in the United States. The fair value of tranche four is $5,600.
In accordance with ASC 718-10, the Company valued the performance condition and market condition awards using the Black-Scholes and binomial lattice models, respectively. The fair values of the performance condition awards are based upon the closing price of shares of the Company's common stock that trade on AIM under the symbol "PPTR" on the date of grant. The total fair value of all three tranches of the performance condition awards is $1.8 million, of which no amounts have been expensed as it was not deemed probable that the performance conditions would be satisfied based on the financial assessment of September 30, 2011. The Company will reassess the probability of achieving each performance condition metric at each reporting period. The total fair value of the market condition award is $5,600. Given the inconsequential nature of the amount, the Company recorded the entire expense in the third quarter of 2011. The expense related to the market condition award is not reversed even if the market conditions are not satisfied.
The fair value of the market condition award has been estimated on the grant date using a binomial lattice-based valuation pricing model with the following assumptions:
| |
July 26, 2011 |
|
|---|---|---|
Expected life (in years) |
5.3 | |
Expected volatility (percentage) |
31.68 | |
Risk-free interest rate (percentage) |
2.04 | |
Expected dividend yield |
— | |
For further information on the Company's equity plans, please refer to Notes 15 and 16.
Fair value measurements
Fair value is defined as the exit price, or the amount that would be received to sell an asset or paid to transfer a liability in an orderly transaction between market participants at the measurement date. Inputs used to measure fair value are prioritized into a three-level fair
F-26
Planet Payment, Inc.
Notes to consolidated financial statements (Continued)
3. Summary of significant accounting policies (Continued)
value hierarchy. This hierarchy requires entities to maximize the use of observable inputs and minimize the use of unobservable inputs. The three levels of inputs used to measure fair values are as follows:
- •
- Level 1 – Fair value measurements of the asset or liability using observable inputs such as
quoted prices in active markets for identical assets and liabilities;
- •
- Level 2 – Fair value measurements of the asset or liability using inputs other than quoted
prices that are observable for the applicable asset or liability, either directly or indirectly, such as quoted prices for similar (as opposed to identical) assets or liabilities in active markets and
quoted prices for identical or similar assets or liabilities in markets that are not active; and
- •
- Level 3 – Fair value measurements of the asset or liability using unobservable inputs that reflect the Company's own assumptions regarding the applicable asset or liability.
The Company's cash and cash equivalents balances are residing in cash operating accounts and are not invested in money market funds or an equivalent. The Company's remaining asset and liability accounts are reflected in the consolidated financial statement at cost which approximates fair value because of the short-term nature of these items.
Recent accounting pronouncements
In May 2011, the FASB issued guidance resulting in common fair value measurement disclosure requirements between US GAAP and International Financial Reporting Standards. Consequently, the amendments change the wording used to describe many of the requirements in US GAAP for measuring fair value and disclosing information about fair value measurements. Some of the requirements clarify the FASB's intent about the application of existing fair value measurement requirements while other amendments change a particular principle or requirement for measuring fair value or for disclosing information about fair value measurements. The amendments in this guidance are effective prospectively for interim and annual periods beginning after December 15, 2011, with no early adoption permitted. This standard will be effective for the Company beginning with the quarter ending March 31, 2012. The Company does not expect the adoption to have a material impact on its consolidated financial statements.
In June 2011, the FASB issued an accounting pronouncement that provides new guidance on the presentation of comprehensive income (FASB ASC Topic 220) in financial statements. Entities are required to present total comprehensive income either in a single, continuous statement of comprehensive income or in two separate, but consecutive, statements. Under the single-statement approach, entities must include the components of net income, a total for net income, the components of other comprehensive income and a total for comprehensive income. Under the two-statement approach, entities must report an income statement and, immediately following, a statement of other comprehensive income. Under either method,
F-27
Planet Payment, Inc.
Notes to consolidated financial statements (Continued)
3. Summary of significant accounting policies (Continued)
entities must display adjustments for items reclassified from other comprehensive income to net income in both net income and other comprehensive income. The provisions for this pronouncement are effective for the fiscal years, and interim periods within those years, beginning after December 15, 2011, with early adoption permitted. This standard will be effective for the Company beginning with the quarter ending March 31, 2012. The adoption of this guidance is not expected to have an impact on the Company's consolidated financial statements.
In December 2011, the FASB issued accounting standards update ASU No. 2011-12, Deferral of the Effective Date for Amendments to the Presentation of Reclassifications of Items Out of Accumulated Other Comprehensive Income in Accounting Standards Update No. 2011-05, which defers the effective date pertaining to reclassification adjustments out of accumulated other comprehensive income in Accounting Standards Update 2011-05, Comprehensive Income (FASB ASC Topic 220): Presentation of Comprehensive Income. The provisions for this update are effective for the fiscal years, and interim periods within those years, beginning after December 15, 2011, with early adoption permitted. This standard will be effective for the Company beginning with the three months ending March 31, 2012. The adoption of this guidance is not expected to have an impact on the Company's consolidated financial statements.
4. Property and equipment
Property and equipment are recorded at cost and consist of the following:
| |
|
As of December 31, |
As of September 30, |
||||||||||
|---|---|---|---|---|---|---|---|---|---|---|---|---|---|
| |
Estimated useful life (years) |
||||||||||||
| |
2009 |
2010 |
2011 |
||||||||||
| |
|
|
|
(unaudited) |
|||||||||
Equipment |
5 | $ | 592,627 | $ | 700,087 | $ | 1,222,786 | ||||||
Computer hardware |
5 | 1,738,904 | 2,128,112 | 1,954,155 | |||||||||
Furniture and fixtures |
5 - 7 | 174,138 | 178,080 | 193,323 | |||||||||
Leasehold improvements |
5 - 7 | 331,228 | 355,123 | 331,081 | |||||||||
|
2,836,897 | 3,361,402 | 3,701,345 | ||||||||||
Less: Accumulated depreciation and amortization |
(1,474,842 |
) |
(1,977,092 |
) |
(2,485,118 |
) |
|||||||
Property and equipment, net |
$ | 1,362,055 | $ | 1,384,310 | $ | 1,216,227 | |||||||
F-28
Planet Payment, Inc.
Notes to consolidated financial statements (Continued)
4. Property and equipment (Continued)
Property and equipment depreciation and amortization expense is as follows:
| |
Year ended December 31, | Nine months ended September 30, |
||||||||||||||
|---|---|---|---|---|---|---|---|---|---|---|---|---|---|---|---|---|
| |
2008 |
2009 |
2010 |
2010 |
2011 |
|||||||||||
| |
|
|
|
(unaudited) |
||||||||||||
Depreciation and amortization expense |
$ | 386,986 | $ | 421,916 | $ | 502,250 | $ | 355,857 | $ | 517,021 | ||||||
5. Intangible assets
Intangible assets are recorded at estimated fair value and are amortized ratably over their estimated useful lives to processing and service costs, which are included in cost of revenue.
At December 31, the gross book value, accumulated amortization and amortization periods of intangible assets were as follows:
| |
As of December 31, 2009 | As of December 31, 2010 | |
|||||||||||||||||
|---|---|---|---|---|---|---|---|---|---|---|---|---|---|---|---|---|---|---|---|---|
| |
Amortization period (years) |
|||||||||||||||||||
| |
Gross book value |
Accumulated amortization |
Net book value |
Gross book value |
Accumulated amortization |
Net book value |
||||||||||||||
Trademarks and patents |
$ | 581,760 | $ | (105,834 | ) | $ | 475,926 | $ | 661,379 | $ | (149,375 | ) | $ | 512,004 | 15 | |||||
Customer contracts |
867,354 | (260,206 | ) | 607,148 | 867,354 | (433,677 | ) | 433,677 | 5 | |||||||||||
Intangible assets, net |
$ | 1,449,114 | $ | (366,040 | ) | $ | 1,083,074 | $ | 1,528,733 | $ | (583,052 | ) | $ | 945,681 | ||||||
As of September 30, 2011, the gross book value, accumulated amortization and amortization periods of intangible assets were as follows:
| |
As of September 30, 2011 | |
|||||||||
|---|---|---|---|---|---|---|---|---|---|---|---|
| |
Amortization period (years) |
||||||||||
| |
Gross book value |
Accumulated amortization |
Net book value |
||||||||
| |
(unaudited) |
|
|||||||||
Trademarks and patents |
$ | 722,869 | $ | (187,086 | ) | $ | 535,783 | 15 | |||
Customer contracts |
867,354 | (563,780 | ) | 303,574 | 5 | ||||||
Intangible assets, net |
$ | 1,590,223 | $ | (750,866 | ) | $ | 839,357 | ||||
F-29
Planet Payment, Inc.
Notes to consolidated financial statements (Continued)
5. Intangible assets (Continued)
Amortization expense related to intangible assets is as follows:
| |
Year ended December 31, | Nine months ended September 30, |
||||||||||||||
|---|---|---|---|---|---|---|---|---|---|---|---|---|---|---|---|---|
| |
2008 |
2009 |
2010 |
2010 |
2011 |
|||||||||||
| |
|
|
|
(unaudited) |
||||||||||||
Amortization expense |
$ | 114,249 | $ | 213,908 | $ | 217,011 | $ | 151,091 | $ | 167,814 | ||||||
Intangible amortization expense that will be charged to income for the subsequent five years and thereafter is estimated on the December 31, 2010 book value, as follows:
2011 |
$ | 221,296 | |||
2012 |
221,296 | ||||
2013 |
134,560 | ||||
2014 |
43,458 | ||||
2015 |
42,025 | ||||
Thereafter |
283,046 | ||||
Total |
$ | 945,681 | |||
|
|||||
6. iPAY asset acquisition
In April 2008, the Company acquired certain assets pursuant to bankruptcy proceedings relating to the former iPAY e-Commerce processing business for a cash purchase price of $1.2 million (including direct acquisition costs of $0.1 million). The acquired iPAY Gateway enables acceptance of many major payment types and methods for e-commerce, mail order and telephone order merchants.
The total purchase price was allocated to the assets acquired according to their estimated fair values at the date of acquisition as follows:
| |
Allocated fair value |
Estimated useful life (years) |
|||
|---|---|---|---|---|---|
Property and equipment |
$ | 249,065 | 5 | ||
Technology |
98,875 | 5 | |||
Customer contracts |
876,354 | 5 | |||
Total purchase price |
$ | 1,224,294 | |||
F-30
Planet Payment, Inc.
Notes to consolidated financial statements (Continued)
7. Long and short-term debt
Long and short-term debt consisted of the following:
| |
December 31, | September 30, | ||||||||
|---|---|---|---|---|---|---|---|---|---|---|
| |
2009 |
2010 |
2011 |
|||||||
| |
|
|
(unaudited) |
|||||||
Inter-Atlantic Fund L.P. note payable due November 30, 2010. Interest is 8% and was payable annually in cash or common stock at the Company's election. The Company issued a warrant exercisable for 3,053,435 shares of common stock. On November 30, 2010, 1,526,718 warrants were exercised and the note was repaid in full |
$ | 4,000,000 | $ | — | $ | — | ||||
Note payable due to First Horizon Merchant Services, Inc. ("FHMS") and First Tennessee Bank National Association ("FTB") payable on demand(1) |
660,000 |
660,000 |
— |
|||||||
Note payable due to FHMS and FTB payable on demand(1) |
40,000 | 40,000 | — | |||||||
Capital leases to various lessors secured by financed equipment and software with interest rates ranging from 9.29% to 20.04%. Principal and interest are payable monthly through January 2014 |
394,364 |
431,185 |
497,643 |
|||||||
Total long and short-term debt and capital leases |
5,094,364 | 1,131,185 | 497,643 | |||||||
Less current portion of debt and capital leases |
(4,840,044 |
) |
(917,834 |
) |
(263,043 |
) |
||||
Long-term portion of capital leases |
$ | 254,320 | $ | 213,351 | $ | 234,600 | ||||
|
||||||||||
(1) In 2003, the Company entered into an agreement with FHMS and FTB and recorded a liability. Due to a breach of the contractual terms by FHMS and FTB, the Company did not believe it was liable to repay these amounts. As of March 31, 2011, the statute of limitations had expired on $0.66 million of the $0.7 million balance and as of September 30, 2011, the statute of limitations had expired on the remaining $40,000. For the nine months ended September 30, 2011, the Company recorded other income due to the derecognition of the note payable in the amount of $0.7 million.
F-31
Planet Payment, Inc.
Notes to consolidated financial statements (Continued)
7. Long and short-term debt (Continued)
Interest expense by term debt component is as follows:
| |
Year ended December 31, | Nine months ended September 30, |
||||||||||||||
|---|---|---|---|---|---|---|---|---|---|---|---|---|---|---|---|---|
| |
2008 |
2009 |
2010 |
2010 |
2011 |
|||||||||||
| |
|
|
|
(unaudited) |
||||||||||||
Inter-Atlantic Fund L.P. note payable (non-cash) |
$ | 338,887 | $ | 337,926 | $ | 295,743 | $ | 252,750 | $ | — | ||||||
Capital leases |
27,123 | 53,285 | 65,257 | 48,677 | 53,160 | |||||||||||
Total term debt interest expense |
$ | 366,010 | $ | 391,211 | $ | 361,000 | $ | 301,427 | $ | 53,160 | ||||||
|
||||||||||||||||
8. Convertible debt
Long and short-term convertible debt as of December 31, 2009 and 2010:
| Issue date |
Maturity date |
Principal |
Accrued capitalized interest |
Total convertible debt |
Interest rate |
Conversion price |
||||||||||
|---|---|---|---|---|---|---|---|---|---|---|---|---|---|---|---|---|
| February 2007 | February 2012 | $ | 5,000,000 | $ | 811,056 | $ | 5,811,056 | 9% | $2.20 | |||||||
| April 2008 | April 2012 | 3,000,000 | 168,870 | 3,168,870 | 9 | 2.25 | ||||||||||
| Total convertible debt | $ | 8,000,000 | $ | 979,926 | $ | 8,979,926 | ||||||||||
In February 2007, in connection with a $7.6 million private placement, the Company issued a $5.0 million five-year term note convertible into 2,272,727 shares of common stock at a conversion price of $2.20 per share and issued $2.6 million or 1,141,491 new shares of common stock at a price of $2.28 per share. The $5.0 million note carried an annual interest rate of 9% (payable semi-annually commencing June 30, 2007) and was convertible at any time at the option of the note holders or automatically upon the achievement by the Company of certain events, namely a qualified U.S. initial public offering or the achievement of certain liquidity and market value of shares of the Company's common stock. At the Company's election, interest payments were payable in the form of cash or common stock. Interest payments of $0.8 million through December 31, 2008 were not paid and added to the principal amount. Interest payments after December 31, 2008 were paid out in the form of common stock.
In April 2008, the Company issued a $3.0 million four-year term note convertible into 1,333,333 shares of common stock at a conversion price of $2.25 per share. The $3.0 million note carried an annual interest rate of 9% (payable semi-annually commencing June 30, 2008) and was convertible at any time at the option of the note holders or automatically upon the achievement by the Company of certain events, namely a qualified U.S. initial public offering or the achievement of certain liquidity and market value of shares of the Company's common stock. At the Company's election interest payments were payable in the form of cash or
F-32
Planet Payment, Inc.
Notes to consolidated financial statements (Continued)
8. Convertible debt (Continued)
common stock. Interest payments of $0.2 million through December 31, 2008 were not paid and added to the principal amount. Interest payments after December 31, 2008 were paid out in the form of common stock.
In April 2011, the convertible debt holders converted their entire $9.0 million under convertible notes issued in 2007 and 2008 into an aggregate of 4,049,776 shares of common stock. In addition, we issued 127,318 shares of common stock valued at $0.3 million in lieu of cash payments for accrued interest and 297,682 shares of common stock valued at $0.6 million as a prepayment fee negotiated at the time of conversion. The shares issued for the accrued interest and the prepayment fee were valued at the average closing price of the Company's common stock on AIM under the symbol "PPTR" during the period immediately prior to the conversion. For the nine months ended September 30, 2011, the Company recorded the prepayment fee as an other expense of $0.6 million, which is included in Other income, net on the Consolidated Statements of Operations.
Total interest expense related to convertible debt is as follows:
| |
Year ended December 31, | Nine months ended September 30, |
||||||||||||||
|---|---|---|---|---|---|---|---|---|---|---|---|---|---|---|---|---|
| |
2008 |
2009 |
2010 |
2010 |
2011 |
|||||||||||
| |
|
|
|
(unaudited) |
||||||||||||
Convertible debt interest expense (non-cash) |
$ | 608,563 | $ | 808,193 | $ | 808,193 | $ | 604,484 | $ | 254,636 | ||||||
9. Commitments and contingencies
Operating leases
The Company leases office space and various office equipment under cancelable and noncancelable operating leases which expire on various dates through 2016. In general, leases relating to real estate include rent escalation clauses relating to increases in operating costs. Some leases also include renewal options of up to three years.
Operating lease expense is as follows:
| |
Year ended December 31, | |||||||||
|---|---|---|---|---|---|---|---|---|---|---|
| |
2008 |
2009 |
2010 |
|||||||
Operating lease expense |
$ | 1,134,572 | $ | 1,260,087 | $ | 1,243,621 | ||||
F-33
Planet Payment, Inc.
Notes to consolidated financial statements (Continued)
9. Commitments and contingencies (Continued)
Future minimum rental payments under noncancelable operating leases are as follows:
| Years ending December 31, |
|
|||
|---|---|---|---|---|
2011 |
$ | 1,479,857 | ||
2012 |
846,800 | |||
2013 |
826,475 | |||
2014 |
527,491 | |||
2015 |
520,822 | |||
Thereafter |
536,447 | |||
Total minimum lease payments |
$ | 4,737,892 | ||
|
||||
Capital leases
The following is an analysis of the leased property under capital leases by major property class:
| |
December 31, | ||||||
|---|---|---|---|---|---|---|---|
| |
2009 |
2010 |
|||||
Computer hardware |
$ | 533,487 | $ | 757,452 | |||
Less: Accumulated depreciation |
(133,863 | ) | (276,387 | ) | |||
Total capital leases, net |
$ | 399,624 | $ | 481,065 | |||
|
|||||||
Future minimum rental payments under capital leases are as follows:
| Years ending December 31, |
|
|||
|---|---|---|---|---|
2011 |
$ | 265,718 | ||
2012 |
163,560 | |||
2013 |
62,392 | |||
2014 |
9,296 | |||
2015 |
— | |||
Thereafter |
— | |||
Total minimum lease payments |
500,966 | |||
Less: Amounts representing taxes, included in total minimum lease payments(*) |
— | |||
Net minimum lease payments |
500,966 | |||
Less: Amounts representing interest payments |
(69,781 | ) | ||
Present value of net minimum lease payments |
$ | 431,185 | ||
|
||||
- *
- Tax amounts related to capital lease payments are inconsequential.
F-34
Planet Payment, Inc.
Notes to consolidated financial statements (Continued)
9. Commitments and contingencies (Continued)
Acquiring bank sponsorship agreements
The Company has entered into three acquiring bank sponsoring agreements expiring at various dates through 2015. The future minimum payments under those agreements are as follows:
| Years ending December 31, |
|
|||
|---|---|---|---|---|
2011 |
$ | 206,918 | ||
2012 |
127,500 | |||
2013 |
250,000 | |||
2014 |
300,000 | |||
2015 |
300,000 | |||
Thereafter |
25,000 | |||
Total payments |
$ | 1,209,418 | ||
|
||||
Employment agreements
Pursuant to employment agreements with certain employees, the Company had a commitment to pay severance of approximately $1.3 million and $1.8 million as of December 31, 2010 and September 30, 2011, respectively, in the event of termination without cause, as defined in the agreements. Additionally, in the event of termination upon a change of control, as defined in the agreements, the Company had a commitment to pay severance of $1.6 million and $1.9 million as of December 31, 2010 and September 30, 2011, respectively.
Contingent liabilities
In instances where the Company is acting as the merchant acquirer, the Company bears a risk that a merchant may engage in fraud by submitting for payment certain credit card transactions that may have been manipulated, are fictitious, or otherwise not bona fide. Similarly, the Company bears the risk that a merchant becomes insolvent, owing money to cardholders. To the extent that such fraud or insolvency occurs in circumstances where the Company is liable to make good any resultant losses, this could affect the Company's operating results and cash flows. The Company has required certain merchants to post cash reserves of approximately $0.2 million with the acquirer against such liabilities and has itself paid the acquirer a security deposit in connection there with, as shown on the consolidated balance sheets. Under FASB ASC 460, Guarantees, the Company evaluates its ultimate risk and records an estimate of potential loss for chargeback's related to merchant fraud based upon an assessment of actual historical fraud rates compared to recent bank card processing volume levels. No contingent liability has been recorded as of December 31, 2009 and 2010 and as of September 30, 2011, as the risk of material loss is considered remote. The Company monitors this contingent liability on a quarterly basis and will provide for a reserve if deemed necessary.
Outstanding litigation
From time to time, the Company may be subject to legal proceedings and claims in the ordinary course of business. The Company currently has no material legal proceedings pending
F-35
Planet Payment, Inc.
Notes to consolidated financial statements (Continued)
9. Commitments and contingencies (Continued)
against it. The Company has commenced proceedings in the United States against various parties seeking to recover receivables and other sums owed arising from breaches of contract and related wrongful acts and omissions. One such case was settled in 2010 resulting in proceeds of $0.5 million (before expenses). The net proceeds were recorded as an offset to operating expenses for the year ended December 31, 2010.
10. Convertible preferred stock
The preferred stock consists of 2,243,750 shares designated (and issued) as Series A Preferred Stock, and 1,756,250 shares which are undesignated (and unissued). Each issued share of Series A Preferred Stock is convertible into approximately 3.05 shares of common stock, for a total of 6,851,144 shares of common stock. Series A Preferred Stock may be converted into shares of common stock at any time at the election of the holder. In addition, all issued Series A Preferred Stock automatically convert into shares of common stock upon the consent of the holders of at least two-thirds of the voting power of the issued Series A Preferred Stock, or immediately prior to the closing of an initial public offering of common stock registered with the U.S. Securities and Exchange Commission in which the valuation of the Company is at least $50.0 million and the net proceeds of the offering are at least $25.0 million.
Upon the admission to the Company's common stock to AIM in March 2006, substantially all of the rights, preferences and privileges of the Series A preferred stockholders, except for the liquidation preference, terminated. The only difference in rights between the Series A Preferred Stock and the common stock is the payment of a liquidation preference on the Series A Preferred Stock in the event of an acquisition, liquidation or winding up of the Company. "Acquisition" is defined for purposes of payment of the liquidation preference as a consolidation or merger (or similar transaction) of the Company with or into any other corporation or the sale of all of the capital stock of the Company, in each case where the shareholders immediately prior to such transaction fail to retain a majority voting power of the Company's stock following such transaction, or a sale, lease, exclusive license or other disposition of all or substantially all of the Company's assets. Upon such a liquidation event, each share of Series A Preferred Stock entitles its holder to receive an amount equal to the original purchase price for the Series A Preferred Stock prior to payment on the common stock. The aggregate liquidation preference for the Series A Preferred Stock is approximately $9.0 million. In the event of an acquisition of the Company, the holders of Series A Preferred Stock would be entitled to receive the first approximately $9.0 million of the purchase price. After payment of this liquidation preference, the remaining proceeds would be distributed pro rata among the holders of common stock. The Series A Preferred Stock otherwise has identical rights to common stock on an as converted basis, including with respect to voting and dividends.
F-36
Planet Payment, Inc.
Notes to consolidated financial statements (Continued)
11. Common stock
The common stockholders are entitled to a distribution of all remaining assets (which may be more or less than the original investment), on a proportionate basis, in the event of the dissolution or winding up of the Company, after payment of all liabilities of the Company and the liquidation preference of all series of preferred stock then outstanding. The common stock has no conversion or redemption rights. The common stock is entitled to one vote per share at all general meetings of the Company. The common stockholders are entitled to share in all dividends and distributions, which may be declared by the Company, on a proportionate basis with all other classes and series of stock outstanding.
During the year ended December 31, 2008, the Company issued 446,991 shares of common stock as a result of exercised options and warrants and 108,498 new shares of common stock, in payment of interest upon the convertible debt.
During the year ended December 31, 2009 the Company issued 12,239,206 shares of common stock as follows:
Common stock issued in March 16, 2009 private placement(1) |
6,659,000 | |||
Common stock issued in November 4, 2009 private placement(2) |
3,076,000 | |||
Common stock issued in payment of principal and accrued interest on convertible debt(3) |
1,926,149 | |||
Common stock issued in payment of interest on term debt(4) |
521,745 | |||
Common stock issued as payment of director fees for services(5) |
56,312 | |||
Total common stock issued |
12,239,206 | |||
|
||||
(1) On March 16, 2009, the Company completed a private placement of 6,659,000 new shares of common stock at a price of $0.45 per share raising approximately $3.0 million (before expenses). The shares of common stock were issued to institutional and other investors. The net proceeds of this private placement provided additional working capital.
(2) On November 4, 2009, the Company completed a private placement of 3,076,000 new shares of common stock at a price of $1.30 per share raising approximately $4.0 million (before expenses). The shares of common stock were issued to institutional and other investors. The net proceeds of this private placement provided additional working capital.
(3) During the year ended December 31, 2009, the Company issued 1,926,149 new shares of common stock, in payment of $1.3 million of principal and accrued interest on convertible debt.
(4) During the year ended December 31, 2009, the Company issued 521,745 new shares of common stock, in payment of $0.7 million of accrued interest on term debt.
(5) In May 2009, the Company issued a director 56,312 new shares of common stock in lieu of approximately $35,000 payments of directors fees.
F-37
Planet Payment, Inc.
Notes to consolidated financial statements (Continued)
11. Common stock (Continued)
During the year ended December 31, 2010 the Company issued 6,898,283 shares of common stock as follows:
Common stock issued in October 22, 2010 private placement(6) |
4,500,000 | |||
Common stock issued in upon exercise of options and warrants(7) |
1,540,386 | |||
Common stock issued in payment of accrued interest on convertible debt(8) |
602,272 | |||
Common stock issued in payment of interest on term debt(9) |
255,625 | |||
Total common stock issued |
6,898,283 | |||
|
||||
(6) On October 22, 2010 the Company completed a private placement of 4,500,000 new shares of common stock at a price of $1.34 per share raising approximately $6.03 million (before expenses). The shares of common stock were issued to institutional investors. The net proceeds of the private placement provided additional working capital and were used to pay off term debt.
(7) The Company issued 1,526,718 new shares of common stock upon the exercise of warrants for $2.0 million and repaid in cash the $2.0 million balance of principal on the
term debt, which was discharged as of November 30, 2010. Refer to Note 7 for further information.
(8) During the year ended December 31, 2010, the Company issued 602,272 new shares of common stock, in payment of $0.8 million of accrued interest on convertible debt.
(9) During the year ended December 31, 2010, the Company issued 255,625 new shares of common stock, in payment of $0.3 million of accrued interest on term debt.
In April 2011, the convertible debt holders converted the outstanding principal amount of $9.0 million under convertible notes issued in 2007 and 2008 into an aggregate of 4,049,776 shares of common stock. In addition, the Company issued 127,318 shares of common stock valued at $0.3 million in lieu of cash payments for accrued interest and 297,682 shares of common stock valued at $0.6 million as a prepayment fee negotiated at the time of conversion. The shares issued for the accrued interest and the prepayment fee were valued at the average closing price of the Company's common stock on AIM under the symbol "PPTR" during the period immediately prior to the conversion.
On June 3, 2011, the Company's stockholders approved a proposal to amend and restate the Company's certificate of incorporation. The sole change in the amended and restated certificate was an increase in the authorized stock from 70,000,000 to 80,000,000 shares of common stock, $0.01 par value.
F-38
Planet Payment, Inc.
Notes to consolidated financial statements (Continued)
12. Related party transactions
The Company incurred the following operating expenses to companies that are principally owned by executives, directors or stockholders of the Company:
| |
Year ended December 31, | Nine months ended September 30, |
||||||||||||||
|---|---|---|---|---|---|---|---|---|---|---|---|---|---|---|---|---|
| |
2008 |
2009 |
2010 |
2010 |
2011 |
|||||||||||
| |
|
|
|
(unaudited) |
||||||||||||
Rent |
$ | 416,047 | $ | 463,936 | $ | 493,037 | $ | 355,528 | $ | 365,291 | ||||||
Consulting and professional fees |
161,207 | — | 21,291 | — | 51,984 | |||||||||||
See Note 7 regarding the Inter-Atlantic Fund L.P. related party note payable.
13. Discontinued operations
In October 2006, the Company entered into a contractual joint venture with JourneyPay Ltd. The Company agreed to contribute various services, absorb all losses and fund the joint venture's operations. The Company consolidated the joint venture's results as it had determined that the joint venture was a variable interest entity ("VIE") and the Company was the primary beneficiary. This determination was made under ASC 810-10. In making this determination, the Company evaluated its influence to direct the activities and the economic performance of the joint venture, in addition to the Company's obligation to absorb all losses and fund the joint venture's operations.
In January 2008, the Company terminated its joint venture relationship with JourneyPay Ltd. In November 2008, the Company sold its interest in the joint venture for consideration of a five-year note receivable in the amount of $0.2 million with an annual interest rate of 7%. For the year ended December 31, 2008, the Company recorded $0.3 million as income from discontinued operations related to this joint venture. For the year ended December 31, 2009 the Company determined that the note receivable and accrued interest of $0.3 million was uncollectible and in accordance with SAB Topic 5-Z(5), Accounting and Disclosure Regarding Discontinued Operations, the entire amount was written-off to selling, general and administrative expenses within continuing operations. The debtor subsequently filed for bankruptcy in 2010.
F-39
Planet Payment, Inc.
Notes to consolidated financial statements (Continued)
14. Income taxes
The components of the Company's (loss) income before provision for income taxes by jurisdiction are as follows:
| |
Year ended December 31, | |||||||||
|---|---|---|---|---|---|---|---|---|---|---|
| |
2008 |
2009 |
2010 |
|||||||
United States |
$ | (13,099,224 | ) | $ | (3,955,474 | ) | $ | (2,695,711 | ) | |
Outside United States |
1,944,239 | (223,631 | ) | (365,857 | ) | |||||
(Loss) before provision for income taxes, net |
$ | (11,154,985 | )(1) | $ | (4,179,105 | ) | $ | (3,061,568 | ) | |
|
||||||||||
(1) Amount is net of $0.3 million of income from discontinued operations.
The components of the provision for income taxes are as follows:
| |
Year ended December 31, | ||||||||||
|---|---|---|---|---|---|---|---|---|---|---|---|
| |
2008 |
2009 |
2010 |
||||||||
Current tax: |
|||||||||||
United States—Federal |
$ | — | $ | — | $ | — | |||||
United States—State and local |
1,681 | 4,095 | 3,219 | ||||||||
Outside United States |
— | — | — | ||||||||
Total current tax |
1,681 | 4,095 | 3,219 | ||||||||
Deferred tax: |
|||||||||||
United States—Federal |
— | — | — | ||||||||
United States—State and local |
— | — | — | ||||||||
Outside United States |
— | — | — | ||||||||
Total deferred tax |
— | — | — | ||||||||
Provision for income taxes, net |
$ | 1,681 | $ | 4,095 | $ | 3,219 | |||||
|
|||||||||||
The Company has incurred net operating losses since inception and has not recorded any Federal tax expense. The Company has recorded the applicable state income taxes due.
F-40
Planet Payment, Inc.
Notes to consolidated financial statements (Continued)
14. Income taxes (Continued)
The table below shows a reconciliation from the U.S. Federal statutory income rate of 34.0% to the effective income tax rate:
| |
Year ended December 31, | |||||||||
|---|---|---|---|---|---|---|---|---|---|---|
| |
2008 |
2009 |
2010 |
|||||||
Federal statutory rate |
34.0 | % | 34.0 | % | 34.0 | % | ||||
State tax (less than 0.1%) |
— | — | — | |||||||
Permanent differences |
1.0 | 2.0 | 2.0 | |||||||
Valuation allowance |
(35.0 | ) | (36.0 | ) | (36.0 | ) | ||||
Total tax provision |
0.0 | % | 0.0 | % | 0.0 | % | ||||
|
||||||||||
The components of deferred tax assets and liabilities are as follows:
| |
As of December 31, | |||||||
|---|---|---|---|---|---|---|---|---|
| |
2009 |
2010 |
||||||
Deferred tax assets: |
||||||||
Net operating loss carry-forwards |
$ | 21,722,655 | $ | 22,675,260 | ||||
Stock options |
1,484,009 | 1,735,678 | ||||||
Provision for doubtful accounts |
637,976 | 455,642 | ||||||
Total deferred tax assets |
23,844,640 | 24,866,580 | ||||||
Deferred tax liabilities: |
||||||||
Depreciation and amortization |
(384,892 | ) | (738,790 | ) | ||||
Total deferred tax liabilities |
(384,892 | ) | (738,790 | ) | ||||
Deferred tax valuation allowance |
(23,459,748 | ) | (24,127,790 | ) | ||||
Total deferred tax asset, net |
$ | — | $ | — | ||||
|
||||||||
Due to the Company's history of net operating losses, it has concluded that it is not more likely than not the Company would be able to utilize its deferred tax assets, and therefore a full valuation allowance has been provided.
As of December 31, 2010, the Company's foreign subsidiaries have a net operating loss in respect of which a full valuation allowance has been provided.
As of December 31, 2010, the Company has available net operating loss carry-forwards of $66.7 million, expiring in various years from 2020 through 2029.
Due to the Company's history of net operating losses, all years are open for examination by federal and state taxing authorities. The Company is also subject to income tax examinations by foreign tax authorities for all open tax years. There are no tax audits currently ongoing.
F-41
Planet Payment, Inc.
Notes to consolidated financial statements (Continued)
15. Stock incentive plan
2000 Stock Incentive Plan
Options granted under the 2000 Stock Incentive Plan were all non-qualified stock options. As of December 31, 2010 and September 30, 2011, 185,000 options and 107,000 options, respectively, were outstanding and zero options were available for future grant under the 2000 Stock Incentive Plan.
2006 Equity Incentive Plan
The Board of Directors and stockholders approved an equity incentive plan ("2006 Equity Incentive Plan" or "Plan") in January 2006. The Remuneration Committee of the Board of Directors (the "Committee") administers the Plan. Currently, the Company grants stock options under the 2006 Equity Incentive Plan to employees.
Under the terms of the 2000 Stock Incentive Plan and the 2006 Equity Incentive Plan, participants may be granted restricted shares or options to purchase the Company's common stock at the fair market value on the date of grant. As of December 31, 2010 and September 30, 2011, 8.1 million shares and 11.1 million shares, respectively, were reserved for issuance under the Plan. As of September 30, 2011, 915,000 restricted shares have been issued (see below for details) and no options have been issued below fair value. As of December 31, 2010 and September 30, 2011, 1.0 million shares and 2.3 million shares, respectively, of common stock were available for future issuance under the Plan.
On June 3, 2011, the Company's stockholders approved a proposal to amend its 2006 Equity Incentive Plan to increase the aggregate number of shares authorized for issuance under the Plan by 3.0 million shares. After giving effect to these additional shares, an aggregate of 11.1 million shares of common stock have been reserved for issuance pursuant to the Plan and 3.2 million shares were available for future issuance.
F-42
Planet Payment, Inc.
Notes to consolidated financial statements (Continued)
15. Stock incentive plan (Continued)
A summary of stock option activity for both plans during the year ended December 31, 2010 and the nine months ended September 30, 2011 is as follows:
| |
Number of options |
Weighted-average exercise price |
Weighted-average remaining contractual life (years) |
Aggregate intrinsic value |
|||||||||
|---|---|---|---|---|---|---|---|---|---|---|---|---|---|
Outstanding as of December 31, 2009 |
6,793,299 | $ | 2.36 | ||||||||||
Options granted |
1,306,678 | 1.95 | |||||||||||
Options exercised |
(13,668 | ) | 0.77 | ||||||||||
Options cancelled |
(626,594 | ) | 2.86 | ||||||||||
Options forfeited |
(157,832 | ) | 2.08 | ||||||||||
Outstanding as of December 31, 2010 |
7,301,883 | 2.25 | 6.67 | $ | 275,523 | ||||||||
Options granted |
924,500 | 2.19 | |||||||||||
Options exercised |
(230,573 | ) | 1.07 | ||||||||||
Options cancelled |
(115,891 | ) | 3.12 | ||||||||||
Options forfeited |
(35,125 | ) | 1.91 | ||||||||||
Outstanding as of September 30, 2011 |
7,844,794 | $ | 2.27 | 6.52 | 3,927,264 | ||||||||
Options exercisable as of December 31, 2010 |
5,942,540 | 2.33 | 6.28 | 254,258 | |||||||||
Options exercisable as of September 30, 2011 |
6,080,047 | 2.33 | 6.09 | 2,772,092 | |||||||||
Vested and expected to vest as of December 31, 2010 |
7,301,883 | 2.25 | 6.67 | 275,523 | |||||||||
Vested and expected to vest as of September 30, 2011 |
7,844,794 | $ | 2.27 | 6.52 | 3,927,264 | ||||||||
F-43
Planet Payment, Inc.
Notes to consolidated financial statements (Continued)
15. Stock incentive plan (Continued)
The following table provides additional information pertaining to the Company's stock options:
| |
Year ended December 31, | Nine months ended September 30, |
||||||||||||||
|---|---|---|---|---|---|---|---|---|---|---|---|---|---|---|---|---|
| |
2008 |
2009 |
2010 |
2010 |
2011 |
|||||||||||
| |
|
|
|
(unaudited) |
||||||||||||
Weighted-average grant date fair value for options granted during the period |
$ | 0.58 | $ | 0.56 | $ | 0.74 | $ | 0.78 | $ | 0.80 | ||||||
Total fair value of options vested during the period |
1,362,398 | 1,443,280 | 537,199 | 128,129 | 365,783 | |||||||||||
Total intrinsic value of options exercised during the period |
— | — | 12,583 | 23,268 | 266,012 | |||||||||||
The exercise prices range from $0.60 to $4.40 for stock options outstanding and exercisable as of December 31, 2010 and September 30, 2011.
The aggregate intrinsic value of stock options outstanding, vested and unvested expected to vest, and exercisable, represent the total pre-tax intrinsic value, based on the closing price of $0.72, $1.67 and $1.35 of PPTR as reported on AIM on December 31, 2008, 2009, and 2010, respectively.
The aggregate intrinsic value of stock options outstanding, vested and unvested expected to vest, and exercisable, represent the total pre-tax intrinsic value, based on the closing price of $0.91 and $2.71 of PPTR as reported on AIM on September 30, 2010 and 2011, respectively.
2011 long-term incentive restricted stock agreement
On July 26, 2011, the Company made a restricted stock grant of 915,000 shares of the Company's common stock to Philip Beck, its Chairman of the Board, Chief Executive Officer and President, pursuant to a Long-Term Incentive Restricted Stock Agreement. The 915,000 shares vest in four separate tranches, each with a different long-term performance goal. The awards will accelerate in full upon a sale or merger of the Company, if the consideration paid is at least $1 billion and there is a valuation or price equating to at least $15.00 per share. The performance goals for each tranche are outlined below:
- •
- Tranche one (expires 12/31/2014): Performance condition award consisting of 305,000 shares that vest based upon the
achievement of adjusted EBITDA (as will be defined in the Company's earnings releases for the relevant periods) per fully diluted share greater than or equal to $0.36 per share.
- •
- Tranche two (expires 12/31/2017): Performance condition award consisting of 47,000 shares that vest based upon the achievement of adjusted EBITDA (as will be defined in the
F-44
Planet Payment, Inc.
Notes to consolidated financial statements (Continued)
15. Stock incentive plan (Continued)
Company's earnings releases for the relevant periods) per fully diluted share greater than or equal to $0.64 per share.
- •
- Tranche three (expires 12/31/2017): Performance condition award consisting of 469,000 shares that vest based upon the
achievement of adjusted EBITDA (as will be defined in the Company's earnings releases for the relevant periods) per fully diluted share greater than or equal to $0.71 per share.
- •
- Tranche four (expires 12/31/2017): Market condition award consisting of 94,000 shares that vest based upon the fair market value of the Company's common stock being greater than or equal to $12.00 per share for 75 consecutive trading days in the United States.
16. Warrants
Warrants granted are generally issued for services performed by third parties or investments.
F-45
Planet Payment, Inc.
Notes to consolidated financial statements (Continued)
16. Warrants (Continued)
A summary of warrant activity during the year ended December 31, 2010 and the nine months ended September 30, 2011 is as follows:
| |
Number of warrants |
Weighted-average exercise price |
Weighted-average remaining contractual life (years) |
Aggregate intrinsic value |
|||||||||
|---|---|---|---|---|---|---|---|---|---|---|---|---|---|
Outstanding as of December 31, 2009 |
3,785,328 | $ | 1.50 | ||||||||||
Warrants granted |
23,931 | 0.25 | |||||||||||
Warrants exercised |
(1,541,924 | ) | 1.30 | ||||||||||
Warrants cancelled |
(148,023 | ) | 1.29 | ||||||||||
Warrants forfeited |
— | — | |||||||||||
Outstanding as of December 31, 2010 |
2,119,312 | 1.64 | 3.40 | $ | 399,733 | ||||||||
Warrants granted |
3,981 | 0.25 | |||||||||||
Warrants exercised |
— | — | |||||||||||
Warrants cancelled |
— | — | |||||||||||
Warrants forfeited |
— | — | |||||||||||
Outstanding as of September 30, 2011 |
2,123,293 | 1.64 | 3.00 | 2,788,752 | |||||||||
Warrants exercisable as of December 31, 2010 |
2,119,312 | 1.64 | 3.40 | 399,733 | |||||||||
Warrants exercisable as of September 30, 2011 |
2,123,293 | 1.64 | 3.00 | 2,788,752 | |||||||||
Vested and expected to vest as of December 31, 2010 |
2,119,312 | 1.64 | 3.40 | 399,733 | |||||||||
Vested and expected to vest as of September 30, 2011 |
2,123,293 | 1.64 | 3.00 | 2,788,752 | |||||||||
F-46
Planet Payment, Inc.
Notes to consolidated financial statements (Continued)
16. Warrants (Continued)