Attached files
| file | filename |
|---|---|
| 8-K - FORM 8-K - BRYN MAWR BANK CORPORATION - BRYN MAWR BANK CORP | d292400d8k.htm |
| EX-99.1 - SCRIPT FOR FEBRUARY 1, 2012 EARNINGS CONFERENCE CALL - BRYN MAWR BANK CORP | d292400dex991.htm |
 Year
End 2011 Update
December 31, 2011
Bryn Mawr Bank
Corporation
NASDAQ: BMTC
Strong -
Stable -
Secure
Exhibit 99.2 |
 1
Safe Harbor
This presentation contains statements which, to the extent that they are not
recitations of historical fact may constitute forward-looking statements for
purposes of the Securities Act of 1933, as amended, and the Securities
Exchange Act of 1934, as amended.
Please see the section titled Safe Harbor at the end of the presentation for more
information regarding these types of statements.
The information contained in this presentation is correct only as of January 30,
2012. Our business, financial condition, results of operations and
prospects may have changed since that date, and we do not undertake to
update such information. |
 2
Bryn Mawr Bank Corporation
Profile
Founded in 1889 –
121 year history
A unique business model with a traditional commercial bank ($1.8
billion)
and a trust company ($4.8 billion) under one roof at December 31, 2011
Wholly owned subsidiary –
The Bryn Mawr Trust Company
Largest community bank in Philadelphia’s affluent western suburbs
26 years on the NASDAQ |
 3
Southeast PA Footprint
•
17 BMTC Full Service Branch Locations |
 4
Investment Considerations
Quarterly dividend increased 6.7% to $0.16, declared January 26,
2012
Year to Date at December 31, 2011:
Return on Average Assets (ROA):
1.14%
Return on Average Equity (ROE):
11.08%
Solid financial fundamentals and well capitalized
New business initiatives driving growth
$4.8 billion wealth management business that provides a significant
source of non-interest income |
 5
2011 BMTC Stock Performance
Closing price on December 31, 2010:
$17.45
Closing price on December 30, 2011:
$19.49
Dividends declared per share in 2011:
$0.60
Security or Index
2011 Return
Dividend Yield**
BMTC*
15.13%
3.08%
NASDAQ Bank Index*
-10.47%
2.21%
KBW Bank Index*
-23.02%
2.00%
*Source: Bloomberg
**Trailing 12-month period |
 6
Consistent BMTC Dividend
Year
Annual
Dividend
Dividend Yield
Year-End
Dividend Payout
Ratio
2008
$0.54
2.69%
50.0%
2009
$0.56
3.71%
47.5%
2010
$0.56
3.21%
65.9%*
2011
$0.60
3.08%
39.0%
*Excluding the $5.7 million of merger related and due diligence expense,
the dividend payout ratio was 46.0%. |
 7
Growth Initiatives |
 8
2012 Strategic Initiatives
3-5-3 Strategic Plan
$3 billion in banking assets -
$5 billion in wealth assets –
3 years
(Spring 2013)
Organic growth –
opportunistic expansion
Inorganic growth: Additional acquisitions accretive to earnings per
share in first 12 months (excluding merger costs) |
 9
2012 Strategic Initiatives -
continued
Focus on the net interest margin
Continued emphasis on strong credit quality
Integrate, streamline and assimilate recent acquisitions into more
effective and efficient wealth operations
Lower the efficiency ratio |
 10
Financial Review |
 11
Financial Highlights
4
th
Qtr
2011
3
rd
Qtr
2011
2
nd
Qtr
2011
1
st
Qtr
2011
4
th
Qtr
2010
Portfolio Loans & Leases
($ in millions)
$1,295
$1,278
$1,253
$1,219
$1,197
Total Deposits
($ in millions)
$1,382
$1,351
$1,337
$1,316
$1,341
Total Wealth Assets
($ in billions)
$4.83
$4.50
$4.83
$3.60
$3.41
Market Capitalization
($ in millions)
$253.2
$215.0
$262.1
$257.9
$212.8
Efficiency Ratio
64.8%
64.1%
62.0%
62.8%
60.3% |
 12
Financial Highlights -
continued
4
th
Qtr
2011
3
rd
Qtr
2011
2
nd
Qtr
2011
1
st
Qtr
2011
4
th
Qtr
2010
Net Income
($ in millions)
$5.17
$5.02
$4.81
$4.72
$5.57
Diluted Earnings Per
Common Share
$0.40
$0.39
$0.38
$0.38
$0.46
Dividends Declared
$0.15
$0.15
$0.15
$0.15
$0.14
Book Value Per Share
$14.09
$14.30
$14.17
$13.61
$13.24
Tangible Book Value Per
Share
$10.82
$11.11
$10.91
$11.65
$11.21
Tangible Common Equity
Ratio
8.25%
8.48%
8.31%
8.65%
8.01% |
 13
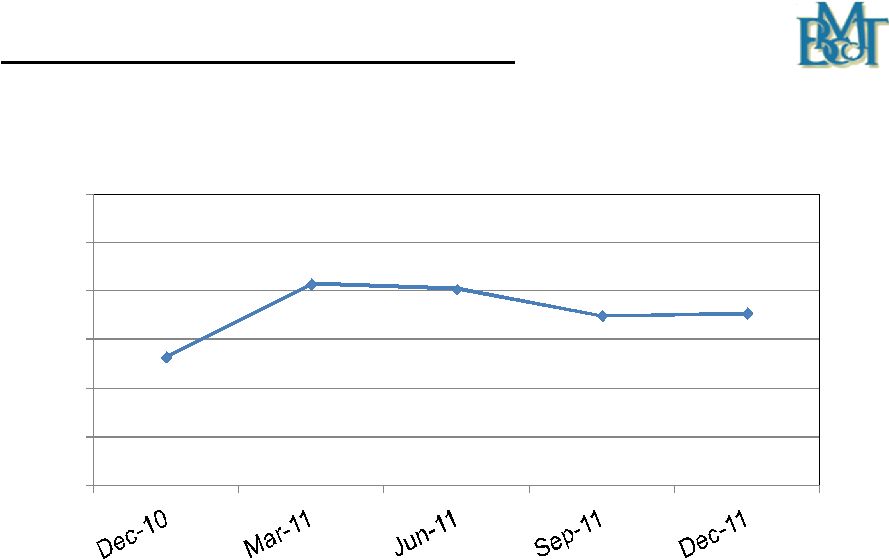
3.73%
4.03%
4.01%
3.90%
3.91%
3.2%
3.4%
3.6%
3.8%
4.0%
4.2%
4.4%
Quarterly Net Interest Margin
On a tax-equivalent basis |
 14
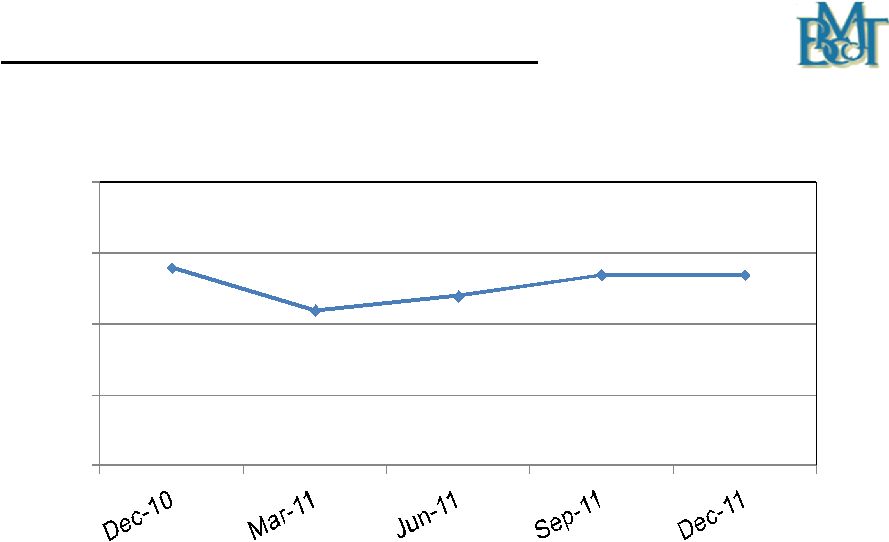
38%
32%
34%
37%
37%
10%
20%
30%
40%
50%
Quarterly Non-Interest Income
(As a % of Total Revenue) |
 15
Capital Considerations
Maintain a “well capitalized”
capital position including a target tangible
common equity to tangible asset ratio of 8.00%
Selectively add capital as needed to maintain capital levels and
fund asset
growth and acquisitions. Place more emphasis on retained earnings.
Active Dividend Reinvestment and Stock Purchase Plan with Request for
Waiver program
$8.1 million of capital raised through the Request for Waiver
program in 2011 |
 16
Capital Position -
Bryn Mawr Bank Corporation
12/31/2011
6/30/2011
12/31/2010
Tier I
11.23%*
11.55%
11.30%
Total (Tier II)
13.81%*
14.05%
13.71%
Tier I Leverage
8.94%*
9.36%
8.85%
Tangible Common
Equity
8.25%
8.31%
8.01%
*On 12/19/2011 the Corporation prepaid $12 million of junior subordinated
debt acquired during the First Keystone Bank acquisition which had a
rate of 9.7%. The prepayment reduced Tier I capital by $12 million with no
effect on the tangible common equity ratio. |
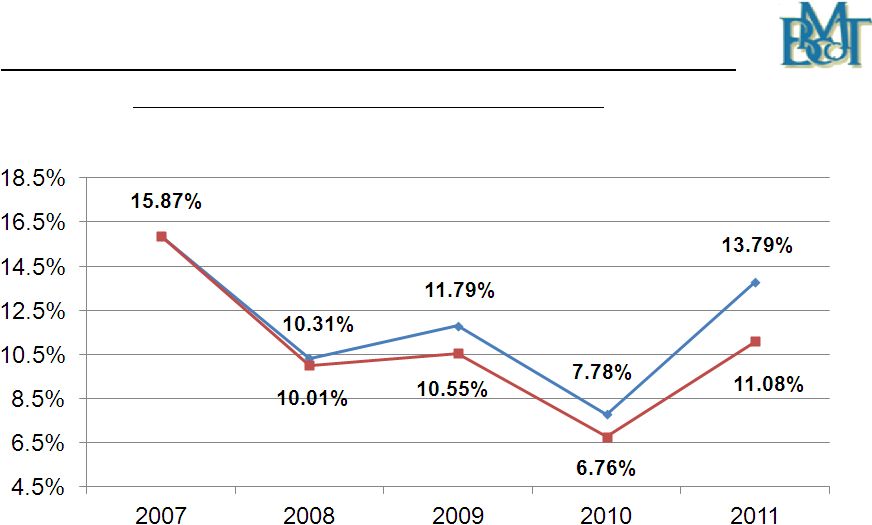 17
Return on Average Equity and Average Tangible
Equity (a Non-GAAP Measure*)
-----
Return on Average Tangible
Equity -----
Return on Average Equity
*Tangible
equity
equals
equity
minus
goodwill
and
other
intangible
assets |
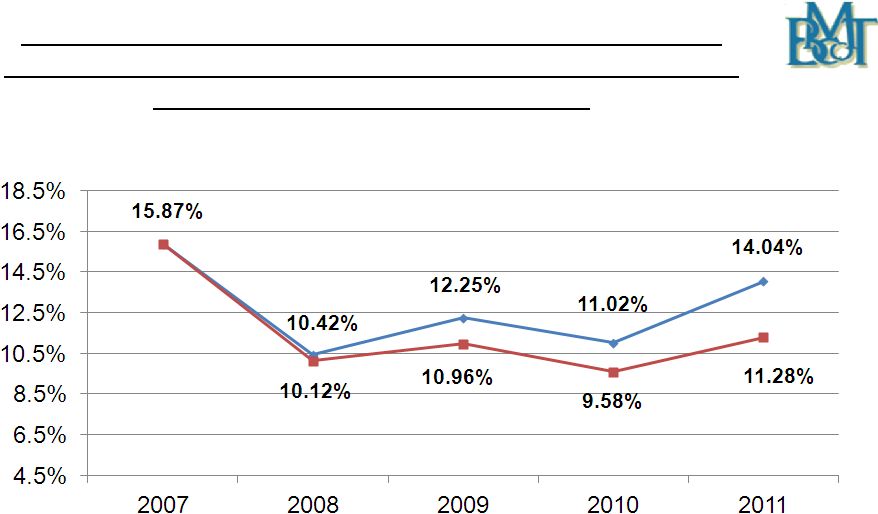 18
Return on Average Equity and Average Tangible Equity
Excluding Tax-Effected Due Diligence and Merger-Related
Expenses (a Non-GAAP Measure*)
*The returns on average tangible equity and average equity were calculated by
adding back to reported net income (a GAAP measure), the tax-effected
due diligence and merger-related expenses for the years referenced above. These non-GAAP ratios provide useful
supplemental information that is essential to understanding the Corporation’s
financial results. ----
Return
on
Average
Tangible
Equity
----
Return
on
Average
Equity |
 19
Wealth Division Review |
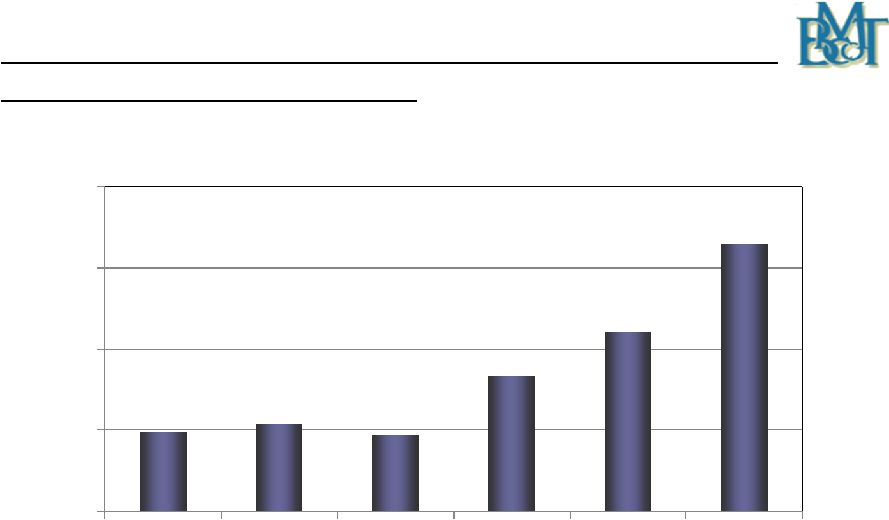 20
$2.18
$2.28
$2.15
$2.87
$3.41
$4.83
$1.2
$2.2
$3.2
$4.2
$5.2
2006
2007
2008
2009
2010
2011
Wealth Assets Under Management, Administration,
Supervision and Brokerage
($ in billions)
Excludes Community Bank’s assets from 2006 -
2007 |
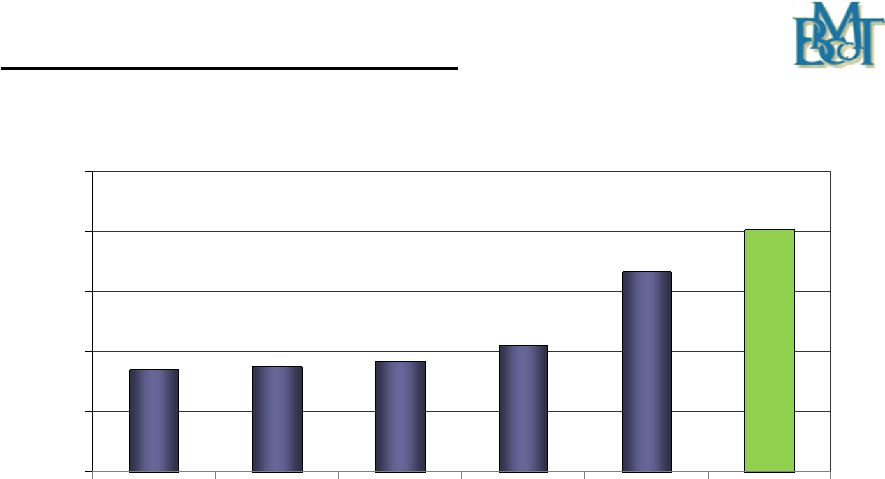 21
$13.5
$13.8
$14.2
$15.5
$21.7
$25.2
$5.0
$10.0
$15.0
$20.0
$25.0
$30.0
2007
2008
2009
2010
2011
2011 Run
Rate*
Wealth Management Fees
($ in millions)
*
Assumes
4
th
Quarter
2011
fees
for
wealth
management
services
are
annualized. |
 22
Wealth Division Highlights
Total Assets Under Management:
$4.8 billion
Record 12 Month Revenue:
$21.7 million
2011 Run Rate:
$25.2 million
Traditional Trust Activities (Bryn Mawr, PA)
$2.3 billion in assets at December 31, 2011
Fiduciary trust, asset management, retirement services, investment
management, custody services
Long standing client relationships
Private Wealth Management Group (Hershey, PA)
$1.0 billion in assets under management
Long standing client relationships –
70% more than 5 years
Acquired in May 2011 |
 23
Wealth Division Highlights -
continued
Bryn Mawr Asset Management (Bryn Mawr, PA)
$273 million in assets at December 31, 2011
“Lift Out”
strategy with other opportunities being evaluated
BMTC of Delaware (Greeneville, DE)
$683 million in assets at December 31, 2011
Started de-novo in September 2008
The Delaware Advantage
Lau Associates (Greeneville, DE)
$595 million in assets at December 31, 2011
Acquired in August 2008 |
 24
Credit Review |
 25
Portfolio Loan & Lease Growth
* From 2010 forward, includes the addition of the First Keystone
loan portfolio. |
 26
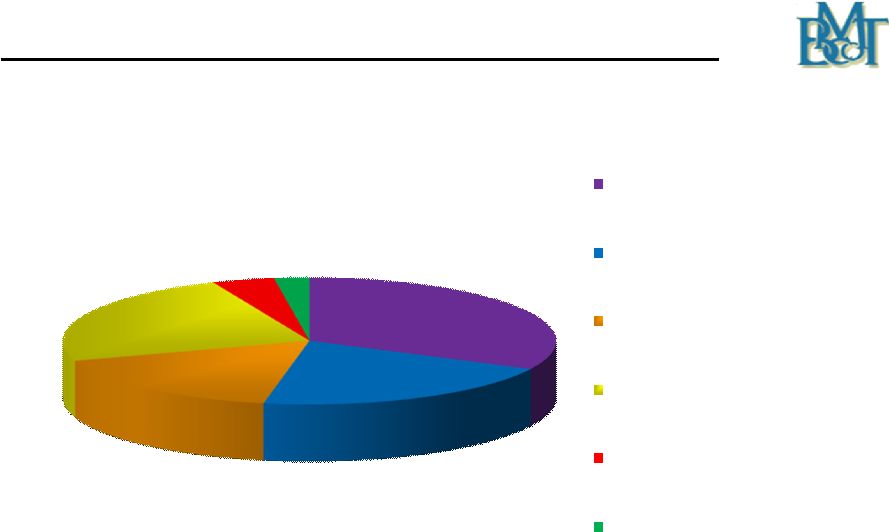
Loan Composition at December 31, 2011
$419
$267
$219
$307
$53
$30
Commercial Mortgages
(32%)
Commercial & Industrial
(21%)
Home Equity & Consumer
Loans (17%)
Residential Mortgages
(24%)
Construction
(4%)
Leases
(2%)
($ in millions)
Total loans and leases of $1.295 billion |
 27
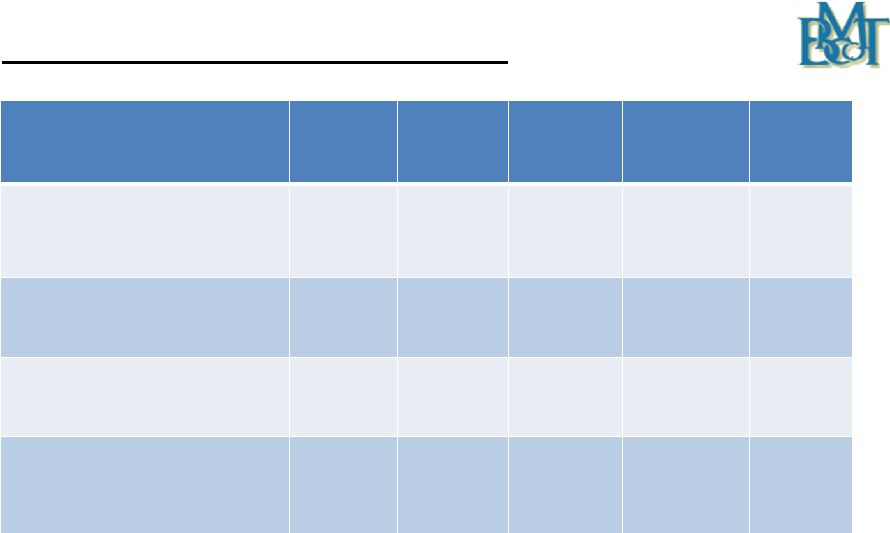
Quarterly Asset Quality Data
4
th
Qtr
2011
3
rd
Qtr
2011
2
nd
Qtr
2011
1
st
Qtr
2011
4
th
Qtr
2010
Non-Performing Loans as a % of
Portfolio Loans and Leases
1.11%
1.11%
1.29%
0.88%
0.79%
Allowance as a % of Portfolio
Loans and Leases
0.98%
0.91%
0.90%
0.87%
0.86%
Non-Performing Assets as a % of
Assets
0.84%
0.88%
0.97%
0.77%
0.69%
Annualized Net Charge-Offs as a
% of average quarterly loans and
leases
-0.01%
0.49%
0.40%
0.30%
0.52% |
 28
Small Ticket National Leasing Business
Leases outstanding: $30 million at December 31, 2011
Average yield of 10.17% at December 31, 2011
Profitable in 2010 and 2011 as asset quality improved significantly
Projections are for 6.5% growth in 2012
Delinquency rate continues to improve:
1.24% at December 31, 2011
2.05% at December 31, 2010
2.87% at December 31, 2009 |
 29
Summary
Outstanding franchise in a stable market
Focus on Wealth Services, Business Banking and Private Banking
Investing in growth opportunities today for anticipated earnings
growth tomorrow
Sound business strategy, strong asset quality, well capitalized
and solid risk management procedures serve as a foundation for
potential strategic expansion |
 30
Thank You
Joseph Keefer, EVP
610-581-4869
jkeefer@bmtc.com
Duncan Smith, CFO
610-526 –2466
jdsmith@bmtc.com
Ted Peters, Chairman
610-581-4800
tpeters@bmtc.com
Frank Leto, EVP
610-581-4730
fleto@bmtc.com
Aaron Strenkoski, VP –
Investments & Shareholder Relations –
610-581-4822 –
astrenkoski@bmtc.com |
 31
This presentation contains statements which, to the extent that they are not
recitations of historical fact may constitute forward-looking statements
for purposes of the Securities Act of 1933, as amended, and the Securities
Exchange Act of 1934, as amended. Such forward-looking statements may
include financial and other projections as well as statements regarding Bryn
Mawr Bank Corporation’s (the “Corporation”) that may include future
plans, objectives, performance, revenues, growth, profits, operating
expenses or the Corporation’s underlying assumptions. The words
“may”, “would”, “should”, “could”, “will”, “likely”, “possibly”, “expect,”
“anticipate,”
“intend”, “estimate”, “target”,
“potentially”, “probably”, “outlook”, “predict”,
“contemplate”, “continue”, “plan”,
“forecast”, “project” and “believe”
or other similar words, phrases
or concepts may identify forward-looking statements. Persons reading or present
at this presentation are cautioned that such statements are only
predictions, and that the Corporation’s actual future results or
performance may be materially different. Such forward-looking statements
involve known and unknown risks and uncertainties. A number of factors, many
of which are beyond the Corporation’s control, could cause our actual results,
events or developments, or industry results, to be materially different from any
future results, events
or
developments
expressed,
implied
or
anticipated
by
such
forward-looking
statements,
and so our business and financial condition and results of operations could be
materially and adversely affected.
Safe Harbor |
 32
Safe Harbor (continued)
Such factors include, among others, our need for capital, our ability to control
operating costs and expenses, and to manage loan and lease delinquency
rates; the credit risks of lending activities and overall quality of the
composition of our loan, lease and securities portfolio; the impact of
economic conditions, consumer and business spending habits, and real estate market
conditions on our business and in our market area; changes in the levels
of general interest rates, deposit
interest rates, or net interest margin and funding sources; changes in banking
regulations and policies and the possibility that any banking agency
approvals we might require for certain activities will not be obtained in a
timely manner or at all or will be conditioned in a manner that would impair
our ability to implement our business plans; changes in accounting policies and
practices; the inability of key third-party providers to perform their
obligations to us; our ability to attract and retain key personnel;
competition in our marketplace; war or terrorist activities; material
differences in the actual financial results, cost savings and revenue enhancements
associated with our acquisitions including our acquisition of the Private
Wealth Management Group of the Hershey Trust Company; and other factors as
described in our securities filings. All forward- looking statements and
information made herein are based on Management’s current beliefs and
assumptions
as
of
January
30,
2012
and
speak
only
as
of
that
date.
The
Corporation
does
not
undertake to update forward-looking statements. |
 33
Safe Harbor (continued)
For a complete discussion of the assumptions, risks and uncertainties related to
our business, you are encouraged to review our filings with the Securities
and Exchange Commission, including our most recent annual report on Form
10-K, as well as any changes in risk factors that we may identify in our
quarterly or other reports filed with the SEC. This
presentation
is
for
discussion
purposes
only,
and
shall
not
constitute
any
offer
to
sell
or
the
solicitation
of
an
offer
to
buy
any
security,
nor
is
it
intended
to
give
rise
to
any
legal
relationship
between
the
Corporation
and
you
or
any
other
person,
nor
is
it
a
recommendation
to
buy
any
securities or enter into any transaction with the Corporation.
The information contained herein is preliminary and material changes to such
information may be made at any time. If any offer of securities is made, it
shall be made pursuant to a definitive offering memorandum or prospectus
(“Offering Memorandum”) prepared by or on behalf of the
Corporation, which would contain material information not contained herein and
which shall supersede, amend and supplement this information in its
entirety. Any decision to invest in the Corporation’s securities
should be made after reviewing an Offering Memorandum, conducting such
investigations as the investor deems necessary or appropriate, and consulting the investor’s
own legal, accounting, tax, and other advisors in order to make an independent
determination of the suitability and consequences of an investment in such
securities. |
 34
Safe Harbor (continued)
No offer to purchase securities of the Corporation will be made or accepted prior
to receipt by an investor of an Offering Memorandum and relevant
subscription documentation, all of which must be reviewed together with the
Corporation’s then-current financial statements and, with respect to
the subscription documentation, completed and returned to the Corporation in its
entirety. Unless purchasing in an offering of securities registered
pursuant to the Securities Act of 1933, as amended,
all
investors
must
be
“accredited
investors”
as
defined
in
the
securities
laws
of
the
United States before they can invest in the Corporation.
|