Attached files
| file | filename |
|---|---|
| 8-K - FORM 8-K - NEWELL BRANDS INC. | d288018d8k.htm |
Exhibit 99.1
Newell Rubbermaid Reports Fourth Quarter 2011 Results
» Core and Net Sales Growth of 3.7%
» Normalized EPS of $0.40, a 21% Increase Compared to Prior Year Quarter
» Provides 2012 Guidance
ATLANTA, January 27, 2012 – Newell Rubbermaid (NYSE: NWL) today announced fourth quarter 2011 results with core and net sales growth of 3.7 percent and normalized earnings per share of $0.40, a 21.2 percent improvement versus prior year. Reported diluted earnings per share of $0.27 represents an 8.0% improvement compared with the prior year.
“Newell Rubbermaid’s fourth quarter results were solid in a continuing tough environment,” said President and Chief Executive Officer, Michael Polk. “Our fourth quarter core sales growth of 3.7 percent was the strongest quarter of the year. Our EPS delivery was very good and full year operating cash flow was at the high end of our guidance range.”
“In 2012, we expect to sustain our momentum delivering sequentially improved core sales growth versus our full year 2011 results, despite the weak developed world macroeconomic environment. We will continue to invest in our company’s future by further strengthening our brand building and selling capabilities as we build Newell Rubbermaid into a bigger, faster growing, more profitable, more global company. In this context, we now expect to increase our full year core sales growth rate from 1.8 percent in 2011 to between 2 and 3 percent in 2012; increase normalized operating margin by up to 20 basis points; increase normalized EPS by about 3 to 6 percent, or $1.63 to $1.69 per share; and deliver operating cash flow of $550 to $600 million.”
Fourth Quarter Executive Summary
| » | Fourth quarter 2011 net sales were $1.50 billion, an increase of 3.7 percent versus prior year results. Core sales also grew 3.7 percent. |
| » | Normalized diluted earnings per share increased 21.2 percent to $0.40 compared with $0.33 in the prior year period. |
| » | Operating cash flow was $281.5 million, an increase of 37.5 percent compared with the year-ago period. |
| » | The company reduced debt by $137.8 million and repurchased 1.5 million shares, at a cost of $21.7 million. |
1
| » | The company issued 2012 guidance for core sales growth in a range from 2 to 3 percent, normalized operating margin improvement of up to 20 basis points, normalized diluted earnings per share growth of about 3 to 6 percent, or $1.63 to $1.69, and operating cash flow of $550 to $600 million. |
Fourth Quarter 2011 Operating Results
Net sales in the fourth quarter were $1.50 billion, an increase of 3.7 percent over the prior year. Core sales growth, defined as sales excluding foreign currency translation, was also 3.7 percent. Strong performance from emerging markets, new product pipeline fill, as well as distribution and share gains in North America, were the primary growth drivers. Foreign currency had a nominal impact on net sales in the quarter, a significant change from the first three quarters’ cumulative positive 250 basis point impact.
Fourth quarter gross margin of 37.2 percent represented a slight decrease of 10 basis points versus the prior year as pricing and productivity largely offset the negative impact of input cost inflation and costs associated with operational issues at the Decor global business unit.
Normalized operating margin for the fourth quarter was 11.8 percent, up 150 basis points versus the prior year. The improvement in normalized operating margin was mainly driven by a reduction in SG&A expense. Brand building and other strategic SG&A spending, in absolute dollars, were essentially flat in the quarter, while structural SG&A decreased by approximately $9 million.
Fourth quarter operating income on a normalized basis was $176.8 million compared with $149.1 million in the prior year period. Fourth quarter normalized operating income excludes $49.4 million of restructuring and restructuring-related costs incurred in connection with the European Transformation Plan and Project Renewal and $1.9 million in incremental costs associated with the company’s CEO transition. In 2010, normalized operating income excluded $30.8 million in Project Acceleration restructuring costs and restructuring-related costs incurred in connection with the European Transformation Plan.
The normalized tax rate for the quarter was 23.0 percent compared with 20.8 percent in the prior year. The year-over-year change in tax rate was primarily driven by the geographical mix in earnings and certain discrete items in the prior year.
Normalized earnings were $0.40 per diluted share compared with prior year normalized results of $0.33 per diluted share. The improvement was attributable to the increase in sales and lower structural SG&A costs, partially offset by the impact of input cost inflation and a higher effective tax rate.
For the fourth quarter 2011, normalized diluted earnings per share exclude $0.12 per diluted share for restructuring and restructuring-related costs associated with the European Transformation Plan and Project Renewal, as well as the impact of a net loss from discontinued operations of $1.3 million, or less than $0.01 per diluted share. For the fourth quarter 2010, normalized diluted earnings per share exclude $0.08 per diluted share for restructuring and restructuring-related costs as well as the net income from discontinued operations of $2.3 million, or $0.01 per diluted share. (A reconciliation of the “as reported” results to “normalized” results is included below.)
2
Net income, as reported, was $80.4 million, or $0.27 per diluted share, for the fourth quarter. This compares with net income of $75.7 million, or $0.25 per diluted share, in the prior year.
The company generated operating cash of $281.5 million during the fourth quarter, compared with $204.7 million in the comparable period last year. The improvement was primarily related to a reduction in the company’s inventory position in the quarter. Capital expenditures were $71.7 million in the fourth quarter compared with $56.6 million in the prior year.
A reconciliation of the fourth quarter 2011 and last year’s results is as follows:
| Q4 2011 | Q4 2010 | |||
| Diluted earnings per share (as reported) |
$0.27 | $0.25 | ||
| Restructuring and restructuring-related costs |
$0.12 | $0.08 | ||
| Discontinued operations |
$0.00 | $(0.01) | ||
|
|
| |||
| “Normalized” EPS* |
$0.40 | $0.33 | ||
* totals may not add due to rounding
Fourth Quarter 2011 Operating Segment Results
The Home & Family segment’s net sales for the fourth quarter were $628.3 million, a 1.2 percent increase compared with the prior year quarter. Core sales in the segment increased 0.9 percent driven by a return to growth in Baby & Parenting and a strong performance by Culinary Lifestyles, offset by weak results in Décor. Operating income in the Home & Family segment was $70.7 million, or 11.3 percent of sales, compared with the 2010 fourth quarter income of $61.2 million, or 9.9 percent of sales. The profitability improvement was largely the result of lower structural SG&A costs.
The Office Products segment posted fourth quarter net sales of $439.1 million, a 3.7 percent increase over last year. Core sales growth was 3.8 percent with all businesses contributing to the improvement. The Office Products segment’s operating income was $72.1 million, or 16.4 percent of sales, as compared with $51.9 million, or 12.3 percent of sales, in the prior year. Pricing, productivity and lower structural SG&A costs more than offset input cost inflation in the quarter.
Fourth quarter net sales in the Tools, Hardware & Commercial Products segment were $427.8 million, a 7.7 percent improvement over the prior year. Core sales increased 8.0 percent driven by strong results from Commercial Products, Construction Tools & Accessories and Industrial Products & Services. Fourth quarter operating income was $56.8 million, or 13.3 percent of sales, compared with $57.4 million, or 14.4 percent of sales, in the prior year. SG&A expense increased over the prior year as the company invested to build capabilities and strengthen performance in faster growing emerging markets.
3
Full Year Results
Net sales for the year ended December 31, 2011 increased 3.6 percent to $5.86 billion, compared with $5.66 billion in the prior year. Core sales increased 1.8 percent for the full year.
Gross margin was 37.6 percent, a 40 basis point decline versus the prior year, primarily due to higher input cost inflation, partially offset by pricing and productivity.
Normalized earnings were $1.59 per diluted share compared with $1.50 per diluted share in the prior year. In 2011, normalized earnings exclude $1.03 per diluted share for impairment charges, primarily related to goodwill write-downs; $0.24 per diluted share for restructuring and restructuring-related costs associated with the European Transformation Plan and Project Renewal; $0.02 per diluted share related to the incremental costs associated with the company’s CEO transition; $0.01 per diluted share for a loss related to the retirement of convertible notes; and benefits of $0.17 per diluted share resulting from the reversal of certain tax contingencies due to the expiration of various statutes of limitation. In addition, the company recorded a net loss from discontinued operations of $9.4 million, or $0.03 per share, reflecting the income from discontinued operations and the loss on disposal of the hand torch and solder business, which has also been excluded from normalized earnings. In 2010, normalized earnings exclude $0.24 per diluted share for restructuring and restructuring-related costs; $0.10 per diluted share of dilution related to the conversion feature of the convertible notes issued in March 2009 and the impact of associated hedge transactions; $0.44 per diluted share in charges and other impacts associated with the Capital Structure Optimization Plan; a benefit of $0.21 reflecting the favorable resolution of a tax examination; $0.02 per diluted share reflecting the income from discontinued operations of the hand torch and solder business, which has been excluded from normalized earnings; and a benefit of $0.01 per diluted share related to hyperinflationary accounting for the company’s Venezuelan operations. (A reconciliation of the “as reported” results to “normalized” results is included below.)
Net income, as reported, was $125.2 million, or $0.42 per diluted share. This compares to $292.8 million, or $0.96 per diluted share, in the prior year.
The company generated operating cash flow of $561.3 million during 2011 compared with $582.6 million in the prior year. The year-over-year change is primarily driven by a decrease in accrued liabilities. Capital expenditures were $222.9 million, compared with $164.7 million in the prior year.
4
A reconciliation of the full year 2011 and last year’s results is as follows:
| FY 2011 | FY 2010 | |||
| Diluted earnings per share (as reported) |
$0.42 | $0.96 | ||
| Goodwill impairment charges |
$1.03 | $0.00 | ||
| Restructuring and restructuring-related costs |
$0.24 | $0.24 | ||
| Discontinued operations |
$0.03 | ($0.02) | ||
| CEO transition costs |
$0.02 | $0.00 | ||
| Convertible notes dilution |
$0.00 | $0.10 | ||
| Capital structure optimization plan |
$0.00 | $0.44 | ||
| Income tax benefits |
($0.17) | ($0.21) | ||
| Other items |
$0.01 | ($0.01) | ||
|
|
| |||
| “Normalized” EPS* |
$1.59 | $1.50 | ||
* totals may not add due to rounding
2012 Full Year Outlook
The company’s initial outlook for full year 2012 core sales growth is an increase of 2 to 3 percent, which excludes a projected negative impact on net sales of approximately 2 percentage points from currency.
The company expects 2012 normalized operating margin improvement of up to 20 basis points and 2012 normalized earnings per diluted share to be between $1.63 and $1.69.
The company’s 2012 normalized EPS expectation excludes between $110 and $130 million of restructuring and restructuring-related costs associated with the company’s European Transformation Plan and with Project Renewal. (A reconciliation of the “as reported” results to “normalized” results is included below.)
The company is on track to realize cumulative annualized net income improvement of $55 to $65 million related to the European Transformation Plan, the majority of which is reflected in the 2011 base. The Project Renewal annualized cost savings of approximately $90 to $100 million are expected to be realized by the first half of 2013 and are intended to fund increased investments to strengthen brand building and selling capabilities in markets around the world.
5
Operating cash flow is expected to be between $550 and $600 million for the full year, including approximately $110 to $120 million in restructuring and restructuring related cash payments. The company plans to fund capital expenditures of $200 to $225 million during the year.
A reconciliation of the 2012 earnings outlook is as follows:
| FY 2012 | ||||
| Diluted earnings per share |
$ | 1.34 to $1.40 | ||
| Restructuring and restructuring-related costs |
$
|
0.27 to $0.32
|
| |
|
|
|
|||
| “Normalized” EPS |
$ | 1.63 to $1.69 | ||
Conference Call
The company’s fourth quarter 2011 earnings conference call is scheduled for today, January 27, 2012, at 10:00 am ET. To listen to the webcast, use the link provided under Events & Presentations in the Investor Relations section of Newell Rubbermaid’s Web site at www.newellrubbermaid.com. The webcast will be available for replay for two weeks. A brief supporting slide presentation will be available prior to the call under Quarterly Earnings in the Investor Relations section on the company’s Web site.
Non-GAAP Financial Measures
This release contains non-GAAP financial measures within the meaning of Regulation G promulgated by the Securities and Exchange Commission. Included in this release is a reconciliation of these non-GAAP financial measures to the most directly comparable financial measures calculated in accordance with GAAP.
About Newell Rubbermaid
Newell Rubbermaid Inc., an S&P 500 company, is a global marketer of consumer and commercial products with 2011 sales of approximately $5.9 billion and a strong portfolio of leading brands, including Rubbermaid®, Sharpie®, Graco®, Calphalon®, Irwin®, Lenox®, Levolor®, Paper Mate®, Dymo®, Waterman®, Parker®, Goody®, Rubbermaid Commercial Products® and Aprica®.
This press release and additional information about Newell Rubbermaid are available on the company’s Web site, www.newellrubbermaid.com.
| Contacts: | ||
| Nancy O’Donnell | David Doolittle | |
| Vice President, Investor Relations | Vice President, Corporate Communications | |
| +1 (770) 418-7723 |
+1 (770) 418-7519 |
6
Caution Concerning Forward-Looking Statements
Statements in this press release that are not historical in nature constitute forward-looking statements. These forward-looking statements relate to information or assumptions about the effects of sales, income/(loss), earnings per share, operating income or gross margin improvements or declines, Project Acceleration, the European Transformation Plan, the Capital Structure Optimization Plan, Project Renewal, capital and other expenditures, cash flow, dividends, restructuring and restructuring-related costs, costs and cost savings, inflation or deflation, particularly with respect to commodities such as oil and resin, debt ratings, and management’s plans, projections and objectives for future operations and performance. These statements are accompanied by words such as “anticipate,” “expect,” “project,” “will,” “believe,” “estimate” and similar expressions. Actual results could differ materially from those expressed or implied in the forward-looking statements. Important factors that could cause actual results to differ materially from those suggested by the forward-looking statements include, but are not limited to, our dependence on the strength of retail, commercial and industrial sectors of the economy in light of the continuation or escalation of the global economic slowdown or regional sovereign debt issues; currency fluctuations; competition with other manufacturers and distributors of consumer products; major retailers’ strong bargaining power; changes in the prices of raw materials and sourced products and our ability to obtain raw materials and sourced products in a timely manner from suppliers; our ability to develop innovative new products and to develop, maintain and strengthen our end-user brands; our ability to expeditiously close facilities and move operations while managing foreign regulations and other impediments; our ability to implement successfully information technology solutions throughout our organization; our ability to improve productivity and streamline operations; changes to our credit ratings; significant increases in the funding obligations related to our pension plans due to declining asset values or otherwise; the imposition of tax liabilities greater than our provisions for such matters; the risks inherent in our foreign operations and those factors listed in the company’s latest quarterly report on Form 10-Q, and exhibit 99.1 thereto, filed with the Securities and Exchange Commission. Changes in such assumptions or factors could produce significantly different results. The information contained in this news release is as of the date indicated. The company assumes no obligation to update any forward-looking statements contained in this news release as a result of new information or future events or developments.
NWL-EA
7
Newell Rubbermaid Inc.
CONSOLIDATED STATEMENTS OF OPERATIONS (UNAUDITED)
(in millions, except per share data)
Reconciliation of “As Reported” Results to “Normalized” Results
| Three Months Ended December 31, | ||||||||||||||||||||||||||||
| 2011 | 2010 (2) | YOY % Change |
||||||||||||||||||||||||||
| As Reported |
Excluded Items (1) | Normalized | As Reported |
Excluded Items (3) | Normalized | |||||||||||||||||||||||
| Net sales |
$ | 1,495.2 | $ | — | $ | 1,495.2 | $ | 1,441.5 | $ | — | $ | 1,441.5 | 3.7 | % | ||||||||||||||
| Cost of products sold |
938.6 | — | 938.6 | 903.9 | — | 903.9 | ||||||||||||||||||||||
|
|
|
|
|
|
|
|
|
|
|
|
|
|||||||||||||||||
| GROSS MARGIN |
556.6 | — | 556.6 | 537.6 | — | 537.6 | 3.5 | % | ||||||||||||||||||||
| % of sales |
37.2 | % | 37.2 | % | 37.3 | % | 37.3 | % | ||||||||||||||||||||
| Selling, general & administrative expenses |
393.3 | (13.5 | ) | 379.8 | 395.2 | (6.7 | ) | 388.5 | (2.2 | )% | ||||||||||||||||||
| % of sales |
26.3 | % | 25.4 | % | 27.4 | % | 27.0 | % | ||||||||||||||||||||
| Impairment charges |
— | — | — | — | — | — | ||||||||||||||||||||||
| Restructuring costs |
37.8 | (37.8 | ) | — | 24.1 | (24.1 | ) | — | ||||||||||||||||||||
|
|
|
|
|
|
|
|
|
|
|
|
|
|||||||||||||||||
| OPERATING INCOME |
125.5 | 51.3 | 176.8 | 118.3 | 30.8 | 149.1 | 18.6 | % | ||||||||||||||||||||
| % of sales |
8.4 | % | 11.8 | % | 8.2 | % | 10.3 | % | ||||||||||||||||||||
| Nonoperating expenses: |
||||||||||||||||||||||||||||
| Interest expense, net |
21.2 | — | 21.2 | 22.9 | — | 22.9 | ||||||||||||||||||||||
| Loss on extinguishments of debt |
— | — | — | — | — | — | ||||||||||||||||||||||
| Other expense, net |
2.7 | — | 2.7 | 2.3 | — | 2.3 | ||||||||||||||||||||||
|
|
|
|
|
|
|
|
|
|
|
|
|
|||||||||||||||||
| 23.9 | — | 23.9 | 25.2 | — | 25.2 | (5.2 | )% | |||||||||||||||||||||
|
|
|
|
|
|
|
|
|
|
|
|
|
|||||||||||||||||
| INCOME BEFORE INCOME TAXES |
101.6 | 51.3 | 152.9 | 93.1 | 30.8 | 123.9 | 23.4 | % | ||||||||||||||||||||
| % of sales |
6.8 | % | 10.2 | % | 6.5 | % | 8.6 | % | ||||||||||||||||||||
| Income taxes |
19.9 | 15.2 | 35.1 | 19.7 | 6.1 | 25.8 | 36.0 | % | ||||||||||||||||||||
| Effective rate |
19.6 | % | 23.0 | % | 21.2 | % | 20.8 | % | ||||||||||||||||||||
|
|
|
|
|
|
|
|
|
|
|
|
|
|||||||||||||||||
| NET INCOME FROM CONTINUING OPERATIONS |
81.7 | 36.1 | 117.8 | 73.4 | 24.7 | 98.1 | 20.1 | % | ||||||||||||||||||||
| % of sales |
5.5 | % | 7.9 | % | 5.1 | % | 6.8 | % | ||||||||||||||||||||
| (Loss) income from discontinued operations, net of tax |
(1.3 | ) | 1.3 | — | 2.3 | (2.3 | ) | — | ||||||||||||||||||||
|
|
|
|
|
|
|
|
|
|
|
|
|
|||||||||||||||||
| NET INCOME |
$ | 80.4 | $ | 37.4 | $ | 117.8 | $ | 75.7 | $ | 22.4 | $ | 98.1 | 20.1 | % | ||||||||||||||
|
|
|
|
|
|
|
|
|
|
|
|
|
|||||||||||||||||
| 5.4 | % | 7.9 | % | 5.3 | % | 6.8 | % | |||||||||||||||||||||
| EARNINGS PER SHARE: |
||||||||||||||||||||||||||||
| Basic |
||||||||||||||||||||||||||||
| Income from continuing operations |
$ | 0.28 | $ | 0.12 | $ | 0.40 | $ | 0.25 | $ | 0.08 | $ | 0.33 | ||||||||||||||||
| (Loss) income from discontinued operations |
— | — | — | 0.01 | (0.01 | ) | — | |||||||||||||||||||||
| Net income |
$ | 0.28 | $ | 0.12 | $ | 0.40 | $ | 0.26 | $ | 0.07 | $ | 0.33 | ||||||||||||||||
| Diluted |
||||||||||||||||||||||||||||
| Income from continuing operations |
$ | 0.28 | $ | 0.12 | $ | 0.40 | $ | 0.25 | $ | 0.08 | $ | 0.33 | ||||||||||||||||
| (Loss) income from discontinued operations |
— | — | — | 0.01 | (0.01 | ) | — | |||||||||||||||||||||
| Net income |
$ | 0.27 | $ | 0.13 | $ | 0.40 | $ | 0.25 | $ | 0.08 | $ | 0.33 | ||||||||||||||||
| AVERAGE SHARES OUTSTANDING: |
||||||||||||||||||||||||||||
| Basic |
292.0 | 292.0 | 293.5 | 293.5 | ||||||||||||||||||||||||
| Diluted |
294.4 | 294.4 | 297.6 | 297.6 | ||||||||||||||||||||||||
| (1) | Items excluded from “normalized” results for 2011 consist of the net of tax impact of the following: $11.6 million of restructuring related costs and $37.8 million of restructuring costs incurred in connection with the European Transformation Plan and Project Renewal; $1.9 million of incremental SG&A costs resulting from the Company’s CEO transition during 2011; and a net loss of $1.3 million from discontinued operations. |
| (2) | 2010 results have been adjusted to reclassify the results of operations of the hand torch and solder business to discontinued operations. |
| (3) | Items excluded from “normalized” results for 2010 consist of the net of tax impact of $6.7 million of restructuring related costs incurred in connection with the European Transformation Plan and $24.1 million of Project Acceleration restructuring costs, including asset impairment charges and employee termination and other costs, net of tax. “Normalized” results for 2010 also exclude net earnings of $2.3 million relating to operations of the hand torch and solder business, which have been presented as discontinued operations. |
Newell Rubbermaid Inc.
CONSOLIDATED STATEMENTS OF OPERATIONS (UNAUDITED)
(in millions, except per share data)
Reconciliation of “As Reported” Results to “Normalized” Results
| Twelve Months Ended December 31, | ||||||||||||||||||||||||||||
| 2011(1) | 2010 (1) | YOY % Change |
||||||||||||||||||||||||||
| As Reported | Excluded Items (2) | Normalized | As Reported | Excluded Items (3) | Normalized | |||||||||||||||||||||||
| Net sales |
$ | 5,864.6 | $ | — | $ | 5,864.6 | $ | 5,658.2 | $ | — | $ | 5,658.2 | 3.6 | % | ||||||||||||||
| Cost of products sold |
3,659.4 | — | 3,659.4 | 3,509.5 | — | 3,509.5 | ||||||||||||||||||||||
|
|
|
|
|
|
|
|
|
|
|
|
|
|||||||||||||||||
| GROSS MARGIN |
2,205.2 | — | 2,205.2 | 2,148.7 | — | 2,148.7 | 2.6 | % | ||||||||||||||||||||
| % of sales |
37.6 | % | 37.6 | % | 38.0 | % | 38.0 | % | ||||||||||||||||||||
| Selling, general & administrative expenses |
1,515.3 | (43.7 | ) | 1,471.6 | 1,447.8 | (15.2 | ) | 1,432.6 | 2.7 | % | ||||||||||||||||||
| % of sales |
25.8 | % | 25.1 | % | 25.6 | % | 25.3 | % | ||||||||||||||||||||
| Impairment charges |
382.6 | (382.6 | ) | — | — | — | — | |||||||||||||||||||||
| Restructuring costs |
50.1 | (50.1 | ) | — | 77.4 | (77.4 | ) | — | ||||||||||||||||||||
|
|
|
|
|
|
|
|
|
|
|
|
|
|||||||||||||||||
| OPERATING INCOME |
257.2 | 476.4 | 733.6 | 623.5 | 92.6 | 716.1 | 2.4 | % | ||||||||||||||||||||
| % of sales |
4.4 | % | 12.5 | % | 11.0 | % | 12.7 | % | ||||||||||||||||||||
| Nonoperating expenses: |
||||||||||||||||||||||||||||
| Interest expense, net |
86.2 | — | 86.2 | 118.4 | — | 118.4 | ||||||||||||||||||||||
| Loss related to extinguishments of debt |
4.8 | (4.8 | ) | — | 218.6 | (218.6 | ) | — | ||||||||||||||||||||
| Other expense (income), net |
13.7 | — | 13.7 | (7.3 | ) | 5.6 | (1.7 | ) | ||||||||||||||||||||
|
|
|
|
|
|
|
|
|
|
|
|
|
|||||||||||||||||
| 104.7 | (4.8 | ) | 99.9 | 329.7 | (213.0 | ) | 116.7 | (14.4 | )% | |||||||||||||||||||
|
|
|
|
|
|
|
|
|
|
|
|
|
|||||||||||||||||
| INCOME BEFORE INCOME TAXES |
152.5 | 481.2 | 633.7 | 293.8 | 305.6 | 599.4 | 5.7 | % | ||||||||||||||||||||
| % of sales |
2.6 | % | 10.8 | % | 5.2 | % | 10.6 | % | ||||||||||||||||||||
| Income taxes |
17.9 | 144.9 | 162.8 | 5.6 | 162.1 | 167.7 | (2.9 | )% | ||||||||||||||||||||
| Effective rate |
11.7 | % | 25.7 | % | 1.9 | % | 28.0 | % | ||||||||||||||||||||
|
|
|
|
|
|
|
|
|
|
|
|
|
|||||||||||||||||
| NET INCOME FROM CONTINUING OPERATIONS |
134.6 | 336.3 | 470.9 | 288.2 | 143.5 | 431.7 | 9.1 | % | ||||||||||||||||||||
| % of sales |
2.3 | % | 8.0 | % | 5.1 | % | 7.6 | % | ||||||||||||||||||||
| (Loss) income from discontinued operations, net of tax |
(9.4 | ) | 9.4 | — | 4.6 | (4.6 | ) | — | ||||||||||||||||||||
|
|
|
|
|
|
|
|
|
|
|
|
|
|||||||||||||||||
| NET INCOME |
$ | 125.2 | $ | 345.7 | $ | 470.9 | $ | 292.8 | $ | 138.9 | $ | 431.7 | 9.1 | % | ||||||||||||||
|
|
|
|
|
|
|
|
|
|
|
|
|
|||||||||||||||||
| 2.1 | % | 8.0 | % | 5.2 | % | 7.6 | % | |||||||||||||||||||||
| EARNINGS PER SHARE: |
||||||||||||||||||||||||||||
| Basic |
||||||||||||||||||||||||||||
| Income from continuing operations |
$ | 0.46 | $ | 1.14 | $ | 1.60 | $ | 1.02 | $ | 0.50 | $ | 1.52 | ||||||||||||||||
| (Loss) income from discontinued operations |
(0.03 | ) | 0.03 | — | 0.02 | (0.02 | ) | — | ||||||||||||||||||||
| Net Income |
$ | 0.43 | $ | 1.17 | $ | 1.60 | $ | 1.04 | $ | 0.48 | $ | 1.52 | ||||||||||||||||
| Diluted |
||||||||||||||||||||||||||||
| Income from continuing operations |
$ | 0.45 | $ | 1.14 | $ | 1.59 | $ | 0.94 | $ | 0.56 | $ | 1.50 | ||||||||||||||||
| (Loss) income from discontinued operations |
(0.03 | ) | 0.03 | — | 0.02 | (0.02 | ) | — | ||||||||||||||||||||
| Net Income |
$ | 0.42 | $ | 1.17 | $ | 1.59 | $ | 0.96 | $ | 0.54 | $ | 1.50 | ||||||||||||||||
| AVERAGE SHARES OUTSTANDING: |
||||||||||||||||||||||||||||
| Basic |
293.6 | 293.6 | 282.4 | 284.4 | ||||||||||||||||||||||||
| Diluted |
296.2 | 296.2 | 305.4 | 287.3 | ||||||||||||||||||||||||
| (1) | 2011 and 2010 results have been adjusted to reclassify the results of operations of the hand torch and solder business to discontinued operations. |
| (2) | Items excluded from “normalized” results for 2011 consist of the net of tax impact of the following: $37.4 million of restructuring related costs and $50.1 million of restructuring costs incurred in connection with the European Transformation Plan and Project Renewal; $382.6 million of asset impairment charges, primarily related to the impairment of goodwill for the Baby & Parenting and Hardware GBUs; $6.3 million of incremental SG&A costs resulting from the Company’s CEO transition during 2011; $4.8 million of debt extinguishment costs incurred to exchange substantially all of the remaining convertible notes issued during March 2009; as well as $49.0 million of income tax benefits primarily resulting from the reduction of unrecognized tax benefits for items for which the statute of limitations expired. “Normalized” results for 2011 also exclude a net loss of $9.4 million from discontinued operations, primarily resulting from income from operations and loss on disposal of the hand torch and solder business. |
| (3) | Items excluded from “normalized” results for 2010 consist of the net of tax impact of the following: $15.2 million of restructuring related costs incurred in connection with the European Transformation Plan; $77.4 million of Project Acceleration restructuring costs, including asset impairment charges and employee termination and other costs; $218.6 million in charges incurred to retire outstanding debt under the Capital Structure Optimization Plan; and a $5.6 million gain resulting from hyperinflationary accounting for the Company’s Venezuelan operations. Additionally, “normalized” results for 2010 exclude $63.6 million of non-recurring income tax benefits resulting from settlements with tax authorities, share impacts relating to the execution of the Capital Structure Optimization Plan, the dilutive impact of the conversion feature of the convertible notes and the associated hedge transactions for the period outstanding during 2010 and net earnings of $4.6 million relating to operations of the hand torch and solder business, which have been presented as discontinued operations. |
Newell Rubbermaid Inc.
CONSOLIDATED BALANCE SHEETS (UNAUDITED)
(in millions)
| December 31, 2011 |
December 31, 2010 |
|||||||
| Assets: |
||||||||
| Cash and cash equivalents |
$ | 170.2 | $ | 139.6 | ||||
| Accounts receivable, net |
1,002.0 | 997.9 | ||||||
| Inventories, net |
699.9 | 701.6 | ||||||
| Deferred income taxes |
130.7 | 179.2 | ||||||
| Prepaid expenses and other |
145.2 | 113.7 | ||||||
|
|
|
|
|
|||||
| Total Current Assets |
2,148.0 | 2,132.0 | ||||||
| Property, plant and equipment, net |
551.4 | 529.3 | ||||||
| Goodwill |
2,366.0 | 2,749.5 | ||||||
| Other intangible assets, net |
666.1 | 648.3 | ||||||
| Deferred income taxes |
120.2 | 38.6 | ||||||
| Other assets |
309.2 | 307.6 | ||||||
|
|
|
|
|
|||||
| Total Assets |
$ | 6,160.9 | $ | 6,405.3 | ||||
|
|
|
|
|
|||||
| Liabilities and Stockholders’ Equity: |
||||||||
| Accounts payable |
$ | 468.5 | $ | 472.5 | ||||
| Accrued compensation |
131.4 | 190.2 | ||||||
| Other accrued liabilities |
693.5 | 698.2 | ||||||
| Short-term debt |
103.6 | 135.0 | ||||||
| Current portion of long-term debt |
263.9 | 170.0 | ||||||
|
|
|
|
|
|||||
| Total Current Liabilities |
1,660.9 | 1,665.9 | ||||||
| Long-term debt |
1,809.3 | 2,063.9 | ||||||
| Other noncurrent liabilities |
838.1 | 770.0 | ||||||
| Stockholders’ Equity - Parent |
1,849.1 | 1,902.0 | ||||||
| Stockholders’ Equity - Noncontrolling Interests |
3.5 | 3.5 | ||||||
|
|
|
|
|
|||||
| Total Stockholders’ Equity |
1,852.6 | 1,905.5 | ||||||
|
|
|
|
|
|||||
| Total Liabilities and Stockholders’ Equity |
$ | 6,160.9 | $ | 6,405.3 | ||||
|
|
|
|
|
|||||
Newell Rubbermaid Inc.
CONSOLIDATED STATEMENTS OF CASH FLOW (UNAUDITED)
(in millions)
| Twelve Months Ended December 31, | ||||||||
| 2011 | 2010 | |||||||
| Operating Activities: |
||||||||
| Net income |
$ | 125.2 | $ | 292.8 | ||||
| Adjustments to reconcile net income to net cash provided by operating activities: |
||||||||
| Depreciation and amortization |
161.6 | 172.3 | ||||||
| Impairment charges |
382.6 | — | ||||||
| Loss on disposal of discontinued operations |
13.9 | — | ||||||
| Loss on extinguishments of debt |
4.8 | 218.6 | ||||||
| Deferred income taxes |
(4.8 | ) | (6.1 | ) | ||||
| Non-cash restructuring costs |
7.0 | 6.3 | ||||||
| Stock-based compensation expense |
43.0 | 36.5 | ||||||
| Other |
11.7 | 21.9 | ||||||
| Changes in operating assets and liabilities, excluding the effects of acquisitions and divestitures: |
||||||||
| Accounts receivable |
(17.6 | ) | (103.6 | ) | ||||
| Inventories |
(21.5 | ) | (14.5 | ) | ||||
| Accounts payable |
3.3 | 39.1 | ||||||
| Accrued liabilities and other |
(147.9 | ) | (80.7 | ) | ||||
|
|
|
|
|
|||||
| Net cash provided by operating activities |
$ | 561.3 | $ | 582.6 | ||||
| Investing Activities: |
||||||||
| Acquisitions and acquisition-related activity |
$ | (20.0 | ) | $ | (1.5 | ) | ||
| Capital expenditures |
(222.9 | ) | (164.7 | ) | ||||
| Proceeds from sales of businesses and noncurrent assets |
44.3 | 16.8 | ||||||
| Other |
(7.8 | ) | (4.0 | ) | ||||
|
|
|
|
|
|||||
| Net cash used in investing activities |
$ | (206.4 | ) | $ | (153.4 | ) | ||
| Financing Activities: |
||||||||
| Net short-term borrowings |
$ | (34.4 | ) | $ | 133.6 | |||
| Proceeds from issuance of debt, net of debt issuance costs |
3.3 | 547.3 | ||||||
| Payments on and for the settlement of notes payable and debt |
(151.0 | ) | (298.4 | ) | ||||
| Payments for settlement of warrants |
— | 369.5 | ||||||
| Proceeds from settlement of call options |
— | (710.8 | ) | |||||
| Cash consideration paid to exchange convertible notes |
(3.1 | ) | (53.0 | ) | ||||
| Repurchase of shares of common stock |
(46.1 | ) | (500.1 | ) | ||||
| Cash dividends |
(84.9 | ) | (55.4 | ) | ||||
| Other, net |
(8.4 | ) | (4.6 | ) | ||||
|
|
|
|
|
|||||
| Net cash used in financing activities |
$ | (324.6 | ) | $ | (571.9 | ) | ||
| Currency rate effect on cash and cash equivalents |
$ | 0.3 | $ | 4.0 | ||||
|
|
|
|
|
|||||
| Increase (decrease) in cash and cash equivalents |
$ | 30.6 | $ | (138.7 | ) | |||
| Cash and cash equivalents at beginning of year |
139.6 | 278.3 | ||||||
|
|
|
|
|
|||||
| Cash and cash equivalents at end of year |
$ | 170.2 | $ | 139.6 | ||||
|
|
|
|
|
|||||
Newell Rubbermaid Inc.
Financial Worksheet
(In Millions)
| 2011 (1) | 2010 (1) | |||||||||||||||||||||||||||||||||||||||||||||||||||||||
| Reconciliation (2) | Reconciliation (2) | Year-over-year changes | ||||||||||||||||||||||||||||||||||||||||||||||||||||||
| Net Sales | Reported OI |
Excluded Items |
Normalized OI |
Operating Margin |
Net Sales | Reported OI |
Excluded Items |
Normalized OI |
Operating Margin |
Net Sales | Normalized OI | |||||||||||||||||||||||||||||||||||||||||||||
| $ | % | $ | % | |||||||||||||||||||||||||||||||||||||||||||||||||||||
| Q1: |
||||||||||||||||||||||||||||||||||||||||||||||||||||||||
| Home & Family |
$ | 534.1 | $ | 56.6 | $ | — | $ | 56.6 | 10.6 | % | $ | 556.9 | $ | 68.8 | $ | — | $ | 68.8 | 12.4 | % | $ | (22.8 | ) | (4.1 | )% | $ | (12.2 | ) | (17.7 | )% | ||||||||||||||||||||||||||
| Office Products |
364.9 | 54.9 | — | 54.9 | 15.0 | % | 351.6 | 47.3 | — | 47.3 | 13.5 | % | 13.3 | 3.8 | % | 7.6 | 16.1 | % | ||||||||||||||||||||||||||||||||||||||
| Tools, Hardware & Commercial Products |
375.2 | 46.8 | — | 46.8 | 12.5 | % | 370.9 | 49.8 | — | 49.8 | 13.4 | % | 4.3 | 1.2 | % | (3.0 | ) | (6.0 | )% | |||||||||||||||||||||||||||||||||||||
| Restructuring Costs |
— | (5.8 | ) | 5.8 | — | — | (16.0 | ) | 16.0 | — | ||||||||||||||||||||||||||||||||||||||||||||||
| Corporate |
— | (24.5 | ) | 5.3 | (19.2 | ) | — | (21.6 | ) | — | (21.6 | ) | 2.4 | 11.1 | % | |||||||||||||||||||||||||||||||||||||||||
|
|
|
|
|
|
|
|
|
|
|
|
|
|
|
|
|
|
|
|
|
|||||||||||||||||||||||||||||||||||||
| Total |
$ | 1,274.2 | $ | 128.0 | $ | 11.1 | $ | 139.1 | 10.9 | % | $ | 1,279.4 | $ | 128.3 | $ | 16.0 | $ | 144.3 | 11.3 | % | $ | (5.2 | ) | (0.4 | )% | $ | (5.2 | ) | (3.6 | )% | ||||||||||||||||||||||||||
|
|
|
|
|
|
|
|
|
|
|
|
|
|
|
|
|
|
|
|
|
|||||||||||||||||||||||||||||||||||||
| 2011 (1) | 2010 (1) | |||||||||||||||||||||||||||||||||||||||||||||||||||||||
| Reconciliation (2) | Reconciliation (2) | Year-over-year changes | ||||||||||||||||||||||||||||||||||||||||||||||||||||||
| Net Sales | Reported OI |
Excluded Items |
Normalized OI |
Operating Margin |
Net Sales | Reported OI |
Excluded Items |
Normalized OI |
Operating Margin |
Net Sales | Normalized OI | |||||||||||||||||||||||||||||||||||||||||||||
| $ | % | $ | % | |||||||||||||||||||||||||||||||||||||||||||||||||||||
| Q2: |
||||||||||||||||||||||||||||||||||||||||||||||||||||||||
| Home & Family |
$ | 601.4 | $ | 64.6 | $ | — | $ | 64.6 | 10.7 | % | $ | 592.0 | $ | 75.6 | $ | — | $ | 75.6 | 12.8 | % | $ | 9.4 | 1.6 | % | $ | (11.0 | ) | (14.6 | )% | |||||||||||||||||||||||||||
| Office Products |
499.9 | 96.3 | — | 96.3 | 19.3 | % | 483.5 | 99.4 | — | 99.4 | 20.6 | % | 16.4 | 3.4 | % | (3.1 | ) | (3.1 | )% | |||||||||||||||||||||||||||||||||||||
| Tools, Hardware & Commercial Products |
444.0 | 65.2 | — | 65.2 | 14.7 | % | 396.3 | 68.8 | — | 68.8 | 17.4 | % | 47.7 | 12.0 | % | (3.6 | ) | (5.2 | )% | |||||||||||||||||||||||||||||||||||||
| Restructuring Costs |
— | (1.0 | ) | 1.0 | — | — | (21.1 | ) | 21.1 | — | ||||||||||||||||||||||||||||||||||||||||||||||
| Corporate |
— | (29.2 | ) | 9.0 | (20.2 | ) | — | (20.4 | ) | 1.6 | (18.8 | ) | (1.4 | ) | (7.4 | )% | ||||||||||||||||||||||||||||||||||||||||
|
|
|
|
|
|
|
|
|
|
|
|
|
|
|
|
|
|
|
|
|
|||||||||||||||||||||||||||||||||||||
| Total |
$ | 1,545.3 | $ | 195.9 | $ | 10.0 | $ | 205.9 | 13.3 | % | $ | 1,471.8 | $ | 202.3 | $ | 22.7 | $ | 225.0 | 15.3 | % | $ | 73.5 | 5.0 | % | $ | (19.1 | ) | (8.5 | )% | |||||||||||||||||||||||||||
|
|
|
|
|
|
|
|
|
|
|
|
|
|
|
|
|
|
|
|
|
|||||||||||||||||||||||||||||||||||||
| 2011 | 2010 (1) | |||||||||||||||||||||||||||||||||||||||||||||||||||||||
| Reconciliation (2,3) | Reconciliation (2) | Year-over-year changes | ||||||||||||||||||||||||||||||||||||||||||||||||||||||
| Net Sales | Reported OI |
Excluded Items |
Normalized OI |
Operating Margin |
Net Sales | Reported OI |
Excluded Items |
Normalized OI |
Operating Margin |
Net Sales | Normalized OI | |||||||||||||||||||||||||||||||||||||||||||||
| $ | % | $ | % | |||||||||||||||||||||||||||||||||||||||||||||||||||||
| Q3: | ||||||||||||||||||||||||||||||||||||||||||||||||||||||||
| Home & Family |
$ | 626.7 | 88.6 | $ | — | $ | 88.6 | 14.1 | % | $ | 608.8 | 76.2 | $ | — | $ | 76.2 | 12.5 | % | $ | 17.9 | 2.9 | % | $ | 12.4 | 16.3 | % | ||||||||||||||||||||||||||||||
| Office Products |
474.9 | 76.9 | — | 76.9 | 16.2 | % | 450.3 | 70.8 | — | 70.8 | 15.7 | % | 24.6 | 5.5 | % | 6.1 | 8.6 | % | ||||||||||||||||||||||||||||||||||||||
| Tools, Hardware & Commercial Products |
448.3 | 65.5 | — | 65.5 | 14.6 | % | 406.4 | 70.6 | — | 70.6 | 17.4 | % | 41.9 | 10.3 | % | (5.1 | ) | (7.2 | )% | |||||||||||||||||||||||||||||||||||||
| Impairment Charges |
— | (382.6 | ) | 382.6 | — | — | — | — | — | |||||||||||||||||||||||||||||||||||||||||||||||
| Restructuring Costs |
— | (5.5 | ) | 5.5 | — | — | (16.2 | ) | 16.2 | — | ||||||||||||||||||||||||||||||||||||||||||||||
| Corporate |
— | (35.1 | ) | 15.9 | (19.2 | ) | — | (26.8 | ) | 6.9 | (19.9 | ) | 0.7 | 3.5 | % | |||||||||||||||||||||||||||||||||||||||||
|
|
|
|
|
|
|
|
|
|
|
|
|
|
|
|
|
|
|
|
|
|||||||||||||||||||||||||||||||||||||
| Total |
$ | 1,549.9 | $ | (192.2 | ) | $ | 404.0 | $ | 211.8 | 13.7 | % | $ | 1,465.5 | $ | 174.6 | $ | 23.1 | $ | 197.7 | 13.5 | % | $ | 84.4 | 5.8 | % | $ | 14.1 | 7.1 | % | |||||||||||||||||||||||||||
|
|
|
|
|
|
|
|
|
|
|
|
|
|
|
|
|
|
|
|
|
|||||||||||||||||||||||||||||||||||||
| 2011 | 2010 (1) | |||||||||||||||||||||||||||||||||||||||||||||||||||||||
| Reconciliation (2) | Reconciliation (2) | Year-over-year changes | ||||||||||||||||||||||||||||||||||||||||||||||||||||||
| Net Sales | Reported OI |
Excluded Items |
Normalized OI |
Operating Margin |
Net Sales | Reported OI |
Excluded Items |
Normalized OI |
Operating Margin |
Net Sales | Normalized OI | |||||||||||||||||||||||||||||||||||||||||||||
| $ | % | $ | % | |||||||||||||||||||||||||||||||||||||||||||||||||||||
| Q4: | ||||||||||||||||||||||||||||||||||||||||||||||||||||||||
| Home & Family |
$ | 628.3 | $ | 70.7 | $ | — | $ | 70.7 | 11.3 | % | $ | 620.7 | $ | 61.2 | $ | 61.2 | 9.9 | % | $ | 7.6 | 1.2 | % | $ | 9.5 | 15.5 | % | ||||||||||||||||||||||||||||||
| Office Products |
439.1 | 72.1 | — | 72.1 | 16.4 | % | 423.5 | 51.9 | 51.9 | 12.3 | % | 15.6 | 3.7 | % | 20.2 | 38.9 | % | |||||||||||||||||||||||||||||||||||||||
| Tools, Hardware & Commercial Products |
427.8 | 56.8 | — | 56.8 | 13.3 | % | 397.3 | 57.4 | 57.4 | 14.4 | % | 30.5 | 7.7 | % | (0.6 | ) | (1.0 | )% | ||||||||||||||||||||||||||||||||||||||
| Restructuring Costs |
(37.8 | ) | 37.8 | — | (24.1 | ) | 24.1 | — | ||||||||||||||||||||||||||||||||||||||||||||||||
| Corporate |
(36.3 | ) | 13.5 | (22.8 | ) | (28.1 | ) | 6.7 | (21.4 | ) | (1.4 | ) | (6.5 | )% | ||||||||||||||||||||||||||||||||||||||||||
|
|
|
|
|
|
|
|
|
|
|
|
|
|
|
|
|
|
|
|
|
|||||||||||||||||||||||||||||||||||||
| Total |
$ | 1,495.2 | $ | 125.5 | $ | 51.3 | $ | 176.8 | 11.8 | % | $ | 1,441.5 | $ | 118.3 | $ | 30.8 | $ | 149.1 | 10.3 | % | $ | 53.7 | 3.7 | % | $ | 27.7 | 18.6 | % | ||||||||||||||||||||||||||||
|
|
|
|
|
|
|
|
|
|
|
|
|
|
|
|
|
|
|
|
|
|||||||||||||||||||||||||||||||||||||
| 2011 (1) | 2010 (1) | |||||||||||||||||||||||||||||||||||||||||||||||||||||||
| Reconciliation (2,3) | Reconciliation (2) | Year-over-year changes | ||||||||||||||||||||||||||||||||||||||||||||||||||||||
| Net Sales | Reported OI |
Excluded Items |
Normalized OI |
Operating Margin |
Net Sales | Reported OI |
Excluded Items |
Normalized OI |
Operating Margin |
Net Sales | Normalized OI | |||||||||||||||||||||||||||||||||||||||||||||
| $ | % | $ | % | |||||||||||||||||||||||||||||||||||||||||||||||||||||
| YTD: | ||||||||||||||||||||||||||||||||||||||||||||||||||||||||
| Home & Family |
$ | 2,390.5 | $ | 280.5 | $ | — | $ | 280.5 | 11.7 | % | $ | 2,378.4 | $ | 281.8 | $ | — | $ | 281.8 | 11.8 | % | $ | 12.1 | 0.5 | % | $ | (1.3 | ) | (0.5 | )% | |||||||||||||||||||||||||||
| Office Products |
1,778.8 | 300.2 | — | 300.2 | 16.9 | % | 1,708.9 | 269.4 | — | 269.4 | 15.8 | % | 69.9 | 4.1 | % | 30.8 | 11.4 | % | ||||||||||||||||||||||||||||||||||||||
| Tools, Hardware & Commercial Products |
1,695.3 | 234.3 | — | 234.3 | 13.8 | % | 1,570.9 | 246.6 | — | 246.6 | 15.7 | % | 124.4 | 7.9 | % | (12.3 | ) | (5.0 | )% | |||||||||||||||||||||||||||||||||||||
| Impairment Charges |
— | (382.6 | ) | 382.6 | — | — | — | — | — | |||||||||||||||||||||||||||||||||||||||||||||||
| Restructuring Costs |
— | (50.1 | ) | 50.1 | — | — | (77.4 | ) | 77.4 | — | ||||||||||||||||||||||||||||||||||||||||||||||
| Corporate |
— | (125.1 | ) | 43.7 | (81.4 | ) | — | (96.9 | ) | 15.2 | (81.7 | ) | 0.3 | 0.4 | % | |||||||||||||||||||||||||||||||||||||||||
|
|
|
|
|
|
|
|
|
|
|
|
|
|
|
|
|
|
|
|
|
|||||||||||||||||||||||||||||||||||||
| Total |
$ | 5,864.6 | $ | 257.2 | $ | 476.4 | $ | 733.6 | 12.5 | % | $ | 5,658.2 | $ | 623.5 | $ | 92.6 | $ | 716.1 | 12.7 | % | $ | 206.4 | 3.6 | % | $ | 17.5 | 2.4 | % | ||||||||||||||||||||||||||||
|
|
|
|
|
|
|
|
|
|
|
|
|
|
|
|
|
|
|
|
|
|||||||||||||||||||||||||||||||||||||
| (1) | 2011 and 2010 results have been adjusted to reclassify the results of operations of the hand torch and solder business to discontinued operations. |
| (2) | Excluded items consist of restructuring and restructuring related costs. Additionally, “normalized” OI for Q3 2011 and Q4 2011 excludes incremental SG&A costs resulting from the Company’s CEO transition during 2011. |
| (3) | “Normalized” OI for the three months ended September 30, 2011 and the twelve months ended December 31, 2011 also exclude impairment charges relating primarily to the impairment of goodwill for the Baby & Parenting and Hardware GBUs. |
Newell Rubbermaid Inc.
Calculation of Free Cash Flow (1)
| Three Months Ended December 31, | ||||||||
| 2011 | 2010 | |||||||
| Free Cash Flow (in millions): |
||||||||
| Net cash provided by operating activities |
$ | 281.5 | $ | 204.7 | ||||
| Capital expenditures |
(71.7 | ) | (56.6 | ) | ||||
|
|
|
|
|
|||||
| Free Cash Flow |
$ | 209.8 | $ | 148.1 | ||||
|
|
|
|
|
|||||
| Twelve Months Ended December 31, | ||||||||
| 2011 | 2010 | |||||||
| Free Cash Flow (in millions): |
||||||||
| Net cash provided by operating activities |
$ | 561.3 | $ | 582.6 | ||||
| Capital expenditures |
(222.9 | ) | (164.7 | ) | ||||
|
|
|
|
|
|||||
| Free Cash Flow |
$ | 338.4 | $ | 417.9 | ||||
|
|
|
|
|
|||||
| (1) | Free Cash Flow is defined as cash flow provided by operating activities less capital expenditures. |
Newell Rubbermaid Inc.
Three Months Ended December 31, 2011
In Millions
Currency Analysis
| 2011 | 2010 (1) | Year-Over-Year Increase (Decrease) | ||||||||||||||||||||||||||
| Sales as Reported |
Currency Impact |
Adjusted Sales |
Sales as Reported |
Excluding Currency |
Including Currency |
Currency Impact |
||||||||||||||||||||||
| By Segment | ||||||||||||||||||||||||||||
| Home & Family |
$ | 628.3 | $ | (2.1 | ) | $ | 626.2 | $ | 620.7 | 0.9 | % | 1.2 | % | 0.3 | % | |||||||||||||
| Office Products |
439.1 | 0.3 | 439.4 | 423.5 | 3.8 | % | 3.7 | % | (0.1 | )% | ||||||||||||||||||
| Tools, Hardware & Commercial Products |
427.8 | 1.2 | 429.0 | 397.3 | 8.0 | % | 7.7 | % | (0.3 | )% | ||||||||||||||||||
|
|
|
|
|
|
|
|
|
|||||||||||||||||||||
| Total Company |
$ | 1,495.2 | $ | (0.6 | ) | $ | 1,494.6 | $ | 1,441.5 | 3.7 | % | 3.7 | % | 0.0 | % | |||||||||||||
|
|
|
|
|
|
|
|
|
|||||||||||||||||||||
| By Geography | ||||||||||||||||||||||||||||
| United States |
$ | 1,000.6 | $ | — | $ | 1,000.6 | $ | 958.2 | 4.4 | % | 4.4 | % | 0.0 | % | ||||||||||||||
| Canada |
91.6 | (0.4 | ) | 91.2 | 94.0 | (3.0 | )% | (2.6 | )% | 0.4 | % | |||||||||||||||||
|
|
|
|
|
|
|
|
|
|||||||||||||||||||||
| Total North America |
1,092.2 | (0.4 | ) | 1,091.8 | 1,052.2 | 3.8 | % | 3.8 | % | 0.0 | % | |||||||||||||||||
| Europe, Middle East and Africa |
198.1 | 0.8 | 198.9 | 205.4 | (3.2 | )% | (3.6 | )% | (0.4 | )% | ||||||||||||||||||
| Latin America |
80.2 | 3.9 | 84.1 | 75.6 | 11.2 | % | 6.1 | % | (5.1 | )% | ||||||||||||||||||
| Asia Pacific |
124.7 | (4.9 | ) | 119.8 | 108.3 | 10.6 | % | 15.1 | % | 4.5 | % | |||||||||||||||||
|
|
|
|
|
|
|
|
|
|||||||||||||||||||||
| Total International |
403.0 | (0.2 | ) | 402.8 | 389.3 | 3.5 | % | 3.5 | % | 0.1 | % | |||||||||||||||||
|
|
|
|
|
|
|
|
|
|||||||||||||||||||||
| Total Company |
$ | 1,495.2 | $ | (0.6 | ) | $ | 1,494.6 | $ | 1,441.5 | 3.7 | % | 3.7 | % | 0.0 | % | |||||||||||||
|
|
|
|
|
|
|
|
|
|||||||||||||||||||||
| (1)- | 2010 results have been adjusted to reclassify the results of operations of the hand torch and solder business to discontinued operations. |
Newell Rubbermaid Inc.
Twelve Months Ended December 31, 2011
In Millions
Currency Analysis
| 2011 (1) | 2010 (1) | Year-Over-Year (Decrease) Increase | ||||||||||||||||||||||||||
| Sales as Reported |
Currency Impact |
Adjusted Sales |
Sales as Reported |
Excluding Currency |
Including Currency |
Currency Impact |
||||||||||||||||||||||
| By Segment | ||||||||||||||||||||||||||||
| Home & Family |
$ | 2,390.5 | $ | (30.5 | ) | $ | 2,360.0 | $ | 2,378.4 | (0.8 | )% | 0.5 | % | 1.3 | % | |||||||||||||
| Office Products |
1,778.8 | (44.6 | ) | 1,734.2 | 1,708.9 | 1.5 | % | 4.1 | % | 2.6 | % | |||||||||||||||||
| Tools, Hardware & Commercial Products |
1,695.3 | (29.3 | ) | 1,666.0 | 1,570.9 | 6.1 | % | 7.9 | % | 1.9 | % | |||||||||||||||||
|
|
|
|
|
|
|
|
|
|||||||||||||||||||||
| Total Company |
$ | 5,864.6 | $ | (104.4 | ) | $ | 5,760.2 | $ | 5,658.2 | 1.8 | % | 3.6 | % | 1.8 | % | |||||||||||||
|
|
|
|
|
|
|
|
|
|||||||||||||||||||||
| By Geography | ||||||||||||||||||||||||||||
| United States |
$ | 3,915.7 | $ | — | $ | 3,915.7 | $ | 3,870.3 | 1.2 | % | 1.2 | % | 0.0 | % | ||||||||||||||
| Canada |
376.3 | (18.8 | ) | 357.5 | 351.0 | 1.9 | % | 7.2 | % | 5.4 | % | |||||||||||||||||
|
|
|
|
|
|
|
|
|
|||||||||||||||||||||
| Total North America |
4,292.0 | (18.8 | ) | 4,273.2 | 4,221.3 | 1.2 | % | 1.7 | % | 0.4 | % | |||||||||||||||||
| Europe, Middle East and Africa |
815.3 | (41.7 | ) | 773.6 | 800.5 | (3.4 | )% | 1.8 | % | 5.2 | % | |||||||||||||||||
| Latin America |
318.6 | (11.7 | ) | 306.9 | 267.0 | 14.9 | % | 19.3 | % | 4.4 | % | |||||||||||||||||
| Asia Pacific |
438.7 | (32.2 | ) | 406.5 | 369.4 | 10.0 | % | 18.8 | % | 8.7 | % | |||||||||||||||||
|
|
|
|
|
|
|
|
|
|||||||||||||||||||||
| Total International |
1,572.6 | (85.6 | ) | 1,487.0 | 1,436.9 | 3.5 | % | 9.4 | % | 6.0 | % | |||||||||||||||||
|
|
|
|
|
|
|
|
|
|||||||||||||||||||||
| Total Company |
$ | 5,864.6 | $ | (104.4 | ) | $ | 5,760.2 | $ | 5,658.2 | 1.8 | % | 3.6 | % | 1.8 | % | |||||||||||||
|
|
|
|
|
|
|
|
|
|||||||||||||||||||||
| (1)- | 2011 and 2010 results have been adjusted to reclassify the results of operations of the hand torch and solder business to discontinued operations. |
Newell Rubbermaid Inc.
Impact of Capital Structure Optimization Plan
For the Twelve Months Ended December 31, 2010
(In Millions, except EPS amounts)
| Twelve Months Ended December 31, 2010 |
||||||||||||
| Dollars | Shares | EPS | ||||||||||
| Loss related to early extinguishment of $279 million principal amount of 10.6% notes due 2019, net of tax |
$ | 82.8 | $ | 0.27 | ||||||||
| Loss related to early extinguishment of $325 million principal amount of 5.50% Convertible Notes, net of tax |
54.9 | $ | 0.18 | |||||||||
| Normalize third quarter weighted average share count to remove beneficial impact of purchase of 25,806,452 shares in August 2010 under the Accelerated Share Buyback |
3.5 | $ | (0.02 | ) | ||||||||
| Normalize third quarter weighted average share count to remove adverse impact of issuance of 37,728,415 shares in September 2010 in the Convertible Notes exchange |
(1.5 | ) | $ | 0.01 | ||||||||
|
|
|
|
|
|
|
|||||||
| Total impact of the Capital Structure Optimization Plan excluded from Normalized Earnings and Earnings per Share |
$ | 137.7 | 2.0 | $ | 0.44 | |||||||
|
|
|
|
|
|
|
|||||||
 January 27, 2012
Q4 2011 Earnings Call
Presentation |
 2
Forward-Looking Statement
Forward-Looking Statement
Nancy O’Donnell
VP, Investor Relations
(770) 418-7723
nancy.odonnell@newellco.com
Alisha Pennix
Sr. Manager, Investor Relations
(770) 418-7706
alisha.pennix@newellco.com
INVESTOR RELATIONS CONTACTS:
Statements in this presentation that are not historical in nature constitute forward-looking
statements. These forward-looking statements relate to information or assumptions about the
effects of sales, income/(loss), earnings per share, operating income or gross margin
improvements or declines, Project Acceleration, the European Transformation Plan, the Capital
Structure Optimization Plan, Project Renewal, capital and other expenditures, cash flow,
dividends, restructuring and restructuring related costs, costs and cost savings, inflation or
deflation, particularly with respect to commodities such as oil and resin, debt ratings, and
management's plans, projections and objectives for future operations and performance. These statements
are accompanied by words such as "anticipate," "expect," "project,"
"will," "believe," "estimate" and similar expressions. Actual results
could differ materially from those expressed or implied in the forward-looking statements.
Important factors that could cause actual results to differ materially from those suggested by the
forward-looking statements include, but are not limited to, our dependence on the strength of
retail, commercial and industrial sectors of the economy in light of the continuation or
escalation of the global economic slowdown or regional sovereign debt issues; currency
fluctuations; competition with other manufacturers and distributors of consumer products; major
retailers' strong bargaining power; changes in the prices of raw materials and sourced products
and our ability to obtain raw materials and sourced products in a timely manner from suppliers;
our ability to develop innovative new products and to develop, maintain and strengthen our
end-user brands; our ability to expeditiously close facilities and move operations while
managing foreign regulations and other impediments; our ability to implement successfully
information technology solutions throughout our organization; our ability to improve productivity and
streamline operations; changes to our credit ratings; significant increases in the funding
obligations related to our pension plans due to declining asset values or otherwise; the
imposition of tax liabilities greater than our provisions for such matters; the risks inherent
in our foreign operations and those factors listed in the company’s latest quarterly
report on Form 10-Q, and exhibit 99.1 thereto, filed with the Securities and Exchange
Commission. Changes in such assumptions or factors could produce significantly different results.
The information contained in this presentation is as of the date indicated. The company assumes no
obligation to update any forward-looking statements contained in this presentation as a
result of new information or future events or developments. |
 3
3
Net Sales of $1.50 billion, a 3.7% increase versus the prior year, reflecting a
3.7% improvement in core sales and essentially flat foreign currency
Gross Margin of 37.2%, down 10 basis points from the prior year as pricing and
productivity largely offset the negative impact of input cost inflation and
costs associated with operational issues at the Décor global business
unit Normalized Operating Margin of 11.8% of sales, up 150 basis points
versus the prior year due primarily to a reduction in SG&A expense
Brand-building and other strategic spending were essentially flat in
the quarter while structural SG&A decreased approximately $9
million Normalized EPS of $0.40, a 21.2% increase versus last year
Operating Cash Flow of $281.5 million, compared with $204.7 million last year,
reflecting a reduction in the company’s inventory position in the
quarter The
company
paid
$23.3
million
in
cash
dividends
to
shareholders
and
repurchased 1.5 million shares at a cost of $21.7 million
Q4 2011 Summary
Q4 2011 Summary |
 4
4
Net Sales of $5.86 billion, a 3.6% increase versus the prior year, reflecting a
1.8% improvement in core sales and favorable foreign currency of 1.8%
Gross Margin of 37.6%, down 40 basis points from the prior year,
primarily due to
higher input cost inflation, partially offset by pricing and productivity
Normalized Operating Margin of 12.5% of sales, a 20 basis point decrease from
12.7% of sales in the prior year, primarily due to lower gross margin and
higher strategic SG&A spending, partially offset by lower structural
SG&A costs Normalized EPS of $1.59, compared with $1.50 in the prior
year Operating Cash Flow of $561.3 million, compared with $582.6 million last
year The year-over-year change is primarily driven by a decrease in
accrued liabilities
The company increased its quarterly dividend by 60%, paid $84.9 million in cash
dividends to shareholders and repurchased 3.4 million shares at a cost of
$46.1 million
FY 2011 Summary
FY 2011 Summary |
 5
5
Q4 2011 Sales:
Q4 2011 Sales:
Percent Change by Segment
Percent Change by Segment
Q4 2011
Home &
Family
Office
Products
Tools,
Hardware &
Commercial
Products
Total
Core Sales
0.9
3.8
8.0
3.7
Currency Translation
0.3
(0.1)
(0.3)
0.0
Total
1.2
3.7
7.7
3.7 |
 6
6
FY 2011
Home &
Family
Office
Products
Tools,
Hardware &
Commercial
Products
Total
Core Sales
(0.8)
1.5
6.0
1.8
Currency Translation
1.3
2.6
1.9
1.8
Total
0.5
4.1
7.9
3.6
FY 2011 Sales:
FY 2011 Sales:
Percent Change by Segment
Percent Change by Segment |
 7
7
Full Year 2011 Results
Full Year 2011 Results
*
See reconciliation included in the Appendix
FY 2011
Core Sales
1.8%
Currency Translation
1.8%
Total Sales Growth
3.6%
“Normalized”
Operating
Margin*
12.5%
“Normalized”
EPS*
$1.59
Cash Flow from Operations
$561.3 million
Capital Expenditures
$222.9 million |
 8
8
FY 2012 Outlook
FY 2012 Outlook
*
Reflects outlook communicated in the January 27, 2012 Q4 2011 Earnings Release and
Earnings Call **
See reconciliation included in the Appendix
FY 2012 Outlook*
Core Sales
2% to 3%
Currency Translation
Approximately -2%
Total Sales Growth
0% to 1%
“Normalized”
Operating Margin
Up to +20 basis points
“Normalized”
EPS**
$1.63 to $1.69
Cash Flow from Operations
$550 to $600 million
Capital Expenditures
$200 to $225 million |
 9
9
The LENOX®
SPEED SLOT
™
features a patent-pending
staircase design for easy plug
removal
Up to 2X life in metal cutting –
enhanced tooth geometry, a thin
kerf design and an advanced
coating contribute to the
efficiency of the cutting process
Sales Growth Initiatives
Sales Growth Initiatives
LENOX®
Bi-Metal SPEED SLOT™
Hole Saw |
 10
10
Sales Growth Initiatives
Sales Growth Initiatives
The Parker Ingenuity
Collection was created for
exclusive
use
with
Parker
5
th
Technology
Parker 5
th
Technology
provides an exceptionally
smooth and fluid writing
experience that adjusts
intuitively to the user’s style of
writing
Parker®
Ingenuity Pens Featuring
Parker 5 Technology
th
TM |
 11
11
Comprehensive line includes box
beam levels, I-beam levels,
torpedo levels, multiple specialty
levels, squares and utility levels
for a broad range of users’
needs
Tools are packed with features
that stand up to the rugged
conditions of the jobsite
Guaranteed accurate for life*
Sales Growth Initiatives
Sales Growth Initiatives
*
Guarantee refers to vial accuracy for the life of the product. See IRWIN.com for
product listing.
New IRWIN®
Levels and Squares |
 12
12
Launched in virtually all
countries where Paper Mate®
is sold
New integrated ink and
nib technology generates an
unbelievably smooth
writing experience
Sub-brand of Paper Mate®
Sales Growth Initiatives
Sales Growth Initiatives |
 13
13
Sales Growth Initiatives
Sales Growth Initiatives
Enables physicians to connect
wirelessly with patients across
great distances using live video
Able to connect with a range of
devices including desktop,
laptop, tablet or smart phone
technologies
Combines traditional computing,
video conferencing and
interactive whiteboard annotation
all in one
Rubbermaid®
Telemedicine Cart |
 14
14
and Launched
in Brazil
and Launched
in Brazil Sales Growth Initiatives
Sales Growth Initiatives |
 15
15
Sales Growth Initiatives
Sales Growth Initiatives
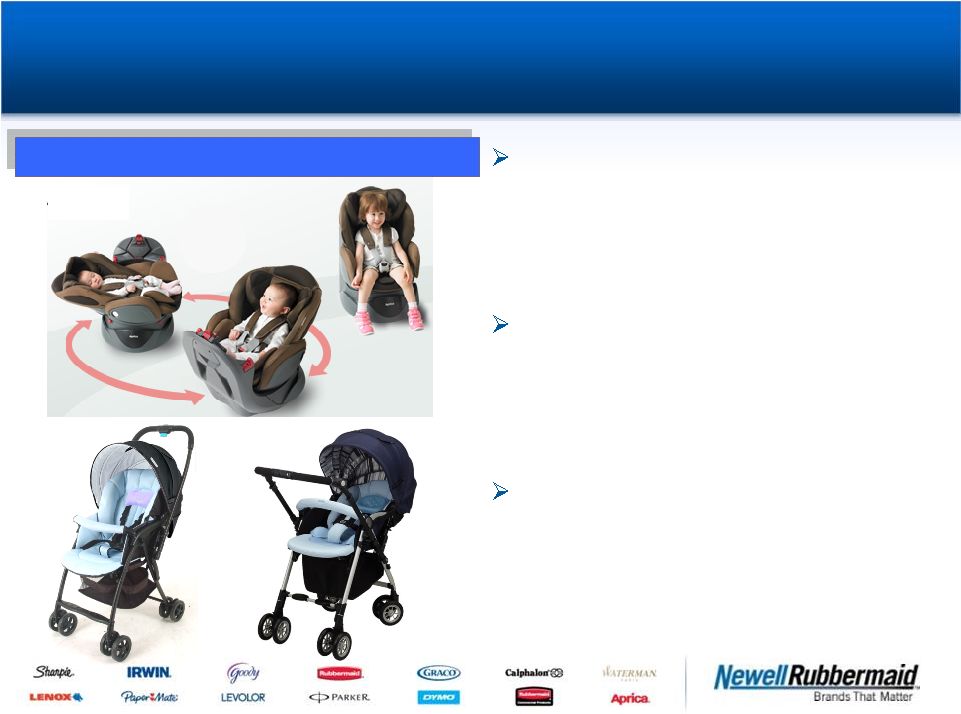
Fladea™
car seat easily rotates into
three positions for optimum safety as
the baby grows (flat bed for
newborn, rear facing and forward
facing)
Karoon™
Plus (left), the lightest
stroller in the category, features a
reversible handle, 3-D suspension
for better steadiness and a 360-
degree full canopy
Soraria®
(right) has auto-locking 4-
wheel casters for convenience and
ease of maneuverability, a reversible
handle and a higher seat to protect
against heat from the road
New Aprica®
Japan Product Launches |
 16
16
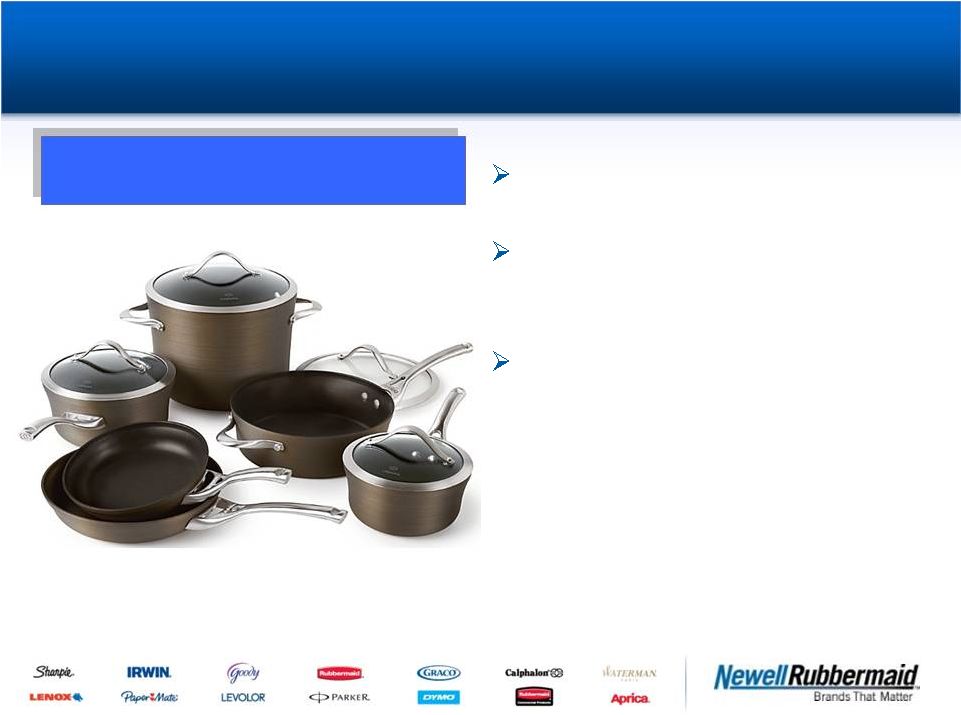
Sales Growth Initiatives
Sales Growth Initiatives
Bronze anodized exterior lasts a
lifetime –
won’t crack, chip or peel
Advanced heavy-gauge hard-
anodized aluminum technology
heats evenly
Ultra-durable multi-layer nonstick
for easy release
Calphalon®
Contemporary
Bronze Nonstick Cookware |
 Appendix |
 Reconciliation: Q4 2011 and
Q4 2010 “Normalized”
Q4 2010 “Normalized”
EPS
EPS
Q4 2011
Q4 2010
Diluted earnings per share (as reported)
$0.27
$0.25
Restructuring and restructuring-related costs
$0.12
$0.08
Discontinued operations
$0.00
($0.01)
"Normalized" EPS*
$0.40
$0.33
* Totals may not add due to rounding
Additional discussion of the reconciling items above can be found in the company's Q4 2011 earnings
release.
18 |
 19
Reconciliation: FY 2011 and
Reconciliation: FY 2011 and
FY 2010 “Normalized”
FY 2010 “Normalized”
EPS
EPS
FY 2011
FY 2010
Diluted earnings per share (as reported)
$0.42
$0.96
Impairment charges
$1.03
$0.00
Restructuring and restructuring-related costs
$0.24
$0.24
Discontinued operations
$0.03
($0.02)
CEO transition costs
$0.02
$0.00
Convertible notes dilution
$0.00
$0.10
Capital structure optimization plan
$0.00
$0.44
Income tax benefits
($0.17)
($0.21)
Other items
$0.01
($0.01)
"Normalized" EPS*
$1.59
$1.50
* Totals may not foot due to rounding
Additional discussion of the reconciling items above can be found in the company's Q4 2011 earnings
release. |
 20
20
Reconciliation: Full Year 2012
Reconciliation: Full Year 2012
Outlook for “Normalized”
Outlook for “Normalized”
EPS
EPS
FY 2012
Diluted earnings per share
$1.34 to $1.40
Restructuring and restructuring-related costs [ 1 ]
$0.27 to $0.32
"Normalized" EPS
$1.63 to $1.69
[ 1 ] Restructuring and restructuring-related costs include impairment charges, employee
termination benefits and other costs associated with the European Transformation Plan and
Project Renewal. |
 Reconciliation: Q4 2011 and Q4 2010 Operating
Income, As Reported, to Operating Income, Normalized
Income, As Reported, to Operating Income, Normalized
$ millions
Q4 2011
Q4 2010
Net sales
$1,495.2
$1,441.5
Operating income (as reported)
$125.5
$118.3
Restructuring and restructuring-related costs
$49.4
$30.8
CEO transition costs
$1.9
$0.0
Operating income (normalized)
$176.8
$149.1
Operating margin (normalized)
11.8%
10.3%
Additional discussion of the reconciling items above can be found in the company's Q4 2011 earnings
release.
21 |
 Reconciliation: FY 2011 and FY 2010 Operating
Income, As Reported, to Operating Income, Normalized
Income, As Reported, to Operating Income, Normalized
FY 2011
FY 2010
Net sales
$5,864.6
$5,658.2
Operating income (as reported)
$257.2
$623.5
Impairment charges
$382.6
$0.0
Restructuring and restructuring-related costs
$87.5
$92.6
CEO transition costs
$6.3
$0.0
Operating income (normalized)
$733.6
$716.1
Operating margin (normalized)
12.5%
12.7%
Additional discussion of the reconciling items above can be found in the company's Q4 2011 earnings
release.
$ millions
22 |
 23
23
Reconciliation: Q4 2011 and
Reconciliation: Q4 2011 and
Q4 2010 Free Cash Flow
Q4 2010 Free Cash Flow
Q4 2011
Q4 2010
Operating Cash Flow
$281.5
$204.7
Capital Expenditures
($71.7)
($56.6)
Free Cash Flow
$209.8
$148.1
Free Cash Flow is defined as cash flow provided by operating activities less capital
expenditures.
$ millions |
 24
24
Reconciliation: FY 2011 and
Reconciliation: FY 2011 and
FY 2010 Free Cash Flow
FY 2010 Free Cash Flow
FY 2011
FY 2010
Operating Cash Flow
$561.3
$582.6
Capital Expenditures
($222.9)
($164.7)
Free Cash Flow
$338.4
$417.9
Free Cash Flow is defined as cash flow provided by operating activities less capital
expenditures.
$ millions |