Attached files
| file | filename |
|---|---|
| 8-K - FORM 8-K - YADKIN FINANCIAL Corp | form8-k.htm |

Yadkin Valley Financial Corporation Posts Second Consecutive Quarter of Profitability with Fourth Quarter 2011 Results
Fourth Quarter Highlights:
• | Net income available to common shareholders for the fourth quarter of 2011 was $2.2 million, or $0.11 per diluted share. |
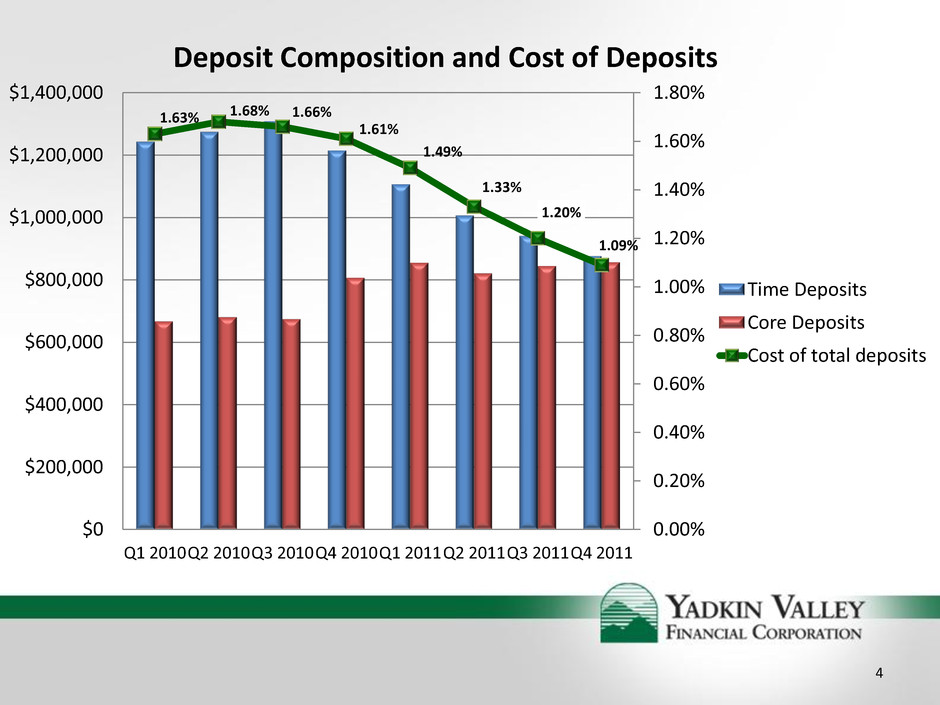
• | Our strategic focus on shifting deposit mix continues to yield results as lower-cost core deposits increased $11.7 million, or 1.4%, in the fourth quarter and higher-cost time deposits decreased $64.5 million, or 6.9%. |
• | Nonperforming loans decreased $1.3 million, or 1.9%, to $69.4 million in the fourth quarter of 2011. |
• | Net loan charge-offs were $4.5 million, or 1.20% of average loans on an annualized basis. |
• | Leverage ratio, Tier 1 risk-based capital ratio, and total risk-based capital ratio were 8.3%, 10.6%, and 11.8%, respectively, for the holding company as of December 31, 2011. |
2011 Highlights:
• | Net loan charge-offs of $25.7 million, or 1.68% of average loans for the year, a decrease of $10.1 million from 2010. |
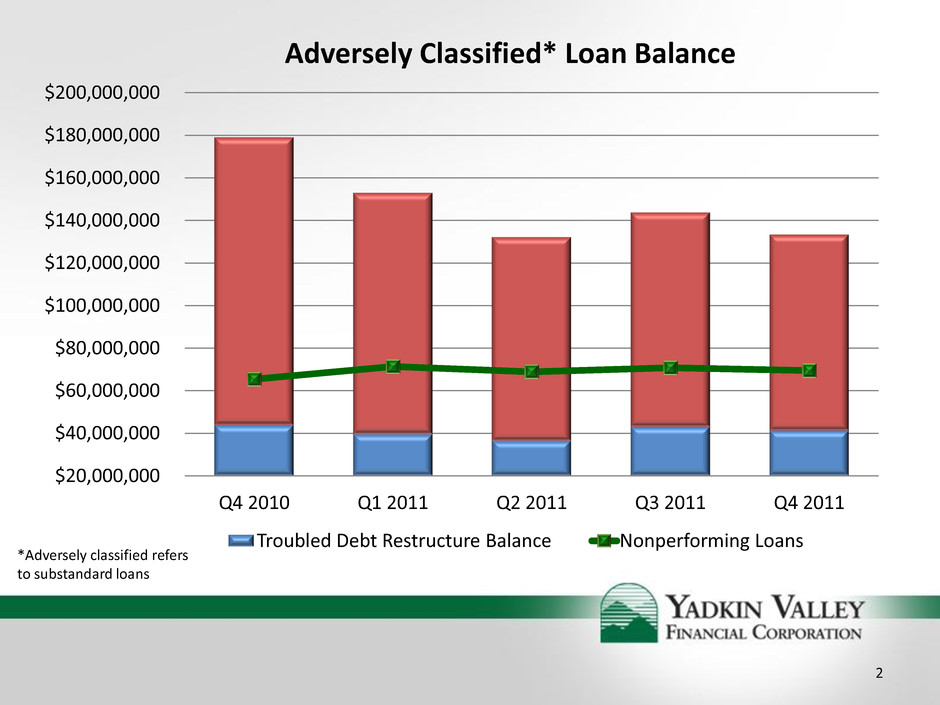
• | Adversely classified loans decreased $45.6 million, or 25%, from the end of 2010. |
• | Total deposits decreased $289.1 million, or 14.3%, in 2011. This decrease was primarily in higher-cost time deposits, as our lower-cost core deposits have increased in volume. |
• | Nonperforming loans increased 6.1% and nonperforming assets increased 3.7% year-over-year. |
• | Net loss available to common shareholders of $17.4 million, or $0.95 per diluted share for 2011. |
Elkin, NC - January 26, 2012 - Yadkin Valley Financial Corporation (NASDAQ: YAVY), the holding company for Yadkin Valley Bank and Trust Company, announced financial results for the fourth quarter and year ended December 31, 2011. Net income available to common shareholders for the quarter was $2.2 million, or $0.11 per diluted share, compared to net income of $2.9 million, or $0.15 per diluted share, in the third quarter of 2011, and a net loss of $9,000, or $0.00 per diluted share, in the fourth quarter of 2010. Net loss available to common shareholders for the year was $17.4 million, or $0.95 per diluted share, compared to net loss of $3.2 million or $0.20 per diluted share in 2010.
Joe Towell, President and CEO of Yadkin Valley Financial, commented, “We are pleased to see our second consecutive quarter of profitability. Due to the prudent execution of our strategic plan throughout 2011, we are seeing positive results in the Bank's performance. Our branch consolidations, line unit reorganizations, and targeted expense reduction plans initiated in 2011 are complete, and we are looking forward to a positive year ahead as we focus on consistent profitability.
Asset quality continues to be our priority. This quarter, our nonperforming loans improved slightly and charge-offs were up slightly over the previous quarter, but our year-over-year numbers show marked improvement, particularly in the decline of our adversely classified loans which decreased $45.6 million or 25% since December 31, 2010. We are encouraged by continuing signs of stabilizing credit quality, and one of our primary goals for 2012 is reducing the level of our problem assets.
Our sales and service training program, which we announced last quarter, is well underway. We are investing in every employee in the Company in order to improve our customer delivery and experience. This initiative will continue throughout 2012, and we look forward to showing our customers the benefits of this endeavor.
Finally, we continue to be keenly focused on our capital management strategy. Management and the Board will
continue to evaluate strategic capital options that could provide even greater strength to the Company in the future.”
Fourth Quarter 2011 Financial Highlights
Asset Quality
Nonperforming loans, which include loans in nonaccrual status, decreased $1.3 million, to $69.4 million, or 4.72% of total gross loans at December 31, 2011, compared to $70.8 million, or 4.76% of total gross loans at September 30, 2011. The Company continues to keep a tight focus on nonperforming loans, and the decrease in the fourth quarter is largely due to prudent portfolio management. “We are encouraged by the decline in nonperforming loans,” said Towell. “We moved several larger commercial loans into Other Real Estate Owned this quarter and while that keeps them in our nonperforming category, we believe that puts them one step closer to resolution through eventual sale.”
Nonperforming Loan Analysis | ||||||||||||
(Dollars in thousands) | ||||||||||||
December 31, 2011 | December 31, 2010 | |||||||||||
Loan Type | Outstanding Balance | % of Total Loans | Outstanding Balance | % of Total Loans | ||||||||
Construction/land development | $ | 19,467 | 1.32 | % | $ | 21,213 | 1.43 | % | ||||
Residential construction | 6,586 | 0.45 | % | 10,627 | 0.71 | % | ||||||
HELOC | 2,222 | 0.15 | % | 2,458 | 0.17 | % | ||||||
1-4 family residential | 6,871 | 0.47 | % | 7,999 | 0.54 | % | ||||||
Commercial real estate | 24,915 | 1.69 | % | 24,152 | 1.62 | % | ||||||
Commercial & industrial | 8,896 | 0.61 | % | 3,755 | 0.25 | % | ||||||
Consumer & other | 475 | 0.03 | % | 571 | 0.04 | % | ||||||
Total | $ | 69,432 | 4.72 | % | $ | 70,775 | 4.76 | % | ||||
Other Real Estate Owned (“OREO”) totaled $25.0 million at December 31, 2011, an increase of $3.7 million compared to $21.3 million at September 30, 2011. This increase in OREO was the result of $6.7 million in foreclosures for the quarter, offset by dispositions of $3.1 million. Total nonperforming assets at December 31, 2011 were $94.4 million, or 4.74% of total assets, an increase of $2.3 million from September 30, 2011. Nonperforming assets increased due to the increase in OREO, as nonperforming loans decreased for the quarter.
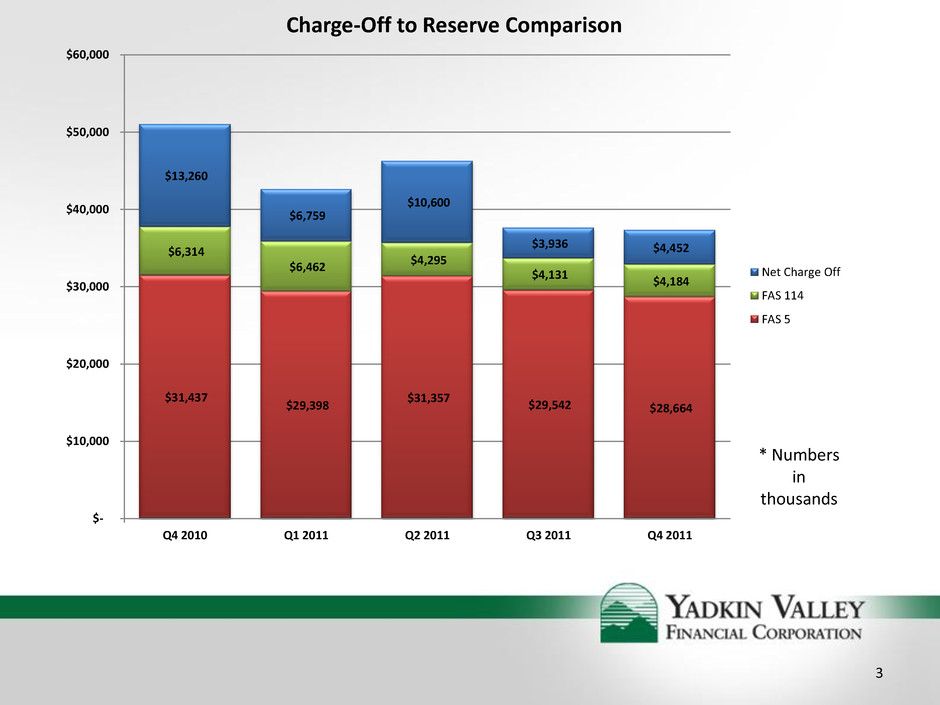
During the fourth quarter of 2011, the provision for loan losses was $3.6 million, an increase of $1.7 million from the third quarter of 2011. The increase in provision was driven by an increase in charge-offs for the quarter. Net charge-offs for the fourth quarter totaled $4.5 million, or 1.20% of average loans on an annualized basis, an increase of $500,000 from the third quarter. Total net loan charge-offs for 2011 were $25.7 million, or 1.68% of average loans for the year.
At December 31, 2011, the allowance for loan losses was $32.8 million, compared to $33.7 million at September 30, 2011. As a percentage of total loans held-for-investment, the allowance for loan losses was 2.26% in the fourth quarter of 2011, down from 2.29% in the third quarter of 2011. Out of the $32.8 million in total allowance for loan losses at December 31, 2011, the specific allowance for impaired loans accounted for $4.1 million, remaining flat from the end of the third quarter. The remaining general allowance of $28.7 million attributed to unimpaired loans was down from $29.6 million at the end of the third quarter. This decrease was driven by continued decreases in loans held-for-investment, as well as a decrease in criticized, non-impaired (internal risk grades 5 and 6, and risk grade 7 under $100,000) loans.
Net Interest Income and Net Interest Margin
Net interest income remained flat quarter over quarter, totaling $15.6 million for the fourth quarter of 2011. The net interest margin improved to 3.31%, up from 3.29% in the third quarter. Our net interest margin continues to see steady improvement due to the planned shift in our deposit mix. The managed movement from high-cost time deposits to low-cost core deposits improved our net interest margin as cost of total deposits decreased to 1.09% for the quarter as compared to 1.20% in the third quarter of 2011.
Non-Interest Income
Non-interest income decreased $689,000, or 12.9%, to $4.7 million compared to $5.3 million in the third quarter of 2011. In the previous quarter, the Company experienced a larger gain on securities.
Non-Interest Expense
Non-interest expense increased $984,000, or 7.6%, to $13.9 million, up from $13.0 million in the third quarter of 2011. However, in the prior quarter, the Company recorded several significant transactions including the elimination of an employee benefit and a change in our FDIC premium calculation, which decreased our non-interest expense last quarter. Excluding those transactions, non-interest expense was flat quarter-over-quarter.
Balance Sheet and Capital
Total assets decreased $53.9 million for the fourth quarter and $307.4 million, or 13.4%, during 2011. The decrease in total assets for the year was primarily related to the decrease in loans and deposits. Gross loans held-for-investment decreased $149.6 million, or 9.3%, during 2011, and total deposits decreased $289.1 million, or 14.3%. This deposit decrease continues to be mostly higher-cost time deposits, as our non-interest bearing demand deposits continue to increase in volume. Brokered deposits remain a relatively small portion of the Company's funding sources, representing only 2.8% of total deposits at December 31, 2011, a continued decrease from the level at September 30, 2011.
The Bank remains well-capitalized for regulatory purposes. As of December 31, 2011, the Bank's leverage ratio, Tier 1 risk-based capital ratio, and total risk-based capital ratio were 8.0%, 10.2%, and 11.5%, respectively. Leverage ratio, Tier 1 risk-based capital ratio, and total risk-based capital ratio were 8.3%, 10.6%, and 11.8% respectively, for the holding company as of December 31, 2011. For capital adequacy purposes, leverage ratio, Tier 1 risk-based capital ratio, and total risk-based capital ratio must be in excess of 5.00%, 6.00%, and 10.00%, respectively, to be considered well-capitalized. The improvement in capital ratios, at both the holding company and the Bank, is due to the Company's second consecutive quarter of profitability.
Conference Call
Yadkin Valley Financial Corporation will host a conference call at 10:00 a.m. EDT on Thursday, January 26, 2012 to discuss financial results, business highlights, and outlook. The call may be accessed by dialing 877-359-3650 at least 10 minutes prior to the call. A webcast of the call audio and accompanying visual aids may be accessed at http://investor.shareholder.com/media/eventdetail.cfm?eventid=108523&CompanyID=YAVY&e=1&mediaKey=C0BD0B7D7BA30A3E46A5C745FA0F7F34. A replay of the call will be available until February 3, 2012 by dialing 855-859-2056 or 404-537-3406 and entering access code 46031603.
####
About Yadkin Valley Financial Corporation
Yadkin Valley Financial Corporation is the holding company for Yadkin Valley Bank and Trust Company, a full-service community bank providing services in 34 branches throughout its two regions in North Carolina and South Carolina. The Western Region serves Avery, Watauga, Ashe, Surry, Wilkes, Yadkin, and Iredell Counties. The Southern Region serves Durham, Orange, Granville, Mecklenburg, and Union Counties in North Carolina, and Cherokee and York Counties in South Carolina. The Bank provides mortgage lending services through its subsidiary, Sidus Financial, LLC, headquartered in Greensboro, NC. Securities brokerage services are provided by Main Street Investment Services, Inc., a Bank subsidiary with four offices located in the branch network. Yadkin Valley Financial Corporation's website
is www.yadkinvalleybank.com. Yadkin Valley shares are traded on NASDAQ under the symbol YAVY.
FORWARD LOOKING STATEMENTS
Certain statements in this news release contain "forward-looking statements" within the meaning of the Private Securities Litigation Reform Act of 1995, such as statements relating to future plans and expectations, and are thus prospective. Such forward-looking statements include but are not limited to (1) statements regarding potential future economic recovery, (2) statements with respect to our plans, objectives, expectations and intentions and other statements that are not historical facts, and (3) other statements identified by words such as “believes,” “expects,” “anticipates,” “estimates,” “intends,” “plans,” “targets,” and “projects,” as well as similar expressions. Such statements are subject to risks, uncertainties, and other factors which could cause actual results to differ materially from future results expressed or implied by such forward-looking statements. Although we believe that the assumptions underlying the forward-looking statements are reasonable, any of the assumptions could prove to be inaccurate. Therefore, we can give no assurance that the results contemplated in the forward-looking statements will be realized. The inclusion of this forward-looking information should not be construed as a representation by our company or any person that the future events, plans, or expectations contemplated by our company will be achieved.
The following factors, among others, could cause actual results to differ materially from the anticipated results or other expectations expressed in the forward-looking statements: (1) the rate of delinquencies and amounts of charge-offs, the level of allowance for loan losses, the rates of loan growth, or adverse changes in asset quality in our loan portfolio, which may result in increased credit risk-related losses and expenses; (2) competitive pressures among depository and other financial institutions may increase significantly and have an effect on pricing, spending, third-party relationships and revenues; (3) the strength of the United States economy in general and the strength of the local economies in which we conduct operations may be different than expected resulting in, among other things, a deterioration in the credit quality or a reduced demand for credit, including the resultant effect on the company's loan portfolio and allowance for loan losses; (4) the risk that the preliminary financial information reported herein and our current preliminary analysis will be different when our review is finalized; (5) changes in deposit rates, the net interest margin, and funding sources; (6) changes in the U.S. legal and regulatory framework, including the effect of recent financial reform legislation on the banking industry; and (7) adverse conditions in the stock market, the public debt market and other capital markets (including changes in interest rate conditions) could have a negative impact on the company. Additional factors that could cause our results to differ materially from those described in the forward-looking statements can be found in our reports (such as Annual Reports on Form 10-K, Quarterly Reports on Form 10-Q and Current Reports on Form 8-K) filed with the SEC and available at the SEC's Internet site (http://www.sec.gov). All subsequent written and oral forward-looking statements concerning the company or any person acting on its behalf is expressly qualified in its entirety by the cautionary statements above. We do not undertake any obligation to update any forward-looking statements to reflect circumstances or events that occur after the date the forward-looking statements are made.
For additional information contact:
Joseph H. Towell
President and Chief Executive Officer
(704) 768-1133
joe.towell@yadkinvalleybank.com
Jan H. Hollar
Executive Vice President and Chief Financial Officer
(704) 768-1161
jan.hollar@yadkinvalleybank.com
Yadkin Valley Financial Corporation | |||||||||||||||||||
Consolidated Balance Sheets (Unaudited) | |||||||||||||||||||
(Amounts in thousands except share and per share data) | |||||||||||||||||||
December 31, 2011 | September 30, 2011 | June 30, 2011 | March 31, 2011 | December 31, 2010 | |||||||||||||||
Assets: | (a) | ||||||||||||||||||
Cash and due from banks | $ | 40,790 | $ | 32,315 | $ | 30,011 | $ | 31,537 | $ | 31,967 | |||||||||
Federal funds sold | 50 | 50 | 36 | 50 | 31 | ||||||||||||||
Interest-earning deposits with banks | 52,078 | 136,552 | 99,122 | 188,003 | 197,782 | ||||||||||||||
U.S. government agencies | 23,726 | 24,013 | 34,485 | 24,262 | 14,551 | ||||||||||||||
Mortgage-backed securities | 232,494 | 201,586 | 214,796 | 208,037 | 209,706 | ||||||||||||||
State and municipal securities | 73,118 | 66,369 | 67,034 | 68,090 | 72,621 | ||||||||||||||
Common and preferred stocks | 1,084 | 1,110 | 1,144 | 1,140 | 1,124 | ||||||||||||||
330,422 | 293,078 | 317,459 | 301,529 | 298,002 | |||||||||||||||
Construction loans | 202,803 | 229,789 | 243,681 | 261,083 | 300,877 | ||||||||||||||
Commercial, financial and other loans | 200,750 | 197,672 | 181,473 | 216,056 | 222,667 | ||||||||||||||
Residential mortgages | 179,047 | 179,457 | 210,685 | 181,057 | 174,536 | ||||||||||||||
Commercial real estate loans | 631,639 | 625,193 | 601,520 | 646,657 | 650,696 | ||||||||||||||
Installment loans | 35,465 | 37,125 | 61,600 | 40,546 | 42,443 | ||||||||||||||
Revolving 1-4 family loans | 201,220 | 204,364 | 205,308 | 207,308 | 209,319 | ||||||||||||||
Total loans | 1,450,924 | 1,473,600 | 1,504,267 | 1,552,707 | 1,600,538 | ||||||||||||||
Allowance for loan losses | (32,848 | ) | (33,673 | ) | (35,652 | ) | (35,860 | ) | (37,752 | ) | |||||||||
Net loans | 1,418,076 | 1,439,927 | 1,468,615 | 1,516,847 | 1,562,786 | ||||||||||||||
Loans held for sale | 19,534 | 13,801 | 27,737 | 32,880 | 50,419 | ||||||||||||||
Accrued interest receivable | 6,745 | 6,447 | 7,066 | 7,515 | 7,947 | ||||||||||||||
Bank premises and equipment | 44,048 | 44,074 | 44,173 | 46,245 | 45,970 | ||||||||||||||
Foreclosed real estate | 24,966 | 21,307 | 22,046 | 27,461 | 25,582 | ||||||||||||||
Non-marketable equity securities at cost | 6,130 | 7,005 | 7,814 | 9,416 | 9,416 | ||||||||||||||
Investment in bank-owned life insurance | 25,934 | 25,769 | 25,602 | 25,441 | 25,278 | ||||||||||||||
Goodwill | — | — | — | 4,944 | 4,944 | ||||||||||||||
Core deposit intangible | 3,733 | 4,015 | 4,304 | 4,602 | 4,907 | ||||||||||||||
Other assets | 20,682 | 22,791 | 27,057 | 34,421 | 35,563 | ||||||||||||||
Total assets | $ | 1,993,188 | $ | 2,047,131 | $ | 2,081,042 | $ | 2,230,891 | $ | 2,300,594 | |||||||||
Liabilities and shareholders' equity: | |||||||||||||||||||
Deposits: | |||||||||||||||||||
Non-interest bearing | $ | 229,895 | $ | 228,448 | $ | 222,556 | $ | 222,457 | $ | 216,161 | |||||||||
NOW, savings and money market accounts | 625,560 | 615,303 | 597,611 | 631,791 | 589,790 | ||||||||||||||
Time certificates: | |||||||||||||||||||
$100 or more | 360,388 | 383,877 | 409,410 | 443,312 | 477,030 | ||||||||||||||
Other | 515,498 | 556,484 | 596,218 | 662,246 | 737,425 | ||||||||||||||
Total deposits | 1,731,341 | 1,784,112 | 1,825,795 | 1,959,806 | 2,020,406 | ||||||||||||||
Borrowings | 105,539 | 108,309 | 103,524 | 109,452 | 116,768 | ||||||||||||||
Accrued expenses and other liabilities | 15,722 | 16,494 | 17,656 | 15,125 | 15,963 | ||||||||||||||
Total liabilities | 1,852,602 | 1,908,915 | 1,946,975 | 2,084,383 | 2,153,137 | ||||||||||||||
Total shareholders' equity | 140,586 | 138,216 | 134,067 | 146,508 | 147,457 | ||||||||||||||
Total liabilities and shareholders' equity | $ | 1,993,188 | $ | 2,047,131 | $ | 2,081,042 | $ | 2,230,891 | $ | 2,300,594 | |||||||||
Period End Shares Outstanding | 19,526,188 | 19,526,188 | 19,526,188 | 16,292,640 | 16,147,640 | ||||||||||||||
(a) Derived from audited consolidated financial statements
Yadkin Valley Financial Corporation | |||||||||||||||||||
Consolidated Income Statements (Unaudited) | |||||||||||||||||||
Three Months Ended | |||||||||||||||||||
(Amounts in thousands except share and per share data) | |||||||||||||||||||
December 31, 2011 | September 30, 2011 | June 30, 2011 | March 31, 2011 | December 31, 2010 | |||||||||||||||
(a) | |||||||||||||||||||
Interest and fees on loans | $ | 19,186 | $ | 19,339 | $ | 20,768 | $ | 21,349 | $ | 22,500 | |||||||||
Interest on securities | 1,709 | 2,146 | 2,255 | 2,108 | 2,241 | ||||||||||||||
Interest on federal funds sold | 6 | 7 | 9 | 6 | 7 | ||||||||||||||
Interest-bearing deposits | 71 | 71 | 90 | 115 | 88 | ||||||||||||||
Total interest income | 20,972 | 21,563 | 23,122 | 23,578 | 24,836 | ||||||||||||||
Time deposits of $100 or more | 2,271 | 2,326 | 2,541 | 2,938 | 3,136 | ||||||||||||||
Other deposits | 2,569 | 3,120 | 3,731 | 4,380 | 5,084 | ||||||||||||||
Borrowed funds | 504 | 484 | 539 | 570 | 660 | ||||||||||||||
Total interest expense | 5,344 | 5,930 | 6,811 | 7,888 | 8,880 | ||||||||||||||
Net interest income | 15,628 | 15,633 | 16,311 | 15,690 | 15,956 | ||||||||||||||
Provision for loan losses | 3,627 | 1,956 | 10,393 | 4,867 | 6,277 | ||||||||||||||
Net interest income after provision for loan losses | 12,001 | 13,677 | 5,918 | 10,823 | 9,679 | ||||||||||||||
Non-interest income | |||||||||||||||||||
Service charges on deposit accounts | 1,509 | 1,604 | 1,437 | 1,345 | 1,498 | ||||||||||||||
Other service fees | 874 | 905 | 967 | 962 | 1,253 | ||||||||||||||
Net gain on sales of mortgage loans | 1,287 | 1,122 | 179 | 1,899 | 3,128 | ||||||||||||||
Income on investment in bank owned life insurance | 166 | 167 | 161 | 163 | 175 | ||||||||||||||
Mortgage banking operations | 6 | (21 | ) | 103 | 207 | (66 | ) | ||||||||||||
Gains on sale of securities | 678 | 1,556 | 429 | 93 | 1,291 | ||||||||||||||
Other than temporary impairment of investments | — | (74 | ) | (22 | ) | (20 | ) | (101 | ) | ||||||||||
Other | 140 | 90 | 102 | 142 | 154 | ||||||||||||||
4,660 | 5,349 | 3,356 | 4,791 | 7,332 | |||||||||||||||
Non-interest expense | |||||||||||||||||||
Salaries and employee benefits | 6,383 | 6,198 | 7,793 | 7,870 | 7,686 | ||||||||||||||
Occupancy and equipment | 1,781 | 1,962 | 2,330 | 2,170 | 2,160 | ||||||||||||||
Printing and supplies | 154 | 141 | 156 | 181 | 175 | ||||||||||||||
Data processing | 377 | 404 | 381 | 373 | 376 | ||||||||||||||
Communication expense | 367 | 372 | 473 | 445 | 453 | ||||||||||||||
Advertising and marketing | 101 | 127 | 169 | 171 | 252 | ||||||||||||||
Amortization of core deposit intangible | 282 | 289 | 299 | 305 | 305 | ||||||||||||||
FDIC assessment expense | 718 | 79 | 1,328 | 1,350 | 1,126 | ||||||||||||||
Attorney fees | 108 | 95 | 194 | 92 | 170 | ||||||||||||||
Loan collection expense | 319 | 378 | 465 | 433 | 342 | ||||||||||||||
Loss on fixed assets | 13 | 286 | 1,195 | — | — | ||||||||||||||
Net cost of operation of other real estate owned | 1,086 | 759 | 2,430 | 794 | 639 | ||||||||||||||
Goodwill impairment | — | — | 4,944 | — | — | ||||||||||||||
Other | 2,258 | 1,873 | 2,300 | 2,725 | 3,291 | ||||||||||||||
Total non-interest expense | 13,947 | 12,963 | 24,457 | 16,909 | 16,975 | ||||||||||||||
Income (loss) before income taxes | 2,714 | 6,063 | (15,183 | ) | (1,295 | ) | 36 | ||||||||||||
Provision for income taxes (benefit) | (211 | ) | 2,384 | 5,030 | (509 | ) | (823 | ) | |||||||||||
Net income (loss) | 2,925 | 3,679 | (20,213 | ) | (786 | ) | 859 | ||||||||||||
771 | 771 | 674 | 771 | 868 | |||||||||||||||
Net income (loss) available to common shareholders | $ | 2,154 | $ | 2,908 | $ | (20,887 | ) | $ | (1,557 | ) | $ | (9 | ) | ||||||
Basic | $ | 0.11 | $ | 0.15 | (1.16 | ) | $ | (0.1 | ) | $ | — | ||||||||
Diluted | $ | 0.11 | $ | 0.15 | (1.16 | ) | $ | (0.1 | ) | $ | — | ||||||||
Weighted average number of shares outstanding | |||||||||||||||||||
Basic | 19,534,469 | 19,527,855 | 18,041,174 | 16,130,529 | 16,129,640 | ||||||||||||||
Diluted | 19,534,469 | 19,527,855 | 18,041,174 | 16,130,529 | 16,129,640 | ||||||||||||||
(a) Derived from audited consolidated financial statements | |||||||||||||||||||
Yadkin Valley Financial Corporation | |||||||||||||||||||
(unaudited) | |||||||||||||||||||
At or For the Three Months Ended | |||||||||||||||||||
December 31, 2011 | September 30, 2011 | June 30, 2011 | March 31, 2011 | December 31, 2010 | |||||||||||||||
Per Share Data: | |||||||||||||||||||
Basic Earnings (Loss) per Share | $ | 0.11 | $ | 0.15 | $ | (1.16 | ) | $ | (0.10 | ) | $ | — | |||||||
Diluted Earnings (Loss) per Share | 0.11 | 0.15 | (1.16 | ) | (0.10 | ) | — | ||||||||||||
Book Value per Share | 4.77 | 4.66 | 4.45 | 6.11 | 6.24 | ||||||||||||||
Selected Performance Ratios: | |||||||||||||||||||
Return on Average Assets (annualized) | 0.42 | % | 0.56 | % | (3.87 | )% | (0.28 | )% | — | % | |||||||||
Return on Average Equity (annualized) | 6.17 | % | 8.49 | % | (55.25 | )% | (4.27 | )% | (0.02 | )% | |||||||||
Net Interest Margin (annualized) | 3.31 | % | 3.29 | % | 3.30 | % | 3.07 | % | 2.97 | % | |||||||||
Net Interest Spread (annualized) | 3.14 | % | 3.11 | % | 3.11 | % | 2.88 | % | 2.77 | % | |||||||||
Non-interest Income as a % of Revenue(6) | 27.97 | % | 28.11 | % | 36.19 | % | 30.69 | % | 43.10 | % | |||||||||
Non-interest Income as a % of Average Assets | 0.23 | % | 0.26 | % | 0.16 | % | 0.21 | % | 0.32 | % | |||||||||
Non-interest Expense as a % of Average Assets | 0.69 | % | 0.63 | % | 1.13 | % | 0.75 | % | 0.73 | % | |||||||||
Asset Quality: | |||||||||||||||||||
Loans 30-89 days past due (000's) (4) | $ | 25,888 | $ | 23,739 | $ | 24,368 | $ | 23,756 | $ | 25,353 | |||||||||
Loans over 90 days past due still accruing (000's) | — | — | — | — | — | ||||||||||||||
Nonperforming Loans (000's) | 69,432 | 70,775 | 68,898 | 71,368 | 65,400 | ||||||||||||||
Other Real Estate Owned (000's) | 24,966 | 21,307 | 22,046 | 27,461 | 25,582 | ||||||||||||||
Nonperforming Assets (000's) | 94,398 | 92,082 | 90,944 | 98,829 | 90,983 | ||||||||||||||
Troubled debt restructurings (000's) (5) | 17,173 | 21,809 | 12,932 | 14,998 | 17,153 | ||||||||||||||
Nonperforming Loans to Total Loans | 4.72 | % | 4.76 | % | 4.50 | % | 4.50 | % | 3.96 | % | |||||||||
Nonperforming Assets to Total Assets | 4.74 | % | 4.50 | % | 4.37 | % | 4.43 | % | 3.95 | % | |||||||||
Allowance for Loan Losses to Total Loans | 2.23 | % | 2.26 | % | 2.33 | % | 2.26 | % | 2.29 | % | |||||||||
Allowance for Loan Losses to Total Loans Held for Investment | 2.26 | % | 2.29 | % | 2.37 | % | 2.31 | % | 2.36 | % | |||||||||
Allowance for Loan Losses to Nonperforming Loans | 47.31 | % | 47.58 | % | 51.75 | % | 50.25 | % | 57.72 | % | |||||||||
Net Charge-offs/Recoveries to Average Loans (annualized) | 1.20 | % | 1.04 | % | 2.73 | % | 1.71 | % | 3.08 | % | |||||||||
Capital Ratios: | |||||||||||||||||||
Equity to Total Assets | 7.05 | % | 6.75 | % | 6.44 | % | 6.57 | % | 6.41 | % | |||||||||
Tier 1 leverage ratio(1) | 7.99 | % | 7.58 | % | 7.14 | % | 7.07 | % | 7.04 | % | |||||||||
Tier 1 risk-based ratio(1) | 10.23 | % | 9.72 | % | 9.42 | % | 9.39 | % | 9.23 | % | |||||||||
Total risk-based capital ratio(1) | 11.49 | % | 10.98 | % | 10.68 | % | 10.65 | % | 10.49 | % | |||||||||
Non-GAAP disclosures(2): | |||||||||||||||||||
Tangible Book Value per Share | $ | 4.58 | $ | 4.45 | $ | 4.23 | $ | 5.53 | $ | 5.63 | |||||||||
Return on Tangible Equity (annualized) (3) | 6.34 | % | 8.49 | % | (58.92 | )% | (4.57 | )% | (0.02 | )% | |||||||||
Tangible Equity to Tangible Assets (3) | 6.88 | % | 6.57 | % | 6.25 | % | 6.17 | % | 6.01 | % | |||||||||
Efficiency Ratio | 66.41 | % | 59.60 | % | 121.07 | % | 79.86 | % | 70.63 | % | |||||||||
Notes:
(1) | Tier 1 leverage, Tier 1 risk-based, and Total risk-based ratios are ratios for the bank, Yadkin Valley Bank and Trust Company as reported on Consolidated Reports of Condition and Income for a Bank With Domestic Offices Only - FFIEC 041 |
(2) | Management uses these non-GAAP financial measures because it believes it is useful for evaluating our operations and performance over periods of time, as well as in managing and evaluating our business and in discussions about our operations and performance. Management believes these non-GAAP financial measures provides users of our financial information with a meaningful measure for assessing our financial results and credit trends, as well as comparison to financial results for prior periods. These non-GAAP financial measures should not be considered as a substitute for operating results determined in accordance with GAAP and may not be comparable to other similarly titled financial measures used by other companies. |
(3) | Tangible Equity is the difference of shareholders' equity less the sum of goodwill and core deposit intangible. Tangible Assets are the difference of total assets less the sum of goodwill and core deposit intangible. |
(4)Past due numbers exclude loans classified as nonperforming.
(5)Troubled debt restructured loans exclude loans classified as nonperforming.
(6) | Ratio is calculated by taking non-interest income as a percentage of net interest income after provision for loan losses plus total non-interest income. |
Yadkin Valley Financial Corporation | |||||||||||||||||||||
Average Balance Sheets and Net Interest Income Analysis (Unaudited) | |||||||||||||||||||||
Three Months Ended December 31, | |||||||||||||||||||||
2011 | 2010 | ||||||||||||||||||||
(Dollars in Thousands) | |||||||||||||||||||||
Average | Yield/ | Average | Yield/ | ||||||||||||||||||
Balance | Interest | Rate | Balance | Interest | Rate | ||||||||||||||||
INTEREST EARNING ASSETS | |||||||||||||||||||||
Total loans (1,2) | $ | 1,480,509 | $ | 19,224 | 5.15 | % | $ | 1,708,178 | $ | 22,545 | 5.24 | % | |||||||||
Investment securities | 313,760 | 1,959 | 2.48 | % | 308,650 | 2,511 | 3.23 | % | |||||||||||||
Interest-bearing deposits & federal funds sold | 111,936 | 78 | 0.28 | % | 153,691 | 95 | 0.25 | % | |||||||||||||
Total average earning assets (1) | 1,906,205 | 21,261 | 4.43 | % | (6) | 2,170,519 | 25,151 | 4.60 | % | ||||||||||||
Non-interest earning assets | 123,655 | 145,760 | |||||||||||||||||||
Total average assets | $ | 2,029,860 | $ | 2,316,279 | |||||||||||||||||
INTEREST BEARING LIABILITIES | |||||||||||||||||||||
Time deposits | $ | 917,019 | 4,286 | 1.85 | % | $ | 1,280,449 | 7,200 | 2.23 | % | |||||||||||
Other deposits | 618,461 | 554 | 0.36 | % | 527,697 | 1,020 | 0.77 | % | |||||||||||||
Borrowed funds | 110,758 | 504 | 1.81 | % | 120,413 | 660 | 2.17 | % | |||||||||||||
Total interest bearing liabilities | 1,646,238 | 5,344 | 1.29 | % | (7) | 1,928,559 | 8,880 | 1.83 | % | ||||||||||||
Non-interest bearing deposits | 228,398 | 219,818 | |||||||||||||||||||
Other liabilities | 16,653 | 16,136 | |||||||||||||||||||
Total average liabilities | 1,891,289 | 2,164,513 | |||||||||||||||||||
Shareholders' equity | 138,571 | 151,766 | |||||||||||||||||||
Total average liabilities and | |||||||||||||||||||||
shareholders' equity | $ | 2,029,860 | $ | 2,316,279 | |||||||||||||||||
NET INTEREST INCOME/ | |||||||||||||||||||||
YIELD (3,4) | $ | 15,917 | 3.31 | % | $ | 16,271 | 2.97 | % | |||||||||||||
INTEREST SPREAD (5) | 3.14 | % | 2.77 | % | |||||||||||||||||
(1) | Yields related to securities and loans exempt from Federal income taxes are stated on a fully tax-equivalent basis, assuming a Federal income tax rate of 35%, reduced by the nondeductible portion of interest expense. |
(2) | The loan average includes loans on which accrual of interest has been discontinued. |
(3) | Net interest income is the difference between income from earning assets and interest expense. |
(4) | Net interest yield is net interest income divided by total average earning assets. |
(5) | Interest spread is the difference between the average interest rate received on earning assets and the average rate paid on interest bearing liabilities. |
(6) | Interest income for 2011 and 2010 includes $78,000 and $251,000, respectively, of accretion for purchase accounting adjustments related to loans acquired in the merger with American Community. |
(7) | Interest expense for 2011 and 2010 includes $101,000 and $119,000, respectively, of accretion for purchase accounting adjustments relate to deposits and borrowings acquired in the merger with American Community. |
Yadkin Valley Financial Corporation | |||||||||||||||||||||
Average Balance Sheets and Net Interest Income Analysis (Unaudited) | |||||||||||||||||||||
Twelve Months Ended December 31, | |||||||||||||||||||||
2011 | 2010 | ||||||||||||||||||||
(Dollars in Thousands) | |||||||||||||||||||||
Average | Yield/ | Average | Yield/ | ||||||||||||||||||
Balance | Interest | Rate | Balance | Interest | Rate | ||||||||||||||||
INTEREST EARNING ASSETS | |||||||||||||||||||||
Total loans (1,2) | $ | 1,534,929 | $ | 80,800 | 5.26 | % | $ | 1,696,469 | $ | 91,012 | 5.36 | % | |||||||||
Investment securities | 309,199 | 9,226 | 2.98 | % | 232,577 | 8,742 | 3.76 | % | |||||||||||||
Interest-bearing deposits & federal funds sold | 141,249 | 376 | 0.27 | % | 161,007 | 395 | 0.25 | % | |||||||||||||
Total average earning assets (1) | 1,985,377 | 90,402 | 4.55 | % | (6) | 2,090,053 | 100,149 | 4.79 | % | ||||||||||||
Non-interest earning assets | 142,193 | 142,102 | |||||||||||||||||||
Total average assets | $ | 2,127,570 | $ | 2,232,155 | |||||||||||||||||
INTEREST BEARING LIABILITIES | |||||||||||||||||||||
Time deposits | $ | 1,025,165 | 20,475 | 2.00 | % | $ | 1,258,639 | 28,396 | 2.26 | % | |||||||||||
Other deposits | 610,620 | 3,400 | 0.56 | % | 472,359 | 3,497 | 0.74 | % | |||||||||||||
Borrowed funds | 107,725 | 2,098 | 1.95 | % | 120,717 | 2,440 | 2.02 | % | |||||||||||||
Total interest bearing liabilities | 1,743,510 | 25,973 | 1.49 | % | (7) | 1,851,715 | 34,333 | 1.85 | % | ||||||||||||
Non-interest bearing deposits | 224,280 | 211,027 | |||||||||||||||||||
Other liabilities | 16,617 | 15,012 | |||||||||||||||||||
Total average liabilities | 1,984,407 | 2,077,754 | |||||||||||||||||||
Shareholders' equity | 143,163 | 154,401 | |||||||||||||||||||
Total average liabilities and | |||||||||||||||||||||
shareholders' equity | $ | 2,127,570 | $ | 2,232,155 | |||||||||||||||||
NET INTEREST INCOME/ | |||||||||||||||||||||
YIELD (3,4) | $ | 64,429 | 3.25 | % | $ | 65,816 | 3.15 | % | |||||||||||||
INTEREST SPREAD (5) | 3.06 | % | 2.94 | % | |||||||||||||||||
(1) | Yields related to securities and loans exempt from Federal income taxes are stated on a fully tax-equivalent basis, assuming a Federal income tax rate of 35%, reduced by the nondeductible portion of interest expense. |
(2) | The loan average includes loans on which accrual of interest has been discontinued. |
(3) | Net interest income is the difference between income from earning assets and interest expense. |
(4) | Net interest yield is net interest income divided by total average earning assets. |
(5) | Interest spread is the difference between the average interest rate received on earning assets and the average rate paid on interest bearing liabilities. |
(6) | Interest income for 2011 and 2010 includes $577 and $1,611, respectively, of accretion for purchase accounting adjustments related to loans acquired in the merger with American Community. |
(7) | Interest expense for 2011 and 2010 includes $423 and $896, respectively, of accretion for purchase accounting adjustments relate to deposits and borrowings acquired in the merger with American Community. |