Attached files
| file | filename |
|---|---|
| 8-K - NATIONAL PENN BANCSHARES, INC. FORM 8-K - NATIONAL PENN BANCSHARES INC | npb8k.htm |
EXHIBIT 99.1
SLIDE PRESENTATION

National Penn Bancshares, Inc.
4th Quarter and Year-End 2011
Earnings Webcast
Earnings Webcast
5

1
Safe Harbor Regarding Forward Looking Statements
This presentation contains forward-looking information about National Penn Bancshares, Inc. that is intended to be covered by the safe harbor for forward-looking
statements provided by the Private Securities Litigation Reform Act of 1995. Forward-looking statements are statements that are not historical facts. These
statements can be identified by the use of forward-looking terminology such as “believe,” “expect,” “may,” “will,” “should,’’ “project,” ”could,” “plan,’’ “goal,” “potential,”
“pro forma,” “seek,” “intend,’’ or “anticipate’’ or the negative thereof or comparable terminology, and include discussions of strategy, financial projections, guidance
and estimates (including their underlying assumptions), statements regarding plans, objectives, expectations or consequences of announced transactions, and
statements about the future performance, operations, products and services of National Penn and its subsidiaries. National Penn cautions readers not to place undue
reliance on these statements.
National Penn’s business and operations are subject to a variety of risks, uncertainties and other factors. Consequently, actual results and experience may
materially differ from those contained in any forward-looking statements. Such risks, uncertainties and other factors that could cause actual results and experience to
differ from those projected include, but are not limited to, the following: increased capital requirements and other requirements or actions mandated by National
Penn’s regulators, National Penn’s ability to raise capital and maintain capital levels, variations in interest rates, deterioration in the credit quality of loans, the effect
of credit risk exposure, declines in the value of National Penn’s assets and the effect of any resulting impairment charges, recent and ongoing changes to the state
and federal regulatory schemes under which National Penn and other financial services companies operate (including the Dodd-Frank Act and regulations adopted
or to be adopted to implement that Act), competition from other financial institutions, interruptions or breaches of National Penn’s security systems, and the
development and maintenance of National Penn’s information technology. These risks and others are described in greater detail in National Penn’s Annual Report on
Form 10-K for the fiscal year ended December 31, 2010, as well as in National Penn’s Quarterly Reports on Form 10-Q and other documents filed by National Penn
with the SEC after the date thereof. National Penn makes no commitment to revise or update any forward-looking statements in order to reflect events or
circumstances occurring or existing after the date any forward-looking statement is made.
This presentation contains supplemental financial information determined by methods other than in accordance with Accounting Principles Generally Accepted in the
United States of America (“GAAP”). National Penn’s management uses these non-GAAP measures in its analysis of National Penn’s performance. These measures
should not be considered a substitute for GAAP basis measures nor should they be viewed as a substitute for operating results determined in accordance with GAAP.
Management believes the presentation of the following non-GAAP financial measures, which exclude the impact of the specified items, provides useful supplemental
information that is essential to a proper understanding of the financial results of National Penn.
l Tangible common equity excludes goodwill and intangible assets and preferred equity. Banking and financial institution regulators also exclude goodwill
and intangible assets from shareholders’ equity when assessing the capital adequacy of a financial institution. Tangible common equity provides a method
to assess the company’s tangible capital trends.
and intangible assets from shareholders’ equity when assessing the capital adequacy of a financial institution. Tangible common equity provides a method
to assess the company’s tangible capital trends.
l Tangible book value expresses tangible common equity on a per-share basis. Tangible book value provides a method to assess the level of tangible net
assets on a per-share basis.
assets on a per-share basis.
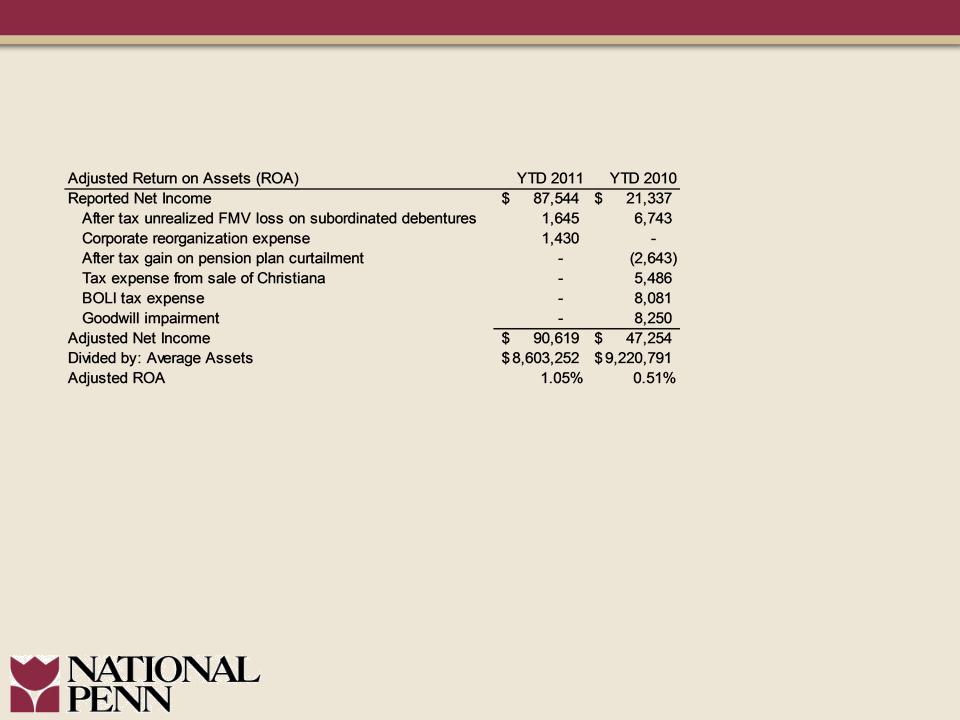
l Adjusted net income and return on assets exclude the effects of certain gains and losses, adjusted for taxes when applicable. Adjusted net income and
returns provide methods to assess earnings performance by excluding items that management believes are not comparable among the periods
presented.
returns provide methods to assess earnings performance by excluding items that management believes are not comparable among the periods
presented.
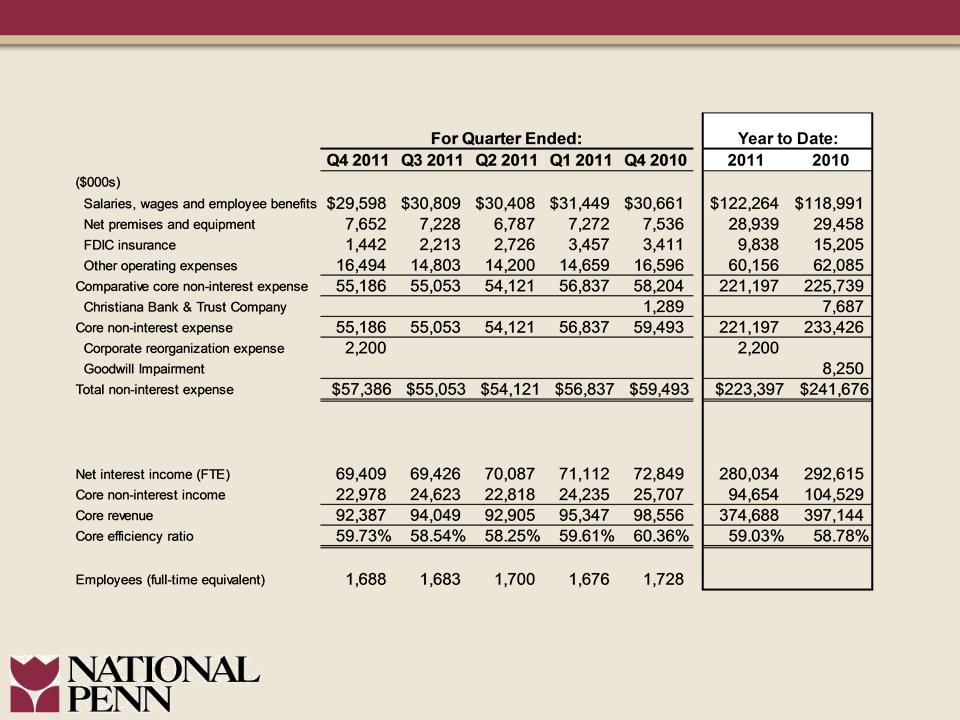
l Efficiency ratio expresses operating expenses as a percentage of fully-taxable equivalent net interest income plus non-interest income. Operating
expenses exclude items from non-interest expense that management believes are not comparable among the periods presented. Non-interest income is
adjusted to also exclude items that management believes are not comparable among the periods presented. Efficiency ratio is used as a method for
management to assess its operating expense level and to compare to financial institutions of varying sizes.
Management believes the use of non-GAAP measures will help readers compare National Penn’s current results to those of prior periods as presented in the
accompanying Financial Highlights and financial data tables.
accompanying Financial Highlights and financial data tables.
Non-GAAP Financial Measures
6

2
2011 Highlights
• Sustained strong earnings and returns
• Sustained improvement in asset quality
• Continued enhancement to strong capital base
• Positioned for future growth
• National Penn exceeds competitors in Forbes 2011
Best Banks in America ranking*
Best Banks in America ranking*
• Ranked 15th out of the 100 largest banks
*Forbes December 2011 “America’s Best and Worst Banks.”
7

3
Quarterly Earnings
*A non-GAAP measure.
8
4
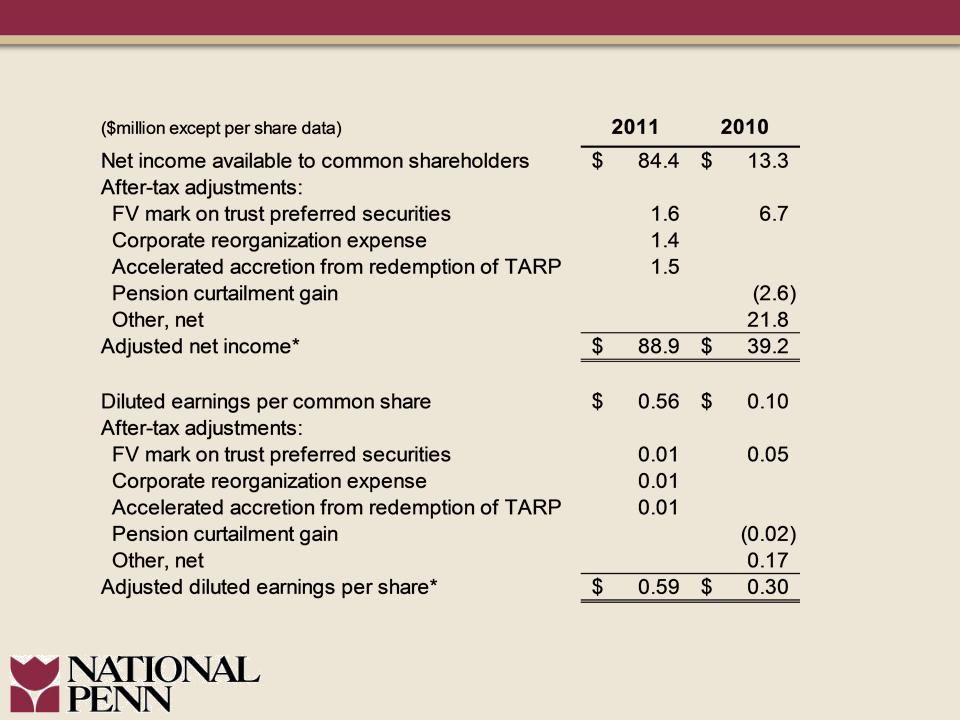
Full Year Earnings
*A non-GAAP measure.
9

Positive Adjusted Earnings Per Share* Trend
*Refer to Appendix for reconciliation of Non-GAAP measure.
5
Quarterly Trend
Full Year
10
6
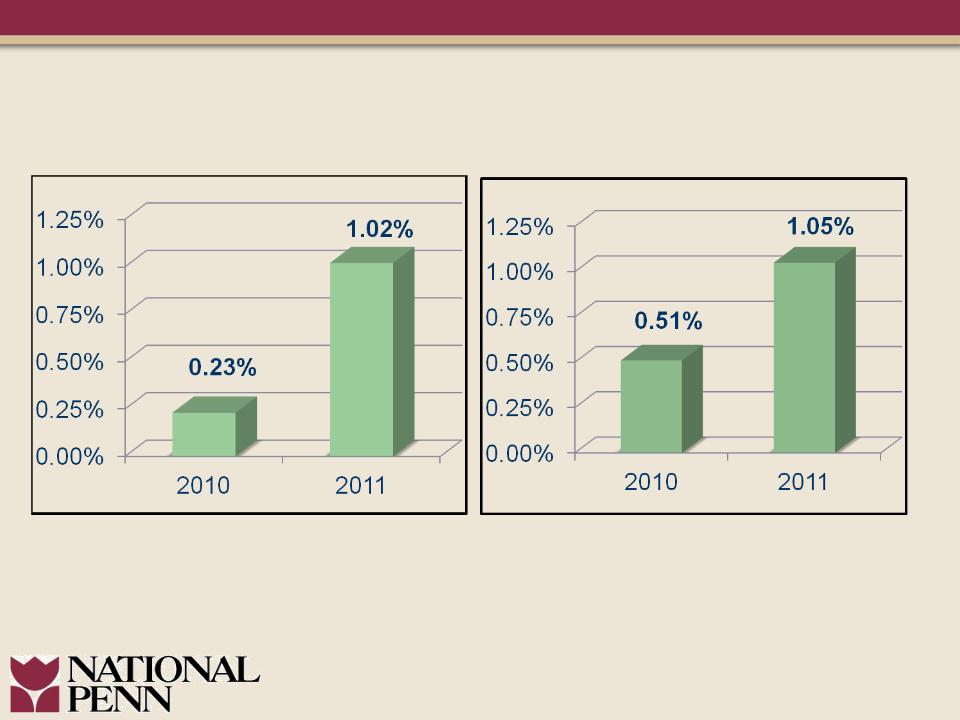
Improved Return on Assets
Adjusted ROA*
Reported ROA
*Refer to Appendix for reconciliation of Non-GAAP measure.
11
Loan Balances Stable
7
($million)
Excludes loans held for sale.
12

8
Sustained Asset Quality Improvement
Net Charge-Offs/Average Loans
Net Charge-Offs/Average Loans
13

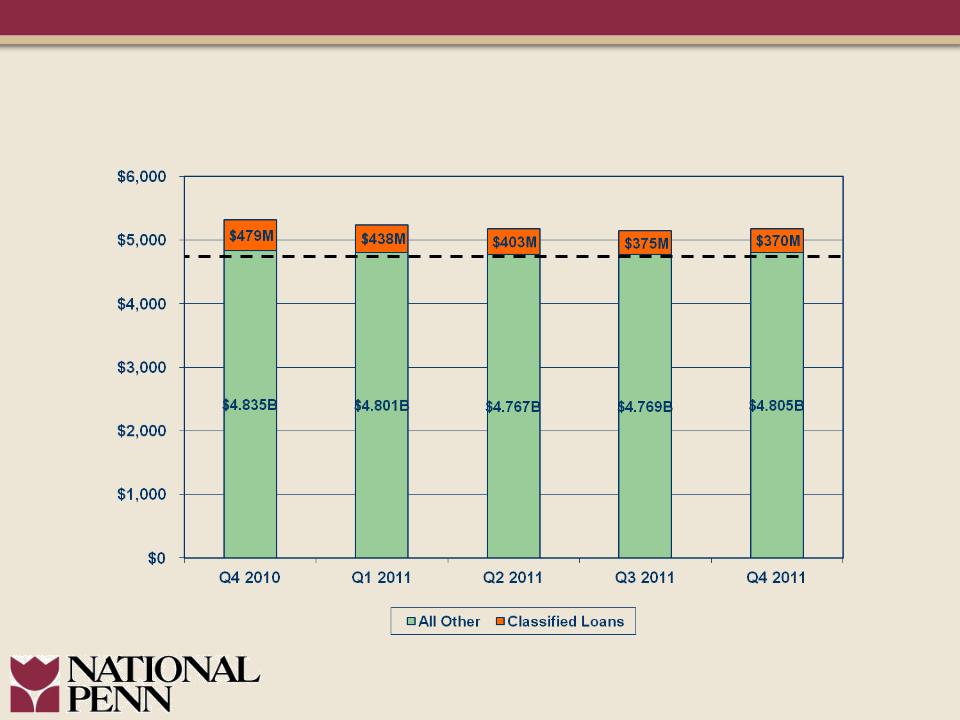
Sustained Asset Quality Improvement
Classified Loans & Provision Trends
Classified Loans & Provision Trends
9
($million)
($million)
14

10
Asset Quality Overview
15

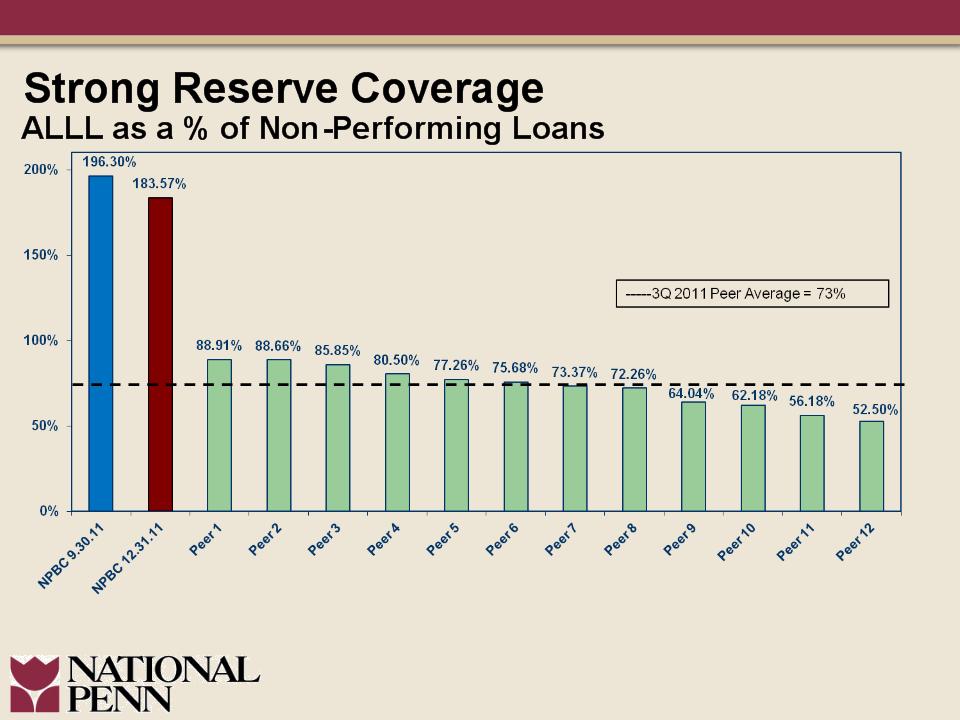
Strong Asset Quality
Non-Performing Loans as a % of Loans
Non-Performing Loans as a % of Loans
NPL’s include non-accrual loans plus renegotiated loans.
Peer data per SNL Financial as of 9.30.11.
Refer to the Appendix within this presentation for 2009 proxy peer listing.
11
-----3Q 2011 Peer Average = 2.51%
16
NPL’s include non-accrual loans plus renegotiated loans.
Peer data per SNL Financial as of 9.30.11.
Refer to the Appendix within this presentation for 2009 proxy peer listing.
12
17
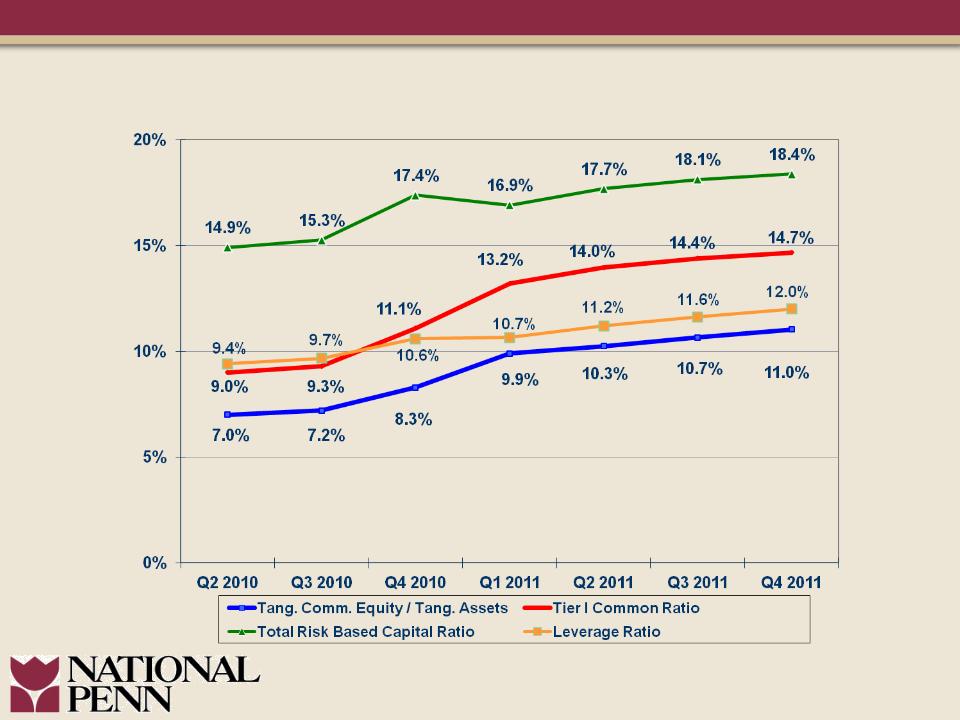
Capital Position Continual Enhancement
13
18

19

15
Non-Interest Income
20
16
Expense Management Maintained
21

17
• Capital management strategies
• Continued focus on asset quality and growth
• Manage net interest margin during low interest rate
environment
environment
• Win market share
• Re-risk appropriately
• Patient and disciplined approach
• Enhance shareholder value
Executing on Our Strategic Plan
22

18
23

Appendix
Reconciliation of Non-GAAP Measures
Reconciliation of Non-GAAP Measures
19
24
Appendix
Reconciliation of Non-GAAP Measures
Reconciliation of Non-GAAP Measures
20
25

Appendix
NPBC Peer Data - 2009 Proxy Statement*
NPBC Peer Data - 2009 Proxy Statement*
|
Peer
|
Ticker
|
Assets as of
9/30/11 (billions) |
|
BancorpSouth, Inc.
|
BXS
|
$13.2
|
|
F.N.B Corporation
|
FNB
|
10.0
|
|
First Midwest Bancorp, Inc.
|
FMBI
|
8.4
|
|
First Niagara Financial Group, Inc.
|
FNFG
|
31.2
|
|
FirstMerit Corporation
|
FMER
|
14.7
|
|
Fulton Financial Corporation
|
FULT
|
16.3
|
|
MB Financial, Inc.
|
MBFI
|
9.9
|
|
Old National Bancorp
|
ONB
|
8.9
|
|
Susquehanna Bancshares, Inc.
|
SUSQ
|
14.4
|
|
Trustmark Corporation
|
TRMK
|
9.7
|
|
Valley National Bancorp
|
VLY
|
14.2
|
|
Wintrust Financial Corporation
|
WTFC
|
15.9
|
*Note: Wilmington Trust (WL) excluded from peer data beginning with data for 1Q 2011 due to
acquisition by M&T. Whitney Holding Company (WTNY) excluded from peer data beginning with
2Q2011 due to acquisition by Hancock Holding Co. (HBHC).
acquisition by M&T. Whitney Holding Company (WTNY) excluded from peer data beginning with
2Q2011 due to acquisition by Hancock Holding Co. (HBHC).
26