Attached files
| file | filename |
|---|---|
| 8-K - FORM 8-K - FIRST NIAGARA FINANCIAL GROUP INC | d287808d8k.htm |
Exhibit 99.1
| Fourth Quarter 2011 Earnings Highlights January 26, 2012 John R. KoelmelPresident & Chief Executive OfficerGregory W. NorwoodChief Financial Officer |
| Safe Harbor Statement This presentation contains forward-looking information for First Niagara Financial Group, Inc. Such information constitutes forward-looking statements (within the meaning of the Private Securities Litigation Reform Act of 1995) which involve significant risks and uncertainties. Actual results may differ materially from the results discussed in these forward-looking statements. |
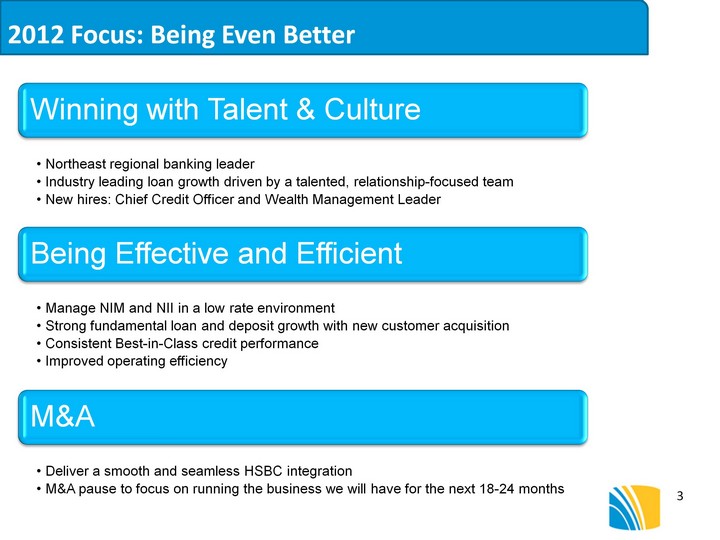
| 2012 Focus: Being Even Better 2012 Focus: Being Even Better |
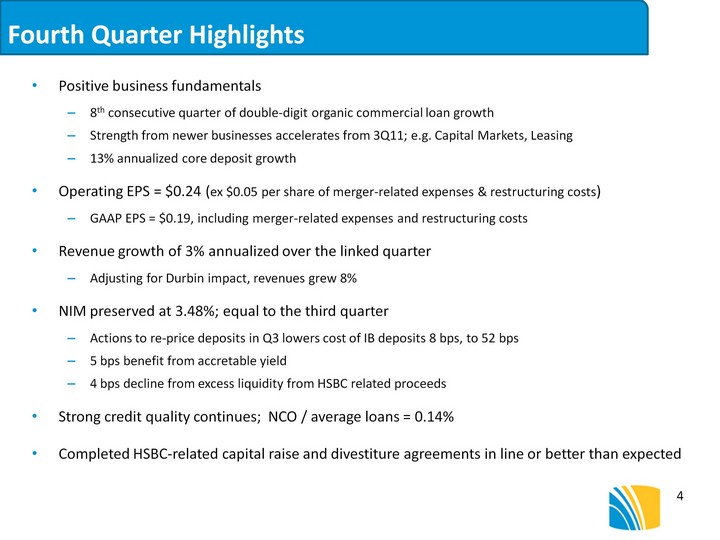
| Fourth Quarter Highlights Positive business fundamentals8th consecutive quarter of double-digit organic commercial loan growthStrength from newer businesses accelerates from 3Q11; e.g. Capital Markets, Leasing13% annualized core deposit growthOperating EPS = $0.24 (ex $0.05 per share of merger-related expenses & restructuring costs)GAAP EPS = $0.19, including merger-related expenses and restructuring costsRevenue growth of 3% annualized over the linked quarterAdjusting for Durbin impact, revenues grew 8%NIM preserved at 3.48%; equal to the third quarterActions to re-price deposits in Q3 lowers cost of IB deposits 8 bps, to 52 bps5 bps benefit from accretable yield 4 bps decline from excess liquidity from HSBC related proceedsStrong credit quality continues; NCO / average loans = 0.14%Completed HSBC-related capital raise and divestiture agreements in line or better than expected |

| (CHART) (CHART) (CHART) (CHART) Delivering on Organic Loan Growth Opportunity Growth driven by continued market share gains, moving up-market, and deepening customer relationships Eastern PA Upstate NY Western PA Capital Markets - Multi Region Total Loan Balances$ millions +7% YOY 4% of Bank's 10% YOYOrganic Growth +27% YOY +4% YOY 1% of Bank's 10% YOYOrganic Growth +$200M YOY 2% of Bank's 10% YOYOrganic Growth 3% of Bank's 10% YOYOrganic Growth |
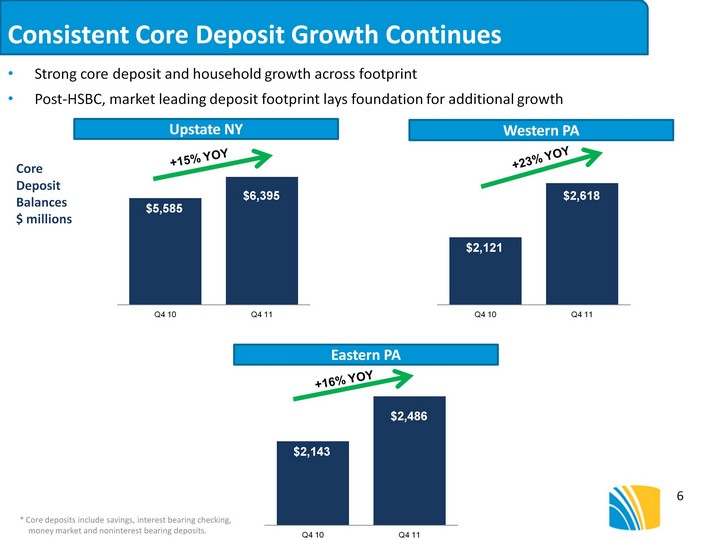
| Consistent Core Deposit Growth Continues Strong core deposit and household growth across footprintPost-HSBC, market leading deposit footprint lays foundation for additional growth * Core deposits include savings, interest bearing checking, money market and noninterest bearing deposits. Eastern PA Upstate NY Western PA Core Deposit Balances$ millions +16% YOY +15% YOY +23% YOY (CHART) (CHART) (CHART) |

| Best-in-Class Credit Quality A Key Differentiator 40% of loan book supported by credit markNo-boom no-bust markets limit loss contentBuilding reserves to support industry-leading organic growth engine Net Charge-Offs to Average Loans (%) Nonaccrual Loans to Total Loans (%) Source: SNL Financial. Note: FNFG legacy loans excludes acquired loans which are marked to fair value at acquisition.Peers include: BBT, COF, CMA, FITB, FHN, HBAN, KEY, MTB, PNC, RF, STI, SNV, USB, WFC, and ZIONNote: 4Q11 nonaccrual to total loan ratio for each peer bank is sourced from GAAP earnings releases. Regulatory FR-Y9C data is used for prior periods. |
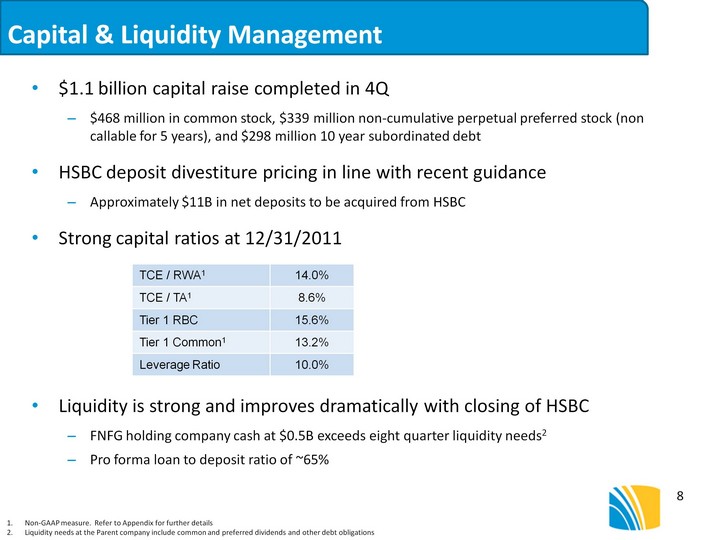
| Capital & Liquidity Management $1.1 billion capital raise completed in 4Q$468 million in common stock, $339 million non^cumulative perpetual preferred stock (non callable for 5 years), and $298 million 10 year subordinated debtHSBC deposit divestiture pricing in line with recent guidance Approximately $11B in net deposits to be acquired from HSBCStrong capital ratios at 12/31/2011Liquidity is strong and improves dramatically with closing of HSBCFNFG holding company cash at $0.5B exceeds eight quarter liquidity needs2Pro forma loan to deposit ratio of ~65% Non-GAAP measure. Refer to Appendix for further detailsLiquidity needs at the Parent company include common and preferred dividends and other debt obligations TCE / RWA1 14.0% TCE / TA1 8.6% Tier 1 RBC 15.6% Tier 1 Common1 13.2% Leverage Ratio 10.0% |

| 4Q11 Financial Summary $3.6 million in accretable yield recapture included in NIINet HSBC impact on NII = +$1 millionImplementation of Durbin reduced fees by ~$4 million QOQProvision includes $2.1 million for acquired loans; NCOs = $5.8 millionExpense base reflective of continued investmentsHigher effective tax rate due to adjustments to 2010 tax returns Excludes merger and acquisition integration expenses and restructuring charges. Operating results represent non-GAAP measures. Refer to the Appendix for further details. Notes: No recognition of noncumulative preferred dividends as no dividends were declared in the quarter. Growth rates are annualized. Notes: No recognition of noncumulative preferred dividends as no dividends were declared in the quarter. Growth rates are annualized. Notes: No recognition of noncumulative preferred dividends as no dividends were declared in the quarter. Growth rates are annualized. |
| Appendix Non-GAAP Measures - This presentation contains financial information determined by methods other than in accordance with accounting principles generally accepted in the United States of America (GAAP). The Company believes that these non-GAAP financial measures provide a meaningful comparison of the underlying operational performance of the Company, and facilitate investors' assessments of business and performance trends in comparison to others in the financial services industry. In addition, the Company believes the exclusion of these non-operating items enables management to perform a more effective evaluation and comparison of the Company's results and to assess performance in relation to the Company's ongoing operations. These disclosures should not be viewed as a substitute for financial measures determined in accordance with GAAP, nor are they necessarily comparable to non-GAAP performance measures that may be presented by other companies. Where non-GAAP disclosures are used in this presentation, the comparable GAAP financial measure, as well as the reconciliation to the comparable GAAP financial member, can be found in this Appendix. |
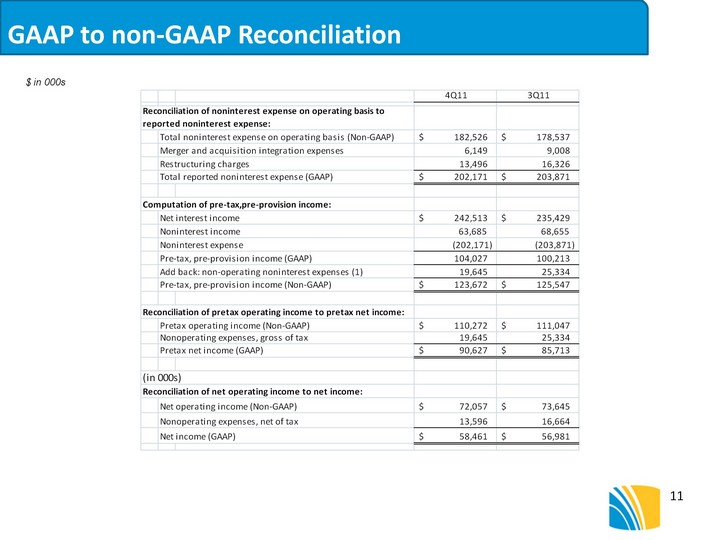
| GAAP to non-GAAP Reconciliation $ in 000s |
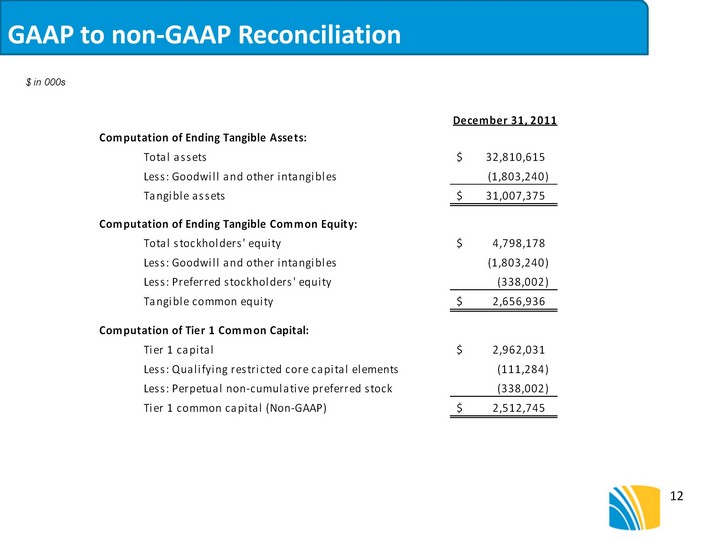
| GAAP to non-GAAP Reconciliation $ in 000s |