Attached files
| file | filename |
|---|---|
| 8-K - DELPHI AUTOMOTIVE PLC 8-K - Aptiv PLC | a50146651.htm |
| EX-99.1 - EXHIBIT 99.1 - Aptiv PLC | a50146651ex99_1.htm |
Exhibit 99.2

Forward‐Looking Statements This presentation, as well as other statements made by Delphi Automotive (“Delphi” or the “Company”), contain forward-looking statements that reflect, when made, the Company’s current views with respect to current events and financial performance. Such forward-looking statements are subject to many risks, uncertainties and factors relating to the Company’s operations and business environment, which may cause the actual results of the Company to be materially different from any future results, express or implied, by such forward-looking statements. All statements that address future operating, financial or business performance or the Company’s strategies or expectations are forward-looking statements. In some cases, you can identify these statements by forward-looking words such as “may,” “might,” “will,” “should,” “expects,” “plans,” “anticipates,” “believes,” “estimates,” “predicts,” “projects,” “potential,” “outlook” or “continue,” and other comparable terminology. Factors that could cause actual results to differ materially from these forward-looking statements include, but are not limited to, the following: global economic conditions, including conditions affecting the credit market, the cyclical nature of automotive sales and production; the potential disruptions in the supply of and changes in the competitive environment for raw material integral to our products; the Company’s ability to maintain contracts that are critical to its operations; the ability of the Company to attract, motivate and/or retain key executives; the ability of the Company to avoid or continue to operate during a strike, or partial work stoppage or slow down by any of its unionized employees or those of its principal customers, and the ability of the Company to attract and retain customers. Additional factors are discussed under the captions “Risk Factors” and “Management’s Discussion and Analysis of Financial Condition and Results of Operations” in the Company’s filings with the Securities and Exchange Commission. New risks and uncertainties arise from time to time, and it is impossible for us to predict these events or how they may affect the Company. It should be remembered that the price of the ordinary shares and any income from them can go down as well as up. Delphi disclaims any intention or obligation to update or revise any forward-looking statements, whether as a result of new information, future events and/or otherwise, except as may be required by law.
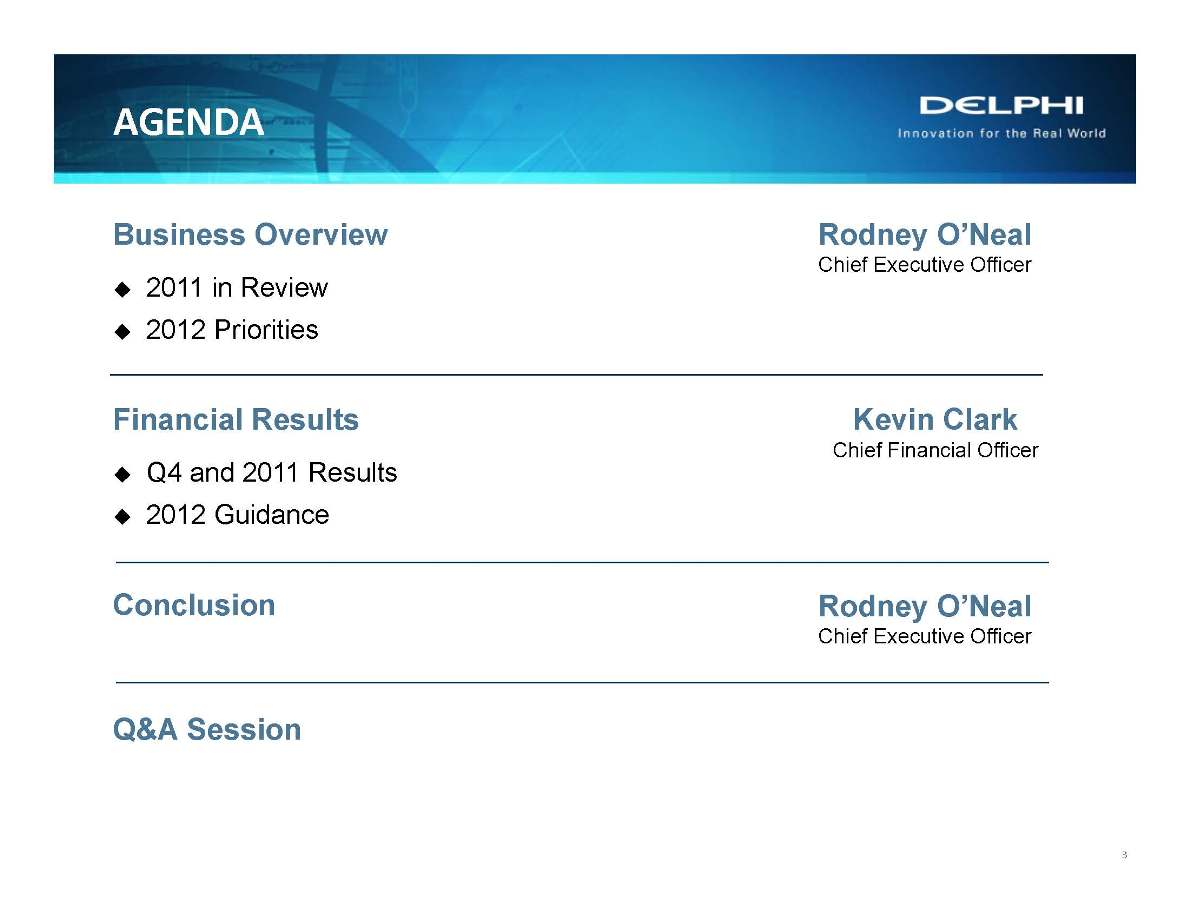
AGENDA Business Overview 2011 in Review 2012 Priorities Financial Results Q4 and 2011 Results 2012 Guidance Conclusion Q&A Session Rodney O’Neal Chief Executive Officer Kevin Clark Chief Financial Officer Rodney O’Neal Chief Executive Officer

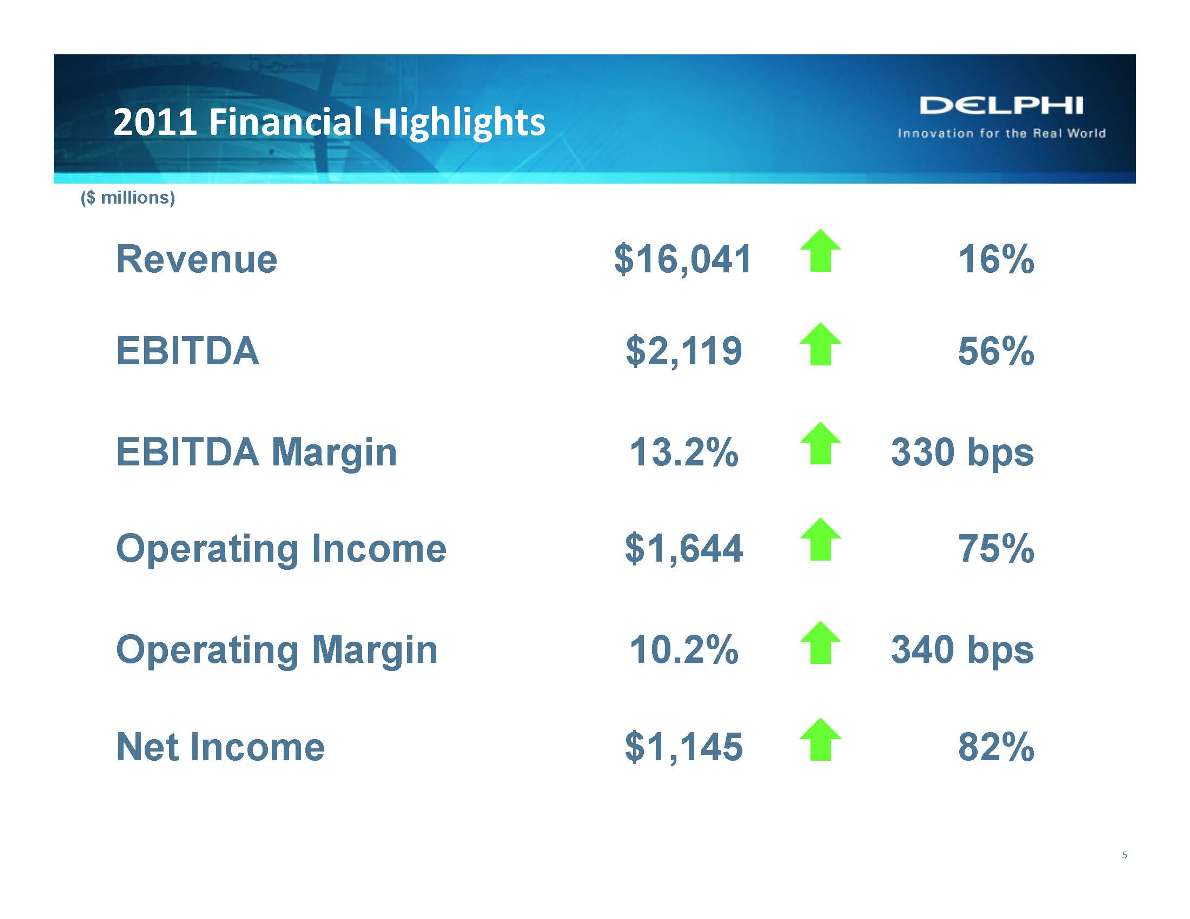
2011 Financial Highlights Revenue $16,041 16% EBITDA $2,119 56% EBITDA Margin 13.2% 330 bps Operating Income $1,644 75% Operating Margin 10.2% 340 bps Net Income $1,145 82%
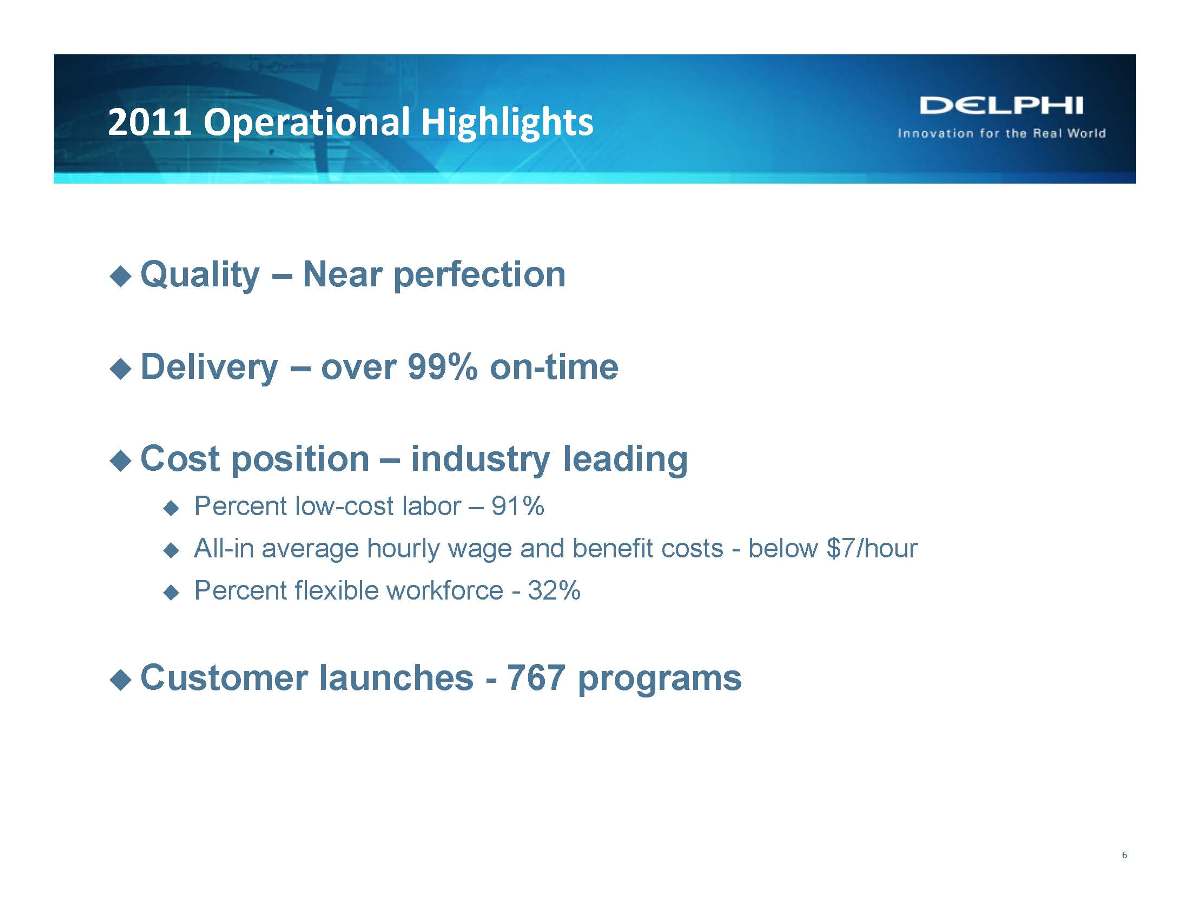
2011 Operational Highlights Quality – Near perfection Delivery – over 99% on-time Cost position – industry leading Percent low-cost labor – 91% All-in average hourly wage and benefit costs - below $7/hour Percent flexible workforce - 32% Customer launches - 767 programs

2011 Major Launches Ford Explorer John Deere R6 Volvo XC60 Ferrari 458 Spider Mercedes M-Class Hyundai Elantra
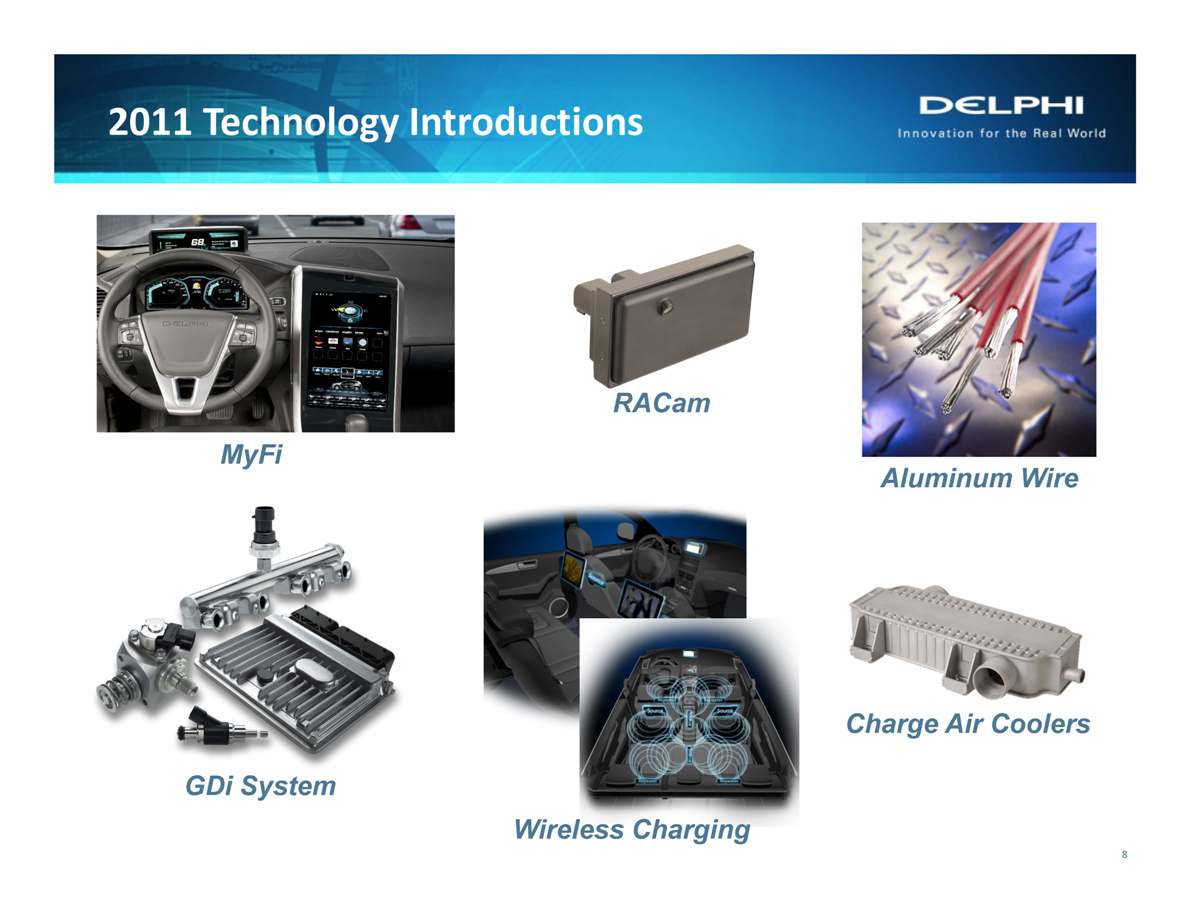
2011 Technology Introductions MyFi Charge Air Coolers Wireless Charging RACam GDi System Aluminum Wire
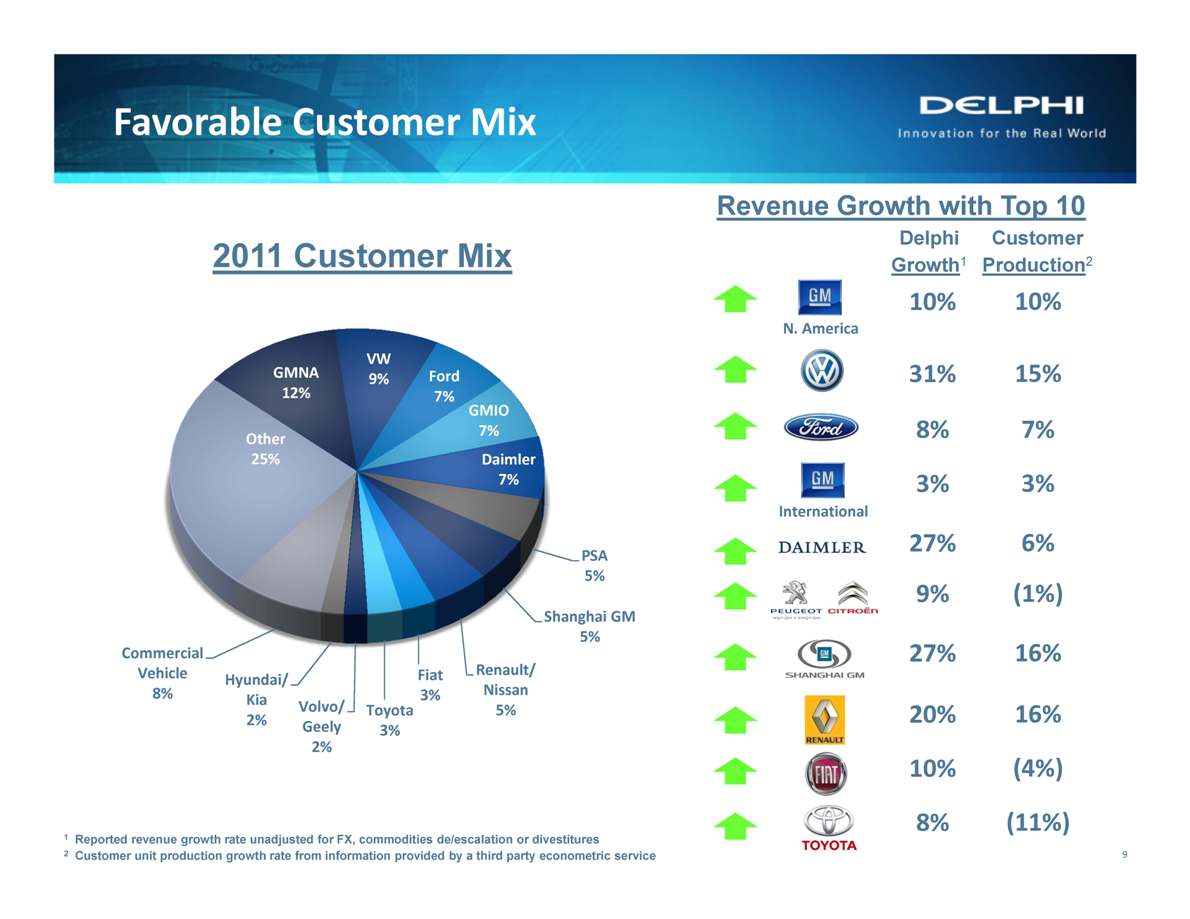
Favorable Customer Mix 10% 31% 8% 3% 27% 9% 27% 20% 10% 8% 2011 Customer Mix Revenue Growth with Top 10 Delphi Customer Growth1 Production2 9 N. America International 10% 15% 7% 3% 6% (1%) 16% 16% (4%) (11%) 1 Reported revenue growth rate unadjusted for FX, commodities de/escalation or divestitures 2 Customer unit production growth rate from information provided by a third party econometric service
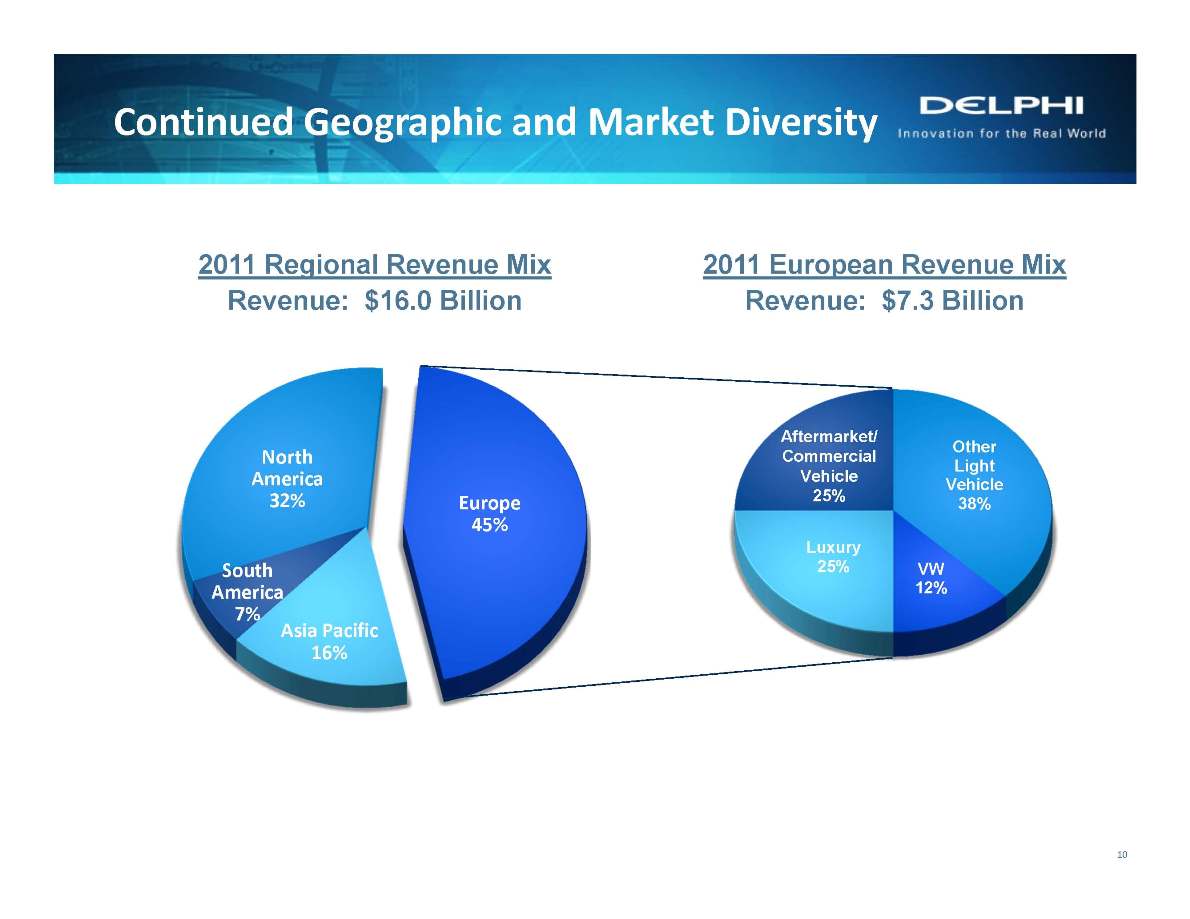
Continued Geographic and Market Diversity 2011 Regional Revenue Mix Revenue: $16.0 Billion 10 Other Light Vehicle 38% VW 12% Luxury 25% Aftermarket/ Commercial Vehicle 25% 2011 European Revenue Mix Revenue: $7.3 Billion North America 32% Europe 45% Asia Pacific 16% South America 7%
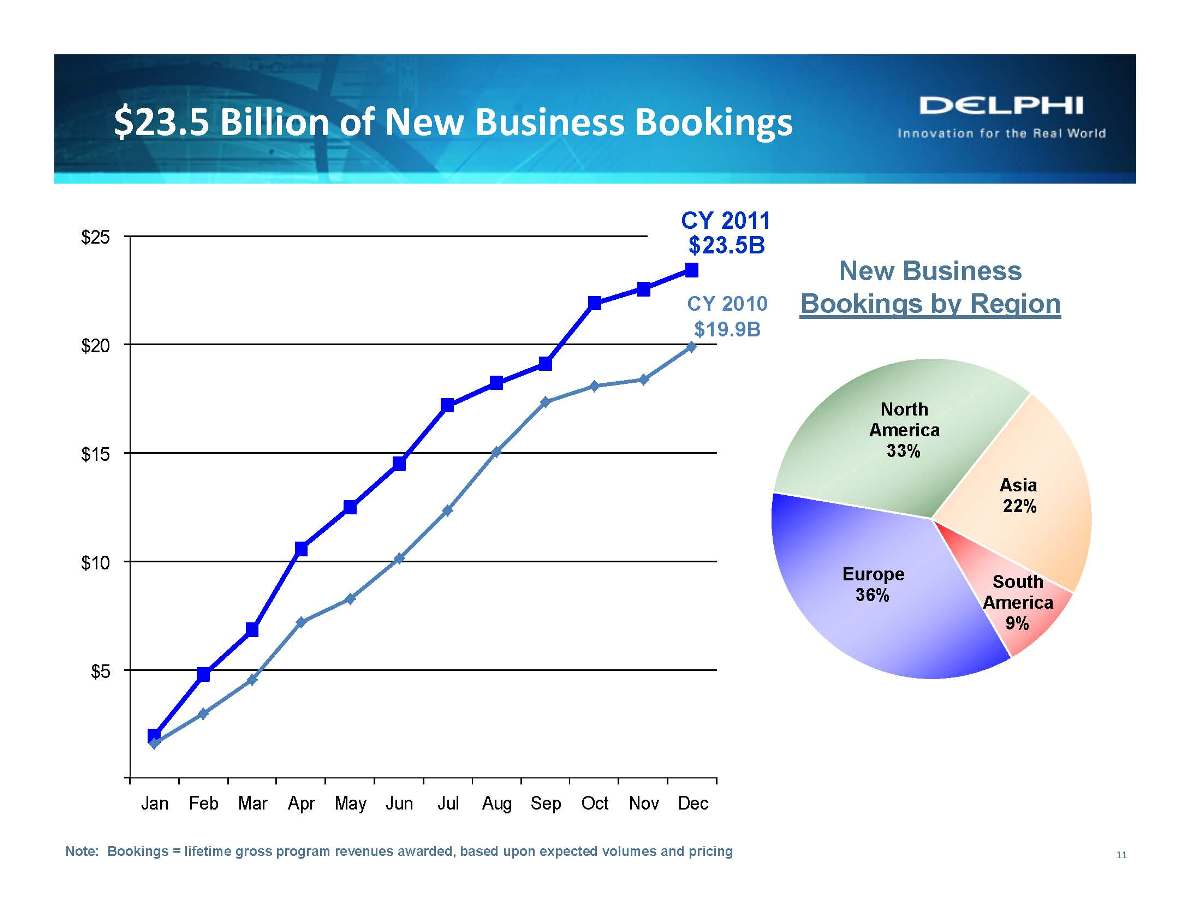
$23.5 Billion of New Business Bookings $25 Jan Feb Mar Apr May Jun Jul Aug Sep Oct Nov Dec CY 2011 $23.5B CY 2010 $19.9B $23.5 Billion of New Business Bookings Europe 36% North America 33% Asia 22% South America 9% 11 Note: Bookings = lifetime gross program revenues awarded, based upon expected volumes and pricing $20 $15 $10 $5 New Business Bookings by Region

Returned to Public Markets
2012 Priorities Introduce new technologies to accelerate revenue growth Continue focus on cost structure to expand margins Increase conversion of earnings to cash flow Continue customer and geographic rotation Build upon culture of “Execution Excellence”

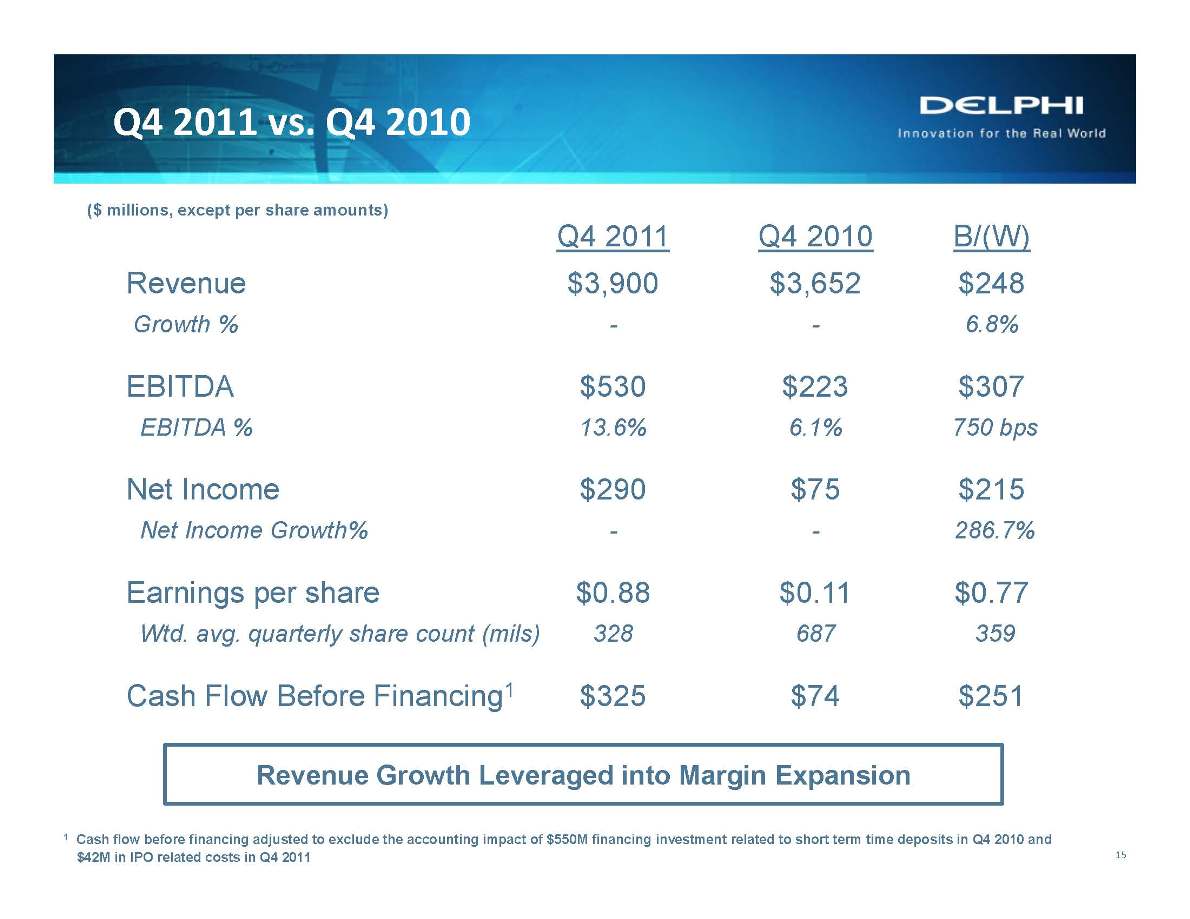
Q4 2011 vs. Q4 2010 ($ millions, except per share amounts) Q4 2011 Q4 2010 B/(W) Revenue $3,900 $3,652 $248 Growth % - - 6.8% EBITDA $530 $223 $307 EBITDA % 13.6% 6.1% 750 bps Net Income $290 $75 $215 Net Income Growth% - - 286.7% Earnings per share $0.88 $0.11 $0.77 Wtd. avg. quarterly share count (mils) 328 687 359 Cash Flow Before Financing1 $325 $74 $251 Revenue Growth Leveraged into Margin Expansion 1 Cash flow before financing adjusted to exclude the accounting impact of $550M financing investment related to short term time deposits in Q4 2010 and $42M in IPO related costs in Q4 2011
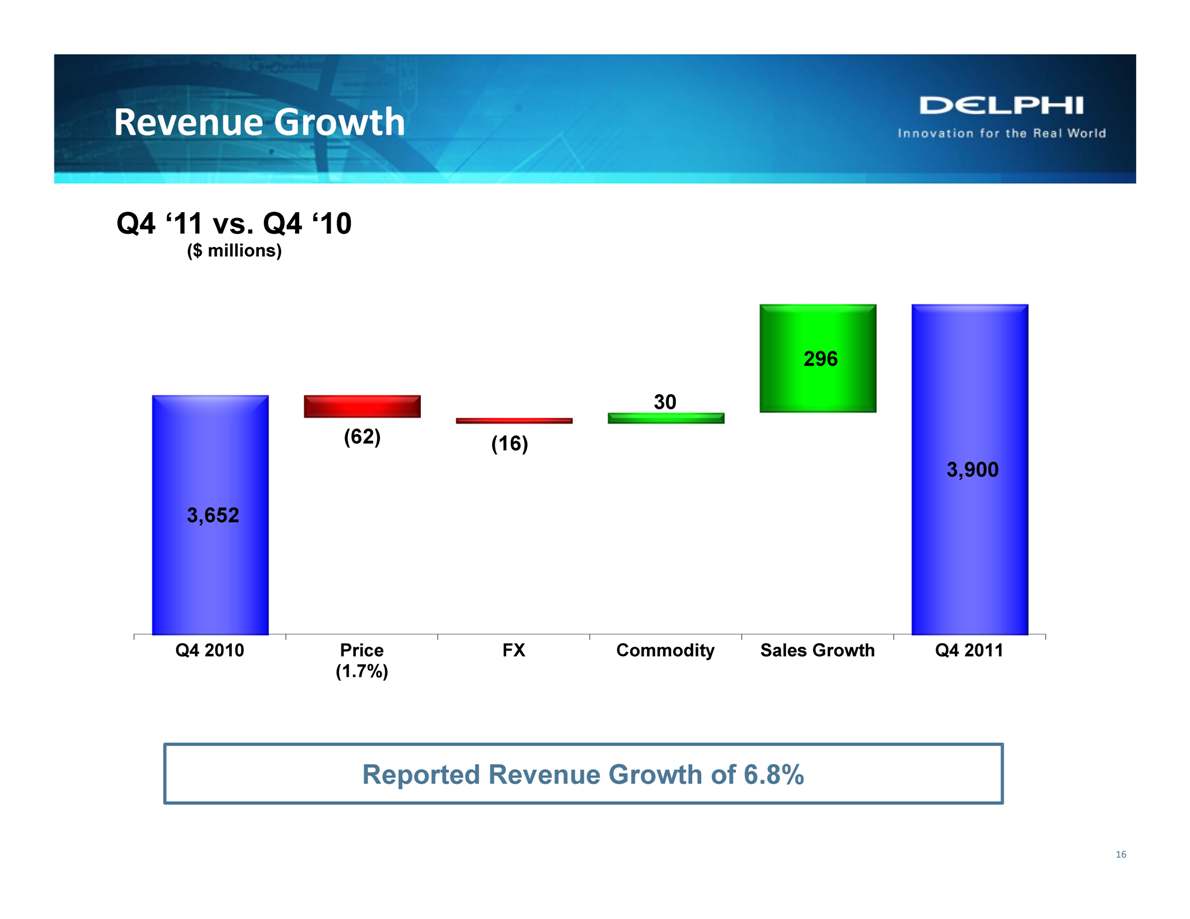
Revenue Growth 3,652 (62) (16) 30 296 3,900 3,000 4,000 Q4 2010 Price FX Commodity Sales Growth Q4 2011 Q4 ‘11 vs. Q4 ‘10 ($ millions) 16 (1.7%) Reported Revenue Growth of 6.8%
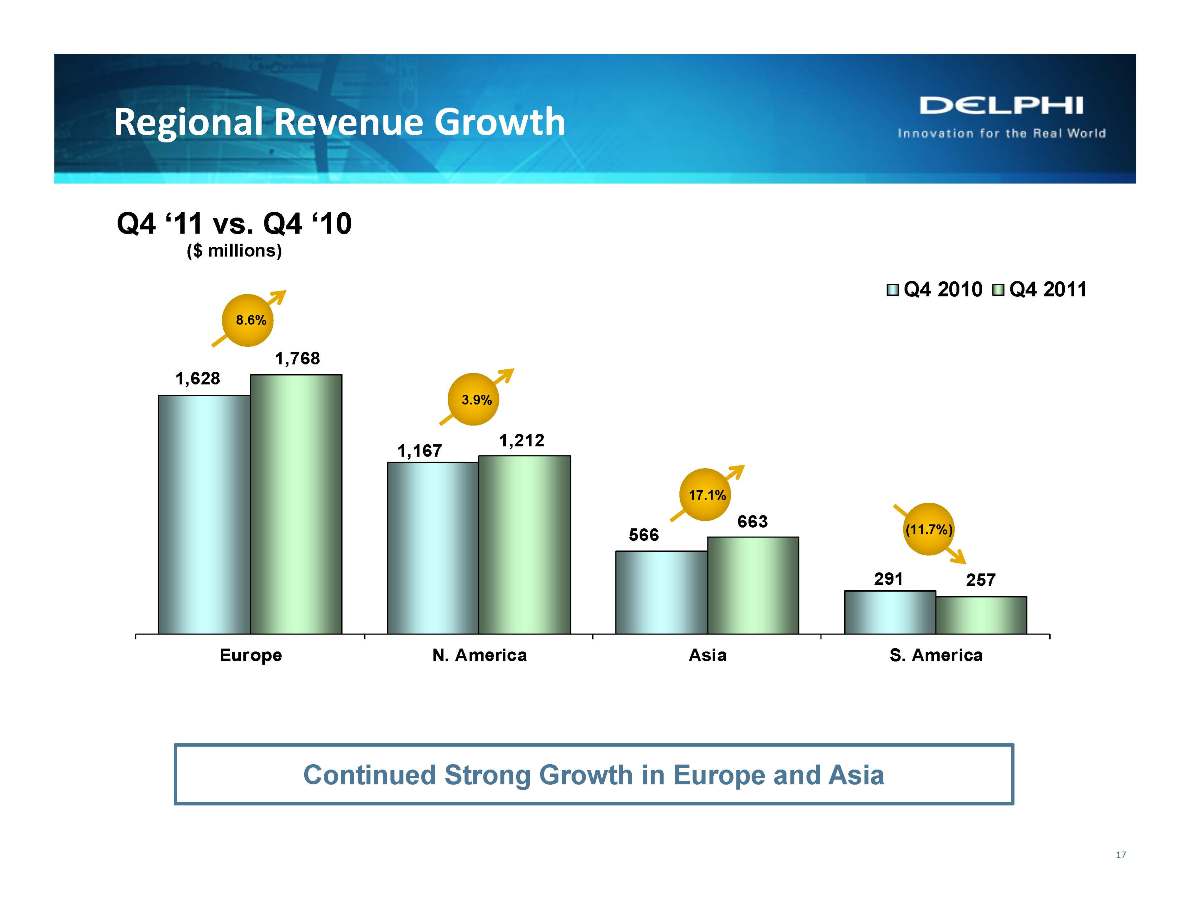
Regional Revenue Growth 1,628 1,167 566 291 1,768 1,212 663 257 Europe N. America Asia S. America Q4 2010 Q4 2011 Q4 ‘11 vs. Q4 ‘10 ($ millions) Continued Strong Growth in Europe and Asia
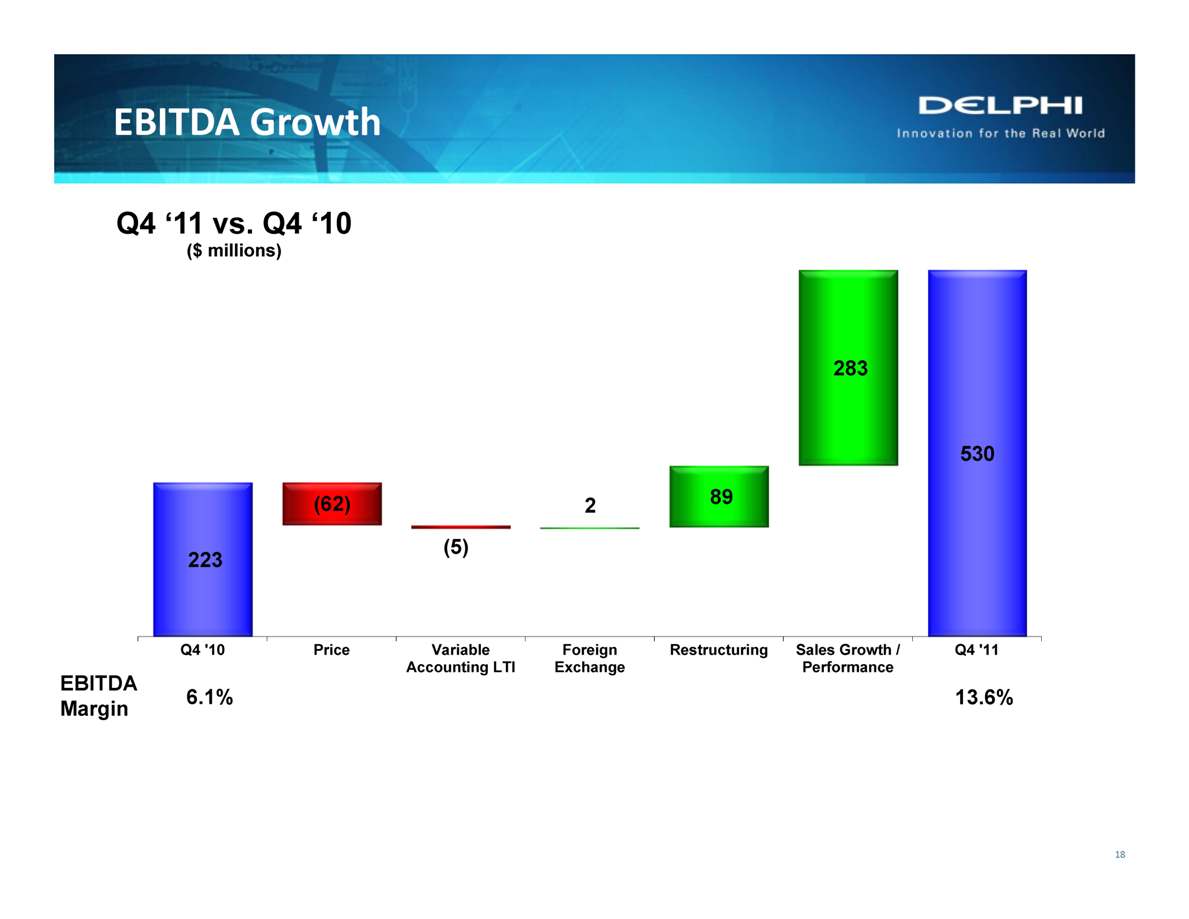
($ Millions) - 50 100 150 200 250 300 350 400 450 500 550 223 (62) (5) 2 89 283 530 - 50 100 150 200 250 300 350 400 450 500 550 Q4 '10 Price Variable Accounting LTI Foreign Exchange Restructuring Sales Growth / Performance Q4 '11 EBITDA EBITDA Margin 6.1% 13.6%
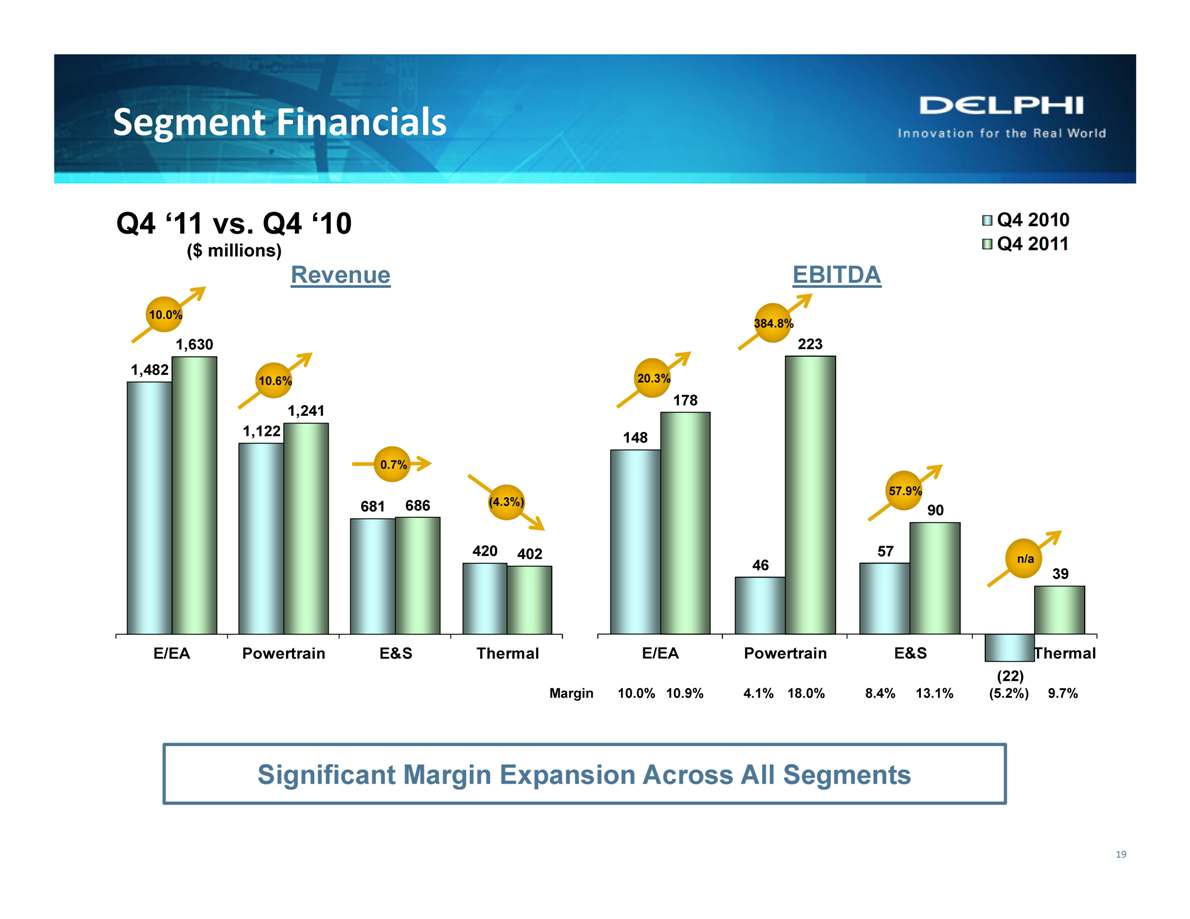
Segment Financials 19 10.0% 10.6% 0.7% 148 46 57 (22) 178 223 90 39 E/EA Powertrain E&S Thermal 20.3% 384.8% 57.9% n/a Q4 ‘11 vs. Q4 ‘10 ($ millions) (4.3%) Margin 10.0% 10.9% 4.1% 18.0% 8.4% 13.1% (5.2%) 9.7% Significant Margin Expansion Across All Segments Revenue E/EA Powertrain E&S Thermal
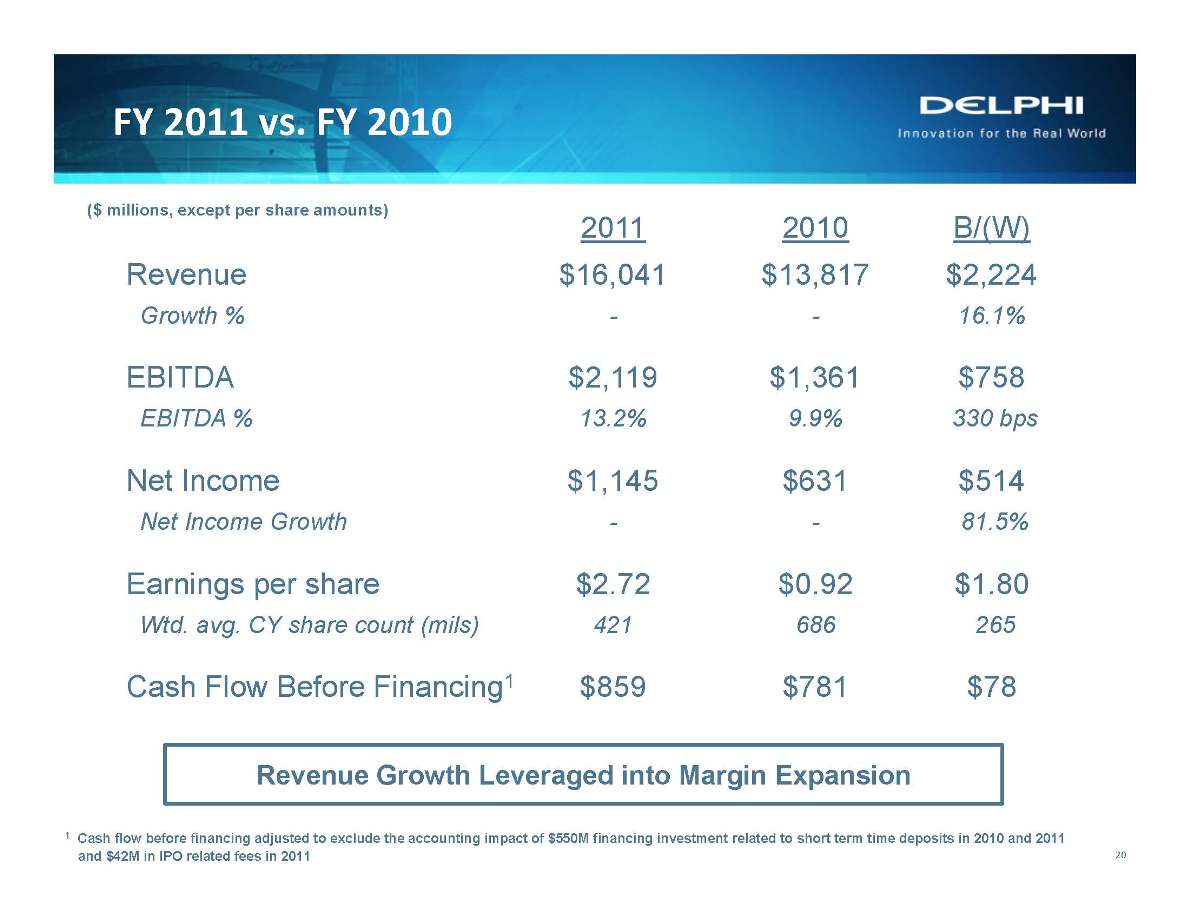
FY 2011 vs. FY 2010 20 1 Cash flow before financing adjusted to exclude the accounting impact of $550M financing investment related to short term time deposits in 2010 and 2011 and $42M in IPO related fees in 2011 ($ millions, except per share amounts) Revenue Growth Leveraged into Margin Expansion 2011 2010 B/(W) Revenue $16,041 $13,817 $2,224 Growth % - - 16.1% EBITDA $2,119 $1,361 $758 EBITDA % 13.2% 9.9% 330 bps Net Income $1,145 $631 $514 Net Income Growth - - 81.5% Earnings per share $2.72 $0.92 $1.80 Wtd. avg. CY share count (mils) 421 686 265 Cash Flow Before Financing1 $859 $781 $78
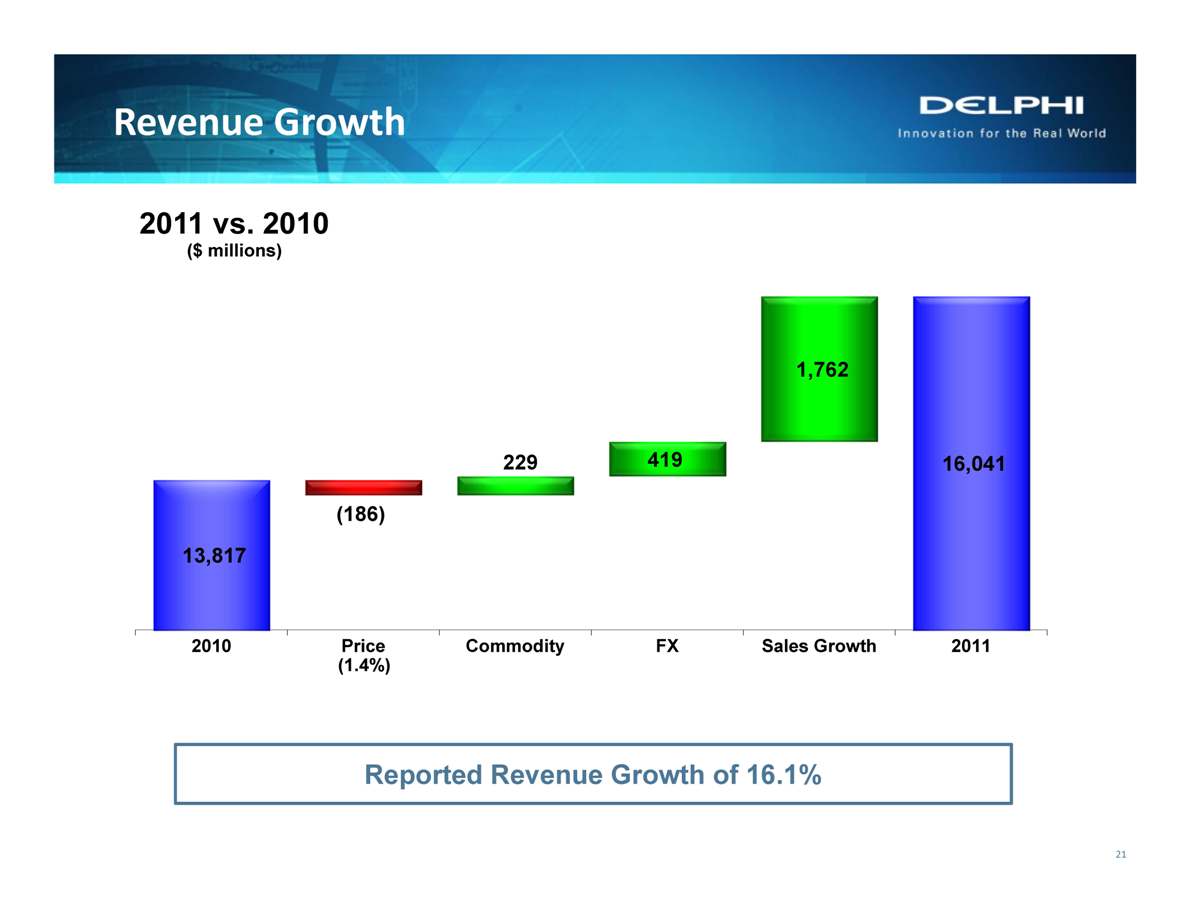
Revenue Growth 13,817 (186) 229 419 1,762 16,041 12,000 13,000 14,000 15,000 16,000 17,000 2010 Price Commodity FX Sales Growth 2011 2011 vs. 2010 ($ millions) 21 (1.4%) Reported Revenue Growth of 16.1%
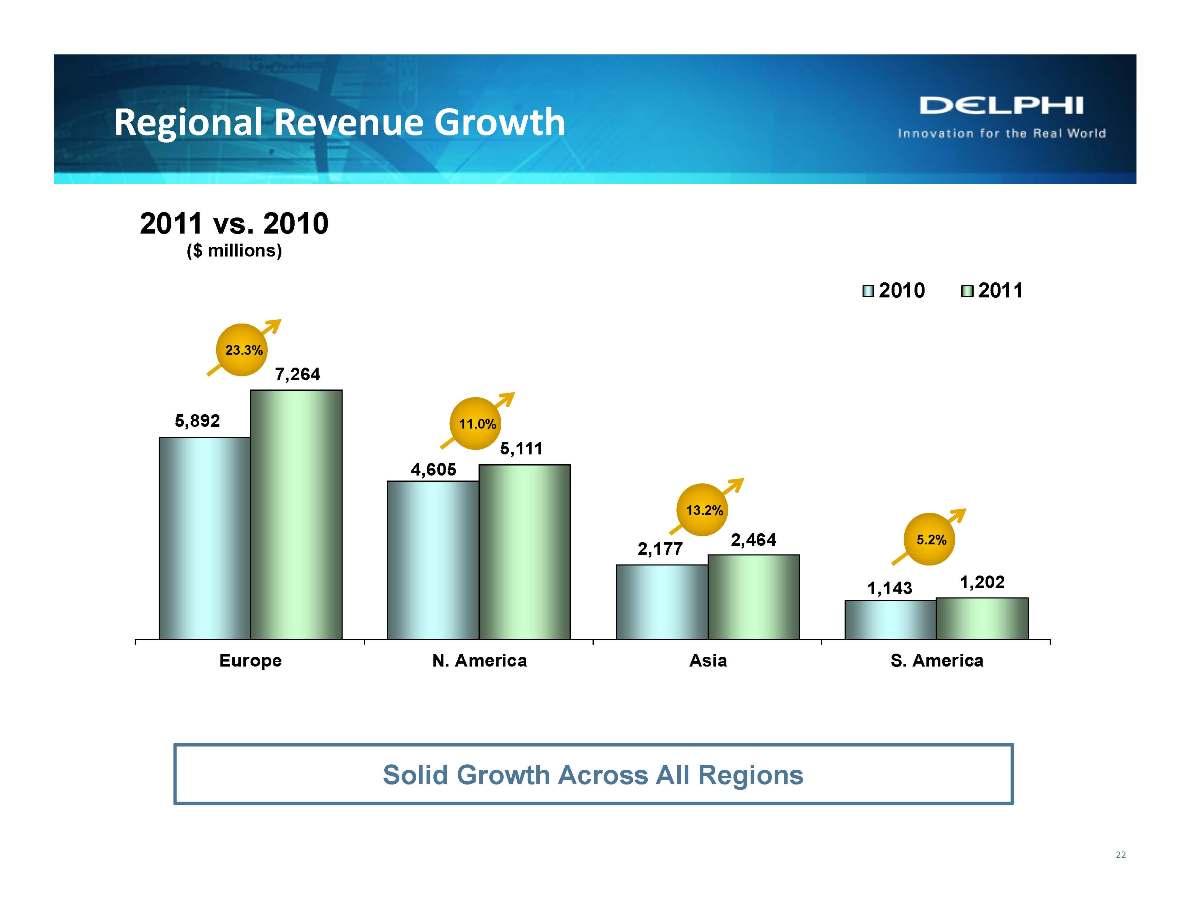
Regional Revenue Growth 5,892 4,605 2,177 1,143 7,264 5,111 2,464 1,202 Europe N. America Asia S. America 2010 2011 2011 vs. 2010 ($ millions) 22 23.3% 11.0% 13.2% 5.2% Solid Growth Across All Regions
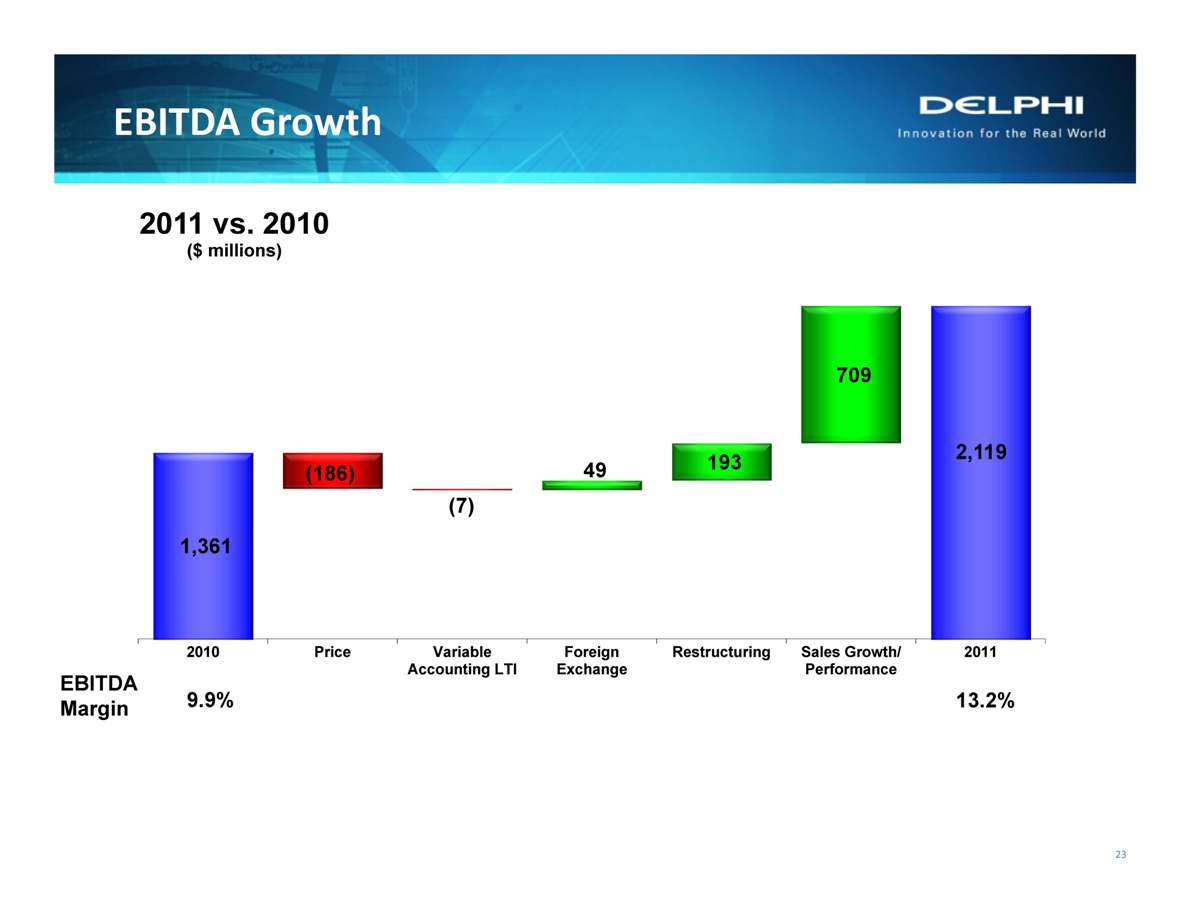
EBITDA Growth EBITDA = Operating Income + Depreciation/Amortization 23 2011 vs. 2010 ($ millions) 1,361 (186) (7) 49 193 709 2,119 400 450 500 550 600 650 700 750 800 850 900 950 1,000 1,050 1,100 1,150 1,200 1,250 1,300 1,350 1,400 1,450 1,500 1,550 1,600 1,650 1,700 1,750 1,800 1,850 1,900 1,950 2,000 2,050 2,100 2,150 2,200 2010 Price Variable Accounting LTI Foreign Exchange Restructuring Sales Growth/ Performance 2011
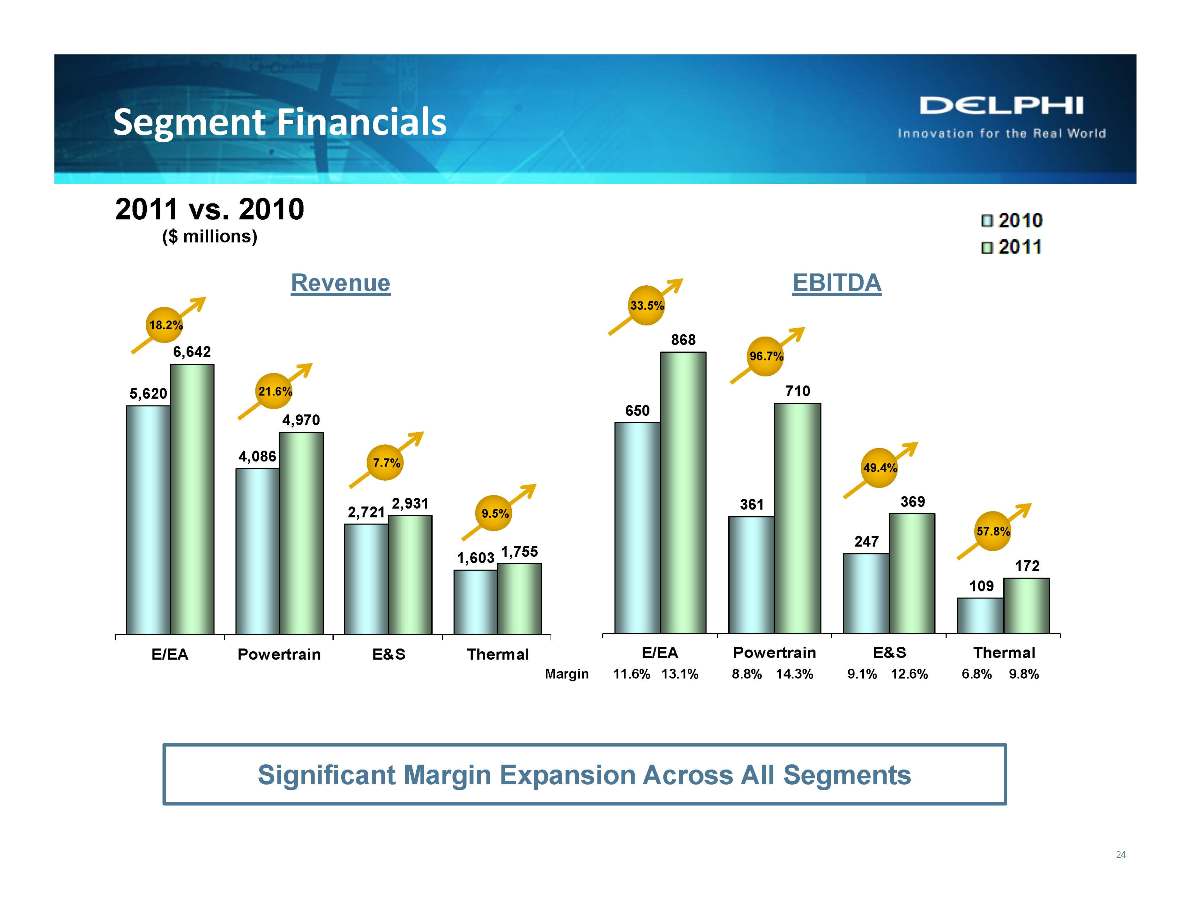
Segment Financials 2011 vs. 2010 ($ millions) 24 18.2% 21.6% 7.7% 9.5% 650 361 247 109 868 710 369 172 E/EA Powertrain E&S Thermal 33.5% 96.7% 49.4% 57.8% Margin 11.6% 13.1% 8.8% 14.3% 9.1% 12.6% 6.8% 9.8% Revenue EBITDA Significant Margin Expansion Across All Segments E/EA Powertrain E&S Thermal
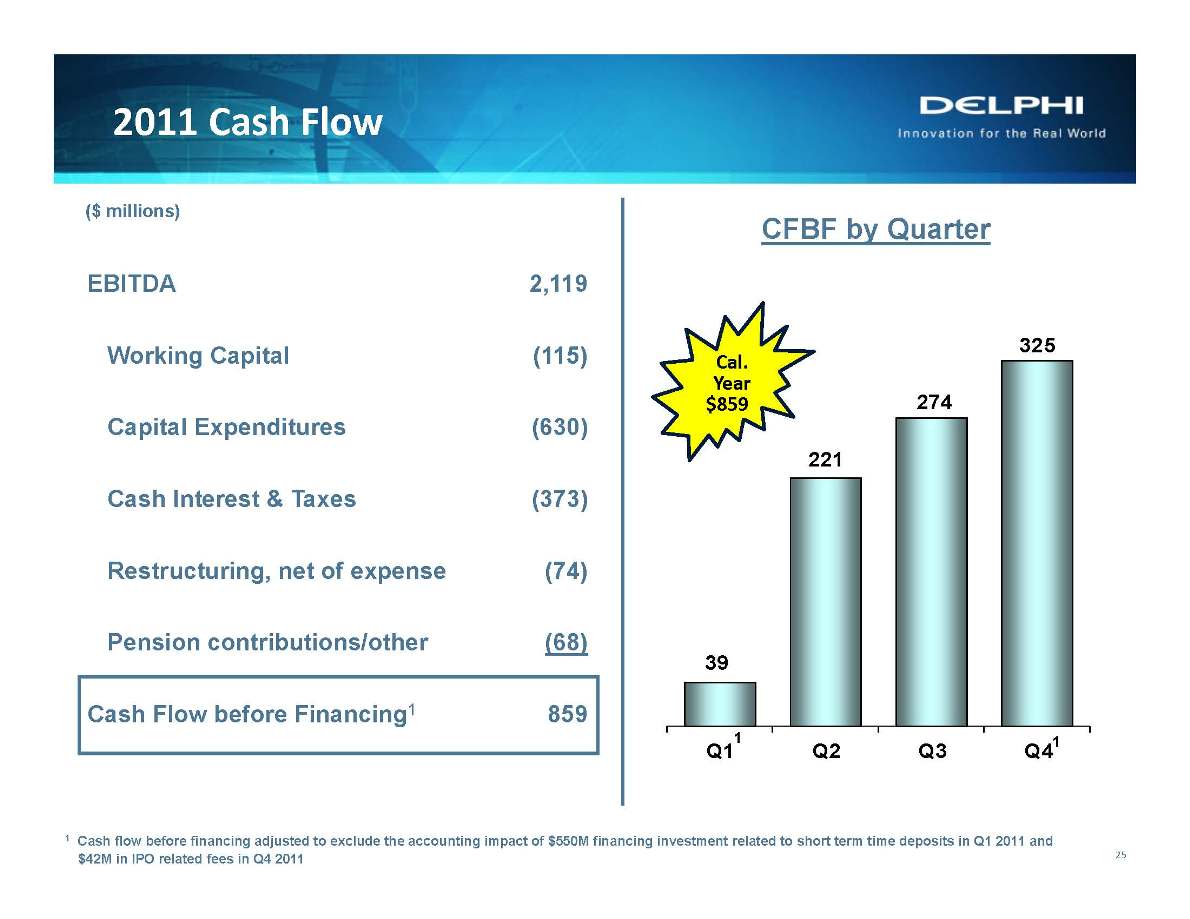
EBITDA 2,119 Working Capital (115) Capital Expenditures (630) Cash Interest & Taxes (373) Restructuring, net of expense (74) Pension contributions/other (68) Cash Flow before Financing1 859 2011 ($ millions) 221 274 325 Q1 1 Q2 Q3 Q4 1 CFBF by Quarter 1 Cash flow before financing adjusted to exclude the accounting impact of $550M financing investment related to short term time deposits in Q1 2011 and $42M in IPO related fees in Q4 2011
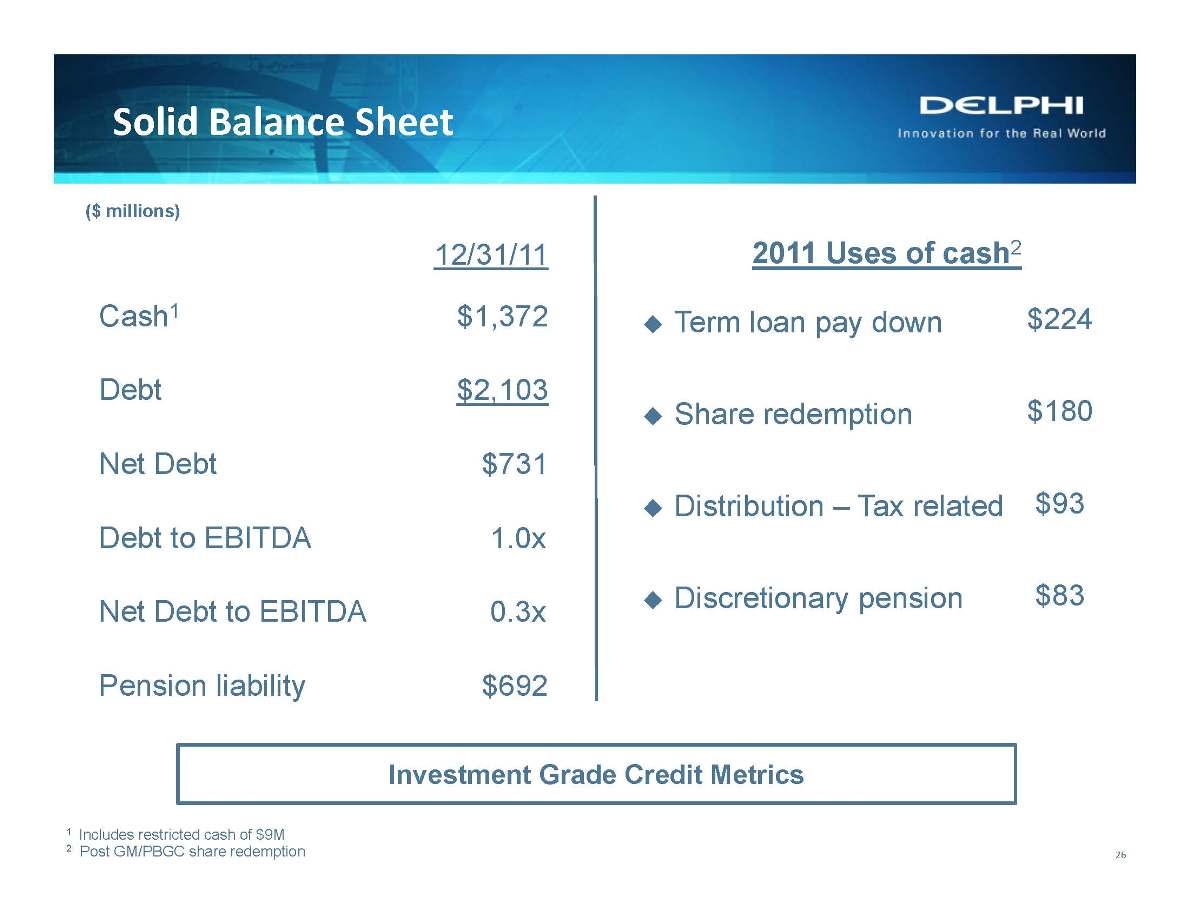
Solid Balance Sheet 26 12/31/11 Cash1 $1,372 Debt $2,103 Net Debt $731 Debt to EBITDA 1.0x Net Debt to EBITDA 0.3x Pension liability $674 1 Includes restricted cash of $9M 2 Post GM/PBGC share redemption 2011 Uses of cash4 Term loan pay down Share redemption Distribution – Tax related Discretionary pension $224 $180 $93 $83 2011 Uses of cash2 ($ millions) Investment Grade Credit Metrics 692
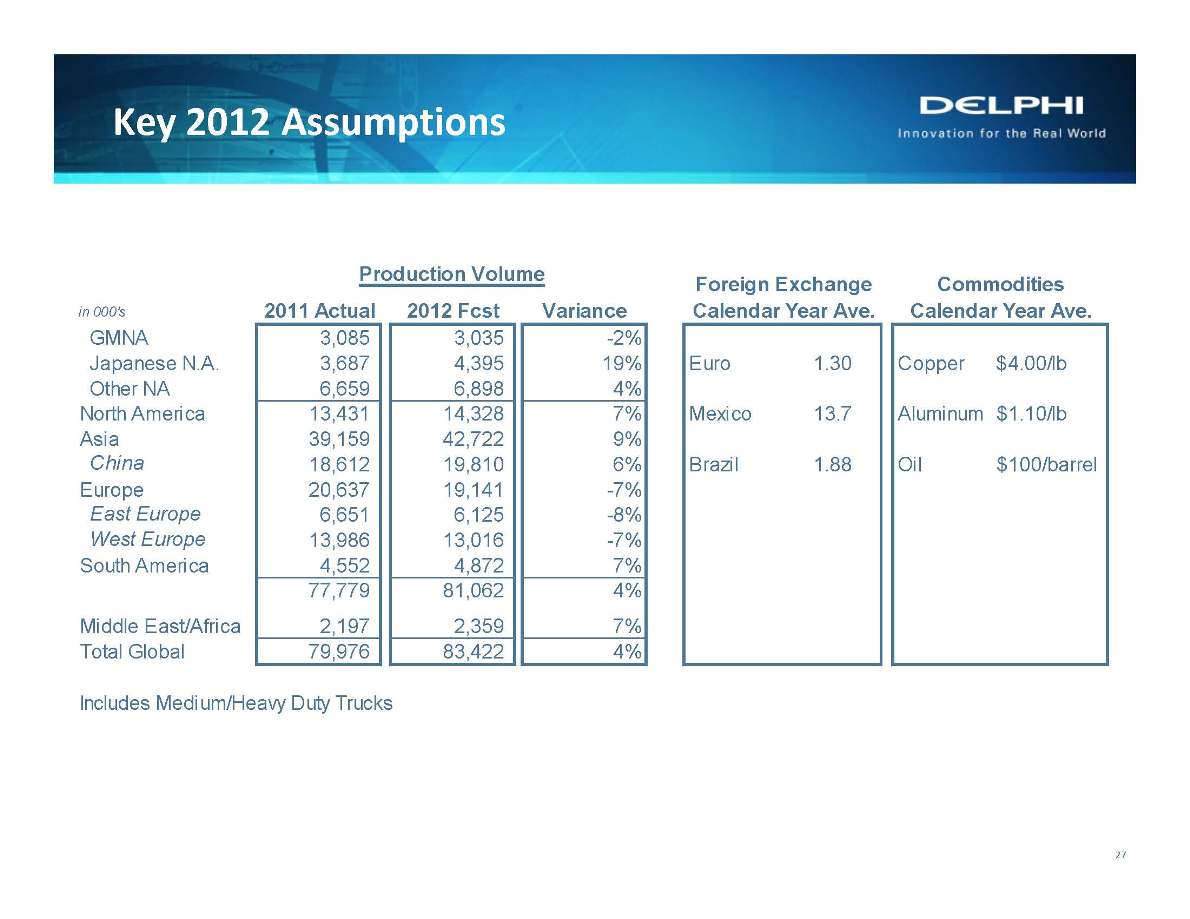
Key 2012 Assumptions Production Volume in 000's 2011 Actual 2012 Fcst Variance GMNA 3,085 3,035 -2% Japanese N.A. 3,687 4,395 19% Euro 1.30 Copper $4.00/lb Other NA 6,659 6,898 4% North America 13,431 14,328 7% Mexico 13.7 Aluminum $1.10/lb Asia 39,159 42,722 9% China 18,612 19,810 6% Brazil 1.88 Oil $100/barrel Europe 20,637 19,141 -7% East Europe 6,651 6,125 -8% West Europe 13,986 13,016 -7% South America 4,552 4,872 7% 77,779 81,062 4% Middle East/Africa 2,197 2,359 7% Total Global 79,976 83,422 4% Includes Medium/Heavy Duty Trucks Foreign Exchange Commodities Calendar Year Ave. Calendar Year Ave.
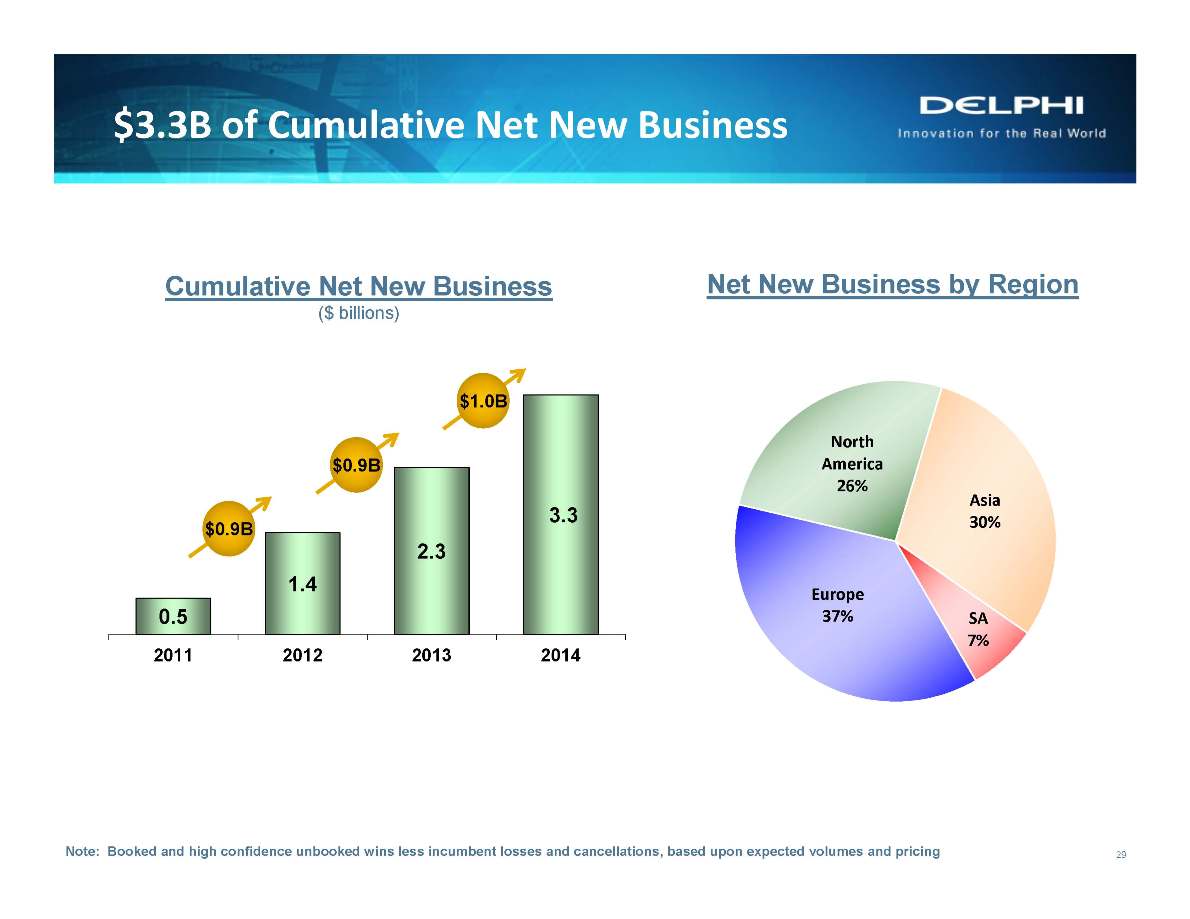
$3.3B of Cumulative Net New Business Each column represents projected cumulative annual revenue increase versus 2009 split between macro economic drivers (volume, FX, commodity de/escalation & price) and net new business (booked and high confidence new business wins less incumbent losses and cancellations) SA 1% Europe 37% North America 26% Asia 30% SA 7% 0.5 1.4 2.3 3.3 0 0.5 1 1.5 2 2.5 3 3.5 2011 2012 2013 2014 29 Cumulative Net New Business ($ billions) Net New Business by Region Note: Booked and high confidence unbooked wins less incumbent losses and cancellations, based upon expected volumes and pricing
Board of Directors authorized a $300M share repurchase program The lock-up for 30% of restricted shares from the November IPO will cease for shareholders (other than directors) on February 14th with the remaining 70% to cease on May 15th Expect to file an S-1 shelf registration within the next week Effectiveness of the S-1 will permit the restricted shares to be sold freely Intend to file 2011 10K on February 17th Intend to file future periodic reports with SEC concurrently with earnings release Other


Appendix
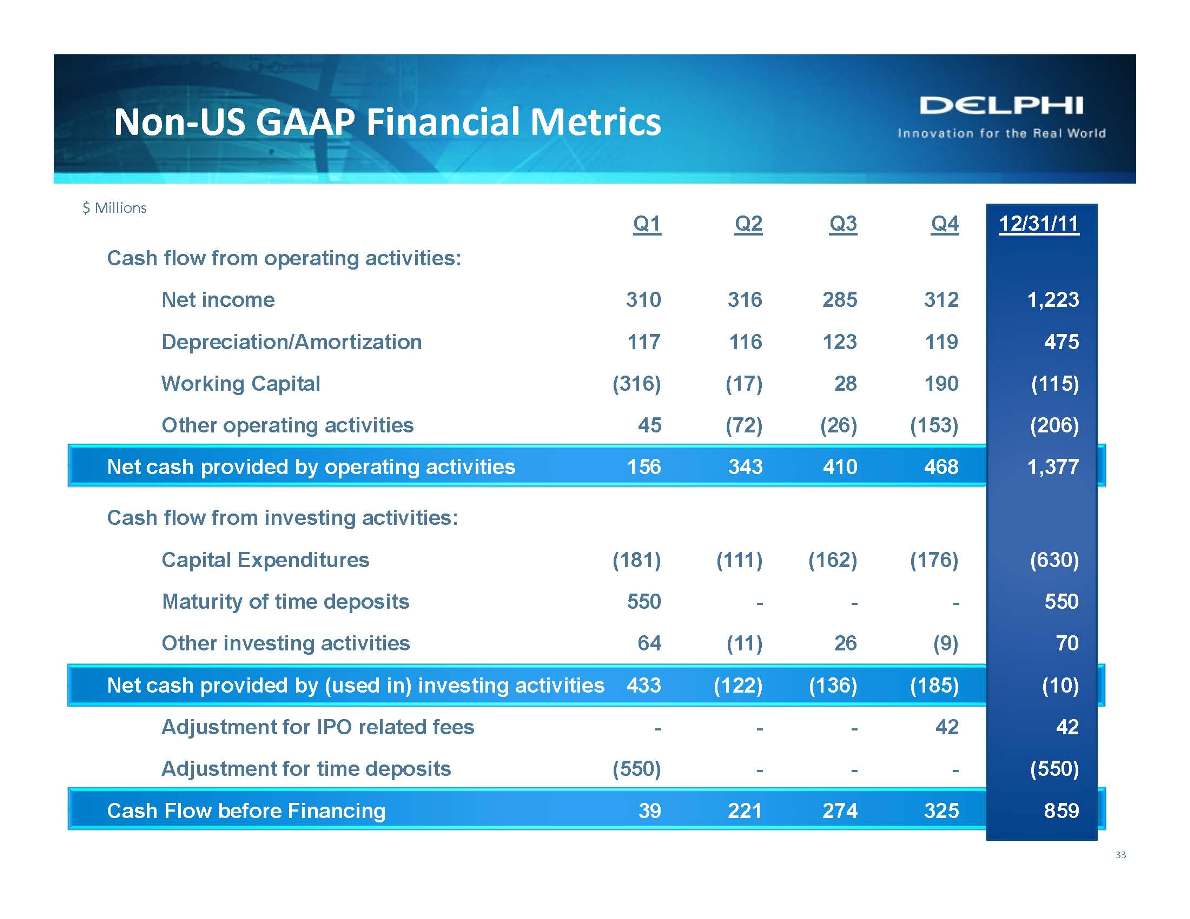
Non‐US GAAP Financial Metrics 33 $ Millions Q1 Q2 Q3 Q4 12/31/11 Cash flow from operating activities: Net income 310 316 285 312 1,223 Depreciation/Amortization 117 116 123 119 475 Working Capital (316) (17) 28 190 (115) Other operating activities 45 (72) (26) (153) (206) Net cash provided by operating activities 156 343 410 468 1,377 Cash flow from investing activities: Capital Expenditures (181) (111) (162) (176) (630) Maturity of time deposits 550 - - - 550 Other investing activities 64 (11) 26 (9) 70 Net cash provided by (used in) investing activities 433 (122) (136) (185) (10) Adjustment for IPO related fees - - - 42 42 Adjustment for time deposits (550) - - - (550) Cash Flow before Financing 39 221 274 325 859
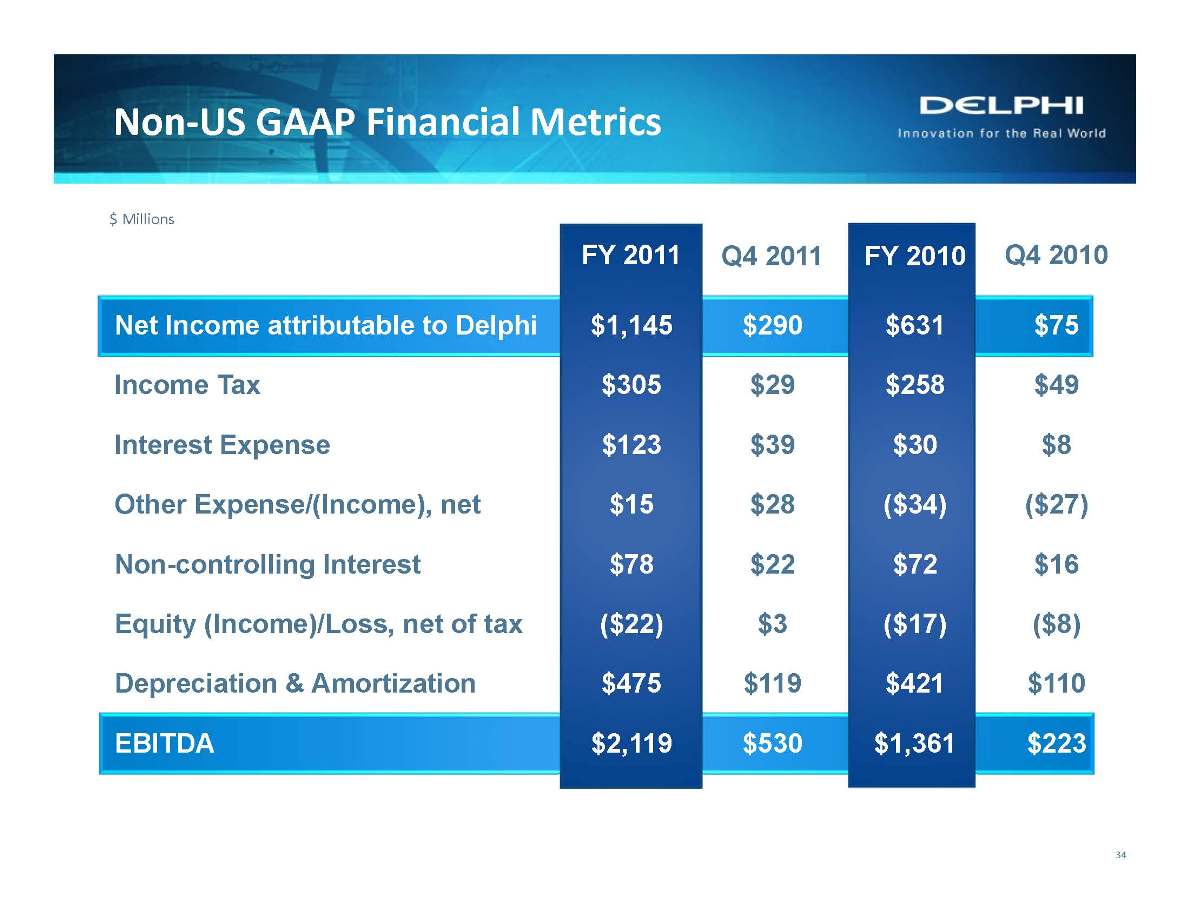
Non‐US GAAP Financial Metrics FY 2011 Q4 2011 FY 2010 Q4 2010 Net Income attributable to Delphi $1,145 $290 $631 $75 Income Tax $305 $29 $258 $49 Interest Expense $123 $39 $30 $8 Other Expense/(Income), net $15 $28 ($34) ($27) Non-controlling Interest $78 $22 $72 $16 Equity (Income)/Loss, net of tax ($22) $3 ($17) ($8) Depreciation & Amortization $475 $119 $421 $110 EBITDA $2,119 $530 $1,361 $223 $ Millions
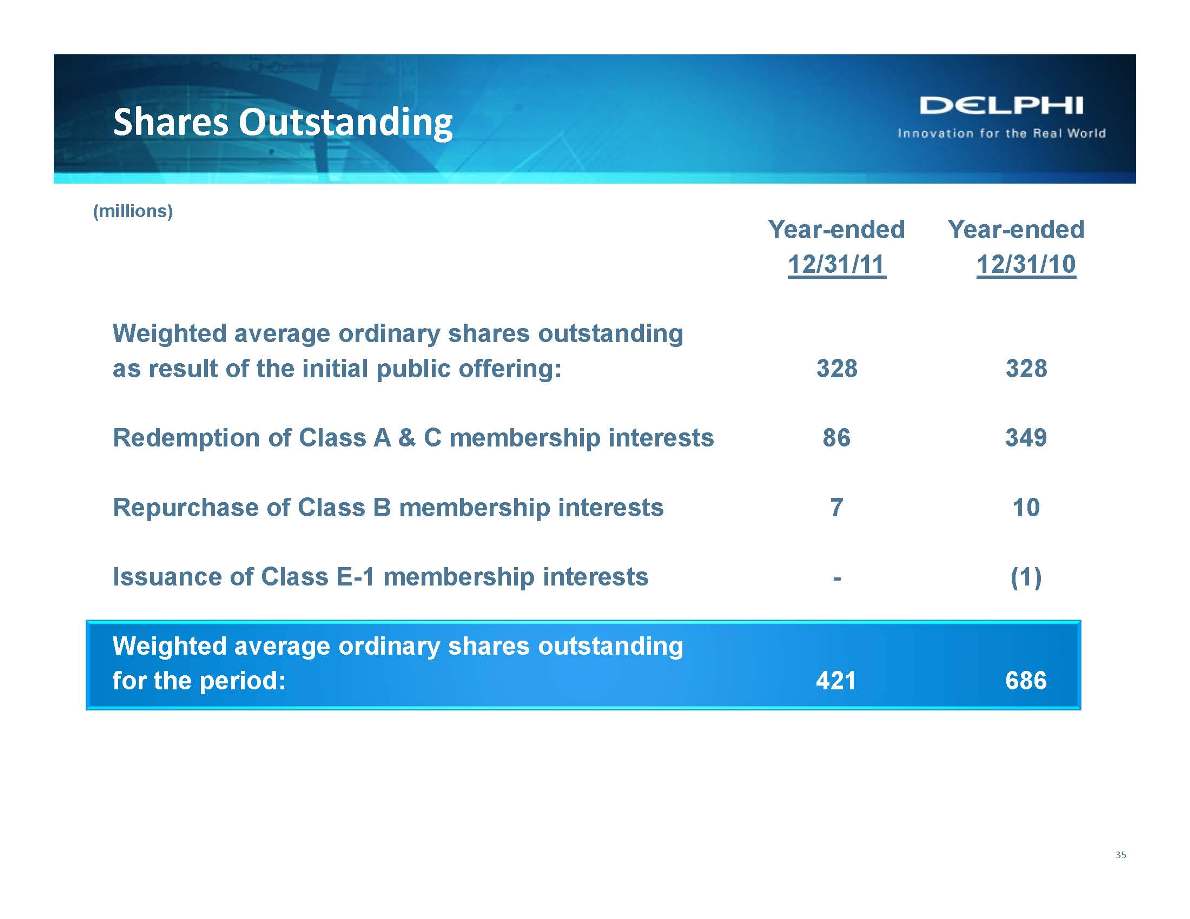
Shares Outstanding 35 Year-ended Year-ended 12/31/11 12/31/10 Weighted average ordinary shares outstanding as result of the initial public offering: 328 328 Redemption of Class A & C membership interests 86 349 Repurchase of Class B membership interests 7 10 Issuance of Class E-1 membership interests - (1) Weighted average ordinary shares outstanding for the period: 421 686 (millions)