Attached files
| file | filename |
|---|---|
| 8-K - CIRRUS LOGIC, INC. 8-K - CIRRUS LOGIC, INC. | a50146833.htm |
| EX-99.1 - EXHIBIT 99.1 - CIRRUS LOGIC, INC. | a50146833ex99_1.htm |
Exhibit 99.2
January 26, 2012 Dear Shareholders, Continuing with the trend we began in October 2011, we are presenting our financial information for the quarterly reporting period in one comprehensive shareholder letter, instead of using the traditional script format. The shareholder letter contains much of the same content and commentary from the company as before, while also providing the information in a format we believe to be a more valuable tool for our investors and analysts. We received a tremendous amount of positive feedback following this recent update. It allows us to share more information in a timely manner and provides you, the shareholder, a complete presentation of the company’s financial information for the quarter as one comprehensive report. We will host a Q&A session today at 6:00 p.m. ET to answer questions about our financial results and business outlook. We invite you to submit a question to be addressed during this session by sending an email to our Investor Relations department at investor.relations@cirrus.com. This Q&A session can be accessed in the Investor Relations section of the Cirrus Logic website at http://investor.cirrus.com.
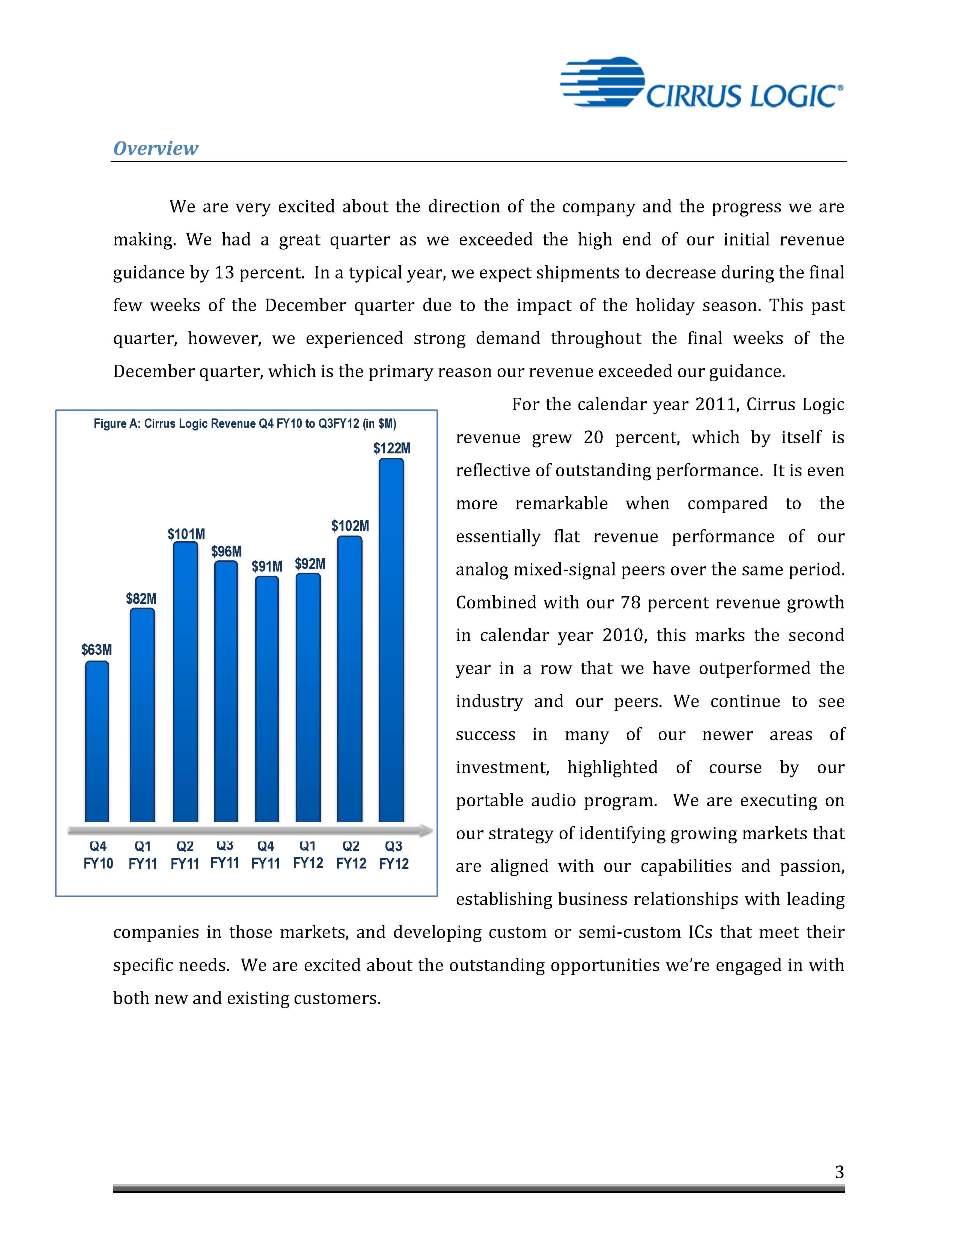
Overview We are very excited about the direction of the company and the progress we are making. We had a great quarter as we exceeded the high end of our initial revenue guidance by 13 percent. In a typical year, we expect shipments to decrease during the final few weeks of the December quarter due to the impact of the holiday season. This past quarter, however, we experienced strong demand throughout the final weeks of the December quarter, which is the primary reason our revenue exceeded our guidance. For the calendar year 2011, Cirrus Logic revenue grew 20 percent, which by itself is reflective of outstanding performance. It is even more remarkable when compared to the essentially flat revenue performance of our analog mixed-signal peers over the same period. Combined with our 78 percent revenue growth in calendar year 2010, this marks the second year in a row that we have outperformed the industry and our peers. We continue to see success in many of our newer areas of investment, highlighted of course by our portable audio program. We are executing on our strategy of identifying growing markets that are aligned with our capabilities and passion, establishing business relationships with leading companies in those markets, and developing custom or semi-custom ICs that meet their specific needs. We are excited about the outstanding opportunities we’re engaged in with both new and existing customers.
Revenue Q3 was an outstanding quarter, both in our financial performance, as well as in the milestones we achieved in key design programs. Total revenue grew 20 percent sequentially and 28 percent compared to Q3 a year ago. This strength was led by continued success with our largest customer, as they grew to 70 percent of our overall revenue this quarter. Our relationship with them continues to be outstanding, with great visibility and ongoing design activity on innovative and challenging projects. Revenue related to home and automotive audio, as well as our energy product lines are being somewhat impacted by ongoing weak global economic trends. We remain excited however about additional production ramps in new audio products with our new low power DSP, as we began shipping production volume into a recently released line of Sony camcorders. We also shipped preproduction volume of our new digital LED lighting controller and entered the March quarter with production quantities of this device on the backlog. In Q4 we expect revenue from audio products to remain strong but down slightly due to seasonality factors. The strong bookings we experienced at the end of Q3 have continued over the past few weeks and this has caused us to raise our Q4 guidance to range between $108 million and $112 million. As a management tool, one of the ways we measure engineering execution and the effectiveness of our team at targeting the right opportunities is to measure the percentage of revenue we derive from our new products. The following graph shows our quarterly billings, broken out into three distinct categories:
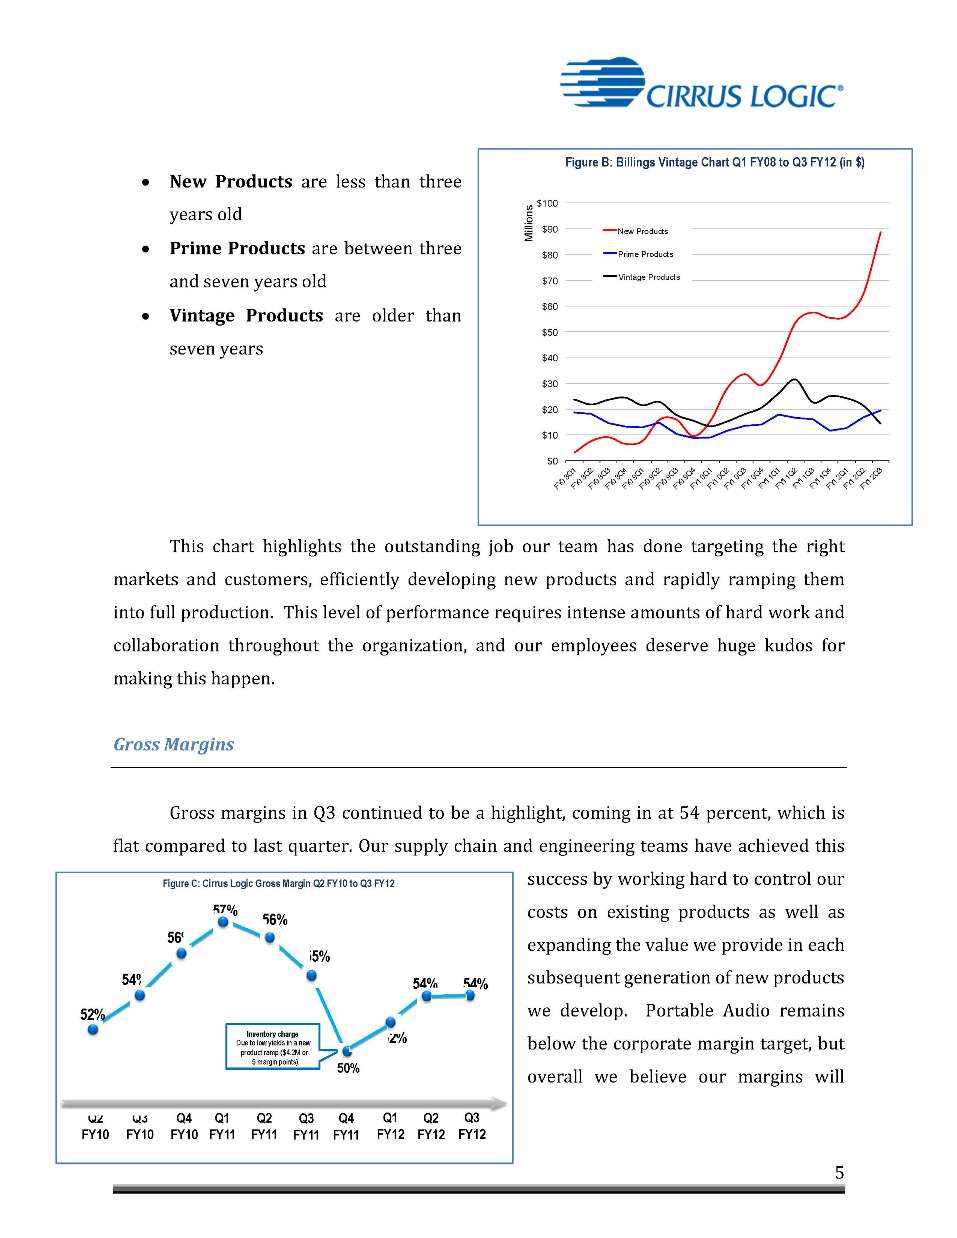
New Products are less than three years old Prime Products are between three and seven years old Vintage Products are older than seven years This chart highlights the outstanding job our team has done targeting the right markets and customers, efficiently developing new products and rapidly ramping them into full production. This level of performance requires intense amounts of hard work and collaboration throughout the organization, and our employees deserve huge kudos for making this happen. Gross Margins Gross margins in Q3 continued to be a highlight, coming in at 54 percent, which is flat compared to last quarter. Our supply chain and engineering teams have achieved this success by working hard to control our costs on existing products as well as expanding the value we provide in each subsequent generation of new products we develop. Portable Audio remains below the corporate margin target, but overall we believe our margins will
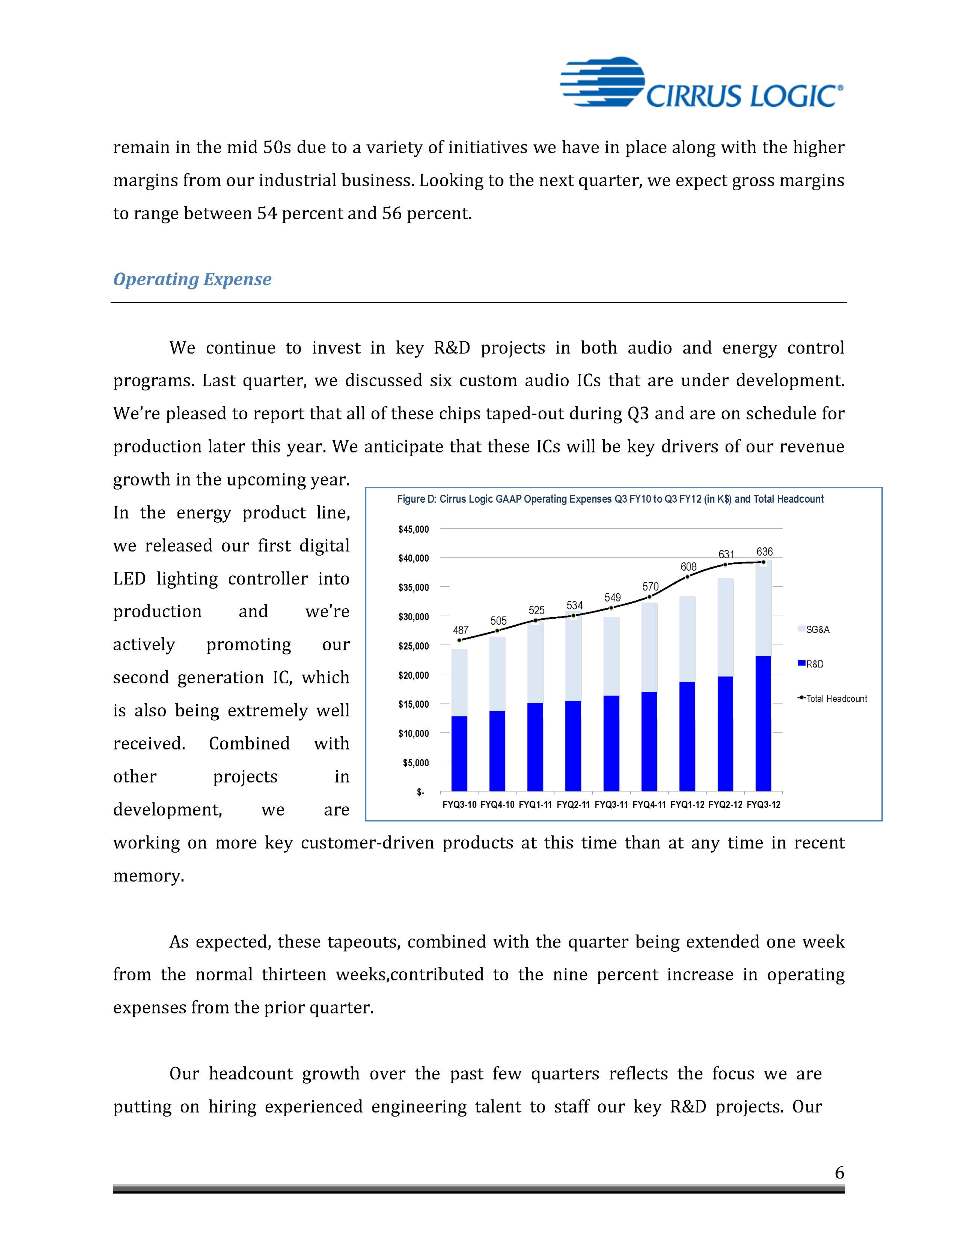
remain in the mid 50s due to a variety of initiatives we have in place along with the higher margins from our industrial business. Looking to the next quarter, we expect gross margins to range between 54 percent and 56 percent. Operating Expense We continue to invest in key R&D projects in both audio and energy control programs. Last quarter, we discussed six custom audio ICs that are under development. We’re pleased to report that all of these chips taped-out during Q3 and are on schedule for production later this year. We anticipate that these ICs will be key drivers of our revenue growth in the upcoming year. In the energy product line, we released our first digital LED lighting controller into production and we’re actively promoting our second generation IC, which is also being extremely well received. Combined with other projects in development, we are working on more key customer-driven products at this time than at any time in recent memory. As expected, these tapeouts, combined with the quarter being extended one week from the normal thirteen weeks,contributed to the nine percent increase in operating expenses from the prior quarter. Our headcount growth over the past few quarters reflects the focus we are putting on hiring experienced engineering talent to staff our key R&D projects. Our
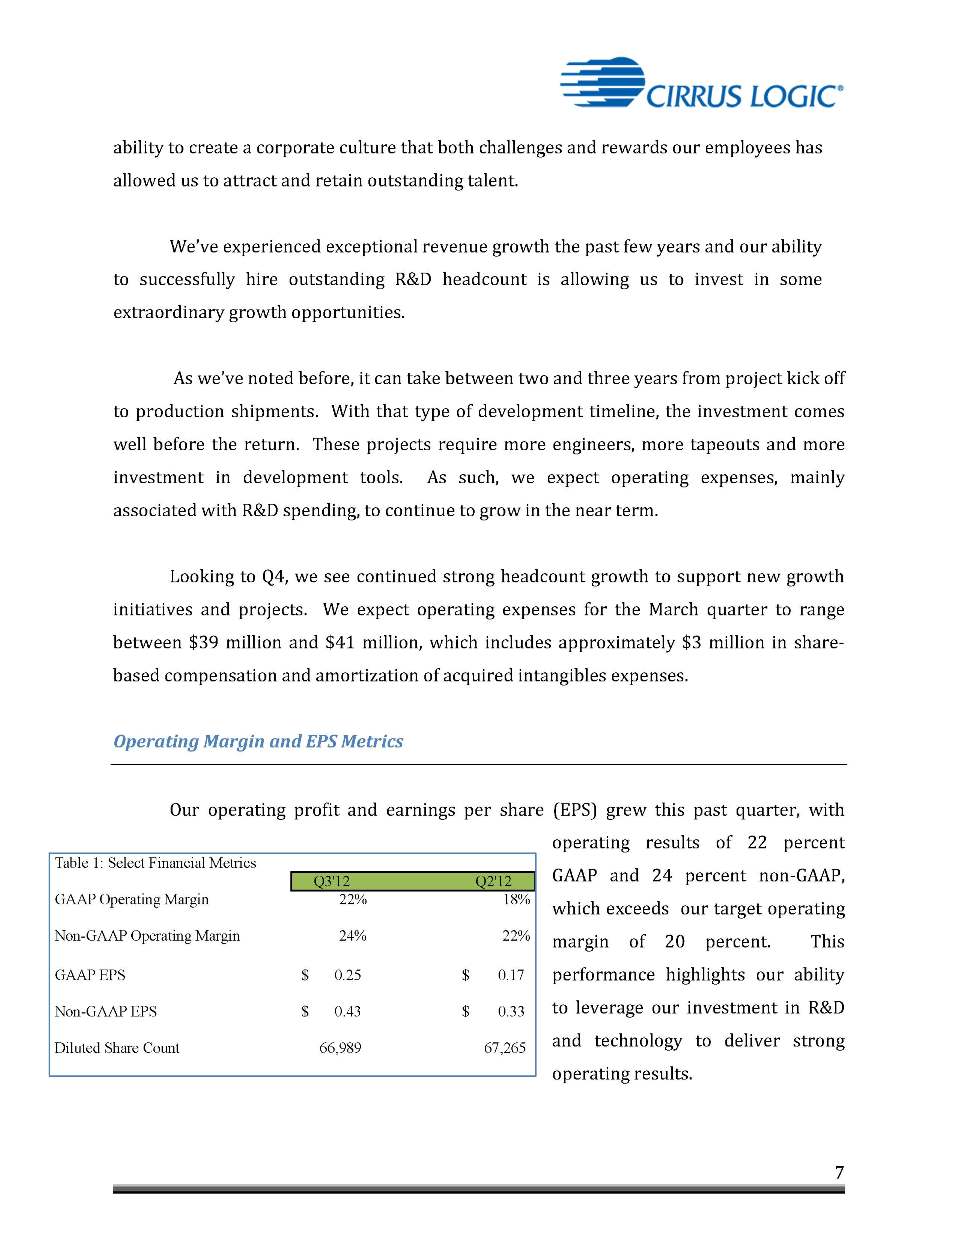
ability to create a corporate culture that both challenges and rewards our employees has allowed us to attract and retain outstanding talent. We’ve experienced exceptional revenue growth the past few years and our ability to successfully hire outstanding R&D headcount is allowing us to invest in some extraordinary growth opportunities. As we’ve noted before, it can take between two and three years from project kick off to production shipments. With that type of development timeline, the investment comes well before the return. These projects require more engineers, more tapeouts and more investment in development tools. As such, we expect operating expenses, mainly associated with R&D spending, to continue to grow in the near term. Looking to Q4, we see continued strong headcount growth to support new growth initiatives and projects. We expect operating expenses for the March quarter to range between $39 million and $41 million, which includes approximately $3 million in share-based compensation and amortization of acquired intangibles expenses. Operating Margin and EPS Metrics Our operating profit and earnings per share (EPS) grew this past quarter, with operating results of 22 percent GAAP and 24 percent non-GAAP, which exceeds our target operating margin of 20 percent. This performance highlights our ability to leverage our investment in R&D and technology to deliver strong operating results.
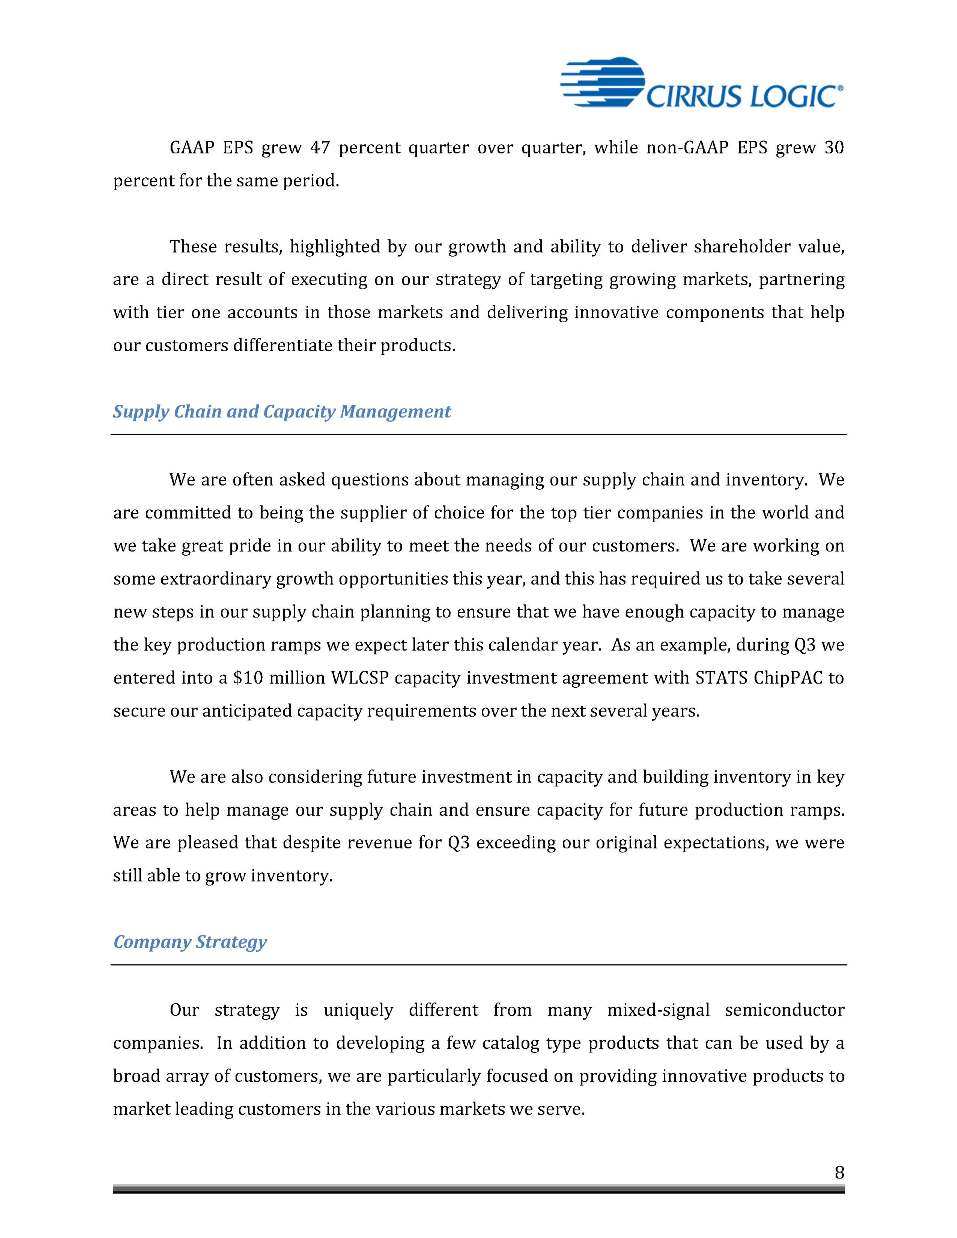
GAAP EPS grew 47 percent quarter over quarter, while non-GAAP EPS grew 30 percent for the same period. These results, highlighted by our growth and ability to deliver shareholder value, are a direct result of executing on our strategy of targeting growing markets, partnering with tier one accounts in those markets and delivering innovative components that help our customers differentiate their products. Supply Chain and Capacity Management We are often asked questions about managing our supply chain and inventory. We are committed to being the supplier of choice for the top tier companies in the world and we take great pride in our ability to meet the needs of our customers. We are working on some extraordinary growth opportunities this year, and this has required us to take several new steps in our supply chain planning to ensure that we have enough capacity to manage the key production ramps we expect later this calendar year. As an example, during Q3 we entered into a $10 million WLCSP capacity investment agreement with STATS ChipPAC to secure our anticipated capacity requirements over the next several years. We are also considering future investment in capacity and building inventory in key areas to help manage our supply chain and ensure capacity for future production ramps. We are pleased that despite revenue for Q3 exceeding our original expectations, we were still able to grow inventory. Company Strategy Our strategy is uniquely different from many mixed-signal semiconductor companies. In addition to developing a few catalog type products that can be used by a broad array of customers, we are particularly focused on providing innovative products to market leading customers in the various markets we serve.
Specifically, we target growing markets where we can showcase our expertise in digital signal processing to solve challenging issues. Our approach has been to develop new catalog components that showcase our latest innovations, which we then use to engage with the leading customers in a particular market or application. We then focus on building a strong engineering relationship with the design teams at these customers and work to develop highly differentiated products that address their specific needs using our own IP, sometimes in combination with theirs. When we are successful with this approach, one initial design win can expand into many additional products and a long-term relationship where we are able to use our mixed-signal expertise to add value to their products by addressing specific needs and solving problems that matter. This approach gives us the opportunity to increase our content per box through the integration of additional components on their board, as well as adding additional features. This strategy has driven much of the growth in our portable audio product line. As an example, several years ago we developed a custom portable audio codec IC for Sony. The success of this program has opened other doors at that account, and as we mentioned earlier, today we are shipping production volume of our lower power DSP into their new line of camcorders. In Energy, as we’ve stated before, we targeted a few key tier one OEMs in the lighting space to develop our digital LED lighting controllers. While this has been a long process, we’re excited to have begun shipping volume production of our first LED lighting controller to our lead customer. I’m pleased to report that we are now promoting these products to several additional lighting companies. Our success with key customers even as we launch our first products highlights the fact that our solution offers market-leading performance in terms of energy efficiency and superior dimming compatibility with the currently installed infrastructure, which is a key requirement among premier lighting companies.
Other Interesting Stuff A highlight for Cirrus Logic was the continued recognition for our outstanding corporate culture, as we recently were named the top company to work for in Central Texas by the Austin American-Statesman. Competition for top-caliber engineers in the semiconductor industry is very competitive, and creating a culture where our employees can thrive and design innovative new products is a key component of the success we’ve achieved in attracting and retaining phenomenal talent. All these talented folks need a suitable place to work, so we’re also pleased to report that progress on our new headquarters remains on schedule and we’re on track to begin moving in June of this year. Summary and Guidance Looking to next quarter, we expect the following results: Revenue to range between $108 million and $112 million Gross margin to be between 54 percent and 56 percent, Combined R&D and SG&A expenses to range between $39 million and $41 million, which includes approximately $3 million in share-based compensation and amortization of acquired intangibles expenses. Q3 was a fantastic quarter for our company, both in terms of financial performance as well as engineering performance. We’ve continued to keep our existing customers happy and we’re hard at work at adding new ones. The low power audio DSP design activity is ongoing, and we’ve reached key milestones with the LED lighting controller and the sensorless brushless, DC motor controller. If each of these new product lines ramp into production as currently expected, it will be an excellent indication that the successful approach we developed within portable audio has spread throughout the company. As

always, our focus remains on building a great company for the long term. We're very pleased with the culture we've developed, the strategy we're pursuing, the talent and passion of our employees and the relationships we have with some of the best companies in the world. Sincerely, Jason Rhode Thurman Case President and Chief Executive Officer Chief Financial Officer
Conference Call Q&A Session Cirrus Logic management will host a live Q&A session today at 6:00 p.m. ET to answer questions about the Company’s financial results and business outlook. Shareholders who would like to submit a question to be addressed during this session are requested to email the company at investor.relations@cirrus.com. A live webcast of the Q&A session can be accessed on the Investor Relations section of the Cirrus Logic website at http://investor.cirrus.com. A replay of the Q&A session will be available on the website listed above beginning approximately one hour following its completion, or by calling (303) 590-3030, or toll-free at (800) 406-7325 (Access Code: 4503802). Use of Non-GAAP Measures This shareholder letter and its attachments include references to non-GAAP financial information, including operating expenses, net income, operating margin and diluted earnings per share. A reconciliation of the adjustments to GAAP results is included in the tables below. Non-GAAP financial information is not meant as a substitute for GAAP results, but is included because management believes such information is useful to our investors for informational and comparative purposes. In addition, certain non-GAAP financial information is used internally by management to evaluate and manage the company. As a note, the non-GAAP financial information used by Cirrus Logic may differ from that used by other companies. These non-GAAP measures should be considered in addition to, and not as a substitute for, the results prepared in accordance with GAAP. Safe Harbor Statement Except for historical information contained herein, the matters set forth in this shareholder letter contain forward-looking statements, including our estimates of fourth quarter fiscal year 2012 revenue, gross margin, combined research and development and selling, general and administrative expense levels, share-based compensation expense, and amortization of acquired intangible expenses. In some cases, forward-looking statements are identified by words such as "expect," "anticipate," "target," "project," "believe," "goals," "opportunity," "estimates," "intend," and variations of these types of words and similar expressions. In addition, any statements that refer to our plans, expectations, strategies or other characterizations of future events or circumstances are forward-looking statements. These forward-looking statements are based on our current expectations, estimates and assumptions and are subject to certain risks and
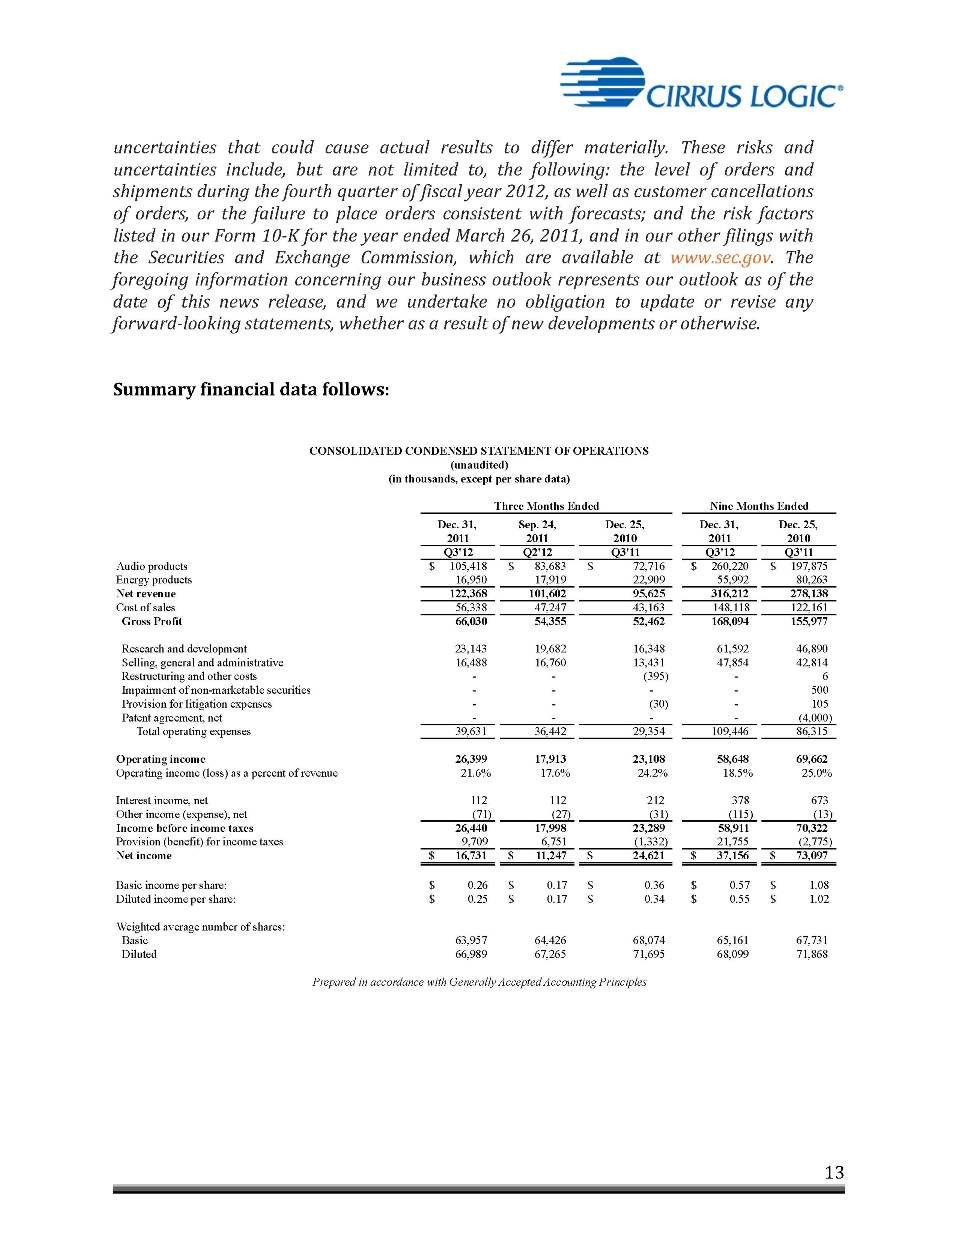
uncertainties that could cause actual results to differ materially. These risks and uncertainties include, but are not limited to, the following: the level of orders and shipments during the fourth quarter of fiscal year 2012, as well as customer cancellations of orders, or the failure to place orders consistent with forecasts; and the risk factors listed in our Form 10-K for the year ended March 26, 2011, and in our other filings with the Securities and Exchange Commission, which are available at www.sec.gov. The foregoing information concerning our business outlook represents our outlook as of the date of this news release, and we undertake no obligation to update or revise any forward-looking statements, whether as a result of new developments or otherwise. Summary financial data follows: CONSOLIDATED CONDENSED STATEMENT OF OPERATIONS (unaudited) (in thousands, except per share data) Three Months Ended Nine Months Ended Net revenue 122,368 101,602 95,625 316,212 278,138 Cost of sales 56,338 47,247 43,163 148,118 122,161 Gross Profit 66,030 54,355 52,462 168,094 155,977 Research and development 23,143 19,682 16,348 61,592 46,890 Selling, general and administrative 16,488 16,760 13,431 47,854 42,814 Restructuring and other costs - - (395) - 6 Impairment of non-marketable securities - - - - 500 Provision for litigation expenses - - (30) - 105 Patent agreement, net - - - - (4,000) Total operating expenses 39,631 36,442 29,354 109,446 86,315 Operating income 26,399 17,913 23,108 58,648 69,662 Operating income (loss) as a percent of revenue 21.6% 17.6% 24.2% 18.5% 25.0% Interest income, net 112 112 212 378 673 Other income (expense), net (71) (27) (31) (115) (13) Income before income taxes 26,440 17,998 23,289 58,911 70,322 Provision (benefit) for income taxes 9,709 6,751 (1,332) 21,755 (2,775) Net income 16,731 $ 11,247 $ 24,621 $ 37,156 $ 73,097 $ Basic income per share: 0.26 $ 0.17 $ 0.36 $ 0.57 $ 1.08 $ Diluted income per share: 0.25 $ 0.17 $ 0.34 $ 0.55 $ 1.02 $ Weighted average number of shares: Basic 63,957 64,426 68,074 65,161 67,731 Diluted 66,989 67,265 71,695 68,099 71,868 Prepared in accordance with Generally Accepted Accounting Principles Dec. 31, Sep. 24, Dec. 25, Dec. 31, Dec. 25, 2011 2011 2010 2011 2010 Q3'12 Q2'12 Q3'11 Q3'12 Q3'11 Audio products 105,418 $ 83,683 $ 72,716 $ 260,220 $ 197,875 $ Energy products 16,950 17,919 22,909 55,992 80,263
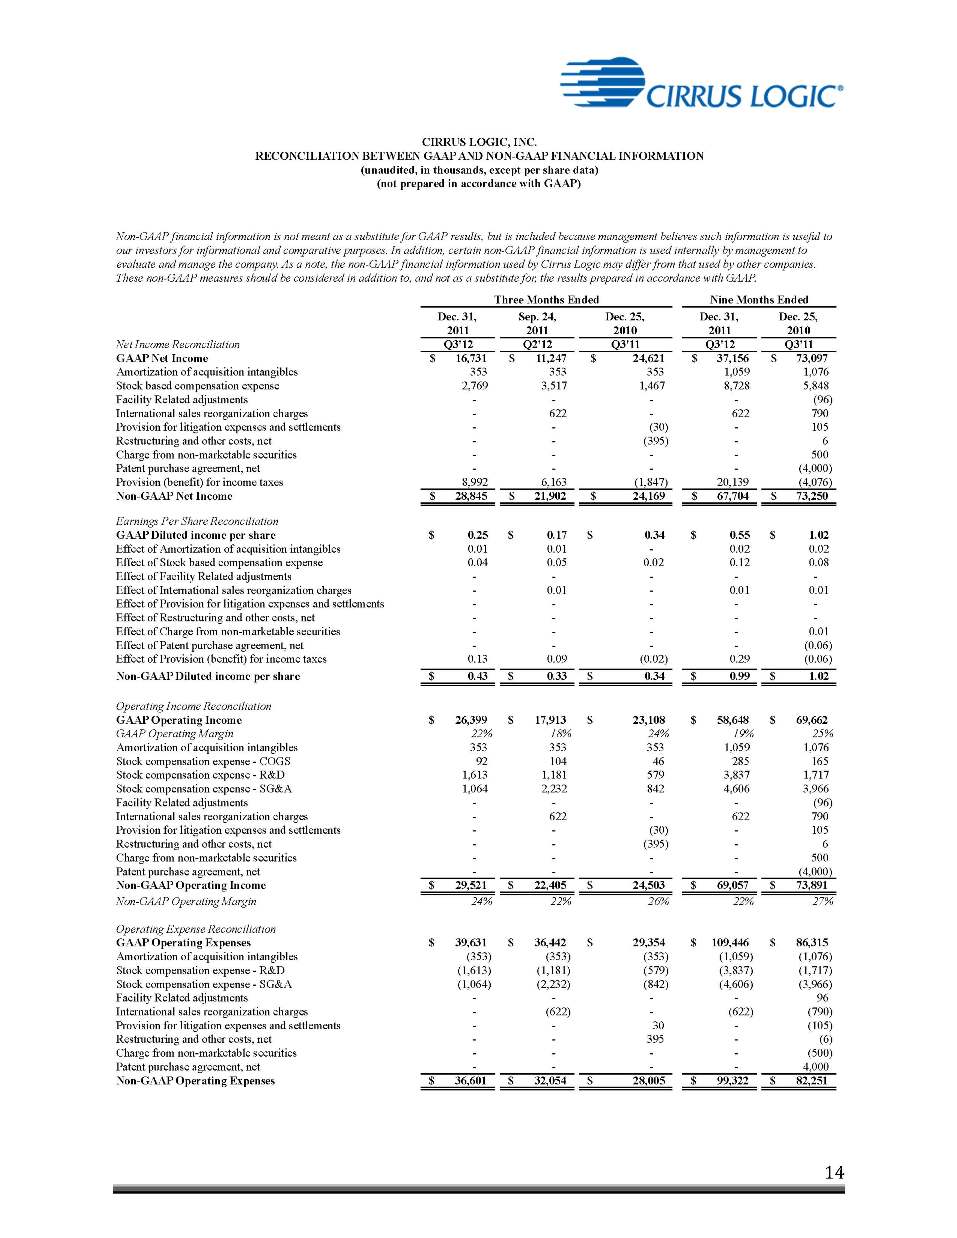
CIRRUS LOGIC, INC. RECONCILIATION BETWEEN GAAP AND NON-GAAP FINANCIAL INFORMATION (unaudited, in thousands, except per share data) Non-GAAP financial information is not meant as a substitute for GAAP results, but is included because management believes such information is useful to our investors for informational and comparative purposes. In addition, certain non-GAAP financial information is used internally by management to evaluate and manage the company. As a note, the non-GAAP financial information used by Cirrus Logic may differ from that used by other companies. These non-GAAP measures should be considered in addition to, and not as a substitute for, the results prepared in accordance with GAAP. Three Months Ended Nine Months Ended Non-GAAP Net Income 28,845 $ 21,902 $ 24,169 $ 67,704 $ 73,250 $ Earnings Per Share Reconciliation GAAP Diluted income per share 0.25 $ 0.17 $ 0.34 $ 0.55 $ 1.02 $ Effect of Amortization of acquisition intangibles 0.01 0.01 - 0.02 0.02 Effect of Stock based compensation expense 0.04 0.05 0.02 0.12 0.08 Effect of Facility Related adjustments - - - - - Effect of International sales reorganization charges - 0.01 - 0.01 0.01 Effect of Provision for litigation expenses and settlements - - - - - Effect of Restructuring and other costs, net - - - - - Effect of Charge from non-marketable securities - - - - 0.01 Effect of Patent purchase agreement, net - - - - (0.06) Effect of Provision (benefit) for income taxes 0.13 0.09 (0.02) 0.29 (0.06) Non-GAAP Diluted income per share 0.43 $ 0.33 $ 0.34 $ 0.99 $ 1.02 $ Operating Income Reconciliation GAAP Operating Income 26,399 $ 17,913 $ 23,108 $ 58,648 $ 69,662 $ GAAP Operating Margin 22% 18% 24% 19% 25% Amortization of acquisition intangibles 353 353 353 1,059 1,076 Stock compensation expense - COGS 92 104 46 285 165 Stock compensation expense - R&D 1,613 1,181 579 3,837 1,717 Stock compensation expense - SG&A 1,064 2,232 842 4,606 3,966 Facility Related adjustments - - - - (96) International sales reorganization charges - 622 - 622 790 Provision for litigation expenses and settlements - - (30) - 105 Restructuring and other costs, net - - (395) - 6 Charge from non-marketable securities - - - - 500 Patent purchase agreement, net - - - - (4,000) Non-GAAP Operating Income 29,521 $ 22,405 $ 24,503 $ 69,057 $ 73,891 $ Non-GAAP Operating Margin 24% 22% 26% 22% 27% Operating Expense Reconciliation GAAP Operating Expenses 39,631 $ 36,442 $ 29,354 $ 109,446 $ 86,315 $ Amortization of acquisition intangibles (353) (353) (353) (1,059) (1,076) Stock compensation expense - R&D (1,613) (1,181) (579) (3,837) (1,717) Stock compensation expense - SG&A (1,064) (2,232) (842) (4,606) (3,966) Facility Related adjustments - - - - 96 International sales reorganization charges - (622) - (622) (790) Provision for litigation expenses and settlements - - 30 - (105) Restructuring and other costs, net - - 395 - (6) Charge from non-marketable securities - - - - (500) Patent purchase agreement, net - - - - 4,000 Non-GAAP Operating Expenses 36,601 $ 32,054 $ 28,005 $ 99,322 $ 82,251 Net Income Reconciliation Q3'12 Q2'12 Q3'11 Q3'12 Q3'11 GAAP Net Income 16,731 $ 11,247 $ 24,621 $ 37,156 $ 73,097 $ Amortization of acquisition intangibles 353 353 353 1,059 1,076 Stock based compensation expense 2,769 3,517 1,467 8,728 5,848 Facility Related adjustments - - - - (96) International sales reorganization charges - 622 - 622 790 Provision for litigation expenses and settlements - - (30) - 105 Restructuring and other costs, net - - (395) - 6 Charge from non-marketable securities - - - - 500 Patent purchase agreement, net - - - - (4,000) Provision (benefit) for income taxes 8,992 6,163 (1,847) 20,139 (4,076) (not prepared in accordance with GAAP) Three Months Ended Nine Months Ended Non-GAAP Net Income 28,845 $ 21,902 $ 24,169 $ 67,704 $ 73,250 Dec. 31, Sep. 24, Dec. 25, Dec. 31, Dec. 25, 2011 2011 2010 2011 2010 Q3'12 Q2'12 Q3'11 Q3'12 Q3'1
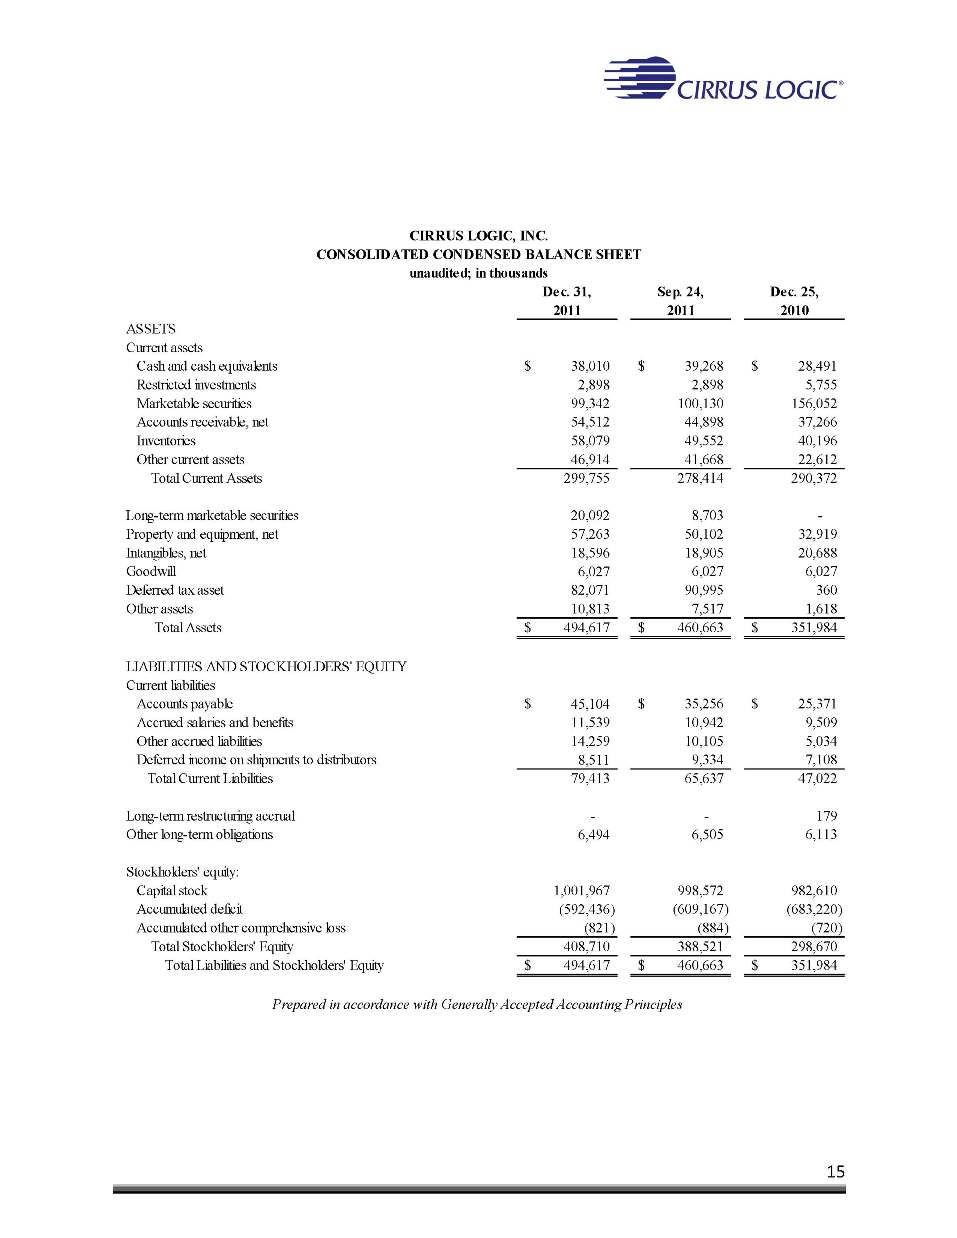
CIRRUS LOGIC, INC. CONSOLIDATED CONDENSED BALANCE SHEET unaudited; in thousands (in thousands) ASSETS Current assets Cash and cash equivalents 38,010 $ 39,268 $ 28,491 $ Restricted investments 2,898 2,898 5,755 Marketable securities 99,342 100,130 156,052 Accounts receivable, net 54,512 44,898 37,266 Inventories 58,079 49,552 40,196 Other current assets 46,914 41,668 22,612 Total Current Assets 299,755 278,414 290,372 Long-term marketable securities 20,092 8,703 - Property and equipment, net 57,263 50,102 32,919 Intangibles, net 18,596 18,905 20,688 Goodwill 6,027 6,027 6,027 Deferred tax asset 82,071 90,995 360 Other assets 10,813 7,517 1,618 Total Assets 494,617 $ 460,663 $ 351,984 $ LIABILITIES AND STOCKHOLDERS' EQUITY Current liabilities Accounts payable 45,104 $ 35,256 $ 25,371 $ Accrued salaries and benefits 11,539 10,942 9,509 Other accrued liabilities 14,259 10,105 5,034 Deferred income on shipments to distributors 8,511 9,334 7,108 Total Current Liabilities 79,413 65,637 47,022 Long-term restructuring accrual - - 179 Other long-term obligations 6,494 6,505 6,113 Stockholders' equity: Capital stock 1,001,967 998,572 982,610 Accumulated deficit (592,436) (609,167) (683,220) Accumulated other comprehensive loss (821) (884) (720) Total Stockholders' Equity 408,710 388,521 298,670 Total Liabilities and Stockholders' Equity 494,617 $ 460,663 $ 351,984 Dec. 31, Sep. 24, Dec. 25, 2011 2011 2010 Prepared in accordance with Generally Accepted Accounting Principles