Attached files
| file | filename |
|---|---|
| 8-K - CHINA FUND INC | v300453_8k.htm |
THE CHINA FUND, INC. (CHN)
MONTHLY INSIGHT
![]()
AT 31 DECEMBER, 2011
| IN BRIEF | ||
| Net asset value per share | US$23.25 | |
| Market price | US$20.51 | |
| Premium/(discount) | (11.78%) | |
| Fund size | US$529.6m |
Source: State Street Bank and Trust Company.
| At 31 December, 2011 | US$ return | ||
| China Fund | MSCI Golden | ||
| NAV | Dragon* | ||
| % | % | ||
| One month | (0.7) | 2.5 | |
| Year to date | (24.4) | (18.4) | |
| One year | (24.4) | (18.4) | |
| Three years % pa | 18.5 | 15.7 |
Past performance is not a guide to future returns.
Source: State Street Bank and Trust Company.
NAV performance. *Source for index data: MSCI.
As of November 9, 2011, the Fund has entered into an Interim Investment Advisory and Management Agreement with Martin Currie Inc. and on November 10, 2011, Martin Currie Inc. entered into an Interim Sub-Advisory Agreement with APS Asset Management Pte Ltd. to manage the Fund’s portfolio until new permanent management arrangements can be put in place. The interim arrangements will remain in place for a maximum of 150 days.
FUND MANAGERS (interim)
 |
 |
|||
| Wong Kok Hoi | James Liu |
| MANAGER’S COMMENTARY |
As more positive macroeconomic data trickled in from the United States and anticipation built for China to fine-tune its monetary tightening, the Greater China equity markets diverged in December. The Chinese shares traded in Hong Kong did better than their A-share counterparts. Hong Kong, as an offshore market, benefited more from a slight increase in foreign investors’ risk appetite, given a rosier economic outlook in the United States and the European Central Bank’s indirect injection of liquidity into the system. The Hang Seng index ended the month 4.6% higher, while the Shanghai Composite retreated 4.6% in US dollar terms. The MSCI Golden Dragon rose 2.5%.
On the domestic front, there are tentative signs that the slowdown in China’s economic growth may be stabilizing, but the outlook for exports remains murky as a result of Europe’s debt crisis. The purchasing managers’ index compiled by the China Federation of Logistics and Purchasing showed an improvement of 1.3 percentage points in December, to 50.3% from November’s 49%. The festival effects of Western and Chinese New Year celebrations helped to boost this reading. A separate index released by HSBC indicated that manufacturing growth continued to slow in December, although the deceleration was less marked than in November.
China’s November macro data showed a sharp fall in CPI growth to 4.2%, from 5.5% in October. Containing inflation is a less urgent priority than it was at the beginning of 2011, so it appears that the central government’s focus is gradually shifting to maintaining growth. China’s Central Economic Working Conference emphasized growth stability while maintaining the authorities’ stance on monetary policy and property tightening. The People’s Bank of China said that monetary policy would remain flexible and forward-looking, implying that it would take any necessary action to keep growth stable.
In Taiwan, the TAIEX dropped to the year’s low in the middle of the month. It then rebounded strongly, after the National Stabilization Fund (NSF) indicated that it had allocated NT$500 billion to support the market should it continue to decline unreasonably. Compared with a daily stock-market turnover of less than NT$60 billion, this is a staggering amount of capital. The NSF is expected to keep an eye on market movements at least until the presidential election on January 14, 2012. Overall, the TAIEX was up 2.6% in December.
The Fund returned -0.7% over the month. Among the top contributors was Chinatrust Financial Holdings, which performed well as the Taiwanese government’s stabilization fund started to buy into the market. Meanwhile, Natural Beauty Bio-Tech was boosted by a broker’s initiation report, which emphasized what the Carlyle Group did after buying a substantial stake in the company. Another notable positive was Shandong Weigao Group, which has managed to pass rising costs onto its customers, thereby allaying the market’s concerns about government price controls in the healthcare sector.
The negatives included liquor firm Wuliangye Yibin, which was affected by the government’s efforts to regulate the spending of civil servants; the market took this to indicate reduced consumption of high-end white liquor in China. The tough business conditions facing smaller businesses on the Chinese mainland weighed heavily on Hand Enterprise Solution’s share price, as they are seen to entail reduced demand for the firm’s IT services and ERP systems. Finally, China Medical System continued to succumb to fears of price controls on medicines.
Source: Martin Currie Inc. and APS Asset Management Pte Ltd.
MONTHLY INSIGHT
INVESTMENT STRATEGY
We sold China Mobile, as we expect it to continue to lose market share. The loss of subscribers will result in lower income and reduced cashflow, which should lead to slashed dividends. We took profits in Chinatrust Financial, given its high valuation, and ZTE Corp.
Source: APS Asset Management Pte Ltd.
| FUND DETAILS | ||
| Market cap | US$467.2m | |
| Shares outstanding | 22,781,762 | |
| Exchange listed | NYSE | |
| Listing date | July 10, 1992 | |
| Listing and direct investment manager | Martin Currie Inc |
Source: State Street Bank and Trust Company.
| ASSET ALLOCATION |
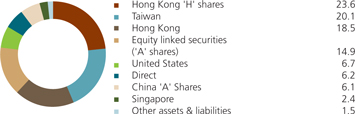
| Source: State Street Bank and Trust Company |
INDUSTRY ALLOCATION
| The China Fund, Inc % | MSCI Golden Dragon % | ||
| Healthcare | 24.7 | 0.4 | |
| Consumer discretionary | 16.9 | 6.8 | |
| Information technology | 16.5 | 18.9 | |
| Financials | 14.4 | 34.6 | |
| Consumer staples | 13.8 | 3.6 | |
| Industrials | 4.1 | 6.5 | |
| Utilities | 4.1 | 4.5 | |
| Materials | 2.1 | 6.8 | |
| Telecommunications | 1.5 | 8.5 | |
| Energy | 0.4 | 9.2 | |
| Other assets & liabilities | 1.5 | — |
Source: State Street Bank and Trust Company. Source for index data: MSCI
| PERFORMANCE | (US$ RETURNS) |
| NAV % | Market price % | ||
| One month | (0.7) | (7.0) | |
| Year to date | (24.4) | (27.5) | |
| Three years % pa | 18.5 | 15.6 |
Past performance is not a guide to future returns.
Three year returns are annualized.
Source: State Street Bank and Trust Company
On January 6, 2012, the Fund announced that the Board of Directors has appointed RCM Asia Pacific Limited (‘RCM’) as the investment adviser of the Fund subject to stockholder approval. It is anticipated that RCM will begin managing the Fund in February 2012 on an interim basis until stockholder approval of the new management agreements is obtained. The new investment management agreements with RCM will be submitted to stockholders for approval at the Fund’s annual stockholders’ meeting. The Board also set March 8, 2012 as the date of the Fund’s annual stockholders meeting, with January 23, 2012 being the record date for that meeting.
For further information please go to www.chinafundinc.com.
15 LARGEST HOLDINGS (55.3%)
| Fund % | |||
| China Medical System Holdings | Healthcare | 10.9 | |
| Hand Enterprise Solutions | Information technology | 6.1 | |
| Ping An Insurance | Financials | 4.0 | |
| FamilyMart | Consumer discretionary | 3.4 | |
| Ruentex Development Co | Financials | 3.1 | |
| Shandong Weigao Group | Healthcare | 3.1 | |
| China Bright | Healthcare | 3.1 | |
| ENN Energy | Utilities | 3.1 | |
| Zong Su Foods | Consumer staples | 3.1 | |
| Uni-President Enterprises Corp. | Consumer staples | 2.9 | |
| Sinopharm Group | Healthcare | 2.7 | |
| Far Eastern Department Stores | Consumer discretionary | 2.6 | |
| Wumart Stores | Consumer staples | 2.5 | |
| Huiyin Household Appliances | Consumer discretionary | 2.4 | |
| Wuliangye Yibin Co | Consumer staples | 2.3 |
| DIRECT INVESTMENTS (6.2%) | |||
| Fund % | |||
| China Bright | Healthcare | 3.1 | |
| Zong Su Foods | Consumer staples | 3.1 | |
| China Silicon | Information technology | 0.0 | |
| Hand Enterprise Solutions (preferred) | Information technology | 0.0 | |
| Source: State Street Bank and Trust Company. | |||
| FUND PERFORMANCE (BASED ON NET ASSET VALUE) | (US$ returns) |
| One month | Three months | Calendar year | One year | Three years | Five years | Since launch | ||
| % | % | to date % | % | % pa | % pa | % pa | ||
| The China Fund, Inc. | (0.7) | 0.1 | (24.4) | (24.4) | 18.5 | 10.4 | 10.7 | |
| MSCI Golden Dragon | 2.5 | 5.0 | (18.4) | (18.4) | 15.7 | 1.6 | n/a | |
| Hang Seng Chinese Enterprise | 4.6 | 11.7 | (21.6) | (21.6) | 7.9 | (0.8) | n/a | |
| Shanghai Stock Exchange 180 | (4.6) | (6.1) | (19.6) | (19.6) | 10.3 | 5.4 | n/a |
Past performance is not a guide to future returns. Source: State Street Bank and Trust Company. Launch date July 10, 1992. Three, five year and since launch returns are all annualized. Source for index data: MSCI for the MSCI Golden Dragon and Copyright 2011 Bloomberg LP for the Hang Seng China Enterprise and the Shanghai Stock Exchange 180. For a full description of each index please see the index descriptions section.
| PERFORMANCE IN PERSPECTIVE |
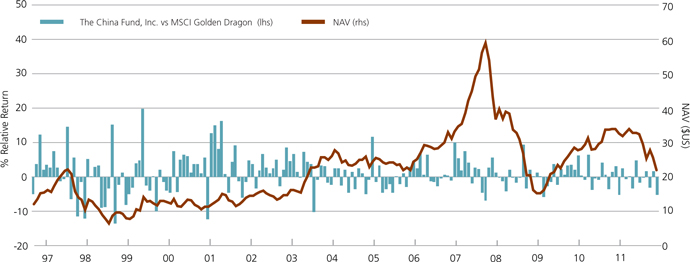
Past performance is not a guide to future returns.
Source: Martin Currie Inc as at 31 December, 2011.
MONTHLY INSIGHT
THE CHINA FUND INC. PREMIUM/DISCOUNT
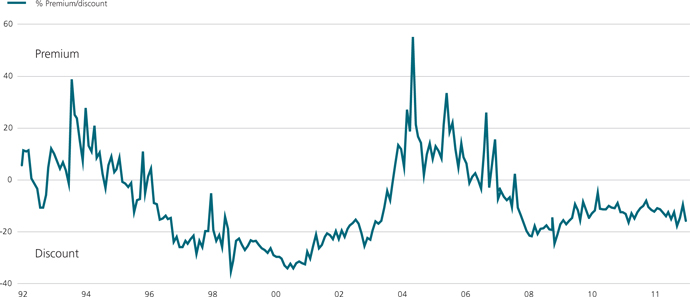
| Past performance is not a guide to future returns. |
| Source: Martin Currie Inc as at 31 December, 2011. |
10 YEAR DIVIDEND HISTORY CHART
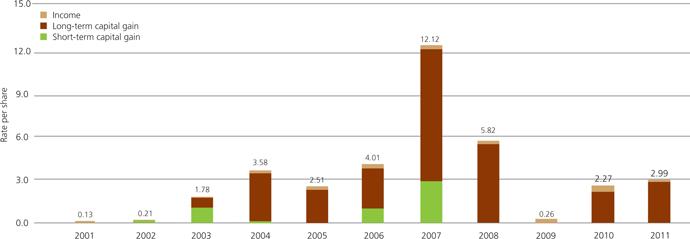
| 2001 | 2002 | 2003 | 2004 | 2005 | 2006 | 2007 | 2008 | 2009 | 2010 | 2011 | ||
| Total | 0.13 | 0.21 | 1.78 | 3.58 | 2.51 | 4.01 | 12.12 | 5.82 | 0.26 | 2.27 | 2.99 | |
| Income | 0.13 | 0.06 | 0.07 | 0.20 | 0.22 | 0.30 | 0.28 | 0.48 | 0.26 | 0.37 | 0.17 | |
| Long-term capital | 0.00 | 0.00 | 0.67 | 3.27 | 2.29 | 2.73 | 9.00 | 5.34 | 0.00 | 1.90 | 2.82 | |
| Short-term capital | 0.00 | 0.15 | 1.04 | 0.11 | 0.00 | 0.98 | 2.84 | 0.00 | 0.00 | 0.00 | 0.00 |
Past performance is not a guide to future returns.
Source: State Street Bank and Trust Company.
| Sector | Company (BBG ticker) | Price | Holding | Value US$ | % of portfolio | |
| HONG KONG H | 23.6 | |||||
| China Medical System Holdings | 867 HK | HK$5.2 | 86,329,200 | $57,576,512 | 10.9 | |
| Shandong Weigao Group Medical Polymer | 1066 HK | HK$7.0 | 18,352,000 | $16,563,774 | 3.1 | |
| Sinopharm Group | 1099 HK | HK$18.7 | 6,056,800 | $14,536,071 | 2.7 | |
| Wumart Stores | 1025 HK | HK$16.2 | 6,341,750 | $13,260,290 | 2.5 | |
| Citic Securities | 6030 HK | HK$12.8 | 6,688,500 | $11,005,695 | 2.1 | |
| Asian Citrus Holdings | 73 HK | HK$4.1 | 8,814,000 | $4,596,063 | 0.9 | |
| Fook Woo | 923 HK | HK$1.4 | 25,314,000 | $4,465,182 | 0.8 | |
| Shandong Chenming Paper Holdings | 1812 HK | HK$3.8 | 6,072,196 | $2,994,349 | 0.6 | |
| TAIWAN | 20.1 | |||||
| FamilyMart | 5903 TT | NT$121.0 | 4,501,652 | $17,989,362 | 3.4 | |
| Ruentex Development Co | 9945 TT | NT$32.4 | 15,636,301 | $16,731,601 | 3.1 | |
| Uni-President Enterprises Corp. | 1216 TT | NT$44.3 | 10,625,335 | $15,527,959 | 2.9 | |
| Far Eastern Department Stores | 2903 TT | NT$35.7 | 11,922,460 | $14,056,997 | 2.6 | |
| Yuanta Financial Holdings | 2885 TT | NT$15.5 | 19,305,680 | $9,850,813 | 1.9 | |
| W T Microelectronics | 3036 TT | NT$39.1 | 6,426,000 | $8,298,048 | 1.6 | |
| China Metal Products | 1532 TT | NT$19.1 | 12,420,374 | $7,814,265 | 1.5 | |
| KGI Securities | 6008 TT | NT$10.8 | 17,321,078 | $6,178,131 | 1.2 | |
| Test-Rite International | 2908 TT | NT$20.8 | 8,457,000 | $5,809,492 | 1.1 | |
| Taiwan Life 4percent Conv Bond* | n/a | NT$64.2 | 200,000,000 | $4,240,827 | 0.8 | |
| HONG KONG | 18.5 | |||||
| Enn Energy | 2688 HK | HK$24.9 | 5,084,000 | $16,299,068 | 3.1 | |
| Huiyin Household Appliances | 1280 HK | HK$0.6 | 160,413,750 | $12,598,804 | 2.4 | |
| Natural Beauty Bio-Technology | 157 HK | HK$1.3 | 47,710,000 | $8,292,798 | 1.6 | |
| Ajisen China Holdings | 538 HK | HK$8.6 | 6,945,000 | $7,645,330 | 1.4 | |
| Far East Horizon | 3360 HK | HK$6.9 | 7,898,000 | $7,047,064 | 1.3 | |
| Ports Design | 589 HK | HK$11.7 | 4,549,500 | $6,888,567 | 1.3 | |
| Shenzhen International Holdings | 152 HK | HK$0.5 | 106,180,000 | $6,835,505 | 1.3 | |
| Tencent Holdings | 700 HK | HK$156.1 | 291,000 | $5,844,878 | 1.1 | |
| Shangri-La Asia | 69 HK | HK$13.4 | 3,316,683 | $5,722,247 | 1.1 | |
| China Water Affairs | 855 HK | HK$2.2 | 19,976,000 | $5,581,181 | 1.1 | |
| China Shineway Pharmaceutical Group | 2877 HK | HK$11.0 | 3,041,000 | $4,346,076 | 0.8 | |
| China Innovationpay Group | 8083 HK | HK$0.2 | 146,000,000 | $4,041,562 | 0.8 | |
| Golden Meditech Co | 801 HK | HK$0.9 | 35,040,000 | $3,879,899 | 0.7 | |
| Chaoda Modern Agriculture (Holdings) | 682 HK | HK$0.8 | 26,651,357 | $2,830,943 | 0.5 | |
| FUJI Food & Catering Services | 1175 HK | HK$0.0 | 5,462,000 | $0 | 0 | |
| EQUITY LINKED SECURITIES (‘A’ SHARES) | 14.9 | |||||
| Ping An Insurance | n/a | US$5.5 | 3,870,559 | $21,179,227 | 4.0 | |
| Wuliangye Yibin | n/a | US$5.2 | 2,334,507 | $12,158,389 | 2.3 | |
| ZTE Corp | n/a | US$2.7 | 4,099,499 | $11,007,552 | 2.1 | |
| Ufida Software | n/a | US$2.9 | 3,616,072 | $10,341,485 | 1.9 | |
| China United Network Communications | n/a | US$0.8 | 9,809,037 | $8,166,406 | 1.5 | |
| Suning Appliance | n/a | US$1.3 | 4,607,872 | $6,169,940 | 1.2 | |
| Shanghai Yuyuan Tourist | n/a | US$1.3 | 4,293,036 | $5,715,864 | 1.1 | |
| Qinghai Salt Lake Potash | n/a | US$5.1 | 814,450 | $4,136,951 | 0.8 | |
| USA | 6.7 | |||||
| WuXi PharmaTech Cayman | WX US | US$11.0 | 883,490 | $9,753,729 | 1.9 | |
| Hollysys Automation Technologies | HOLI US | US$8.3 | 925,700 | $7,701,824 | 1.5 | |
| Mindray Medical International | MR US | US$25.6 | 291,700 | $7,479,188 | 1.4 | |
| VanceInfo Technologies | VIT US | US$9.1 | 474,800 | $4,306,436 | 0.8 | |
| China New Borun Corp. | BORN US | US$3.1 | 1,202,859 | $3,764,949 | 0.7 | |
| Far East Energy | FEEC US | US$0.2 | 10,303,847 | $2,163,808 | 0.4 |
MONTHLY INSIGHT
| Sector | Company (BBG ticker) | Price | Holding | Value US$ | % of portfolio | |
| DIRECT | 6.2 | |||||
| China Bright | n/a | HK$8.7 | 14,665,617 | $16,503,257 | 3.1 | |
| Zong Su Foods | n/a | US$5,977.0 | 2,677 | $16,000,429 | 3.1 | |
| China Silicon Corp. | n/a | US$0.0 | 2,329,281 | $0 | 0.0 | |
| Hand Enterprise Solutions (preferred) | n/a | US$0.0 | 500,000 | $0 | 0.0 | |
| CHINA ‘A’ SHARE | 6.1 | |||||
| Hand Enterprise Solutions | 300170 CH | Rmb18.2 | 11,238,137 | $32,514,534 | 6.1 | |
| SINGAPORE | 2.4 | |||||
| China Fishery Group | CFG SP | SG$0.9 | 13,594,872 | $9,553,891 | 1.8 | |
| CDW Holding | CDW SP | SG$0.1 | 47,602,000 | $3,326,883 | 0.6 | |
| OTHER ASSETS & LIABILITIES | $8,283,968 | 1.5 |
INDEX DESCRIPTIONS
MSCI Golden Dragon Index
The MSCI Golden Dragon is a free float-adjusted market capitalization index that is designed to measure equity market performance in the China region. As of May 2005 the MSCI Golden Dragon Index consisted of the following country indices: China, Hong Kong and Taiwan.
Hang Seng China Enterprise Index
The Hang Seng China Enterprise Index is a capitalization-weighted index comprised of state-owned Chinese companies (H-shares) listed on the Hong Kong Stock Exchange and included in Hans Seng Mainland China index.
Shanghai Stock Exchange 180 Index
The Shanghai Stock Exchange 180 ‘A’ Share Index is a capitalization-weighted index. The index tracks the daily price performance of the 180 most representative ‘A’ share stocks listed on the Shanghai Stock Exchange.
| OBJECTIVE |
The investment objective of the Fund is to achieve long term capital appreciation. The Fund seeks to achieve its objective through investment in the equity securities of companies and other entities with significant assets, investments, production activities, trading or other business interests in China or which derive a significant part of their revenue from China.
The Fund has an operating policy that the Fund will invest at least 80% of its assets in China companies. For this purpose, ‘China companies’ are (i) companies for which the principal securities trading market is in China; (ii) companies for which the principal securities trading market is outside of China or in companies organized outside of China, that in both cases derive at least 50% of their revenues from goods or services sold or produced, or have a least 50% of their assets in China; or (iii) companies organized in China. Under the policy, China will mean the People’s Republic of China, including Hong Kong, and Taiwan. The Fund will provide its stockholders with at least 60 days’ prior notice of any change to this policy.
| CONTACTS |
The China Fund, Inc.
c/o State Street Bank and Trust Company
2 Avenue de Lafayette
PO Box 5049
Boston, MA 02206-5049
Tel: (1) 888 CHN-CALL (246 2255)
www.chinafundinc.com

IMPORTANT INFORMATION
This document is issued and approved by Martin Currie Inc (MC Inc), as investment adviser of The China Fund Inc (the Fund). MC Inc is authorised and regulated by the Financial Services Authority (FSA) and incorporated under limited liability in New York, USA. Registered in Scotland (No BR2575), registered address Saltire Court, 20 Castle Terrace, Edinburgh, EH1 2ES. Information herein is believed to be reliable but has not been verified by MC Inc. MC Inc makes no representation or warranty and does not accept any responsibility in relation to such information or for opinion or conclusion which the reader may draw from the newsletter.
The Fund is classified as a 'non-diversified' investment company under the US Investment Company Act of 1940 as amended. It meets the criteria of a closed ended US fund and its shares are listed on the New York Stock Exchange. MC Inc has been appointed investment adviser to the Fund.
Investors are advised that they will not generally benefit from the rules and regulations of the United Kingdom Financial Services and Markets Act 2000 and the FSA for the protection of investors, nor benefit from the United Kingdom Financial Services Compensation Scheme, nor have access to the Financial Services Ombudsman in the event of a dispute. Investors will also have no rights of cancellation under the FSA's Conduct of Business Sourcebook of the United Kingdom.
This newsletter does not constitute an offer of shares. MC Inc, its ultimate and intermediate holding companies, subsidiaries, affiliates, clients, directors or staff may, at any time, have a position in the market referred to herein, and may buy or sell securities, currencies, or any other financial instruments in such markets. The information or opinion expressed in this newsletter should not be construed to be a recommendation to buy or sell the securities, commodities, currencies or financial instruments referred to herein.
The information provided in this report should not be considered a recommendation to purchase or sell any particular security. There is no assurance that any securities discussed herein will remain in an account's portfolio at the time you receive this report or that securities sold have not been repurchased.
It should not be assumed that any of the securities transactions or holdings discussed here were or will prove to be profitable, or that the investment recommendations or decisions we make in the future will be profitable or will equal the investment performance of the securities discussed herein.
Investing in the Fund involves certain considerations in addition to the risks normally associated with making investments in securities. The value of the shares issued by the Fund, and the income from them, may go down as well as up and there can be no assurance that upon sale, or otherwise, investors will receive back the amount originally invested. There can be no assurance that you will receive comparable performance returns, or that investments will reflect the performance of the stock examples contained in this document. Movements in foreign exchange rates may have a separate effect, unfavorable as well as favorable, on the gain or loss otherwise experienced on an investment. Past performance is not a guide to future returns. Accordingly, the Fund is only suitable for investment by investors who are able and willing to withstand the total loss of their investment. In particular, prospective investors should consider the following risks:
| – | The companies quoted on Greater Chinese stock exchanges are exposed to the risks of political, social and religious instability, expropriation of assets or nationalisation, rapid rates of inflation, high interest rates, currency depreciation and fluctuations and changes in taxation, which may affect income and the value of investments. |
| – | At present, the securities market and the regulatory framework for the securities industry in China is at an early stage of development. The China Securities Regulatory Commission (CSRC) is responsible for supervising the national securities markets and producing relevant regulations. The Investment Regulations, under which the Fund invests in the People's Republic of China (PRC) and which regulate repatriation and currency conversion, are new. The Investment Regulations give CSRC and State Administration of Foreign Exchange (SAFE) wide discretions and there is no precedent or certainty as to how these discretions might be exercised, either now or in the future. The Fund may, from time to time, obtain access to the securities markets in China via Access Products. Such products carry additional risk and may be less liquid than the underlying securities which they represent. |
| – | During the past 15 years, the PRC government has been reforming the economic and political systems of the PRC, and these reforms are expected to continue, as evidenced by the recently announced changes. The Fund's operations and financial results could be adversely affected by adjustments in the PRC's state plans, political, economic and social conditions, changes in the policies of the PRC government such as changes in laws and regulations (or the interpretation thereof), measures which may be introduced to control inflation, changes in the rate or method of taxation, imposition of additional restrictions on currency conversion and the imposition of additional import restrictions. |
| – | PRC's disclosure and regulatory standards are in many respects less stringent than standards in certain Organisation for Economic Co-operation and Development (OECD) countries, and there may be less publicly available or less reliable information about PRC companies than is regularly published by or about companies from OECD countries. |
| – | The Shanghai Stock Exchange and Shenzhen Stock Exchange have lower trading volumes than most OECD exchanges and the market capitalisations of listed companies are small compared to those on more developed exchanges in developed markets. The listed equity securities of many companies in the PRC are accordingly materially less liquid, subject to greater dealing spreads and experience materially greater volatility than those of OECD countries. These factors could negatively affect the Fund's NAV. |
| – | The Fund invests primarily in securities denominated in other currencies but its NAV will be quoted in US dollars. Accordingly, a change in the value of such securities against US dollars will result in a corresponding change in the US dollar NAV. |
| – | The marketability of quoted shares may be limited due to foreign investment restrictions, wide dealing spreads, exchange controls, foreign ownership restrictions, the restricted opening of stock exchanges and a narrow range of investors. Trading volume may be lower than on more developed stockmarkets, and equities are less liquid. Volatility of prices can also be greater than in more developed stockmarkets. The infrastructure for clearing, settlement and registration on the primary and secondary markets may be underdeveloped. Under certain circumstances, there may be delays in settling transactions in some of the markets. |
![]()
Martin Currie Inc registered in Scotland (no BR2575)
Registered office: Saltire Court, 20 Castle Terrace, Edinburgh EH1 2ES
Tel: 44 (0) 131 229 5252 Fax: 44 (0) 131 228 5959 www.martincurrie.com
North American office: 1350 Avenue of the Americas, Suite 3010, New York, NY
10019, USA Tel: (1) 212 258 1900 Fax: (1) 212 258 1919
Authorised and regulated by the Financial Services Authority and incorporated with
limited liability in New York, USA. Registered with the SEC as an investment adviser.
Please note: calls to the above numbers may be recorded.