Attached files
| file | filename |
|---|---|
| 8-K - 8-K - CATERPILLAR INC | a12-3475_18k.htm |
Exhibit 99.1
Caterpillar Inc.
4Q 2011 Earnings Release
|
|
January 26, 2012 |
FOR IMMEDIATE RELEASE
Caterpillar Reports Record Sales and Profit for the Fourth Quarter and Full-Year 2011;
2011 Profit up 83 Percent from 2010
Momentum Carries into 2012 with Sales and Revenues Outlook Raised to $68 to $72 Billion
PEORIA, Ill.— Driven by outstanding execution and stronger global demand, Caterpillar Inc. (NYSE: CAT) delivered record-breaking 2011 sales and revenues of $60.138 billion, an increase of 41 percent from $42.588 billion in 2010. Profit in 2011 was $4.928 billion, an increase of 83 percent from $2.700 billion in 2010. Profit per share of $7.40 was up 78 percent from $4.15 in 2010. Excluding the impact of the acquisition of Bucyrus International, Inc. (Bucyrus), 2011 profit was $7.79 per share, up 88 percent from a year ago.
Fourth-quarter sales and revenues in 2011 were an all-time quarterly record at $17.243 billion, an increase of 35 percent compared with $12.807 billion in the fourth quarter of 2010. Fourth-quarter profit was $1.547 billion compared with $968 million in the fourth quarter of 2010. Profit of $2.32 per share was 58 percent higher than the $1.47 per share in the fourth quarter of 2010.
“Our strategy is squarely focused on customers, and in 2011 our employees, suppliers and dealers delivered. We improved product quality, invested significantly in manufacturing capacity and product development, and improved our market position. We completed two large acquisitions—Bucyrus and Motoren-Werke Mannheim Holding GmbH (MWM)—in important growth industries that are a great strategic fit and provide our customers an even broader range of products,” said Caterpillar Chairman and Chief Executive Officer Doug Oberhelman.
“We also delivered for stockholders with outstanding financial results, beating our previous 2008 profit record of $5.66 per share by more than 30 percent. It was a great year for cash generation as well with our Machinery and Power Systems (M&PS) operating cash flow near $8 billion—our best year ever,” Oberhelman added.
(more)
“The 2011 increase in sales and revenues was the largest percentage increase in any year since 1947, and much of it was driven by demand for Caterpillar products and services outside of the United States. As a result, 2011 was a record-breaking year for U.S. exports at nearly $20 billion, which supported thousands of jobs in the United States, demonstrating the tangible benefits of free trade. Sales and export growth creates jobs, both in the United States and around the world. Not including acquisitions, our global workforce grew by more than 14,000 in 2011, and since the start of 2010, we have increased our workforce by more than 33,000, with more than 14,000 of those jobs in the United States,” Oberhelman added.
2011 Accomplishments
Strong growth in most of the industries we serve and a focus on executing our updated strategy provided the foundation of our record-breaking financial results in 2011. Our strategy is centered on operational excellence that drives value for our customers, and in 2011 we improved in a wide range of operational areas around the company.
· The Caterpillar Production System (CPS) is the way of life at Caterpillar and has been a principal driver in improvements in safety, quality, velocity and efficiency. We continued to improve in each of these areas in 2011 and achieved new records in many areas.
· The safety of our workforce, contractors and visitors is a fundamental value for Caterpillar, and we are pleased that our enterprise safety metrics improved again in 2011—an 83-percent improvement in safety performance since 2003.
· Product quality is important to customers, and in 2011 we continued to see meaningful improvements in product reliability.
· Given the sizable increase in demand in 2011, we stretched our factories and our suppliers to produce more. The results were outstanding, and we were able to significantly increase production and improve our on-time delivery performance. We thank our suppliers for a remarkable year in support of our business.
· For many of our products, demand in 2011 was very strong and above capacity. Throughout the year at our factories around the world, we, along with many of our suppliers, invested in production capacity to support customers. Despite the increases in capacity and expected additions in 2012, we are still very tight on many products and are currently quoting extended delivery times for some products. For example, we are now quoting delivery times into 2014 for many models of large trucks.
· 2011 saw significant new product introductions related to new emissions requirements in the United States and Europe and continued the most extensive new product development program in Caterpillar history. The introduction of these new products has gone well, and feedback from dealers and customers has been very positive.
· Another important consideration for customers is aftermarket parts availability, and we made notable improvements in delivery performance in 2011.
· While it was a good year for the industries we serve, it was an even better year for Caterpillar. In the aggregate, and for most of our products, our sales increased at a faster rate than the overall industry. Better quality, good delivery performance, our investment in capacity, the performance of our suppliers and modest price increases all helped drive better value for our customers and better performance for Caterpillar.
· Over the past year and a half we have made three large acquisitions—Bucyrus, Electro-Motive Diesel (EMD), and MWM. Integrating them into Caterpillar is a high priority and a major focus, and we are pleased with the progress.
· Our working capital metrics in 2011 notably improved for payables and receivables, and the improvements were important to the generation of record M&PS operating cash flow.
· Leadership development is critical for our long-term success. In 2011, we invested in our new leadership development program, which is designed to build high-performing teams and prepare leaders for the future. More than 7,000 people were involved in the program in 2011.
2012 Outlook
The outlook for 2012 sales and revenues has increased and is expected to be in a range of $68 to $72 billion. Profit per share is expected to be about $9.25 at the middle of the sales and revenues range. The outlook includes full-year results for the two large acquisitions that we completed in 2011—Bucyrus and MWM.
“We’re expecting 2012 to be another year of good growth and continued focus on executing our strategy. While we have much to do in 2012, we’ll be particularly focused on four things—continuing to improve quality, our investment in product development, integrating our acquisitions and adding production capacity. We’re very tight on production capacity for many of our products and are continuing to invest in new and existing factories. Our investments in capital expenditures and R&D will certainly add cost in 2012, but it’s the right thing to do. We expect 2012 to be a new sales record at a time when construction activity in the United States and Europe—two large markets for us—are still depressed. Our employees and suppliers have done a great job taking care of our customers, but we have to be prepared for recovery in the developed world beyond 2012 and continuing growth in emerging markets,” Oberhelman said.
“In 2011 our investment in M&PS capital expenditures was $2.6 billion, with nearly 60 percent of that investment in the United States. For 2012, we expect capital expenditures of about $4 billion. We are transforming Caterpillar with an intense focus on customers driving a reinvigorated sense of urgency as we invest and grow the company like never before. As I look forward to the goals we set for 2015, I am more confident than ever that we will deliver, and we’re in a hurry to do it,” Oberhelman said.
Notes:
· Glossary of terms is included on pages 32-33; first occurrence of terms shown in bold italics.
· Information on non-GAAP financial measures is included on page 34.
For more than 85 years, Caterpillar Inc. has been making sustainable progress possible and driving positive change on every continent. With 2011 sales and revenues of $60.138 billion, Caterpillar is the world’s leading manufacturer of construction and mining equipment, diesel and natural gas engines, industrial gas turbines and diesel-electric locomotives. The company also is a leading services provider through Caterpillar Financial Services, Caterpillar Remanufacturing Services, Caterpillar Logistics Services and Progress Rail Services. More information is available at: http://www.caterpillar.com.
Caterpillar contact: Jim Dugan, Corporate Public Affairs, (309) 494-4100 (Office) or (309) 360-7311 (Mobile)
FORWARD-LOOKING STATEMENTS
Certain statements in this release relate to future events and expectations and are forward-looking statements within the meaning of the Private Securities Litigation Reform Act of 1995. These statements are subject to known and unknown factors that may cause Caterpillar’s actual results to be different from those expressed or implied in the forward-looking statements. Words such as “believe,” “estimate,” “will be,” “will,” “would,” “expect,” “anticipate,” “plan,” “project,” “intend,” “could,” “should” or other similar words or expressions often identify forward-looking statements. All statements other than statements of historical fact are forward-looking statements, including, without limitation, statements regarding our outlook, projections, forecasts or trend descriptions. These statements do not guarantee future performance, and Caterpillar does not undertake to update its forward-looking statements.
It is important to note that Caterpillar’s actual results may differ materially from those described or implied in its forward-looking statements based on a number of factors, including, but not limited to: (i) global economic conditions and economic conditions in the industries and markets Caterpillar serves; (ii) government monetary or fiscal policies and government spending on infrastructure; (iii) commodity or component price increases and/or limited availability of raw materials and component products, including steel; (iv) Caterpillar’s and its customers’, dealers’ and suppliers’ ability to access and manage liquidity; (v) political and economic risks associated with our global operations, including changes in laws, regulations or government policies, currency restrictions, restrictions on repatriation of earnings, burdensome tariffs or quotas, national and international conflict, including terrorist acts and political and economic instability or civil unrest in the countries in which Caterpillar operates; (vi) Caterpillar’s and Cat Financial’s ability to maintain their respective credit ratings, material increases in either company’s cost of borrowing or an inability of either company to access capital markets; (vii) financial condition and credit worthiness of Cat Financial’s customers; (viii) inability to realize expected benefits from acquisitions and divestitures, including the acquisition of Bucyrus International, Inc.; (ix) international trade and investment policies, such as import quotas, capital controls or tariffs; (x) the possibility that Caterpillar’s introduction of Tier 4 emissions compliant machines and engines is not successful; (xi) market acceptance of Caterpillar’s products and services; (xii) effects of changes in the competitive environment, which may include decreased market share, lack of acceptance of price increases, and/or negative changes to our geographic and product mix of sales; (xiii) union disputes or other employee relations issues; (xiv) Caterpillar’s ability to successfully implement the Caterpillar Production System or other productivity initiatives; (xv) adverse changes in sourcing practices of our dealers or original equipment manufacturers; (xvi) compliance costs associated with environmental laws and regulations; (xvii) alleged or actual violations of trade or anti-corruption laws and regulations; (xviii) additional tax expense or exposure; (xix) currency fluctuations, particularly increases and decreases in the U.S. dollar against other currencies; (xx) failure of Caterpillar or Cat Financial to comply with financial covenants in their respective credit facilities; (xxi) increased funding obligations under our pension plans; (xxii) significant legal proceedings, claims, lawsuits or investigations; (xxiii) imposition of operational restrictions or compliance requirements if carbon emissions legislation and/or regulations are adopted; (xxiv) changes in accounting standards or adoption of new accounting standards; (xxv) adverse effects of natural disasters; and (xxvi) other factors described in more detail under “Item 1A. Risk Factors” in Part I of our Form 10-K filed with the SEC on February 22, 2011 for the year ended December 31, 2010. This filing is available on our website at www.caterpillar.com/secfilings.
Key Points
Fourth Quarter 2011
(Dollars in millions except per share data)
|
|
|
Fourth Quarter |
|
Fourth Quarter |
|
$ Change |
|
% Change |
| |||
|
Machinery and Power Systems Sales |
|
$ |
16,557 |
|
$ |
12,141 |
|
$ |
4,416 |
|
36 |
% |
|
Financial Products Revenues |
|
686 |
|
666 |
|
20 |
|
3 |
% | |||
|
Total Sales and Revenues |
|
$ |
17,243 |
|
$ |
12,807 |
|
$ |
4,436 |
|
35 |
% |
|
Profit |
|
$ |
1,547 |
|
$ |
968 |
|
$ |
579 |
|
60 |
% |
|
Profit per common share - diluted |
|
$ |
2.32 |
|
$ |
1.47 |
|
$ |
0.85 |
|
58 |
% |
|
|
|
|
|
|
|
|
|
|
| |||
|
Excluding Bucyrus Impact |
|
|
|
|
|
|
|
|
| |||
|
Total Sales and Revenues |
|
$ |
15,854 |
|
$ |
12,807 |
|
$ |
3,047 |
|
24 |
% |
|
Profit per common share - diluted |
|
$ |
2.25 |
|
$ |
1.47 |
|
$ |
0.78 |
|
53 |
% |
Full Year 2011
(Dollars in millions except per share data)
|
|
|
Full Year |
|
Full Year |
|
$ Change |
|
% Change |
| |||
|
Machinery and Power Systems Sales |
|
$ |
57,392 |
|
$ |
39,867 |
|
$ |
17,525 |
|
44 |
% |
|
Financial Products Revenues |
|
2,746 |
|
2,721 |
|
25 |
|
1 |
% | |||
|
Total Sales and Revenues |
|
$ |
60,138 |
|
$ |
42,588 |
|
$ |
17,550 |
|
41 |
% |
|
Profit |
|
$ |
4,928 |
|
$ |
2,700 |
|
$ |
2,228 |
|
83 |
% |
|
Profit per common share - diluted |
|
$ |
7.40 |
|
$ |
4.15 |
|
$ |
3.25 |
|
78 |
% |
|
|
|
|
|
|
|
|
|
|
| |||
|
Excluding Bucyrus Impact |
|
|
|
|
|
|
|
|
| |||
|
Total Sales and Revenues |
|
$ |
57,614 |
|
$ |
42,588 |
|
$ |
15,026 |
|
35 |
% |
|
Profit per common share - diluted |
|
$ |
7.79 |
|
$ |
4.15 |
|
$ |
3.64 |
|
88 |
% |
2011 Highlights
· 2011 sales and revenues were $60.138 billion, an all-time record. Sales and revenues excluding Bucyrus were $57.614 billion—up 35 percent from 2010.
· Profit per share was $7.40 in 2011, an all-time record. Profit per share excluding Bucyrus was $7.79—up 88 percent from 2010.
· M&PS operating cash flow was a record $7.972 billion in 2011, compared with $5.638 billion in 2010—an increase of 41 percent.
2012 Outlook
· Sales and revenues in 2012 are expected to be in a range of $68 to $72 billion, an increase from $60.138 billion in 2011. The outlook includes a full year of results for the two large acquisitions that we completed in 2011—Bucyrus and MWM.
· Profit per share is expected to be about $9.25 at the middle of the sales and revenues range. Our outlook for higher sales is the most significant reason for the expected improvement in profit in 2012.
· We expect capital expenditures for 2012 to be about $4.0 billion—with about half in the United States.
CONSOLIDATED RESULTS
2011 vs. 2010
CONSOLIDATED SALES AND REVENUES
The chart above graphically illustrates reasons for the change in Consolidated Sales and Revenues between 2010 (at left) and 2011 (at right). Items favorably impacting sales and revenues appear as upward stair steps with the corresponding dollar amounts above each bar, while items negatively impacting sales and revenues appear as downward stair steps with dollar amounts reflected in parentheses above each bar. The bar entitled Sales Volume includes the sales impact of the divestiture of Carter Machinery Company, Inc. (Carter). Caterpillar management utilizes these charts internally to visually communicate with the company’s Board of Directors and employees.
Sales and Revenues
Total sales and revenues were $60.138 billion in 2011, an increase of $17.550 billion, or 41 percent, from 2010.
The improvement was largely a result of $12.533 billion higher sales volume. While sales for both new equipment and after-market parts improved, the more significant increase was for new equipment. Currency impacts added $831 million in sales, and price realization improved $724 million. Sales for Bucyrus, which was acquired during the third quarter of 2011, were $2.524 billion; and EMD, which was acquired during the third quarter of 2010, added sales of $861 million. MWM, acquired during the fourth quarter of 2011, added sales of $52 million. Financial Products revenues increased slightly.
The improvement in sales volume occurred across the world in all geographic regions and in nearly all segments. The volume increase was primarily the result of higher end user demand. In addition, dealers added about $2.5 billion to new machine inventories in 2011 compared with about $900 million in 2010. The increase in dealer inventory in 2011 occurred in all regions, most significantly in Asia/Pacific. Dealer-reported inventory in months of supply was higher than the end of 2010 but similar to the historical average.
Growth in the global economy improved demand for commodities, and commodity prices remained attractive for investment. This was positive for mining in all regions of the world.
Construction activity continued to grow in most developing countries. In developed countries, despite a continued weak level of construction activity, sales increased. The increase was primarily a result of customers upgrading machine fleets by replacing older equipment and dealers refreshing equipment in their rental fleets.
Worldwide demand for energy at price levels that encourage continued investment resulted in higher sales of engines and turbines for petroleum applications. Sales for electric power applications continued to improve as a result of worldwide economic growth. Sales of our industrial engines and rail products and services also increased.
Consolidated Operating Profit
The chart above graphically illustrates reasons for the change in Consolidated Operating Profit between 2010 (at left) and 2011 (at right). Items favorably impacting operating profit appear as upward stair steps with the corresponding dollar amounts above each bar, while items negatively impacting operating profit appear as downward stair steps with dollar amounts reflected in parentheses above each bar. Caterpillar management utilizes these charts internally to visually communicate with the company’s Board of Directors and employees. The bar entitled Other includes consolidating adjustments and Machinery and Power Systems other operating (income) expenses.
Operating profit in 2011 was $7.153 billion compared with $3.963 billion in 2010. The improvement was primarily the result of higher sales volume and improved price realization. The improvements were partially offset by higher manufacturing costs, higher selling, general and administrative (SG&A) and research and development (R&D) expenses and the negative impact of currency.
Manufacturing costs were up $1.141 billion, primarily due to higher period costs, material and freight costs. The increase in period costs was due to higher production volume, capacity expansion programs and increased incentive compensation. Material and freight costs were up from 2010. The increase in material was primarily due to higher steel costs.
SG&A and R&D expenses increased $762 million primarily due to higher volume, increased costs to support product programs and increased incentive compensation.
Currency had a $410 million unfavorable impact on operating profit as the benefit from $831 million on sales was more than offset by a negative $1.241 billion impact on costs. The unfavorable currency impact was primarily due to the Japanese yen.
Financial Products’ operating profit improved by $196 million.
Operating profit was negatively impacted by $32 million related to Bucyrus, and EMD negatively impacted operating profit by $16 million.
Other Profit/Loss Items
· Interest expense excluding Financial Products increased $53 million from 2010 due to debt issued to complete the acquisition of Bucyrus.
· Other income/expense was expense of $32 million compared with income of $130 million in 2010. The unfavorable change was primarily a result of losses on interest rate swaps put in place in anticipation of issuing debt for the acquisition of Bucyrus.
· The provision for income taxes for 2011 reflects an effective tax rate of 27 percent compared with 25 percent for 2010, excluding the items discussed below. The 2011 effective tax rate is higher than 2010 primarily due to changes in our geographic mix of profits from a tax perspective.
The provision for income taxes for 2011 also includes net benefits of $96 million due to repatriation of non-U.S. earnings and a release of a valuation allowance offset by an increase in prior year unrecognized tax benefits. This compares to a net charge of $30 million in 2010.
Global Workforce
Caterpillar worldwide full-time employment was 125,099 at the end of 2011 compared with 104,490 at the end of 2010, an increase of 20,609 full-time employees. In addition, we increased the flexible workforce by 5,818 for a total increase in the global workforce of 26,427.
We increased our workforce to support higher sales volume across all geographic regions. In addition, acquisitions, primarily Bucyrus and MWM, added 13,720 people, while the sale of Carter and a portion of the Bucyrus distribution business reduced the workforce by 1,506 people.
|
|
|
December 31, |
| ||||
|
|
|
2011 |
|
2010 |
|
Change |
|
|
Full-time employment |
|
125,099 |
|
104,490 |
|
20,609 |
|
|
Flexible workforce |
|
27,884 |
|
22,066 |
|
5,818 |
|
|
Total |
|
152,983 |
|
126,556 |
|
26,427 |
|
|
|
|
|
|
|
|
|
|
|
Summary of change |
|
|
|
|
|
|
|
|
U.S. workforce additions |
|
|
|
|
|
6,496 |
|
|
Non-U.S. workforce additions |
|
|
|
|
|
7,717 |
|
|
Total additions |
|
|
|
|
|
14,213 |
|
|
|
|
|
|
|
|
|
|
|
Acquisitions/divestitures net |
|
|
|
|
|
12,214 |
|
|
Total |
|
|
|
|
|
26,427 |
|
SEGMENT RESULTS
Sales and Revenues by Geographic Region
|
(Millions of dollars) |
|
Total |
|
% |
|
North |
|
% |
|
Latin |
|
% |
|
EAME |
|
% |
|
Asia/ |
|
% |
| |||||
|
2011 |
|
|
|
|
|
|
|
|
|
|
|
|
|
|
|
|
|
|
|
|
| |||||
|
Construction Industries(1) |
|
$ |
19,667 |
|
45 |
% |
$ |
5,985 |
|
46 |
% |
$ |
3,045 |
|
49 |
% |
$ |
4,768 |
|
62 |
% |
$ |
5,869 |
|
31 |
% |
|
Resource Industries(2) |
|
15,629 |
|
80 |
% |
4,963 |
|
73 |
% |
2,831 |
|
56 |
% |
3,228 |
|
86 |
% |
4,607 |
|
104 |
% | |||||
|
Power Systems(3) |
|
20,114 |
|
29 |
% |
8,331 |
|
31 |
% |
2,363 |
|
24 |
% |
5,752 |
|
31 |
% |
3,668 |
|
28 |
% | |||||
|
All Other Segments (4) |
|
2,021 |
|
(6 |
)% |
970 |
|
(20 |
)% |
103 |
|
(5 |
)% |
585 |
|
9 |
% |
363 |
|
20 |
% | |||||
|
Corporate Items and Eliminations |
|
(39 |
) |
|
|
(32 |
) |
|
|
(1 |
) |
|
|
(4 |
) |
|
|
(2 |
) |
|
| |||||
|
Machinery & Power Systems Sales |
|
$ |
57,392 |
|
44 |
% |
$ |
20,217 |
|
39 |
% |
$ |
8,341 |
|
42 |
% |
$ |
14,329 |
|
49 |
% |
$ |
14,505 |
|
47 |
% |
|
|
|
|
|
|
|
|
|
|
|
|
|
|
|
|
|
|
|
|
|
|
| |||||
|
Financial Products Segment |
|
3,003 |
|
2 |
% |
1,687 |
|
(5 |
)% |
361 |
|
17 |
% |
438 |
|
3 |
% |
517 |
|
18 |
% | |||||
|
Corporate Items and Eliminations |
|
(257 |
) |
|
|
(171 |
) |
|
|
(29 |
) |
|
|
(28 |
) |
|
|
(29 |
) |
|
| |||||
|
Financial Products Revenues |
|
$ |
2,746 |
|
1 |
% |
$ |
1,516 |
|
(4 |
)% |
$ |
332 |
|
12 |
% |
$ |
410 |
|
(4 |
)% |
$ |
488 |
|
15 |
% |
|
|
|
|
|
|
|
|
|
|
|
|
|
|
|
|
|
|
|
|
|
|
| |||||
|
Consolidated Sales and Revenues |
|
$ |
60,138 |
|
41 |
% |
$ |
21,733 |
|
35 |
% |
$ |
8,673 |
|
41 |
% |
$ |
14,739 |
|
47 |
% |
$ |
14,993 |
|
45 |
% |
|
|
|
|
|
|
|
|
|
|
|
|
|
|
|
|
|
|
|
|
|
|
| |||||
|
2010 |
|
|
|
|
|
|
|
|
|
|
|
|
|
|
|
|
|
|
|
|
| |||||
|
Construction Industries (1) |
|
$ |
13,572 |
|
|
|
$ |
4,108 |
|
|
|
$ |
2,048 |
|
|
|
$ |
2,941 |
|
|
|
$ |
4,475 |
|
|
|
|
Resource Industries(2) |
|
8,667 |
|
|
|
2,866 |
|
|
|
1,809 |
|
|
|
1,737 |
|
|
|
2,255 |
|
|
| |||||
|
Power Systems(3) |
|
15,537 |
|
|
|
6,376 |
|
|
|
1,900 |
|
|
|
4,393 |
|
|
|
2,868 |
|
|
| |||||
|
All Other Segments(4) |
|
2,156 |
|
|
|
1,208 |
|
|
|
108 |
|
|
|
538 |
|
|
|
302 |
|
|
| |||||
|
Corporate Items and Eliminations |
|
(65 |
) |
|
|
(36 |
) |
|
|
(8 |
) |
|
|
(14 |
) |
|
|
(7 |
) |
|
| |||||
|
Machinery & Power Systems Sales |
|
$ |
39,867 |
|
|
|
$ |
14,522 |
|
|
|
$ |
5,857 |
|
|
|
$ |
9,595 |
|
|
|
$ |
9,893 |
|
|
|
|
|
|
|
|
|
|
|
|
|
|
|
|
|
|
|
|
|
|
|
|
|
| |||||
|
Financial Products Segment |
|
2,946 |
|
|
|
1,773 |
|
|
|
308 |
|
|
|
427 |
|
|
|
438 |
|
|
| |||||
|
Corporate Items and Eliminations |
|
(225 |
) |
|
|
(202 |
) |
|
|
(11 |
) |
|
|
— |
|
|
|
(12 |
) |
|
| |||||
|
Financial Products Revenues |
|
$ |
2,721 |
|
|
|
$ |
1,571 |
|
|
|
$ |
297 |
|
|
|
$ |
427 |
|
|
|
$ |
426 |
|
|
|
|
|
|
|
|
|
|
|
|
|
|
|
|
|
|
|
|
|
|
|
|
|
| |||||
|
Consolidated Sales and Revenues |
|
$ |
42,588 |
|
|
|
$ |
16,093 |
|
|
|
$ |
6,154 |
|
|
|
$ |
10,022 |
|
|
|
$ |
10,319 |
|
|
|
|
(1) |
|
Does not include inter-segment sales of $575 million and $674 million in 2011 and 2010, respectively. |
|
(2) |
|
Does not include inter-segment sales of $1,162 million and $894 million in 2011 and 2010, respectively. |
|
(3) |
|
Does not include inter-segment sales of $2,339 million and $1,684 million in 2011 and 2010, respectively. |
|
(4) |
|
Does not include inter-segment sales of $3,413 million and $2,808 million in 2011 and 2010, respectively. |
Sales and Revenues by Segment
|
(Millions of dollars) |
|
2010 |
|
Sales |
|
Price |
|
Currency |
|
Acquisitions |
|
Other |
|
2011 |
|
$ Change |
|
% |
| ||||||||
|
Construction Industries |
|
$ |
13,572 |
|
$ |
5,379 |
|
$ |
243 |
|
$ |
473 |
|
$ |
— |
|
$ |
— |
|
$ |
19,667 |
|
$ |
6,095 |
|
45 |
% |
|
Resource Industries |
|
8,667 |
|
4,115 |
|
224 |
|
99 |
|
2,524 |
|
— |
|
15,629 |
|
6,962 |
|
80 |
% | ||||||||
|
Power Systems |
|
15,537 |
|
3,193 |
|
256 |
|
215 |
|
913 |
|
— |
|
20,114 |
|
4,577 |
|
29 |
% | ||||||||
|
All Other Segments |
|
2,156 |
|
(184 |
) |
5 |
|
44 |
|
— |
|
— |
|
2,021 |
|
(135 |
) |
(6 |
)% | ||||||||
|
Corporate Items and Eliminations |
|
(65 |
) |
30 |
|
(4 |
) |
— |
|
— |
|
— |
|
(39 |
) |
26 |
|
|
| ||||||||
|
Machinery & Power Systems Sales |
|
$ |
39,867 |
|
$ |
12,533 |
|
$ |
724 |
|
$ |
831 |
|
$ |
3,437 |
|
$ |
— |
|
$ |
57,392 |
|
$ |
17,525 |
|
44 |
% |
|
|
|
|
|
|
|
|
|
|
|
|
|
|
|
|
|
|
|
|
| ||||||||
|
Financial Products Segment |
|
2,946 |
|
— |
|
— |
|
— |
|
— |
|
57 |
|
3,003 |
|
57 |
|
2 |
% | ||||||||
|
Corporate Items and Eliminations |
|
(225 |
) |
— |
|
— |
|
— |
|
— |
|
(32 |
) |
(257 |
) |
(32 |
) |
|
| ||||||||
|
Financial Products Revenues |
|
$ |
2,721 |
|
$ |
— |
|
$ |
— |
|
$ |
— |
|
$ |
— |
|
$ |
25 |
|
$ |
2,746 |
|
$ |
25 |
|
1 |
% |
|
|
|
|
|
|
|
|
|
|
|
|
|
|
|
|
|
|
|
|
| ||||||||
|
Consolidated Sales and Revenues |
|
$ |
42,588 |
|
$ |
12,533 |
|
$ |
724 |
|
$ |
831 |
|
$ |
3,437 |
|
$ |
25 |
|
$ |
60,138 |
|
$ |
17,550 |
|
41 |
% |
Operating Profit by Segment
|
(Millions of dollars) |
|
2011 |
|
2010 |
|
$ |
|
% |
| |||
|
Construction Industries |
|
$ |
2,056 |
|
$ |
783 |
|
$ |
1,273 |
|
163 |
% |
|
Resource Industries |
|
3,334 |
|
1,789 |
|
1,545 |
|
86 |
% | |||
|
Power Systems |
|
3,053 |
|
2,288 |
|
765 |
|
33 |
% | |||
|
All Other Segments |
|
837 |
|
720 |
|
117 |
|
16 |
% | |||
|
Corporate Items and Eliminations |
|
(2,457 |
) |
(1,793 |
) |
(664 |
) |
|
| |||
|
Machinery & Power Systems |
|
$ |
6,823 |
|
$ |
3,787 |
|
$ |
3,036 |
|
80 |
% |
|
Financial Products Segment |
|
587 |
|
429 |
|
158 |
|
37 |
% | |||
|
Corporate Items and Eliminations |
|
(4 |
) |
(42 |
) |
38 |
|
|
| |||
|
Financial Products |
|
$ |
583 |
|
$ |
387 |
|
$ |
196 |
|
51 |
% |
|
Consolidating Adjustments |
|
(253 |
) |
(211 |
) |
(42 |
) |
|
| |||
|
Consolidated Operating Profit |
|
$ |
7,153 |
|
$ |
3,963 |
|
$ |
3,190 |
|
80 |
% |
Construction Industries
Construction Industries’ sales were $19.667 billion in 2011, an increase of $6.095 billion, or 45 percent, from 2010. The improvement in sales was a result of significantly higher sales volume in all geographic regions and across all major products. While sales for both new equipment and after-market parts improved, the more significant increase was for new equipment. In addition to volume, sales were higher as a result of currency impacts from a weaker U.S. dollar, and price realization improved.
Continuing economic growth in most developing countries resulted in higher sales overall. New machine sales were above or near record levels across much of the developing world. While demand for product was strong, the supply of many excavator models, which are key products for construction across the world, was limited by our capacity for the majority of the year.
In most developed countries, sales increased significantly despite relatively weak construction activity. The improvement in sales was largely driven by the need for customers to upgrade machine fleets by replacing older equipment and from dealers refreshing equipment in their rental fleets. Despite the increase from a year ago, sales of new machines to customers in developed countries remain significantly below previous peak levels. The size of rental fleets increased slightly from post-recession lows, but the average age remained historically high.
Construction Industries’ profit was $2.056 billion in 2011 compared with $783 million in 2010. The improvement was primarily due to higher sales volume and improved price realization. The benefit from higher sales was partially offset by increases in period manufacturing and freight costs. The period manufacturing cost increase is primarily due to higher production volume, start-up costs associated with global capacity expansion and increased incentive compensation. SG&A and R&D expenses were about flat.
Resource Industries
Resource Industries’ sales were $15.629 billion in 2011, an increase of $6.962 billion, or 80 percent, from 2010. The sales increase was a result of higher volume and the acquisition of Bucyrus during the third quarter of 2011. While sales for both new equipment and after-market parts improved, the more significant increase was for new equipment.
Growth in the global economy increased demand for commodities and kept commodity prices at levels that encouraged investment, supporting higher sales of equipment for mining.
Since the acquisition on July 8, 2011, Bucyrus sales were $2.524 billion, with $610 million in North America, $429 million in Latin America, $516 million in EAME and $969 million in Asia/Pacific.
Resource Industries’ profit was $3.334 billion in 2011 compared with $1.789 billion in 2010. The impact of Bucyrus lowered segment profit by $32 million and included substantial deal-related and integration costs. A table on pages 27-28 provides further detail of the Bucyrus impact.
Excluding Bucyrus, Resource Industries’ profit increased $1.577 billion, primarily due to higher sales volume and price realization. The improvement was partially offset by higher manufacturing and R&D costs. The manufacturing cost increase was primarily due to higher period costs related to increased production volume and increased material and freight costs.
Power Systems
Power Systems’ sales were $20.114 billion in 2011, an increase of $4.577 billion, or 29 percent, from 2010. Most of the improvement was a result of higher sales volume and the acquisition of EMD. Sales were up in all geographic regions.
Worldwide demand for energy at price levels that encourage continued investment resulted in higher demand for engines and turbines for petroleum applications. Electric power continued to improve as a result of worldwide economic growth. Sales of our industrial engines and rail products and services also increased.
Power Systems’ profit was $3.053 billion in 2011 compared with $2.288 billion in 2010. The improvement was primarily due to higher sales volume, which included the impact of an unfavorable mix of products, and improved price realization. The improvements were partially offset by higher manufacturing costs and SG&A and R&D expenses. The increased manufacturing costs were primarily driven by higher volume, while freight, incentive compensation and material costs also increased. SG&A and R&D expenses were higher due to increased incentive compensation, costs to support product programs and growth-related costs.
Sales for EMD, which was acquired during the third quarter of 2010, increased $861 million, and segment profit related to EMD decreased $7 million.
Financial Products Segment
Financial Products’ revenues were $3.003 billion, an increase of $57 million, or 2 percent, from 2010. The increase was primarily due to a favorable impact from higher average earning assets, a favorable change from returned or repossessed equipment and higher miscellaneous net revenues, partially offset by an unfavorable impact from lower interest rates on new and existing finance receivables and a decrease in Cat Insurance revenues.
Financial Products’ profit of $587 million was up $158 million from 2010. The increase was primarily due to a $52 million favorable impact from higher average earning assets, a $49 million favorable impact from higher net yield on average earning assets, a $49 million favorable change from returned or repossessed equipment and a $37 million decrease in provision expense at Cat Financial. These increases were partially offset by a $52 million increase in SG&A expenses (excluding provision expense at Cat Financial).
During 2011, Cat Financial’s overall portfolio quality reflected continued improvement. At the end of 2011, past dues at Cat Financial were 2.89 percent, a decrease from 3.54 percent at the end of the third quarter of 2011, and 3.87 percent at the end of 2010. Write-offs, net of recoveries, were $158 million for the full-year 2011, down from $237 million for 2010.
As of December 31, 2011, Cat Financial’s allowance for credit losses totaled $369 million, or 1.47 percent of net finance receivables, compared with $363 million, or 1.57 percent of net finance receivables, at year-end 2010.
Corporate Items and Eliminations
Expense for corporate items and eliminations was $2.461 billion in 2011, an increase of $626 million from 2010. Corporate items and eliminations include corporate-level expenses; timing differences, as some expenses are reported in segment profit on a cash basis; retirement benefit costs other than service cost; currency differences, as segment profit is reported using annual fixed exchange rates; and inter-segment eliminations.
Segment profit for 2011 is based on fixed exchange rates set at the beginning of 2011, while segment profit for 2010 is based on fixed exchange rates set at the beginning of 2010. The difference in actual exchange rates compared with fixed exchange rates is included in corporate items and eliminations and is not reflected in segment profit. The increased expense for corporate items and eliminations was primarily due to currency differences not allocated to segments, as 2011 actual exchange rates were unfavorable compared with 2011 fixed exchange rates, and higher corporate-level expenses.
2012 Outlook
2012 Economic Outlook
In general, prospects for economic growth have improved over the past quarter, and we expect the world economy to grow about 3.3 percent in 2012, a small improvement from about 2.8 percent in 2011. In response to economic concerns, some central banks began easing policies late in 2011. Underpinning our growth expectations for 2012, we expect this easing to continue and contribute to the improvement in growth.
Key points related to our economic outlook include:
· We expect improving world economic growth to increase demand for commodities. Our outlook assumes most commodity prices will increase slightly in 2012 and continue at levels that encourage investment. We expect that copper will average over $4 per pound, Central Appalachian coal about $75 per ton and West Texas Intermediate crude oil about $100 per barrel.
· In the developed economies, capital investment recovered much faster than did overall economies. This better performance occurred primarily because businesses had improved cash flow and better access to credit. In addition, businesses let capital stocks depreciate significantly during the financial crisis of 2008 and 2009. We anticipate business investment will continue to outperform other economic sectors in 2012.
· We expect the U.S. Federal Reserve will maintain the Federal Funds rate below 25 basis points throughout 2012 and will not reduce the size of its balance sheet. U.S. banks have record high capital ratios and considerable funds to lend. We expect bank lending in the United States, which increased during the second half of 2011, to continue to grow in 2012.
· Recent economic data suggests that U.S. economic growth improved in the fourth quarter of 2011, which we believe reflects the positive impact of Federal Reserve easing that was initiated in late 2010. The full impact has likely not materialized yet, and we expect economic growth will improve further in 2012. Our outlook assumes economic growth in the United States of at least 3 percent in 2012.
· We expect total U.S. construction spending, which, net of inflation, has declined since 2004, to finally begin to recover in 2012. We project a 1.5-percent increase in infrastructure-related construction and a 5-percent increase in nonresidential building construction. We are expecting housing starts of at least 700 thousand units in 2012, up from 607 thousand units in 2011.
· While U.S. economic activity is improving, the recovery has been slow by historic standards, and unemployment remains high. If economic growth does not accelerate, it may take several years for unemployment to reach pre-financial crisis levels. In our view, this would signal the potential for a prolonged period of continued growth in the United States.
· The Eurozone public debt crisis has been a lingering negative, but it is unlikely to trigger a worldwide recession. The Eurozone will likely have at least two quarters of weak, possibly negative growth, but should begin to improve in the second half of 2012. For 2012, our outlook assumes economic growth for the Eurozone near zero and growth of about half of a percentage point for Europe in total.
· Our expectation for improvement of European growth in the second half of 2012 rests on a continued easing by the European Central Bank (ECB). The ECB has recently lowered interest rates and could cut rates further in 2012.
· More importantly, the ECB increased its balance sheet more than 35 percent since July 2011 to improve banking system liquidity. Other European central banks have been taking similar actions.
· Business investment in both the Eurozone and the United Kingdom has grown faster than the overall economies and is a trend we expect will continue. Businesses have improved cash flow and need to upgrade capital stocks.
· We project the Japanese economy will grow 3.5 percent in 2012, recovering from a 2011 recession. Rebuilding from the tsunami and more expansionary central bank policies are expected to drive the recovery.
· We expect economic growth in Asia/Pacific will exceed 6.5 percent in 2012, about the same as in 2011. Growth should improve in Australia and Indonesia, the result of recent interest rate cuts.
· China took its first easing action in late 2011, and we expect that further easing is likely. We expect China’s economy will grow 8.5 percent in 2012, sufficient for growth in construction and increased commodity demand.
· Growth in Latin America is expected to slow from 4.3 percent in 2011 to about 4.0 percent in 2012. Our outlook assumes interest rates will be flat to lower in most countries. We expect that economic growth will be sufficient for construction spending and mining output to increase.
· Africa/Middle East will likely benefit from low interest rates and favorable commodity prices. We expect the regional economy will grow nearly 5.5 percent and that construction spending will continue to improve.
· We expect the CIS economies will grow more than 5 percent, and construction spending will increase more than 15 percent. Favorable factors include low interest rates, higher metals and energy prices, and increased production of oil, gas and metals.
Economic Risks
· In our opinion, the risk of a worldwide recession has diminished significantly over the past quarter, but we remain concerned that central banks, particularly in developed economies, will react to the first signs of better growth by tightening economic policies. Even modest premature tightening could significantly slow economic growth.
2012 Sales and Revenues Outlook
We expect 2012 sales and revenues to be in a range of $68 to $72 billion, an increase from $60.138 billion in 2011.
Sales are expected to improve across the company. Following are key points related to improving sales and revenues:
· Our order backlog was $29.8 billion at the end of 2011—an all-time record.
· 2012 will include a full year of sales related to our Bucyrus and MWM acquisitions. We expect sales related to Bucyrus and MWM to be about $6 billion in 2012, an increase from $2.6 billion in 2011, which was a partial year for both Bucyrus and MWM.
· We expect mining to continue to be strong globally, and we have a sizable order backlog for mining equipment. We expect sales to increase in 2012 and are in the process of adding production capacity for many of our mining products. However, we expect sales to be constrained by capacity throughout 2012.
· We anticipate that sales of new machines for construction in developed countries will improve as customers continue to rebuild fleets during 2012. Low interest rates and small improvements in construction spending should encourage that effort, particularly in North America.
· The average age of machines in dealer rental fleets was historically high at year-end 2011, despite an increase in new machine additions during the year. We expect that aged fleets and low fleet inventories will cause dealers to continue to upgrade rental fleets in 2012.
· Despite the turmoil in the Eurozone, European dealers increased orders over the last few months of 2011 relative to a year earlier. Considering the relatively weak sales level over the past few years and the need for customers to replace machines, we expect machine sales in Europe to be at or above 2011 levels despite the current weak economic climate.
· We expect government policy easing in China, which has already started, to continue and lead to modest recovery in machine sales in 2012.
· We expect higher sales in 2012 for Power Systems in most industries. High oil prices should encourage investment and improve demand for engines and turbines used in oil and natural gas applications. We expect improvement in engine sales for electric power generation and higher sales in our rail business.
· At year-end 2011, overall dealer machine inventory was near historical levels relative to selling rates. We expect that in 2012 dealers will add to inventories, but the increase should be much smaller than in 2011 and reflect higher dealer demand expectations.
2012 Profit Outlook
At the middle of our sales and revenues outlook, we expect profit to increase from $7.40 per share in 2011 to about $9.25 in 2012. Following are key points related to our profit outlook:
· Our outlook for higher sales is the most significant reason for the expected improvement in profit in 2012.
· We anticipate improved price realization of 1 to 1.5 percent—a modest improvement that is consistent with our strategy to improve customer value and increase our market position.
· The improvement in price realization should be sufficient to offset increases in material costs and labor and burden cost inflation.
· Costs related to our short-term employee incentive plans are expected to decrease by about $350 million.
· We are expecting an increase in period manufacturing costs and SG&A expense in response to the continued growth in sales volume, including higher depreciation expense as a result of increased capital spending.
· We are production constrained for many products. Demand for mining products is at record levels and continuing to improve. Demand for construction equipment is improving, and we need to be prepared for further increases when construction activity in the United States and Europe eventually improves. As a result, we have numerous initiatives in progress around the world to increase capacity. We expect those projects to generate both higher capital expenditures and higher levels of expense to implement.
· Capital expenditures in 2012 are expected to be about $4 billion.
· In addition to capital expenditures, R&D expense is an investment in our future, and it is expected to increase about 15 percent excluding the impact of our acquisitions.
· Our outlook assumes a higher effective tax rate, primarily from an unfavorable geographic mix of profits from a tax perspective and the U.S. R&D tax credit, which ended in 2011. We are expecting an effective tax rate of about 30 percent in 2012.
· Acquisition impacts—In 2011, the combined impact of our Bucyrus and MWM acquisitions was negative to profit as a result of deal-related and integration costs. In 2012, we expect that Bucyrus will be positive to operating profit by at least $450 million and that MWM will be about neutral. For Bucyrus, the outlook does not include the impact of selling additional distribution businesses to dealers. The timing of the divestitures and the number that will be completed in 2012 are uncertain. While divestitures will likely have some impact on sales and profit, we do not expect the impact will be material in the context of our outlook.
CONSOLIDATED RESULTS
Fourth Quarter 2011 vs. Fourth Quarter 2010

The chart above graphically illustrates reasons for the change in Consolidated Sales and Revenues between the fourth quarter of 2010 (at left) and the fourth quarter of 2011 (at right). Items favorably impacting sales and revenues appear as upward stair steps with the corresponding dollar amounts above each bar, while items negatively impacting sales and revenues appear as downward stair steps with dollar amounts reflected in parentheses above each bar. The bar entitled Sales Volume includes the sales impact of the divestiture of Carter. Caterpillar management utilizes these charts internally to visually communicate with the company’s Board of Directors and employees.
Sales and Revenues
Total sales and revenues were $17.243 billion in the fourth quarter of 2011, an increase of $4.436 billion, or 35 percent, from the fourth quarter of 2010.
The improvement was largely a result of $2.646 billion higher sales volume. While sales for both new equipment and after-market parts improved, the more significant increase was for new equipment. Price realization improved $166 million, and currency impacts added $30 million. Bucyrus added $1.389 billion in sales, EMD sales increased $133 million, and MWM added sales of $52 million. Financial Products revenues improved slightly.
The improvement in sales volume occurred across the world in all geographic regions and in nearly all segments. The volume increase was primarily the result of higher end user demand. Dealer-reported new machine inventory levels were up more than $700 million during the quarter, similar to the increase in the fourth quarter of 2010.
Growth in the global economy improved demand for commodities, and commodity prices remained attractive for investment. This was positive for mining in all regions of the world.
Construction activity continued to grow in many developing countries. In developed countries, despite a weak but improving level of construction activity, sales increased as a result of customers upgrading machine fleets by replacing older equipment and dealers refreshing equipment in their rental fleets.
Worldwide demand for energy, at prices that encourage continued investment, resulted in higher sales of engines and turbines for petroleum applications. Sales for electric power applications continued to improve as a result of worldwide economic growth, and sales of our rail products and services also increased.
Consolidated Operating Profit
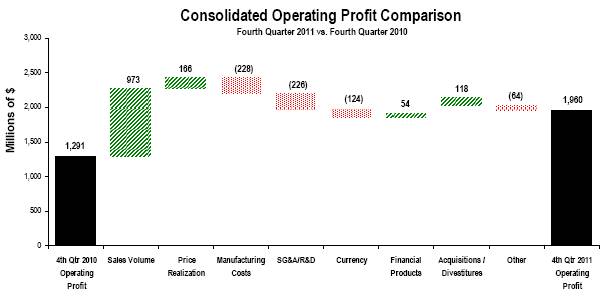
The chart above graphically illustrates reasons for the change in Consolidated Operating Profit between the fourth quarter of 2010 (at left) and the fourth quarter of 2011 (at right). Items favorably impacting operating profit appear as upward stair steps with the corresponding dollar amounts above each bar, while items negatively impacting operating profit appear as downward stair steps with dollar amounts reflected in parentheses above each bar. Caterpillar management utilizes these charts internally to visually communicate with the company’s Board of Directors and employees. The bar entitled Other includes consolidating adjustments and Machinery and Power Systems other operating (income) expenses.
Operating profit for the fourth quarter of 2011 was $1.960 billion compared with $1.291 billion for the fourth quarter of 2010. The increase was primarily the result of higher sales volume and improved price realization. The improvements were partially offset by higher costs and the negative impact of currency.
Manufacturing costs were up $228 million primarily due to higher period costs related to incentive compensation, production volume and capacity expansion programs. Material costs were up from the fourth quarter of 2010 primarily due to higher steel costs.
SG&A and R&D expenses increased $226 million primarily due to higher volume and increased incentive compensation.
Currency had a $124 million unfavorable impact on operating profit as the benefit from $30 million on sales was more than offset by a negative $154 million impact on costs. The unfavorable currency impact was primarily due to the Japanese yen.
Financial Products’ operating profit improved by $54 million.
Acquisitions/divestitures impacted operating profit by $118 million primarily related to Bucyrus. See further discussion on the impact of Bucyrus on pages 27-28.
Other costs negatively impacted operating profit by $64 million primarily due to restructuring costs at Cat Japan.
Other Profit/Loss Items
· Interest expense excluding Financial Products increased $32 million from the fourth quarter of 2010 due to debt issued to complete the acquisition of Bucyrus.
· Other income/expense was income of $125 million compared with income of $16 million in the fourth quarter of 2010. The increase was due to the favorable impact of currency gains and losses.
· The provision for income taxes in the fourth quarter of 2011 reflects an effective tax rate of 27 percent compared with 25 percent for the fourth quarter of 2010, excluding the items discussed below. The 2011 effective tax rate is higher than 2010 primarily due to changes in our geographic mix of profits from a tax perspective.
The 2011 fourth-quarter tax provision also includes a $94 million benefit related to a decrease from the third quarter estimated annual effective tax rate of 29 percent and a $24 million benefit for the release of a valuation allowance. The decrease in the estimated annual effective tax rate for 2011 is primarily due to a more favorable than expected geographic mix of profits from a tax perspective. This compares to a $75 million benefit in the fourth quarter of 2010 related to a decrease in the estimated annual effective tax rate.
· Equity in profit/loss of unconsolidated affiliated companies favorably impacted profit by $11 million compared with the fourth quarter of 2010. The change is primarily related to the absence of NC2 Global LLC.
SEGMENT RESULTS
Sales and Revenues by Geographic Region
|
(Millions of dollars) |
|
Total |
|
% |
|
North |
|
% |
|
Latin |
|
% |
|
EAME |
|
% |
|
Asia/ |
|
% |
| |||||
|
Fourth Quarter 2011 |
|
|
|
|
|
|
|
|
|
|
|
|
|
|
|
|
|
|
|
|
| |||||
|
Construction Industries(1) |
|
$ |
5,355 |
|
31 |
% |
$ |
1,743 |
|
31 |
% |
$ |
777 |
|
29 |
% |
$ |
1,222 |
|
35 |
% |
$ |
1,613 |
|
28 |
% |
|
Resource Industries(2) |
|
5,056 |
|
80 |
% |
1,694 |
|
88 |
% |
771 |
|
51 |
% |
962 |
|
48 |
% |
1,629 |
|
117 |
% | |||||
|
Power Systems(3) |
|
5,672 |
|
22 |
% |
2,203 |
|
14 |
% |
722 |
|
24 |
% |
1,693 |
|
27 |
% |
1,054 |
|
31 |
% | |||||
|
All Other Segments (4) |
|
496 |
|
(15 |
)% |
235 |
|
(28 |
)% |
26 |
|
24 |
% |
145 |
|
4 |
% |
90 |
|
(5 |
)% | |||||
|
Corporate Items and Eliminations |
|
(22 |
) |
|
|
(15 |
) |
|
|
(1 |
) |
|
|
(4 |
) |
|
|
(2 |
) |
|
| |||||
|
Machinery & Power Systems Sales |
|
$ |
16,557 |
|
36 |
% |
$ |
5,860 |
|
31 |
% |
$ |
2,295 |
|
34 |
% |
$ |
4,018 |
|
33 |
% |
$ |
4,384 |
|
51 |
% |
|
|
|
|
|
|
|
|
|
|
|
|
|
|
|
|
|
|
|
|
|
|
| |||||
|
Financial Products Segment |
|
752 |
|
4 |
% |
413 |
|
(4 |
)% |
94 |
|
16 |
% |
110 |
|
7 |
% |
135 |
|
18 |
% | |||||
|
Corporate Items and Eliminations |
|
(66 |
) |
|
|
(38 |
) |
|
|
(7 |
) |
|
|
(13 |
) |
|
|
(8 |
) |
|
| |||||
|
Financial Products Revenues |
|
$ |
686 |
|
3 |
% |
$ |
375 |
|
— |
|
$ |
87 |
|
12 |
% |
$ |
97 |
|
(6 |
)% |
$ |
127 |
|
14 |
% |
|
|
|
|
|
|
|
|
|
|
|
|
|
|
|
|
|
|
|
|
|
|
| |||||
|
Consolidated Sales and Revenues |
|
$ |
17,243 |
|
35 |
% |
$ |
6,235 |
|
28 |
% |
$ |
2,382 |
|
33 |
% |
$ |
4,115 |
|
31 |
% |
$ |
4,511 |
|
49 |
% |
|
|
|
|
|
|
|
|
|
|
|
|
|
|
|
|
|
|
|
|
|
|
| |||||
|
Fourth Quarter 2010 |
|
|
|
|
|
|
|
|
|
|
|
|
|
|
|
|
|
|
|
|
| |||||
|
Construction Industries (1) |
|
$ |
4,103 |
|
|
|
$ |
1,334 |
|
|
|
$ |
601 |
|
|
|
$ |
906 |
|
|
|
$ |
1,262 |
|
|
|
|
Resource Industries(2) |
|
2,807 |
|
|
|
899 |
|
|
|
511 |
|
|
|
648 |
|
|
|
749 |
|
|
| |||||
|
Power Systems(3) |
|
4,664 |
|
|
|
1,936 |
|
|
|
584 |
|
|
|
1,337 |
|
|
|
807 |
|
|
| |||||
|
All Other Segments(4) |
|
583 |
|
|
|
328 |
|
|
|
21 |
|
|
|
139 |
|
|
|
95 |
|
|
| |||||
|
Corporate Items and Eliminations |
|
(16 |
) |
|
|
(12 |
) |
|
|
— |
|
|
|
(3 |
) |
|
|
(1 |
) |
|
| |||||
|
Machinery & Power Systems Sales |
|
$ |
12,141 |
|
|
|
$ |
4,485 |
|
|
|
$ |
1,717 |
|
|
|
$ |
3,027 |
|
|
|
$ |
2,912 |
|
|
|
|
|
|
|
|
|
|
|
|
|
|
|
|
|
|
|
|
|
|
|
|
|
| |||||
|
Financial Products Segment |
|
726 |
|
|
|
428 |
|
|
|
81 |
|
|
|
103 |
|
|
|
114 |
|
|
| |||||
|
Corporate Items and Eliminations |
|
(60 |
) |
|
|
(54 |
) |
|
|
(3 |
) |
|
|
— |
|
|
|
(3 |
) |
|
| |||||
|
Financial Products Revenues |
|
$ |
666 |
|
|
|
$ |
374 |
|
|
|
$ |
78 |
|
|
|
$ |
103 |
|
|
|
$ |
111 |
|
|
|
|
|
|
|
|
|
|
|
|
|
|
|
|
|
|
|
|
|
|
|
|
|
| |||||
|
Consolidated Sales and Revenues |
|
$ |
12,807 |
|
|
|
$ |
4,859 |
|
|
|
$ |
1,795 |
|
|
|
$ |
3,130 |
|
|
|
$ |
3,023 |
|
|
|
|
(1) |
Does not include inter-segment sales of $142 million and $193 million in fourth quarter 2011 and 2010, respectively. |
|
(2) |
Does not include inter-segment sales of $314 million and $342 million in fourth quarter 2011 and 2010, respectively. |
|
(3) |
Does not include inter-segment sales of $644 million and $555 million in fourth quarter 2011 and 2010, respectively. |
|
(4) |
Does not include inter-segment sales of $865 million and $762 million in fourth quarter 2011 and 2010, respectively. |
Sales and Revenues by Segment
|
(Millions of dollars) |
|
Fourth Quarter |
|
Sales |
|
Price |
|
Currency |
|
Acquisitions |
|
Other |
|
Fourth |
|
$ Change |
|
% |
| ||||||||
|
Construction Industries |
|
$ |
4,103 |
|
$ |
1,171 |
|
$ |
48 |
|
$ |
33 |
|
$ |
— |
|
$ |
— |
|
$ |
5,355 |
|
$ |
1,252 |
|
31 |
% |
|
Resource Industries |
|
2,807 |
|
814 |
|
58 |
|
(12 |
) |
1,389 |
|
— |
|
5,056 |
|
2,249 |
|
80 |
% | ||||||||
|
Power Systems |
|
4,664 |
|
723 |
|
94 |
|
6 |
|
185 |
|
— |
|
5,672 |
|
1,008 |
|
22 |
% | ||||||||
|
All Other Segments |
|
583 |
|
(87 |
) |
(3 |
) |
3 |
|
— |
|
— |
|
496 |
|
(87 |
) |
(15 |
)% | ||||||||
|
Corporate Items and Eliminations |
|
(16 |
) |
25 |
|
(31 |
) |
— |
|
— |
|
— |
|
(22 |
) |
(6 |
) |
|
| ||||||||
|
Machinery & Power Systems Sales |
|
$ |
12,141 |
|
$ |
2,646 |
|
$ |
166 |
|
$ |
30 |
|
$ |
1,574 |
|
$ |
— |
|
$ |
16,557 |
|
$ |
4,416 |
|
36 |
% |
|
|
|
|
|
|
|
|
|
|
|
|
|
|
|
|
|
|
|
|
| ||||||||
|
Financial Products Segment |
|
726 |
|
— |
|
— |
|
— |
|
— |
|
26 |
|
752 |
|
26 |
|
4 |
% | ||||||||
|
Corporate Items and Eliminations |
|
(60 |
) |
— |
|
— |
|
— |
|
— |
|
(6 |
) |
(66 |
) |
(6 |
) |
|
| ||||||||
|
Financial Products Revenues |
|
$ |
666 |
|
$ |
— |
|
$ |
— |
|
$ |
— |
|
$ |
— |
|
$ |
20 |
|
$ |
686 |
|
$ |
20 |
|
3 |
% |
|
|
|
|
|
|
|
|
|
|
|
|
|
|
|
|
|
|
|
|
| ||||||||
|
Consolidated Sales and Revenues |
|
$ |
12,807 |
|
$ |
2,646 |
|
$ |
166 |
|
$ |
30 |
|
$ |
1,574 |
|
$ |
20 |
|
$ |
17,243 |
|
$ |
4,436 |
|
35 |
% |
Operating Profit by Segment
|
(Millions of dollars) |
|
Fourth Quarter |
|
Fourth Quarter |
|
$ |
|
% |
| |||
|
Construction Industries |
|
$ |
534 |
|
$ |
287 |
|
$ |
247 |
|
86 |
% |
|
Resource Industries |
|
997 |
|
606 |
|
391 |
|
65 |
% | |||
|
Power Systems |
|
823 |
|
708 |
|
115 |
|
16 |
% | |||
|
All Other Segments |
|
236 |
|
140 |
|
96 |
|
69 |
% | |||
|
Corporate Items and Eliminations |
|
(721 |
) |
(497 |
) |
(224 |
) |
|
| |||
|
Machinery & Power Systems |
|
$ |
1,869 |
|
$ |
1,244 |
|
$ |
625 |
|
50 |
% |
|
Financial Products Segment |
|
134 |
|
105 |
|
29 |
|
28 |
% | |||
|
Corporate Items and Eliminations |
|
22 |
|
(3 |
) |
25 |
|
|
| |||
|
Financial Products |
|
$ |
156 |
|
$ |
102 |
|
$ |
54 |
|
53 |
% |
|
Consolidating Adjustments |
|
(65 |
) |
(55 |
) |
(10 |
) |
|
| |||
|
Consolidated Operating Profit |
|
$ |
1,960 |
|
$ |
1,291 |
|
$ |
669 |
|
52 |
% |
Construction Industries
Construction Industries’ sales were $5.355 billion in the fourth quarter of 2011, an increase of $1.252 billion, or 31 percent, from the fourth quarter of 2010. The improvement in sales was a result of significantly higher sales volume in all geographic regions and across all major products. While sales for both new equipment and after-market parts improved, the more significant increase was for new equipment.
Continuing economic growth in most developing countries resulted in higher sales overall. Despite an economic slowdown in China, our sales in China were higher in the fourth quarter of 2011 than in the fourth quarter of 2010 as dealer deliveries to end users, while down, held up better than the industry overall, and machine production was sufficient to allow dealers to build inventory for the upcoming 2012 selling season.
In most developed countries, sales increased significantly despite relatively weak construction activity. The improvement in sales was largely driven by the need for customers to upgrade machine fleets to replace older equipment and dealers refreshing equipment in their rental fleets. Despite the increase from a year ago, sales of new machines to customers in developed countries remain significantly below previous peak levels. The size of rental fleets increased slightly from post-recession lows, but the average age remained near the historical high.
Construction Industries’ profit was $534 million in the fourth quarter of 2011 compared with $287 million in the fourth quarter of 2010. The increase in profit was primarily due to higher sales volume, which included the impact of a favorable mix of products, and improved price realization. The benefits from increased sales were partially offset by higher period manufacturing and freight costs. Period manufacturing costs increased as a result of increased production volume and global capacity expansion. In addition, the quarter included restructuring costs at Cat Japan.
Resource Industries
Resource Industries’ sales were $5.056 billion in the fourth quarter of 2011, an increase of $2.249 billion, or 80 percent, from the fourth quarter of 2010. The sales increase was primarily due to the acquisition of Bucyrus in 2011 and higher sales volume.
While commodity prices are off their highs from earlier in 2011, they remain favorable for investment, and that is driving significant demand for our large mining products and aftermarket parts. While demand for product was strong, the supply of many of our mining products was limited by our capacity.
Bucyrus sales were $1.389 billion in the fourth quarter of 2011, with $344 million in North America, $244 million in Latin America, $268 million in EAME and $533 million in Asia/Pacific.
Resource Industries’ profit was $997 million in the fourth quarter of 2011 compared with $606 million in the fourth quarter of 2010. The acquisition of Bucyrus increased segment profit by $146 million. A table on pages 27-28 provides further detail of the Bucyrus impact.
Excluding Bucyrus, Resource Industries’ profit increased $245 million, primarily due to higher sales volume and improved price realization. The improvement was partially offset by higher period manufacturing, material and freight costs. SG&A and R&D expenses also increased as a result of higher volume, costs to support product programs and increased incentive compensation.
Power Systems
Power Systems’ sales were $5.672 billion in the fourth quarter of 2011, an increase of $1.008 billion, or 22 percent, from the fourth quarter of 2010. The improvement was a result of higher sales volume for both new equipment and parts, the acquisitions of EMD and MWM and improved price realization. Sales were up in all geographic regions.
Worldwide demand for energy at price levels that encourage continued investment has resulted in higher demand for engines and turbines for petroleum applications. Strong demand for electric power resulted in higher sales of turbines. Sales of our rail products and services also increased.
Power Systems’ profit was $823 million in the fourth quarter of 2011 compared with $708 million in the fourth quarter of 2010. The increase was primarily due to higher sales volume and improved price realization. The improvements were partially offset by higher costs, primarily driven by growth, incentive compensation and costs to support product programs.
Sales for EMD increased $133 million, while profit decreased $28 million. MWM, acquired during the fourth quarter of 2011, added sales of $52 million, and was about neutral to profit.
Financial Products Segment
Financial Products’ revenues were $752 million, an increase of $26 million, or 4 percent, from the fourth quarter of 2010. The increase was primarily due to the impact from higher average earning assets, a favorable change from returned or repossessed equipment and higher miscellaneous net revenues, partially offset by an unfavorable impact from lower interest rates on new and existing finance receivables.
Financial Products’ profit was $134 million in the fourth quarter of 2011, compared with $105 million in the fourth quarter of 2010. The increase was primarily due to a $17 million favorable change from returned or repossessed equipment and a $15 million favorable impact from higher average earning assets. These increases were partially offset by an increase in SG&A expenses.
All Other Segments
All Other Segments includes groups that provide services such as component manufacturing, remanufacturing and logistics to both Caterpillar and external customers. The increase in profit from the fourth quarter of 2010 to the fourth quarter of 2011 was primarily due to internal recoveries from other segments that were in excess of costs incurred.
Corporate Items and Eliminations
Expense for corporate items and eliminations was $699 million in the fourth quarter of 2011, an increase of $199 million from the fourth quarter of 2010. Corporate items and eliminations include corporate-level expenses; timing differences, as some expenses are reported in segment profit on a cash basis; retirement benefit costs other than service cost; currency differences, as segment profit is reported using annual fixed exchange rates and inter-segment eliminations.
Segment profit for 2011 is based on fixed exchange rates set at the beginning of 2011, while segment profit for 2010 is based on fixed exchange rates set at the beginning of 2010. The difference in actual exchange rates compared with fixed exchange rates is included in corporate items and eliminations and is not reflected in segment profit. The increased expense for corporate items and eliminations was primarily due to currency differences not allocated to segments, as fourth-quarter 2011 actual exchange rates were unfavorable compared with 2011 fixed exchange rates. In addition, corporate-level expenses and retirement benefit costs not allocated to the segments increased.
QUESTIONS AND ANSWERS
Q1: In 2009 you introduced a 2012 goal that expected sales and revenues to approach $60 billion and profit to be in a range of $8 to $10 per share. With 2011 sales and revenues at $60 billion it seems you reached your sales goal a year early, but profit per share was not in the $8 to $10 range. Can you discuss the major differences between your actual 2011 results at $60 billion and the 2012 goal from 2009 at $60 billion?
A: We introduced our 2012 sales and revenues and profit per share goals at our annual analyst meeting in August of 2009—about two and a half years ago and near the worst point for our business during the financial crisis. We introduced our 2012 expectations to remind investors that, while our business was depressed as a result of the financial crisis and recession, we are in industries with good prospects for growth and the potential for significant cyclical recovery.
The recovery since that low point in 2009 has been stronger than we expected overall, and we are at our 2012 sales and revenues projection a year earlier than expected. While overall sales and revenues in 2011 are about the same as our 2012 goal, not everything was as we expected. Following is a summary of areas where our actual 2011 results were not directionally as we expected for 2012 when the goal was set in August 2009.
There were five major areas where our actual 2011 results were not directionally as we expected for 2012 in August of 2009—acquisitions, stock dilutions, incentive compensation, currency impacts and taxes.
The following table starts with actual 2011 profit per share and shows directional adjustments for the major items that caused 2011 to be lower than the 2012 goals. Had those items been consistent with our expectations in 2009, we would have been within the range of our profit-per-share goal.
Progress Toward the 2012 Profit-Per-Share Goal

Acquisitions
When we established our 2012 goals in August 2009, the acquisitions of EMD, Bucyrus and MWM had not occurred and were not included. In 2011, we had a full year of EMD sales and partial years for Bucyrus and MWM. Sales related to those acquisitions were about $4 billion of the $60 billion of sales and revenues we reported in 2011. Excluding the acquisitions, sales and revenues were about $56 billion in 2011. The profit impact of those three acquisitions was negative in 2011. Bucyrus (primarily from deal-related, financing and integration costs) was negative about $0.39 per share. EMD and MWM had little impact on profit per share.
We believe all three of the companies acquired are good additions, are in great industries that are complementary to Caterpillar and are good investments.
Dilution
Because our 2012 goals did not anticipate the acquisitions of EMD, Bucyrus and MWM, our use of cash has been very different than we expected in August 2009 when we laid out the 2012 goals. Because we did not forecast the acquisitions, we assumed some of the cash being generated would be used to repurchase shares. The difference in our share count between our 2009 expectation and where we actually were in 2011 negatively impacted profit per share by about $0.50.
Our generation of operating cash flow has been very good, and 2011 was an all-time record. It was a major accomplishment to make those acquisitions (which were collectively more than $10 billion) and do it without issuing new equity, while keeping our M&PS debt-to-capital ratio in our target range.
Employee Incentive Compensation
Our $8 to $10 profit per share goal presumed that our short-term incentive plans would pay employees at a “target” level. Our performance metrics are set at the beginning of each year so that achieving our plans for the year usually results in incentive pay near the “target” level.
In 2011, our actual results were far ahead of the profit outlook we issued in January 2011, and most of the metrics related to our incentive pay also far exceeded plans. As a result, the cost of our incentive pay plans in 2011 was close to $400 million above the “target” level.
Currency Impacts
Overall, currency impacts were positive for sales by nearly $1 billion, but were negative to profit.
Taxes
The tax rate was lower in 2011 than we expected back in 2009, and we had discrete tax items in 2011 that were favorable. The main reason for the favorable rate is geographic mix from a tax perspective.
Summary
While there have certainly been positives and negatives operationally, on balance the impacts mentioned above related to acquisitions, dilution, employee incentive compensation, currency impacts and the tax rate are the most significant changes versus our expectations from August 2009. Had those items been consistent with our expectations in 2009, we would have been within the range of our profit-per-share goal.
Q2: Can you comment on new machine inventories at year-end 2011 and your expectations for 2012?
A: Dealers added about $2.5 billion to their new machine inventories in 2011. The increase was largely driven by higher end user demand. In months of supply, overall dealer inventory is now similar to historical averages. We expect that in 2012 dealers will add some to inventories, but the increase should be much smaller than in 2011 and reflect higher dealer demand expectations.
Q3: Can you comment on your order backlog?
A: Our order backlog has continued to grow and is at record levels with and without the impact of Bucyrus. Excluding Bucyrus, the backlog has increased 37 percent since year-end 2010. While order rates for Bucyrus have continued to be strong, our Bucyrus shipments in the fourth quarter were higher than we expected and that reduced the Bucyrus backlog slightly. The following table summarizes our order backlog:
|
(billions of dollars) |
|
12/31/2010 |
|
9/30/2011 |
|
12/31/2011 |
| |||
|
Order Backlog Excluding Bucyrus |
|
$ |
18.7 |
|
$ |
24.4 |
|
$ |
25.7 |
|
|
Bucyrus Impact * |
|
|
|
4.2 |
|
4.1 |
| |||
|
Order Backlog |
|
$ |
18.7 |
|
$ |
28.6 |
|
$ |
29.8 |
|
* Bucyrus backlog was $3.5 billion on July 8, 2011, the date we acquired Bucyrus.
Q4: Can you summarize the impact of Bucyrus on fourth-quarter financial results?
A: The impact of the Bucyrus acquisition on 2011 results was more positive than we had expected. The total impact was negative to profit $0.39 per share, $0.11 per share better than our previous outlook expected.
Following are two tables. The first summarizes Bucyrus excluding impacts related to the sale of distribution businesses. Those impacts are shown in two sections. The first shows the impact of Bucyrus on the individual results of operations line items down to profit after tax. The second section of the table shows the impact of Bucyrus by category as we defined them in our third-quarter financial release.
In addition, we closed one transaction in 2011 related to the sale of distribution businesses. While the overall impact is small, the second table breaks down the impact of the divestiture by line item.
Impact of Bucyrus on 2011 Consolidated Profit
Millions of dollars except per share data
Impact Excluding Divestiture
|
|
|
Fourth Quarter |
|
Full Year |
| ||
|
Impact by Results of Operations Line Item |
|
|
|
|
| ||
|
Sales |
|
$ |
1,389 |
|
$ |
2,524 |
|
|
Cost of goods sold |
|
(1,140 |
) |
(2,159 |
) | ||
|
SG&A |
|
(161 |
) |
(351 |
) | ||
|
R&D |
|
(14 |
) |
(26 |
) | ||
|
Other operating costs |
|
(7 |
) |
(84 |
) | ||
|
Operating profit (loss) |
|
67 |
|
(96 |
) | ||
|
Interest expense |
|
(35 |
) |
(79 |
) | ||
|
Other income (expense) |
|
(1 |
) |
(228 |
) | ||
|
|
|
|
|
|
| ||
|
Profit (loss) before tax |
|
31 |
|
(403 |
) | ||
|
Income tax (provision)/benefit |
|
(3 |
) |
133 |
| ||
|
Profit/(Loss) after tax of Cons. Companies |
|
28 |
|
(270 |
) | ||
|
Profit/(Loss) attributable to non-controlling interest |
|
(1 |
) |
(1 |
) | ||
|
Profit/(Loss) |
|
$ |
27 |
|
$ |
(271 |
) |
|
|
|
|
|
|
| ||
|
Impact by Category |
|
|
|
|
| ||
|
Operating profit excluding acquisition costs |
|
$ |
289 |
|
$ |
484 |
|
|
Incremental intangible amortization |
|
(53 |
) |
(109 |
) | ||
|
Inventory step-up |
|
(143 |
) |
(303 |
) | ||
|
Deal-related & integration costs |
|
(26 |
) |
(168 |
) | ||
|
Impact on operating profit (loss) |
|
67 |
|
(96 |
) | ||
|
Interest expense |
|
(35 |
) |
(79 |
) | ||
|
Other income (expense) |
|
(1 |
) |
(228 |
) | ||
|
|
|
|
|
|
| ||
|
Impact on profit (loss) before tax |
|
31 |
|
(403 |
) | ||
|
Income tax (provision)/benefit |
|
(3 |
) |
133 |
| ||
|
Profit/(Loss) after tax of Cons. Companies |
|
28 |
|
(270 |
) | ||
|
Profit/(Loss) attributable to non-controlling interest |
|
(1 |
) |
(1 |
) | ||
|
Profit/(Loss) |
|
$ |
27 |
|
$ |
(271 |
) |
|
|
|
|
|
|
| ||
|
Distribution Business Divestiture Impact |
|
|
|
|
| ||
|
SG&A |
|
(17 |
) |
(32 |
) | ||
|
Other operating income (costs) |
|
96 |
|
96 |
| ||
|
Impact on Operating Profit |
|
79 |
|
64 |
| ||
|
Income tax (provision)/benefit |
|
(61 |
) |
(55 |
) | ||
|
Profit/(Loss) |
|
$ |
18 |
|
$ |
9 |
|
|
|
|
|
|
|
| ||
|
Total Impact of Bucyrus |
|
|
|
|
| ||
|
Profit per share Bucyrus impact |
|
$ |
0.07 |
|
$ |
(0.39 |
) |
Q5: In your third-quarter financial release you were expecting Bucyrus to have a negative impact of about $0.50 per share in 2011, and the actual negative impact was $0.39 per share. What improved?
A: The most significant reasons for the $0.11 per share improvement were higher sales and lower-than-expected integration costs in the fourth quarter. The impact of the lower integration costs is timing related, and the costs will likely be in 2012 rather than 2011.
Q6: Have you updated your 2012 estimate for Bucyrus?
A: We are currently expecting Bucyrus operating profit to be at least $450 million in 2012. The mining industry continues to invest for growth, orders have been good, and we are expecting sales and profit growth in 2012 compared with 2011. However, as we mentioned in the answer to the previous question, we spent less than expected for integration costs in the fourth quarter of 2011. It is a shift in timing. As a result, our expectation for integration costs is higher in 2012.
Q7: We understand that you are in discussions with Cat dealers to sell Bucyrus distribution businesses to them. Can you comment on the expected impact and provide an update on the discussions?
A: We completed the first transaction in the fourth quarter of 2011 and have announced, but not closed, another one. We hope to complete transactions in 2012 for dealers that service the larger mining territories around the world. Because of the volume of dealers impacted, not all of the Bucyrus distribution business divestitures will be completed in 2012.
The divestitures will likely have an impact on profit, including a reduction in operating profit related to the distribution businesses sold and the impact of potential gains and losses on the divestiture transactions themselves.
Q8: What is the profit impact of MWM in your 2012 outlook?
A: With integration costs, the inventory step-up and additional intangible amortization, we expect MWM to be about neutral to profit in 2012. When the inventory step-up and integration costs are behind us, we expect MWM to be a more significant contributor to profit.
Q9: Can you comment on expense related to your short-term incentive compensation plans in 2011 and for 2012?
A: Short-term incentive compensation expense is directly related to financial and operational performance. Because we significantly exceeded our expectations in 2011, short-term incentive compensation is higher than 2010 and higher than we originally planned for 2011.
For 2011, the expense was about $1.2 billion—about $220 million in the first quarter, $305 million in the second quarter, $315 million in the third quarter and $360 million in the fourth quarter. In 2010, the total expense was about $770 million.
Costs related to our short-term employee incentive compensation plans are expected to decrease by about $350 million in 2012.
Q10: We calculate incremental operating profit pull through, but the impact of your recent acquisitions makes the calculation difficult. Can you adjust for acquisitions? Can you calculate this for both the fourth quarter and full-year 2011?
A: For the fourth quarter, excluding the impact of our Bucyrus, EMD and MWM acquisitions, incremental operating profit versus 2010 was about 19 percent of incremental sales and revenues.
In addition to adjusting for acquisitions, to better understand the underlying operational impacts, it is also useful to consider currency impacts. The table below starts with our reported sales and revenues and reported operating profit and adjusts for the acquisitions and the impacts of currency on sales and operating profit.
For the fourth quarter, adjusting for acquisitions and currency, the incremental margin rate was approximately 24 percent.
(Millions of dollars)
|
|
|
Fourth Quarter |
|
Fourth Quarter |
|
$ Change |
| |||
|
Sales and Revenues |
|
$ |
17,243 |
|
$ |
12,807 |
|
$ |
4,436 |
|
|
Less Bucyrus, EMD and MWM Sales |
|
(1,931 |
) |
(357 |
) |
(1,574 |
) | |||
|
Sales and Revenues excluding Bucyrus, EMD and MWM |
|
15,312 |
|
12,450 |
|
2,862 |
| |||
|
|
|
|
|
|
|
|
| |||
|
Less Sales Currency Impact |
|
(30 |
) |
— |
|
(30 |
) | |||
|
Sales and Revenues excluding Bucyrus, EMD, MWM and Currency Impact |
|
$ |
15,282 |
|
$ |
12,450 |
|
$ |
2,832 |
|
|
|
|
|
|
|
|
|
| |||
|
Operating Profit |
|
$ |
1,960 |
|
$ |
1,291 |
|
$ |
669 |
|
|
Less Bucyrus, EMD and MWM Operating Profit |
|
(161 |
) |
(43 |
) |
(118 |
) | |||
|
Operating Profit excluding Bucyrus, EMD and MWM |
|
1,799 |
|
1,248 |
|
551 |
| |||
|
|
|
|
|
|
|
|
| |||
|
Add Operating Profit Currency Impact |
|
124 |
|
— |
|
124 |
| |||
|
Operating Profit excluding Bucyrus, EMD, MWM and Currency Impacts |
|
$ |
1,923 |
|
$ |
1,248 |
|
$ |
675 |
|
|
|
|
|
|
|
|
|
| |||
|
Incremental Margin Rate excluding Bucyrus, EMD and MWM Impacts |
|
|
|
|
|
19 |
% | |||
|
|
|
|
|
|
|
|
| |||
|
Incremental Margin Rate excluding Bucyrus, EMD, MWM and Currency Impacts |
|
|
|
|
|
24 |
% | |||
For 2011, excluding the impact of our Bucyrus, EMD and MWM acquisitions, incremental operating profit versus 2010 was about 23 percent of incremental sales and revenues. Adjusting for acquisitions and currency, the incremental margin rate was approximately 27 percent.
(Millions of dollars)
|
|
|
2011 |
|
2010 |
|
$ Change |
| |||
|
Sales and Revenues |
|
$ |
60,138 |
|
$ |
42,588 |
|
$ |
17,550 |
|
|
Less Bucyrus, EMD and MWM Sales |
|
(4,010 |
) |
(573 |
) |
(3,437 |
) | |||
|
Sales and Revenues excluding Bucyrus, EMD and MWM |
|
56,128 |
|
42,015 |
|
14,113 |
| |||
|
|
|
|
|
|
|
|
| |||
|
Less Sales Currency Impact |
|
(831 |
) |
— |
|
(831 |
) | |||
|
Sales and Revenues excluding Bucyrus, EMD, MWM and Currency Impact |
|
$ |
55,297 |
|
42,015 |
|
13,282 |
| ||
|
|
|
|
|
|
|
|
| |||
|
Operating Profit |
|
$ |
7,153 |
|
$ |
3,963 |
|
$ |
3,190 |
|
|
Less Bucyrus, EMD and MWM Operating Profit |
|
(13 |
) |
(62 |
) |
49 |
| |||
|
Operating Profit excluding Bucyrus, EMD and MWM |
|
7,140 |
|
3,901 |
|
3,239 |
| |||
|
|
|
|
|
|
|
|
| |||
|
Add Operating Profit Currency Impact |
|
410 |
|
— |
|
410 |
| |||
|
Operating Profit excluding Bucyrus, EMD, MWM and Currency Impacts |
|
$ |
7,550 |
|
$ |
3,901 |
|
$ |
3,649 |
|
|
|
|
|
|
|
|
|
| |||
|
Incremental Margin Rate excluding Bucyrus, EMD and MWM Impacts |
|
|
|
|
|
23 |
% | |||
|
|
|
|
|
|
|
|
| |||
|
Incremental Margin Rate excluding Bucyrus, EMD, MWM and Currency Impacts |
|
|
|
|
|
27 |
% | |||
Q11: Can you comment on the M&PS financial position post the Bucyrus acquisition?
A: We are pleased with the strength of our balance sheet, particularly considering we have spent more than $10 billion for acquisitions over the past year and a half, invested significantly in capital expenditures, and did it all without issuing new equity.
Despite issuing $4.5 billion in debt for the Bucyrus acquisition, the M&PS debt-to-capital ratio at year-end 2011 was 42.7 percent and remained within our target range as a result of our increasing profit and strong cash flow.
Q12: Can you comment on your M&PS operating cash flow in 2011?
A: M&PS operating cash flow was nearly $8 billion in 2011 compared with $5.6 billion in 2010. This was more than any full year in Caterpillar history and beat our 2010 record by more than 40 percent. The positive cash flow has been a result of strong profit performance and significant focus on asset management, particularly for receivables and payables. While we will continue to focus on asset management in 2012, we will not have the positive impact on cash flow from receivables and payables that we had during 2011. Our new OPACC metric (Operating Profit After Capital Charge) has helped improve the focus on asset management throughout the company.
Q13: We have heard that the construction equipment industry in China weakened significantly during the second half of 2011. With that as a backdrop, how is it that your fourth-quarter sales and revenues for the Asia/Pacific region are up almost 50 percent year-over-year? Also, what are your expectations for China in 2012?
A: In total, sales and revenues in Asia/Pacific are up 49 percent in the fourth quarter of 2011 versus the fourth quarter of 2010. Excluding our Bucyrus acquisition, sales and revenues in Asia/Pacific were up about 32 percent. While it is true that the construction equipment industry has decreased in China, and dealer deliveries to end users of new construction equipment have declined, our competitive position has improved and dealer deliveries of new machines have not declined as much as the industry overall. In addition, we sell engines, turbines and aftermarket parts in China, and collectively, they have performed better than machine deliveries to end users. Finally, China makes up less than a quarter of our Asia/Pacific sales and the other countries in the Asia/Pacific region have performed much better.
For 2012, we are expecting economic growth in China of about 8.5 percent. We have seen the Chinese government begin to ease lending policies and expect that will continue in 2012. That should be enough for the industry overall and our sales in China to improve. In addition, we and our dealers have purposely built additional new machine inventory in China to continue to improve our competitive position during the critical selling season that typically follows the Chinese New Year.
Q14: Your outlook suggests that capital expenditures will be about $4 billion in 2012. Why so much?
A: For many of our products, demand in 2011 was above our capacity to produce. Throughout the year at our factories around the world, we invested to add production capacity to support our customers. Despite the increases in capacity, we are still very tight on many products and are currently quoting extended delivery times for some products—for example, we are now quoting delivery times into 2014 for many models of large trucks. We expect 2012 to be a new sales record at a time when construction activity in the United States and Europe—two large markets for us—are still depressed. We believe we are still early in the business cycle, particularly for the United States and Europe, which are still significantly below prior peaks, and where construction spending for housing, commercial development and infrastructure remain weak. We need to invest now to be prepared for the growth that we expect over the next few years.
Q15: With the financial issues, slowing growth and debt problems in Europe and weakness in China, are you seeing worsening credit metrics at Cat Financial in those regions?
A: No, in fact, we see just the opposite. Past dues and credit losses have continued to improve in Europe and China. At year-end 2011, our past due percentage in China was a record low, and 2011 credit losses in China were less than 1 percent of their average retail portfolio. In terms of liquidity, we have had very good access to funding at attractive rates in both Hong Kong and Europe.
GLOSSARY OF TERMS
|
1. |
All Other Segments — Primarily includes activities such as: the remanufacturing of Cat engines and components and remanufacturing services for other companies as well as the product management, development, manufacturing, marketing and product support of undercarriage, specialty products, hardened bar stock components and ground engaging tools primarily for Caterpillar products; logistics services for Caterpillar and other companies; the product management, development, marketing, sales and product support of on-highway vocational trucks for North America (U.S. & Canada only); distribution services responsible for dealer development and administration, dealer portfolio management and ensuring the most efficient and effective distribution of machines, engines and parts; and the 50/50 joint venture with Navistar (NC2) until it became a wholly owned subsidiary of Navistar effective September 29, 2011. |
|
|
|
|
2. |
Bucyrus Impact — This includes Bucyrus results as a wholly owned subsidiary of Caterpillar since the acquisition date of July 8, 2011, acquisition-related costs incurred during 2011 and the impact related to divestiture of the former Bucyrus distribution businesses. Bucyrus acquisition costs relate to losses on interest rate swaps put in place in anticipation of issuing debt for the acquisition, costs for a bridge financing facility, integration costs (including severance-related costs), advisory and legal costs and interest expense on new debt. |
|
|
|
|
3. |
Caterpillar Production System — The Caterpillar Production System is the common Order-to-Delivery process being implemented enterprise-wide to achieve our safety, quality, velocity, earnings and growth goals. |
|
|
|
|
4. |
Consolidating Adjustments — Eliminations of transactions between Machinery and Power Systems and Financial Products. |
|
|
|
|
5. |
Construction Industries — A segment responsible for small and core construction machines. Responsibility includes business strategy, product design, product management and development, manufacturing, marketing, and sales and product support. The product portfolio includes backhoe loaders, small wheel loaders, small track-type tractors, skid steer loaders, multi-terrain loaders, mini excavators, compact wheel loaders, select work tools, small, medium and large track excavators, wheel excavators, medium wheel loaders, medium track-type tractors, track-type loaders, motor graders and pipe layers. In addition, Construction Industries has responsibility for Power Systems and components in Japan and an integrated manufacturing cost center that supports Machinery and Power Systems businesses. |
|
|
|
|
6. |
Currency — With respect to sales and revenues, currency represents the translation impact on sales resulting from changes in foreign currency exchange rates versus the U.S. dollar. With respect to operating profit, currency represents the net translation impact on sales and operating costs resulting from changes in foreign currency exchange rates versus the U.S. dollar. Currency includes the impact on sales and operating profit for the Machinery and Power Systems lines of business only; currency impacts on Financial Products revenues and operating profit are included in the Financial Products portions of the respective analyses. With respect to other income/expense, currency represents the effects of forward and option contracts entered into by the company to reduce the risk of fluctuations in exchange rates and the net effect of changes in foreign currency exchange rates on our foreign currency assets and liabilities for consolidated results. |
|
|
|
|
7. |
Debt-to-Capital Ratio — A key measure of financial strength used by both management and our credit rating agencies. The metric is a ratio of Machinery and Power Systems debt (short-term borrowings plus long-term debt) and redeemable noncontrolling interest to the sum of Machinery and Power Systems debt, redeemable noncontrolling interest and stockholders’ equity. |
|
|
|
|
8. |
EAME — A geographic region including Europe, Africa, the Middle East and the Commonwealth of Independent States (CIS). |
|
|
|
|
9. |
Earning Assets — Assets consisting primarily of total finance receivables net of unearned income, plus equipment on operating leases, less accumulated depreciation at Cat Financial. |
|
|
|
|
10. |
Financial Products Segment — Provides financing to customers and dealers for the purchase and lease of Caterpillar and other equipment, as well as some financing for Caterpillar sales to dealers. Financing plans include operating and finance leases, installment sale contracts, working capital loans and wholesale financing plans. The division also provides various forms of insurance to customers and dealers to help support the purchase and lease of our equipment. |
|
11. |
Latin America — Geographic region including Central and South American countries and Mexico. |
|
|
|
|
12. |
Machinery and Power Systems (M&PS) — Represents the aggregate total of Construction Industries, Resource Industries, Power Systems, and All Other segments and related corporate items and eliminations. |
|
|
|
|
13. |
Machinery and Power Systems Other Operating (Income) Expenses — Comprised primarily of gains/losses on disposal of long-lived assets, long-lived asset impairment charges, pension curtailment charges and employee redundancy costs. |
|
|
|
|
14. |
Manufacturing Costs — Manufacturing costs exclude the impacts of currency and represent the volume-adjusted change for variable costs and the absolute dollar change for period manufacturing costs. Variable manufacturing costs are defined as having a direct relationship with the volume of production. This includes material costs, direct labor and other costs that vary directly with production volume such as freight, power to operate machines and supplies that are consumed in the manufacturing process. Period manufacturing costs support production but are defined as generally not having a direct relationship to short-term changes in volume. Examples include machinery and equipment repair, depreciation on manufacturing assets, facility support, procurement, factory scheduling, manufacturing planning and operations management. |
|
|
|
|
15. |
Power Systems — A segment responsible for the product management, development, manufacturing, marketing, sales and product support of reciprocating engine powered generator sets, integrated systems used in the electric power generation industry, reciprocating engines and integrated systems and solutions for the marine and petroleum industries; reciprocating engines supplied to the industrial industry as well as Caterpillar machinery; the product management, development, manufacturing, marketing, sales and product support of turbines and turbine-related services; the development, manufacturing, remanufacturing, maintenance, leasing and service of diesel-electric locomotives and components and other rail-related products and services. |
|
|
|
|
16. |
Price Realization — The impact of net price changes excluding currency and new product introductions. Consolidated price realization includes the impact of changes in the relative weighting of sales between geographic regions. |
|
|
|
|
17. |
Resource Industries — A segment responsible for business strategy, product design, product management and development, manufacturing, marketing and sales and product support for large track-type tractors, large mining trucks, underground mining equipment, tunnel boring equipment, large wheel loaders, off-highway trucks, articulated trucks, wheel tractor scrapers, wheel dozers, compactors, select work tools, forestry products, paving products, machinery components and electronics and control systems. In addition, Resource Industries manages areas that provide services to other parts of the company, including integrated manufacturing, research and development and coordination of the Caterpillar Production System. On July 8, 2011, the acquisition of Bucyrus International was completed. This added the responsibility for business strategy, product design, product management and development, manufacturing, marketing and sales and product support for electric rope shovels, draglines, hydraulic shovels, drills, highwall miners and electric drive off-highway trucks to Resource Industries. In addition, Resource Industries segment profit includes Bucyrus acquisition-related costs and the impact from divestiture of the former Bucyrus distribution businesses. |
|
|
|
|
18. |
Sales Volume — With respect to sales and revenues, sales volume represents the impact of changes in the quantities sold for Machinery and Power Systems as well as the incremental revenue impact of new product introductions, including emissions-related product updates. With respect to operating profit, sales volume represents the impact of changes in the quantities sold for Machinery and Power Systems combined with product mix as well as the net operating profit impact of new product introductions, including emissions-related product updates. Product mix represents the net operating profit impact of changes in the relative weighting of Machinery and Power Systems sales with respect to total sales. |
NON-GAAP FINANCIAL MEASURES
The following definition is provided for “non-GAAP financial measures” in connection with Regulation G issued by the Securities and Exchange Commission. This non-GAAP financial measure has no standardized meaning prescribed by U.S. GAAP and therefore is unlikely to be comparable to the calculation of similar measures for other companies. Management does not intend this item to be considered in isolation or substituted for the related GAAP measure.
Bucyrus-Related Sales and Profit-Per-Share Impacts
We acquired Bucyrus International, Inc. on July 8, 2011. The fourth-quarter profit impact of this acquisition was primarily due to operating profit from ongoing operations and the impact related to divestiture of the former Bucyrus distribution businesses, partially offset by inventory step-up, incremental amortization of intangible assets and interest expense. The full-year loss was primarily due to inventory step-up, deal-related and integration costs (including severance-related costs), loss on interest rate swaps, incremental amortization of intangible assets, interest expense and bridge financing facility costs, partially offset by operating profit from ongoing operations and the impact related to divestiture of the former Bucyrus distribution businesses. We believe it is important to separately quantify the sales and revenues and profit-per-share impacts in order for our 2011 actual results to be meaningful to our readers and more comparable to prior period results. Reconciliation of sales and revenues and profit per share excluding Bucyrus impacts to the most directly comparable GAAP measure, is as follows:
|
(Dollars in billions except per share data) |
|
Fourth Quarter |
|
Full Year |
| ||
|
Sales and Revenues |
|
$ |
17.243 |
|
$ |
60.138 |
|
|
Bucyrus Sales impact |
|
$ |
1.389 |
|
$ |
2.524 |
|
|
Sales and Revenues excluding Bucyrus |
|
$ |
15.854 |
|
$ |
57.614 |
|
|
|
|
|
|
|
| ||
|
Profit per share |
|
$ |
2.32 |
|
$ |
7.40 |
|
|
Profit per share Bucyrus impact |
|
$ |
0.07 |
|
$ |
(0.39 |
) |
|
Profit per share excluding Bucyrus |
|
$ |
2.25 |
|
$ |
7.79 |
|
Machinery and Power Systems
Caterpillar defines Machinery and Power Systems as it is presented in the supplemental data as Caterpillar Inc. and its subsidiaries with Financial Products accounted for on the equity basis. Machinery and Power Systems information relates to the design, manufacture and marketing of our products. Financial Products information relates to the financing to customers and dealers for the purchase and lease of Caterpillar and other equipment. The nature of these businesses is different, especially with regard to the financial position and cash flow items. Caterpillar management utilizes this presentation internally to highlight these differences. We also believe this presentation will assist readers in understanding our business. Pages 39-44 reconcile Machinery and Power Systems with Financial Products on the equity basis to Caterpillar Inc. consolidated financial information.
Caterpillar’s latest financial results and outlook are also available via:
Telephone:
(800) 228-7717 (Inside the United States and Canada)
(858) 244-2080 (Outside the United States and Canada)
Internet:
http://www.caterpillar.com/investor
http://www.caterpillar.com/irwebcast (live broadcast/replays of quarterly conference call)
Caterpillar contact:
Jim Dugan
Corporate Public Affairs
(309) 494-4100 (Office) or (309) 360-7311 (Mobile)
mail to: Dugan_Jim@cat.com
Caterpillar Inc.
Condensed Consolidated Statement of Results of Operations
(Unaudited)
(Dollars in millions except per share data)
|
|
|
Three Months Ended |
|
Twelve Months Ended |
| ||||||||
|
|
|
December 31, |
|
December 31, |
| ||||||||
|
|
|
2011 |
|
2010 |
|
2011 |
|
2010 |
| ||||
|
Sales and revenues: |
|
|
|
|
|
|
|
|
| ||||
|
Sales of Machinery and Power Systems |
|
$ |
16,557 |
|
$ |
12,141 |
|
$ |
57,392 |
|
$ |
39,867 |
|
|
Revenues of Financial Products |
|
686 |
|
666 |
|
2,746 |
|
2,721 |
| ||||
|
Total sales and revenues |
|
17,243 |
|
12,807 |
|
60,138 |
|
42,588 |
| ||||
|
|
|
|
|
|
|
|
|
|
| ||||
|
Operating costs: |
|
|
|
|
|
|
|
|
| ||||
|
Cost of goods sold |
|
12,763 |
|
9,349 |
|
43,578 |
|
30,367 |
| ||||
|
Selling, general and administrative expenses |
|
1,487 |
|
1,109 |
|
5,203 |
|
4,248 |
| ||||
|
Research and development expenses |
|
604 |
|
543 |
|
2,297 |
|
1,905 |
| ||||
|
Interest expense of Financial Products |
|
203 |
|
220 |
|
826 |
|
914 |
| ||||
|
Other operating (income) expenses |
|
226 |
|
295 |
|
1,081 |
|
1,191 |
| ||||
|
Total operating costs |
|
15,283 |
|
11,516 |
|
52,985 |
|
38,625 |
| ||||
|
|
|
|
|
|
|
|
|
|
| ||||
|
Operating profit |
|
1,960 |
|
1,291 |
|
7,153 |
|
3,963 |
| ||||
|
|
|
|
|
|
|
|
|
|
| ||||
|
Interest expense excluding Financial Products |
|
107 |
|
75 |
|
396 |
|
343 |
| ||||
|
Other income (expense) |
|
125 |
|
16 |
|
(32 |
) |
130 |
| ||||
|
|
|
|
|
|
|
|
|
|
| ||||
|
Consolidated profit before taxes |
|
1,978 |
|
1,232 |
|
6,725 |
|
3,750 |
| ||||
|
|
|
|
|
|
|
|
|
|
| ||||
|
Provision (benefit) for income taxes |
|
416 |
|
233 |
|
1,720 |
|
968 |
| ||||
|
Profit of consolidated companies |
|
1,562 |
|
999 |
|
5,005 |
|
2,782 |
| ||||
|
|
|
|
|
|
|
|
|
|
| ||||
|
Equity in profit (loss) of unconsolidated affiliated companies |
|
— |
|
(11 |
) |
(24 |
) |
(24 |
) | ||||
|
|
|
|
|
|
|
|
|
|
| ||||
|
Profit of consolidated and affiliated companies |
|
1,562 |
|
988 |
|
4,981 |
|
2,758 |
| ||||
|
|
|
|
|
|
|
|
|
|
| ||||
|
Less: Profit (loss) attributable to noncontrolling interests |
|
15 |
|
20 |
|
53 |
|
58 |
| ||||
|
|
|
|
|
|
|
|
|
|
| ||||
|
Profit (1) |
|
$ |
1,547 |
|
$ |
968 |
|
$ |
4,928 |
|
$ |
2,700 |
|
|
|
|
|
|
|
|
|
|
|
| ||||
|
Profit per common share |
|
$ |
2.39 |
|
$ |
1.52 |
|
$ |
7.64 |
|
$ |
4.28 |
|
|
|
|
|
|
|
|
|
|
|
| ||||
|
Profit per common share — diluted (2) |
|
$ |
2.32 |
|
$ |
1.47 |
|
$ |
7.40 |
|
$ |
4.15 |
|
|
|
|
|
|
|
|
|
|
|
| ||||
|
Weighted average common shares outstanding (millions) |
|
|
|
|
|
|
|
|
| ||||
|
- Basic |
|
647.1 |
|
637.0 |
|
645.0 |
|
631.5 |
| ||||
|
- Diluted (2) |
|
665.9 |
|
659.6 |
|
666.1 |
|
650.4 |
| ||||
|
|
|
|
|
|
|
|
|
|
| ||||
|
Cash dividends declared per common share |
|
$ |
0.92 |
|
$ |
0.88 |
|
$ |
1.82 |
|
$ |
1.74 |
|
|
(1) |
Profit attributable to common stockholders. |
|
(2) |
Diluted by assumed exercise of stock-based compensation awards, using the treasury stock method. |
Caterpillar Inc.
Condensed Consolidated Statement of Financial Position
(Unaudited)
(Millions of dollars)
|
|
|
December 31, |
|
December 31, |
| ||
|
|
|
2011 |
|
2010 |
| ||
|
Assets |
|
|
|
|
| ||
|
Current assets: |
|
|
|
|
| ||
|
Cash and short-term investments |
|
$ |
3,057 |
|
$ |
3,592 |
|
|
Receivables - trade and other |
|
10,285 |
|
8,494 |
| ||
|
Receivables - finance |
|
7,668 |
|
8,298 |
| ||
|
Deferred and refundable income taxes |
|
1,580 |
|
931 |
| ||
|
Prepaid expenses and other current assets |
|
994 |
|
908 |
| ||
|
Inventories |
|
14,544 |
|
9,587 |
| ||
|
Total current assets |
|
38,128 |
|
31,810 |
| ||
|
|
|
|
|
|
| ||
|
Property, plant and equipment – net |
|
14,395 |
|
12,539 |
| ||
|
Long-term receivables - trade and other |
|
1,130 |
|
793 |
| ||
|
Long-term receivables - finance |
|
11,948 |
|
11,264 |
| ||
|
Investments in unconsolidated affiliated companies |
|
133 |
|
164 |
| ||
|
Noncurrent deferred and refundable income taxes |
|
2,157 |
|
2,493 |
| ||
|
Intangible assets |
|
4,368 |
|
805 |
| ||
|
Goodwill |
|
7,080 |
|
2,614 |
| ||
|
Other assets |
|
2,107 |
|
1,538 |
| ||
|
Total assets |
|
$ |
81,446 |
|
$ |
64,020 |
|
|
|
|
|
|
|
| ||
|
Liabilities |
|
|
|
|
| ||
|
Current liabilities: |
|
|
|
|
| ||
|
Short-term borrowings: |
|
|
|
|
| ||
|
— Machinery and Power Systems |
|
$ |
93 |
|
$ |
204 |
|
|
— Financial Products |
|
3,895 |
|
3,852 |
| ||
|
Accounts payable |
|
8,161 |
|
5,856 |
| ||
|
Accrued expenses |
|
3,386 |
|
2,880 |
| ||
|
Accrued wages, salaries and employee benefits |
|
2,410 |
|
1,670 |
| ||
|
Customer advances |
|
2,691 |
|
1,831 |
| ||
|
Dividends payable |
|
298 |
|
281 |
| ||
|
Other current liabilities |
|
1,967 |
|
1,521 |
| ||
|
Long-term debt due within one year: |
|
|
|
|
| ||
|
— Machinery and Power Systems |
|
558 |
|
495 |
| ||
|
— Financial Products |
|
5,102 |
|
3,430 |
| ||
|
Total current liabilities |
|
28,561 |
|
22,020 |
| ||
|
|
|
|
|
|
| ||
|
Long-term debt due after one year: |
|
|
|
|
| ||
|
— Machinery and Power Systems |
|
8,415 |
|
4,505 |
| ||
|
— Financial Products |
|
16,529 |
|
15,932 |
| ||
|
Liability for postemployment benefits |
|
10,956 |
|
7,584 |
| ||
|
Other liabilities |
|
3,583 |
|
2,654 |
| ||
|
Total liabilities |
|
68,044 |
|
52,695 |
| ||
|
|
|
|
|
|
| ||
|
Redeemable noncontrolling interest |
|
473 |
|
461 |
| ||
|
|
|
|
|
|
| ||
|
Stockholders’ equity |
|
|
|
|
| ||
|
Common stock |
|
4,273 |
|
3,888 |
| ||
|
Treasury stock |
|
(10,281 |
) |
(10,397 |
) | ||
|
Profit employed in the business |
|
25,219 |
|
21,384 |
| ||
|
Accumulated other comprehensive income (loss) |
|
(6,328 |
) |
(4,051 |
) | ||
|
Noncontrolling interests |
|
46 |
|
40 |
| ||
|
Total stockholders’ equity |
|
12,929 |
|
10,864 |
| ||
|
Total liabilities, redeemable noncontrolling interest and stockholders’ equity |
|
$ |
81,446 |
|
$ |
64,020 |
|
Caterpillar Inc.
Condensed Consolidated Statement of Cash Flow
(Unaudited)
(Millions of dollars)
|
|
|
Twelve Months Ended |
| ||||
|
|
|
December 31, |
| ||||
|
|
|
2011 |
|
2010 |
| ||
|
Cash flow from operating activities: |
|
|
|
|
| ||
|
Profit of consolidated and affiliated companies |
|
$ |
4,981 |
|
$ |
2,758 |
|
|
Adjustments for non-cash items: |
|
|
|
|
| ||
|
Depreciation and amortization |
|
2,527 |
|
2,296 |
| ||
|
Other |
|
457 |
|
469 |
| ||
|
Changes in assets and liabilities, net of acquisitions and divestitures: |
|
|
|
|
| ||
|
Receivables – trade and other |
|
(1,345 |
) |
(2,320 |
) | ||
|
Inventories |
|
(2,927 |
) |
(2,667 |
) | ||
|
Accounts payable |
|
1,555 |
|
2,570 |
| ||
|
Accrued expenses |
|
308 |
|
117 |
| ||
|
Accrued wages, salaries and employee benefits |
|
619 |
|
847 |
| ||
|
Customer advances |
|
173 |
|
604 |
| ||
|
Other assets – net |
|
(91 |
) |
358 |
| ||
|
Other liabilities – net |
|
753 |
|
(23 |
) | ||
|
Net cash provided by (used for) operating activities |
|
7,010 |
|
5,009 |
| ||
|
Cash flow from investing activities: |
|
|
|
|
| ||
|
Capital expenditures – excluding equipment leased to others |
|
(2,515 |
) |
(1,575 |
) | ||
|
Expenditures for equipment leased to others |
|
(1,409 |
) |
(1,011 |
) | ||
|
Proceeds from disposals of leased assets and property, plant and equipment |
|
1,354 |
|
1,469 |
| ||
|
Additions to finance receivables |
|
(10,001 |
) |
(8,498 |
) | ||
|
Collections of finance receivables |
|
8,874 |
|
8,987 |
| ||
|
Proceeds from sale of finance receivables |
|
207 |
|
16 |
| ||
|
Investments and acquisitions (net of cash acquired) |
|
(8,184 |
) |
(1,126 |
) | ||
|
Proceeds from sale of businesses and investments (net of cash sold) |
|
376 |
|
— |
| ||
|
Proceeds from sale of available-for-sale securities |
|
247 |
|
228 |
| ||
|
Investments in available-for-sale securities |
|
(336 |
) |
(217 |
) | ||
|
Other – net |
|
(40 |
) |
132 |
| ||
|
Net cash provided by (used for) investing activities |
|
(11,427 |
) |
(1,595 |
) | ||
|
Cash flow from financing activities: |
|
|
|
|
| ||
|
Dividends paid |
|
(1,159 |
) |
(1,084 |
) | ||
|
Distribution to noncontrolling interests |
|
(3 |
) |
— |
| ||
|
Common stock issued, including treasury shares reissued |
|
123 |
|
296 |
| ||
|
Excess tax benefit from stock-based compensation |
|
189 |
|
153 |
| ||
|
Acquisitions of noncontrolling interests |
|
(8 |
) |
(132 |
) | ||
|
Proceeds from debt issued (original maturities greater than three months) |
|
15,460 |
|
8,324 |
| ||
|
Payments on debt (original maturities greater than three months) |
|
(10,593 |
) |
(12,461 |
) | ||
|
Short-term borrowings - net (original maturities three months or less) |
|
(43 |
) |
291 |
| ||
|
Net cash provided by (used for) financing activities |
|
3,966 |
|
(4,613 |
) | ||
|
Effect of exchange rate changes on cash |
|
(84 |
) |
(76 |
) | ||
|
Increase (decrease) in cash and short-term investments |
|
(535 |
) |
(1,275 |
) | ||
|
Cash and short-term investments at beginning of period |
|
3,592 |
|
4,867 |
| ||
|
Cash and short-term investments at end of period |
|
$ |
3,057 |
|
$ |
3,592 |
|
All short-term investments, which consist primarily of highly liquid investments with original maturities of three months or less, are considered to be cash equivalents.
Caterpillar Inc.
Supplemental Data for Results of Operations
For The Three Months Ended December 31, 2011
(Unaudited)
(Millions of dollars)
|
|
|
|
|
Supplemental Consolidating Data |
| ||||||||
|
|
|
|
|
Machinery |
|
|
|
|
| ||||
|
|
|
Consolidated |
|
and Power |
|
Financial |
|
Consolidating |
| ||||
|
Sales and revenues: |
|
|
|
|
|
|
|
|
| ||||
|
Sales of Machinery and Power Systems |
|
$ |
16,557 |
|
$ |
16,557 |
|
$ |
— |
|
$ |
— |
|
|
Revenues of Financial Products |
|
686 |
|
— |
|
766 |
|
(80 |
)(2) | ||||
|
Total sales and revenues |
|
17,243 |
|
16,557 |
|
766 |
|
(80 |
) | ||||
|
|
|
|
|
|
|
|
|
|
| ||||
|
Operating costs: |
|
|
|
|
|
|
|
|
| ||||
|
Cost of goods sold |
|
12,763 |
|
12,763 |
|
— |
|
— |
| ||||
|
Selling, general and administrative expenses |
|
1,487 |
|
1,344 |
|
177 |
|
(34 |
)(3) | ||||
|
Research and development expenses |
|
604 |
|
604 |
|
— |
|
— |
| ||||
|
Interest expense of Financial Products |
|
203 |
|
— |
|
203 |
|
— |
(4) | ||||
|
Other operating (income) expenses |
|
226 |
|
(23 |
) |
230 |
|
19 |
(3) | ||||
|
Total operating costs |
|
15,283 |
|
14,688 |
|
610 |
|
(15 |
) | ||||
|
|
|
|
|
|
|
|
|
|
| ||||
|
Operating profit |
|
1,960 |
|
1,869 |
|
156 |
|
(65 |
) | ||||
|
|
|
|
|
|
|
|
|
|
| ||||
|
Interest expense excluding Financial Products |
|
107 |
|
118 |
|
— |
|
(11 |
)(4) | ||||
|
Other income (expense) |
|
125 |
|
63 |
|
8 |
|
54 |
(5) | ||||
|
|
|
|
|
|
|
|
|
|
| ||||
|
Consolidated profit before taxes |
|
1,978 |
|
1,814 |
|
164 |
|
— |
| ||||
|
|
|
|
|
|
|
|
|
|
| ||||
|
Provision for income taxes |
|
416 |
|
384 |
|
32 |
|
— |
| ||||
|
Profit of consolidated companies |
|
1,562 |
|
1,430 |
|
132 |
|
— |
| ||||
|
|
|
|
|
|
|
|
|
|
| ||||
|
Equity in profit (loss) of unconsolidated affiliated companies |
|
— |
|
— |
|
— |
|
— |
| ||||
|
Equity in profit of Financial Products’ subsidiaries |
|
— |
|
129 |
|
— |
|
(129 |
)(6) | ||||
|
|
|
|
|
|
|
|
|
|
| ||||
|
Profit of consolidated and affiliated companies |
|
1,562 |
|
1,559 |
|
132 |
|
(129 |
) | ||||
|
|
|
|
|
|
|
|
|
|
| ||||
|
Less: Profit (loss) attributable to noncontrolling interests |
|
15 |
|
12 |
|
3 |
|
— |
| ||||
|
|
|
|
|
|
|
|
|
|
| ||||
|
Profit (7) |
|
$ |
1,547 |
|
$ |
1,547 |
|
$ |
129 |
|
$ |
(129 |
) |
|
(1) |
Represents Caterpillar Inc. and its subsidiaries with Financial Products accounted for on the equity basis. |
|
(2) |
Elimination of Financial Products’ revenues earned from Machinery and Power Systems. |
|
(3) |
Elimination of net expenses recorded by Machinery and Power Systems paid to Financial Products. |
|
(4) |
Elimination of interest expense recorded between Financial Products and Machinery and Power Systems. |
|
(5) |
Elimination of discount recorded by Machinery and Power Systems on receivables sold to Financial Products and of interest earned between Machinery and Power Systems and Financial Products. |
|
(6) |
Elimination of Financial Products’ profit due to equity method of accounting. |
|
(7) |
Profit attributable to common stockholders. |
Caterpillar Inc.
Supplemental Data for Results of Operations
For The Three Months Ended December 31, 2010
(Unaudited)
(Millions of dollars)
|
|
|
|
|
Supplemental Consolidating Data |
| ||||||||
|
|
|
|
|
Machinery |
|
|
|
|
| ||||
|
|
|
Consolidated |
|
and Power |
|
Financial |
|
Consolidating |
| ||||
|
Sales and revenues: |
|
|
|
|
|
|
|
|
| ||||
|
Sales of Machinery and Power Systems |
|
$ |
12,141 |
|
$ |
12,141 |
|
$ |
— |
|
$ |
— |
|
|
Revenues of Financial Products |
|
666 |
|
— |
|
738 |
|
(72 |
)(2) | ||||
|
Total sales and revenues |
|
12,807 |
|
12,141 |
|
738 |
|
(72 |
) | ||||
|
|
|
|
|
|
|
|
|
|
| ||||
|
Operating costs: |
|
|
|
|
|
|
|
|
| ||||
|
Cost of goods sold |
|
9,349 |
|
9,349 |
|
— |
|
— |
| ||||
|
Selling, general and administrative expenses |
|
1,109 |
|
974 |
|
162 |
|
(27 |
)(3) | ||||
|
Research and development expenses |
|
543 |
|
543 |
|
— |
|
— |
| ||||
|
Interest expense of Financial Products |
|
220 |
|
— |
|
220 |
|
— |
(4) | ||||
|
Other operating (income) expenses |
|
295 |
|
31 |
|
254 |
|
10 |
(3) | ||||
|
Total operating costs |
|
11,516 |
|
10,897 |
|
636 |
|
(17 |
) | ||||
|
|
|
|
|
|
|
|
|
|
| ||||
|
Operating profit |
|
1,291 |
|
1,244 |
|
102 |
|
(55 |
) | ||||
|
|
|
|
|
|
|
|
|
|
| ||||
|
Interest expense excluding Financial Products |
|
75 |
|
82 |
|
— |
|
(7 |
)(4) | ||||
|
Other income (expense) |
|
16 |
|
(48 |
) |
16 |
|
48 |
(5) | ||||
|
|
|
|
|
|
|
|
|
|
| ||||
|
Consolidated profit before taxes |
|
1,232 |
|
1,114 |
|
118 |
|
— |
| ||||
|
|
|
|
|
|
|
|
|
|
| ||||
|
Provision for income taxes |
|
233 |
|
212 |
|
21 |
|
— |
| ||||
|
Profit of consolidated companies |
|
999 |
|
902 |
|
97 |
|
— |
| ||||
|
|
|
|
|
|
|
|
|
|
| ||||
|
Equity in profit (loss) of unconsolidated affiliated companies |
|
(11 |
) |
(11 |
) |
— |
|
— |
| ||||
|
Equity in profit of Financial Products’ subsidiaries |
|
— |
|
94 |
|
— |
|
(94 |
)(6) | ||||
|
|
|
|
|
|
|
|
|
|
| ||||
|
Profit of consolidated and affiliated companies |
|
988 |
|
985 |
|
97 |
|
(94 |
) | ||||
|
|
|
|
|
|
|
|
|
|
| ||||
|
Less: Profit (loss) attributable to noncontrolling interests |
|
20 |
|
17 |
|
3 |
|
— |
| ||||
|
|
|
|
|
|
|
|
|
|
| ||||
|
Profit (7) |
|
$ |
968 |
|
$ |
968 |
|
$ |
94 |
|
$ |
(94 |
) |
|
(1) |
Represents Caterpillar Inc. and its subsidiaries with Financial Products accounted for on the equity basis. |
|
(2) |
Elimination of Financial Products’ revenues earned from Machinery and Power Systems. |
|
(3) |
Elimination of net expenses recorded by Machinery and Power Systems paid to Financial Products. |
|
(4) |
Elimination of interest expense recorded between Financial Products and Machinery and Power Systems. |
|
(5) |
Elimination of discount recorded by Machinery and Power Systems on receivables sold to Financial Products and of interest earned between Machinery and Power Systems and Financial Products. |
|
(6) |
Elimination of Financial Products’ profit due to equity method of accounting. |
|
(7) |
Profit attributable to common stockholders. |
Caterpillar Inc.
Supplemental Data for Results of Operations
For The Twelve Months Ended December 31, 2011
(Unaudited)
(Millions of dollars)
|
|
|
|
|
Supplemental Consolidating Data |
| ||||||||
|
|
|
|
|
Machinery |
|
|
|
|
| ||||
|
|
|
Consolidated |
|
and Power |
|
Financial |
|
Consolidating |
| ||||
|
Sales and revenues: |
|
|
|
|
|
|
|
|
| ||||
|
Sales of Machinery and Power Systems |
|
$ |
57,392 |
|
$ |
57,392 |
|
$ |
— |
|
$ |
— |
|
|
Revenues of Financial Products |
|
2,746 |
|
— |
|
3,057 |
|
(311 |
)(2) | ||||
|
Total sales and revenues |
|
60,138 |
|
57,392 |
|
3,057 |
|
(311 |
) | ||||
|
|
|
|
|
|
|
|
|
|
| ||||
|
Operating costs: |
|
|
|
|
|
|
|
|
| ||||
|
Cost of goods sold |
|
43,578 |
|
43,578 |
|
— |
|
— |
| ||||
|
Selling, general and administrative expenses |
|
5,203 |
|
4,631 |
|
621 |
|
(49 |
)(3) | ||||
|
Research and development expenses |
|
2,297 |
|
2,297 |
|
— |
|
— |
| ||||
|
Interest expense of Financial Products |
|
826 |
|
— |
|
827 |
|
(1 |
)(4) | ||||
|
Other operating (income) expenses |
|
1,081 |
|
63 |
|
1,026 |
|
(8 |
)(3) | ||||
|
Total operating costs |
|
52,985 |
|
50,569 |
|
2,474 |
|
(58 |
) | ||||
|
|
|
|
|
|
|
|
|
|
| ||||
|
Operating profit |
|
7,153 |
|
6,823 |
|
583 |
|
(253 |
) | ||||
|
|
|
|
|
|
|
|
|
|
| ||||
|
Interest expense excluding Financial Products |
|
396 |
|
439 |
|
— |
|
(43 |
)(4) | ||||
|
Other income (expense) |
|
(32 |
) |
(279 |
) |
37 |
|
210 |
(5) | ||||
|
|
|
|
|
|
|
|
|
|
| ||||
|
Consolidated profit before taxes |
|
6,725 |
|
6,105 |
|
620 |
|
— |
| ||||
|
|
|
|
|
|
|
|
|
|
| ||||
|
Provision for income taxes |
|
1,720 |
|
1,568 |
|
152 |
|
— |
| ||||
|
Profit of consolidated companies |
|
5,005 |
|
4,537 |
|
468 |
|
— |
| ||||
|
|
|
|
|
|
|
|
|
|
| ||||
|
Equity in profit (loss) of unconsolidated affiliated companies |
|
(24 |
) |
(24 |
) |
— |
|
— |
| ||||
|
Equity in profit of Financial Products’ subsidiaries |
|
— |
|
453 |
|
— |
|
(453 |
)(6) | ||||
|
|
|
|
|
|
|
|
|
|
| ||||
|
Profit of consolidated and affiliated companies |
|
4,981 |
|
4,966 |
|
468 |
|
(453 |
) | ||||
|
|
|
|
|
|
|
|
|
|
| ||||
|
Less: Profit (loss) attributable to noncontrolling interests |
|
53 |
|
38 |
|
15 |
|
— |
| ||||
|
|
|
|
|
|
|
|
|
|
| ||||
|
Profit (7) |
|
$ |
4,928 |
|
$ |
4,928 |
|
$ |
453 |
|
$ |
(453 |
) |
|
(1) |
Represents Caterpillar Inc. and its subsidiaries with Financial Products accounted for on the equity basis. |
|
(2) |
Elimination of Financial Products’ revenues earned from Machinery and Power Systems. |
|
(3) |
Elimination of net expenses recorded by Machinery and Power Systems paid to Financial Products. |
|
(4) |
Elimination of interest expense recorded between Financial Products and Machinery and Power Systems. |
|
(5) |
Elimination of discount recorded by Machinery and Power Systems on receivables sold to Financial Products and of interest earned between Machinery and Power Systems and Financial Products. |
|
(6) |
Elimination of Financial Products’ profit due to equity method of accounting. |
|
(7) |
Profit attributable to common stockholders. |
Caterpillar Inc.
Supplemental Data for Results of Operations
For The Twelve Months Ended December 31, 2010
(Unaudited)
(Millions of dollars)
|
|
|
|
|
Supplemental Consolidating Data |
| ||||||||
|
|
|
|
|
Machinery |
|
|
|
|
| ||||
|
|
|
Consolidated |
|
and Power |
|
Financial |
|
Consolidating |
| ||||
|
Sales and revenues: |
|
|
|
|
|
|
|
|
| ||||
|
Sales of Machinery and Power Systems |
|
$ |
39,867 |
|
$ |
39,867 |
|
$ |
— |
|
$ |
— |
|
|
Revenues of Financial Products |
|
2,721 |
|
— |
|
2,986 |
|
(265 |
)(2) | ||||
|
Total sales and revenues |
|
42,588 |
|
39,867 |
|
2,986 |
|
(265 |
) | ||||
|
|
|
|
|
|
|
|
|
|
| ||||
|
Operating costs: |
|
|
|
|
|
|
|
|
| ||||
|
Cost of goods sold |
|
30,367 |
|
30,367 |
|
— |
|
— |
| ||||
|
Selling, general and administrative expenses |
|
4,248 |
|
3,689 |
|
603 |
|
(44 |
)(3) | ||||
|
Research and development expenses |
|
1,905 |
|
1,905 |
|
— |
|
— |
| ||||
|
Interest expense of Financial Products |
|
914 |
|
— |
|
916 |
|
(2 |
)(4) | ||||
|
Other operating (income) expenses |
|
1,191 |
|
119 |
|
1,080 |
|
(8 |
)(3) | ||||
|
Total operating costs |
|
38,625 |
|
36,080 |
|
2,599 |
|
(54 |
) | ||||
|
|
|
|
|
|
|
|
|
|
| ||||
|
Operating profit |
|
3,963 |
|
3,787 |
|
387 |
|
(211 |
) | ||||
|
|
|
|
|
|
|
|
|
|
| ||||
|
Interest expense excluding Financial Products |
|
343 |
|
407 |
|
— |
|
(64 |
)(4) | ||||
|
Other income (expense) |
|
130 |
|
(77 |
) |
60 |
|
147 |
(5) | ||||
|
|
|
|
|
|
|
|
|
|
| ||||
|
Consolidated profit before taxes |
|
3,750 |
|
3,303 |
|
447 |
|
— |
| ||||
|
|
|
|
|
|
|
|
|
|
| ||||
|
Provision (benefit) for income taxes |
|
968 |
|
882 |
|
86 |
|
— |
| ||||
|
Profit of consolidated companies |
|
2,782 |
|
2,421 |
|
361 |
|
— |
| ||||
|
|
|
|
|
|
|
|
|
|
| ||||
|
Equity in profit (loss) of unconsolidated affiliated companies |
|
(24 |
) |
(24 |
) |
— |
|
— |
| ||||
|
Equity in profit of Financial Products’ subsidiaries |
|
— |
|
350 |
|
— |
|
(350 |
)(6) | ||||
|
|
|
|
|
|
|
|
|
|
| ||||
|
Profit of consolidated and affiliated companies |
|
2,758 |
|
2,747 |
|
361 |
|
(350 |
) | ||||
|
|
|
|
|
|
|
|
|
|
| ||||
|
Less: Profit (loss) attributable to noncontrolling interests |
|
58 |
|
47 |
|
11 |
|
— |
| ||||
|
|
|
|
|
|
|
|
|
|
| ||||
|
Profit (7) |
|
$ |
2,700 |
|
$ |
2,700 |
|
$ |
350 |
|
$ |
(350 |
) |
|
(1) |
Represents Caterpillar Inc. and its subsidiaries with Financial Products accounted for on the equity basis. |
|
(2) |
Elimination of Financial Products’ revenues earned from Machinery and Power Systems. |
|
(3) |
Elimination of net expenses recorded by Machinery and Power Systems paid to Financial Products. |
|
(4) |
Elimination of interest expense recorded between Financial Products and Machinery and Power Systems. |
|
(5) |
Elimination of discount recorded by Machinery and Power Systems on receivables sold to Financial Products and of interest earned between Machinery and Power Systems and Financial Products. |
|
(6) |
Elimination of Financial Products’ profit due to equity method of accounting. |
|
(7) |
Profit attributable to common stockholders. |
Caterpillar Inc.
Supplemental Data for Cash Flow
For The Twelve Months Ended December 31, 2011
(Unaudited)
(Millions of dollars)
|
|
|
|
|
Supplemental Consolidating Data |
| ||||||||
|
|
|
|
|
Machinery |
|
|
|
|
| ||||
|
|
|
Consolidated |
|
and Power |
|
Financial |
|
Consolidating |
| ||||
|
Cash flow from operating activities: |
|
|
|
|
|
|
|
|
| ||||
|
Profit of consolidated and affiliated companies |
|
$ |
4,981 |
|
$ |
4,966 |
|
$ |
468 |
|
$ |
(453 |
)(2) |
|
Adjustments for non-cash items: |
|
|
|
|
|
|
|
|
| ||||
|
Depreciation and amortization |
|
2,527 |
|
1,802 |
|
725 |
|
— |
| ||||
|
Other |
|
457 |
|
342 |
|
(112 |
) |
227 |
(4) | ||||
|
Financial Products’ dividend in excess of profit |
|
— |
|
147 |
|
— |
|
(147 |
)(3) | ||||
|
Changes in assets and liabilities, net of acquisitions and divestitures: |
|
|
|
|
|
|
|
|
| ||||
|
Receivables - trade and other |
|
(1,345 |
) |
286 |
|
5 |
|
(1,636 |
)(4),(5) | ||||
|
Inventories |
|
(2,927 |
) |
(2,924 |
) |
— |
|
(3 |
)(4) | ||||
|
Accounts payable |
|
1,555 |
|
1,635 |
|
(8 |
) |
(72 |
)(4) | ||||
|
Accrued expenses |
|
308 |
|
282 |
|
28 |
|
(2 |
)(4) | ||||
|
Accrued wages, salaries and employee benefits |
|
619 |
|
610 |
|
9 |
|
— |
| ||||
|
Customer advances |
|
173 |
|
173 |
|
— |
|
— |
| ||||
|
Other assets - net |
|
(91 |
) |
(139 |
) |
35 |
|
13 |
(4) | ||||
|
Other liabilities - net |
|
753 |
|
792 |
|
(26 |
) |
(13 |
)(4) | ||||
|
Net cash provided by (used for) operating activities |
|
7,010 |
|
7,972 |
|
1,124 |
|
(2,086 |
) | ||||
|
Cash flow from investing activities: |
|
|
|
|
|
|
|
|
| ||||
|
Capital expenditures - excluding equipment leased to others |
|
(2,515 |
) |
(2,503 |
) |
(12 |
) |
— |
| ||||
|
Expenditures for equipment leased to others |
|
(1,409 |
) |
(143 |
) |
(1,342 |
) |
76 |
(4) | ||||
|
Proceeds from disposals of leased assets and property, plant and equipment |
|
1,354 |
|
259 |
|
1,173 |
|
(78 |
)(4) | ||||
|
Additions to finance receivables |
|
(10,001 |
) |
— |
|
(49,126 |
) |
39,125 |
(5),(9) | ||||
|
Collections of finance receivables |
|
8,874 |
|
— |
|
46,164 |
|
(37,290 |
)(5) | ||||
|
Proceeds from sale of finance receivables |
|
207 |
|
— |
|
207 |
|
— |
| ||||
|
Net intercompany borrowings |
|
— |
|
600 |
|
41 |
|
(641 |
)(6) | ||||
|
Investments and acquisitions (net of cash acquired) |
|
(8,184 |
) |
(8,184 |
) |
— |
|
— |
| ||||
|
Proceeds from sale of businesses and investments (net of cash sold) |
|
376 |
|
712 |
|
11 |
|
(347 |
)(9) | ||||
|
Proceeds from sale of available-for-sale securities |
|
247 |
|
13 |
|
234 |
|
— |
| ||||
|
Investments in available-for-sale securities |
|
(336 |
) |
(15 |
) |
(321 |
) |
— |
| ||||
|
Other - net |
|
(40 |
) |
(70 |
) |
26 |
|
4 |
(7) | ||||
|
Net cash provided by (used for) investing activities |
|
(11,427 |
) |
(9,331 |
) |
(2,945 |
) |
849 |
| ||||
|
Cash flow from financing activities: |
|
|
|
|
|
|
|
|
| ||||
|
Dividends paid |
|
(1,159 |
) |
(1,159 |
) |
(600 |
) |
600 |
(8) | ||||
|
Distribution to noncontrolling interests |
|
(3 |
) |
(3 |
) |
— |
|
— |
| ||||
|
Common stock issued, including treasury shares reissued |
|
123 |
|
123 |
|
4 |
|
(4 |
)(7) | ||||
|
Excess tax benefit from stock-based compensation |
|
189 |
|
189 |
|
— |
|
— |
| ||||
|
Acquisitions of noncontrolling interests |
|
(8 |
) |
(1 |
) |
(7 |
) |
— |
| ||||
|
Net intercompany borrowings |
|
— |
|
(41 |
) |
(600 |
) |
641 |
(6) | ||||
|
Proceeds from debt issued (original maturities greater than three months) |
|
15,460 |
|
4,587 |
|
10,873 |
|
— |
| ||||
|
Payments on debt (original maturities greater than three months) |
|
(10,593 |
) |
(2,269 |
) |
(8,324 |
) |
— |
| ||||
|
Short-term borrowings - net (original maturities three months or less) |
|
(43 |
) |
60 |
|
(103 |
) |
— |
| ||||
|
Net cash provided by (used for) financing activities |
|
3,966 |
|
1,486 |
|
1,243 |
|
1,237 |
| ||||
|
Effect of exchange rate changes on cash |
|
(84 |
) |
(123 |
) |
39 |
|
— |
| ||||
|
Increase (decrease) in cash and short-term investments |
|
(535 |
) |
4 |
|
(539 |
) |
— |
| ||||
|
Cash and short-term investments at beginning of period |
|
3,592 |
|
1,825 |
|
1,767 |
|
— |
| ||||
|
Cash and short-term investments at end of period |
|
$ |
3,057 |
|
$ |
1,829 |
|
$ |
1,228 |
|
$ |
— |
|
|
(1) |
Represents Caterpillar Inc. and its subsidiaries with Financial Products accounted for on the equity basis. |
|
(2) |
Elimination of Financial Products’ profit after tax due to equity method of accounting. |
|
(3) |
Elimination of Financial Products’ dividend to Machinery and Power Systems in excess of Financial Products’ profit. |
|
(4) |
Elimination of non-cash adjustments and changes in assets and liabilities related to consolidated reporting. |
|
(5) |
Reclassification of Cat Financial’s cash flow activity from investing to operating for receivables that arose from the sale of inventory. |
|
(6) |
Elimination of net proceeds and payments to/from Machinery and Power Systems and Financial Products. |
|
(7) |
Elimination of change in investment and common stock related to Financial Products. |
|
(8) |
Elimination of dividend from Financial Products to Machinery and Power Systems. |
|
(9) |
Elimination of proceeds received from Financial Products related to Machinery and Power Systems’ sale of Carter Machinery. |
Caterpillar Inc.
Supplemental Data for Cash Flow
For The Twelve Months Ended December 31, 2010
(Unaudited)
(Millions of dollars)
|
|
|
|
|
Supplemental Consolidating Data |
| ||||||||
|
|
|
|
|
Machinery |
|
|
|
|
| ||||
|
|
|
Consolidated |
|
and Power |
|
Financial |
|
Consolidating |
| ||||
|
Cash flow from operating activities: |
|
|
|
|
|
|
|
|
| ||||
|
Profit of consolidated and affiliated companies |
|
$ |
2,758 |
|
$ |
2,747 |
|
$ |
361 |
|
$ |
(350 |
)(2) |
|
Adjustments for non-cash items: |
|
|
|
|
|
|
|
|
| ||||
|
Depreciation and amortization |
|
2,296 |
|
1,573 |
|
723 |
|
— |
| ||||
|
Other |
|
469 |
|
457 |
|
(120 |
) |
132 |
(4) | ||||
|
Financial Products’ dividend in excess of profit |
|
— |
|
250 |
|
— |
|
(250 |
)(3) | ||||
|
Changes in assets and liabilities, net of acquisitions and divestitures: |
|
|
|
|
|
|
|
|
| ||||
|
Receivables - trade and other |
|
(2,320 |
) |
(1,264 |
) |
44 |
|
(1,100 |
)(4),(5) | ||||
|
Inventories |
|
(2,667 |
) |
(2,665 |
) |
— |
|
(2 |
)(4) | ||||
|
Accounts payable |
|
2,570 |
|
2,533 |
|
(25 |
) |
62 |
(4) | ||||
|
Accrued expenses |
|
117 |
|
98 |
|
4 |
|
15 |
(4) | ||||
|
Accrued wages, salaries and employee benefits |
|
847 |
|
826 |
|
21 |
|
— |
| ||||
|
Customer advances |
|
604 |
|
604 |
|
— |
|
— |
| ||||
|
Other assets - net |
|
358 |
|
316 |
|
(30 |
) |
72 |
(4) | ||||
|
Other liabilities - net |
|
(23 |
) |
163 |
|
(100 |
) |
(86 |
)(4) | ||||
|
Net cash provided by (used for) operating activities |
|
5,009 |
|
5,638 |
|
878 |
|
(1,507 |
) | ||||
|
Cash flow from investing activities: |
|
|
|
|
|
|
|
|
| ||||
|
Capital expenditures - excluding equipment leased to others |
|
(1,575 |
) |
(1,579 |
) |
(7 |
) |
11 |
(4) | ||||
|
Expenditures for equipment leased to others |
|
(1,011 |
) |
(84 |
) |
(985 |
) |
58 |
(4) | ||||
|
Proceeds from disposals of leased assets and property, plant and equipment |
|
1,469 |
|
145 |
|
1,376 |
|
(52 |
)(4) | ||||
|
Additions to finance receivables |
|
(8,498 |
) |
— |
|
(28,320 |
) |
19,822 |
(5) | ||||
|
Collections of finance receivables |
|
8,987 |
|
— |
|
27,919 |
|
(18,932 |
)(5) | ||||
|
Proceeds from sale of finance receivables |
|
16 |
|
— |
|
16 |
|
— |
| ||||
|
Net intercompany borrowings |
|
— |
|
(574 |
) |
931 |
|
(357 |
)(6) | ||||
|
Investments and acquisitions (net of cash acquired) |
|
(1,126 |
) |
(1,093 |
) |
(33 |
) |
— |
| ||||
|
Proceeds from sale of available-for-sale securities |
|
228 |
|
10 |
|
218 |
|
— |
| ||||
|
Investments in available-for-sale securities |
|
(217 |
) |
(12 |
) |
(205 |
) |
— |
| ||||
|
Other - net |
|
132 |
|
7 |
|
105 |
|
20 |
(7) | ||||
|
Net cash provided by (used for) investing activities |
|
(1,595 |
) |
(3,180 |
) |
1,015 |
|
570 |
| ||||
|
Cash flow from financing activities: |
|
|
|
|
|
|
|
|
| ||||
|
Dividends paid |
|
(1,084 |
) |
(1,084 |
) |
(600 |
) |
600 |
(8) | ||||
|
Common stock issued, including treasury shares reissued |
|
296 |
|
296 |
|
20 |
|
(20 |
)(7) | ||||
|
Excess tax benefit from stock-based compensation |
|
153 |
|
153 |
|
— |
|
— |
| ||||
|
Acquisitions of noncontrolling interests |
|
(132 |
) |
(132 |
) |
— |
|
— |
| ||||
|
Net intercompany borrowings |
|
— |
|
(931 |
) |
574 |
|
357 |
(6) | ||||
|
Proceeds from debt issued (original maturities greater than three months) |
|
8,324 |
|
216 |
|
8,108 |
|
— |
| ||||
|
Payments on debt (original maturities greater than three months) |
|
(12,461 |
) |
(1,298 |
) |
(11,163 |
) |
— |
| ||||
|
Short-term borrowings - net (original maturities three months or less) |
|
291 |
|
(78 |
) |
369 |
|
— |
| ||||
|
Net cash provided by (used for) financing activities |
|
(4,613 |
) |
(2,858 |
) |
(2,692 |
) |
937 |
| ||||
|
Effect of exchange rate changes on cash |
|
(76 |
) |
(14 |
) |
(62 |
) |
— |
| ||||
|
Increase (decrease) in cash and short-term investments |
|
(1,275 |
) |
(414 |
) |
(861 |
) |
— |
| ||||
|
Cash and short-term investments at beginning of period |
|
4,867 |
|
2,239 |
|
2,628 |
|
— |
| ||||
|
Cash and short-term investments at end of period |
|
$ |
3,592 |
|
$ |
1,825 |
|
$ |
1,767 |
|
$ |
— |
|
|
(1) |
Represents Caterpillar Inc. and its subsidiaries with Financial Products accounted for on the equity basis. |
|
(2) |
Elimination of Financial Products’ profit after tax due to equity method of accounting. |
|
(3) |
Elimination of Financial Products’ dividend to Machinery and Power Systems in excess of Financial Products’ profit. |
|
(4) |
Elimination of non-cash adjustments and changes in assets and liabilities related to consolidated reporting. |
|
(5) |
Reclassification of Cat Financial’s cash flow activity from investing to operating for receivables that arose from the sale of inventory. |
|
(6) |
Elimination of net proceeds and payments to/from Machinery and Power Systems and Financial Products. |
|
(7) |
Elimination of change in investment and common stock related to Financial Products. |
|
(8) |
Elimination of dividend from Financial Products to Machinery and Power Systems. |
#
Caterpillar Public Release