Attached files
| file | filename |
|---|---|
| 8-K - POLARIS INDUSTRIES INC. 8-K - Polaris Inc. | a50144583.htm |
| EX-99.1 - EXHIBIT 99.1 - Polaris Inc. | a50144583ex99-1.htm |
Exhibit 99.2

Fourth Quarter & Full Year
2011 Earnings Results January 25, 2012 Safe Harbor Safe Harbor Except
for historical information contained herein, the matters set forth in
this document, including but not limited to management’s expectations
regarding 2012 sales, shipments, net income, cash flow, and
manufacturing realignment transition costs and savings, are
forward-looking statements that involve certain risks and uncertainties
that could cause actual results to differ materially from those
forward-looking statements. Potential risks and uncertainties include
such factors as product offerings, promotional activities and pricing
strategies by competitors; manufacturing realignment transition costs;
acquisition integration costs; warranty expenses; impact of changes in
Polaris stock prices on incentive compensation; foreign currency
exchange rate fluctuations; environmental and product safety regulatory
activity; effects of weather; commodity costs; uninsured product
liability claims; uncertainty in the retail and wholesale credit
markets; changes in tax policy and overall economic conditions,
including inflation, consumer confidence and spending and relationships
with dealers and suppliers. Investors are also directed to consider
other risks and uncertainties discussed in our 2010 annual report and
Form 10-K filed by the Company with the Securities and Exchange
Commission. The Company does not undertake any duty to any person to
provide updates to its forward-looking statements. The data source for
retail sales figures included in this presentation is registration
information provided by Polaris dealers in North America and compiled by
the Company or Company estimates. The Company must rely on information
that its dealers supply concerning retail sales, and other retail sales
data sources and this information is subject to revision. Note: Shares
and per share information have been adjusted to give effect to the
two-for-one stock split declared on July 20, 2011, payable on September
12, 2011 to shareholders of record on September 2, 2011. January 2012
Scott Wine CEO Fourth Quarter & Full Year 2011 Earnings Results
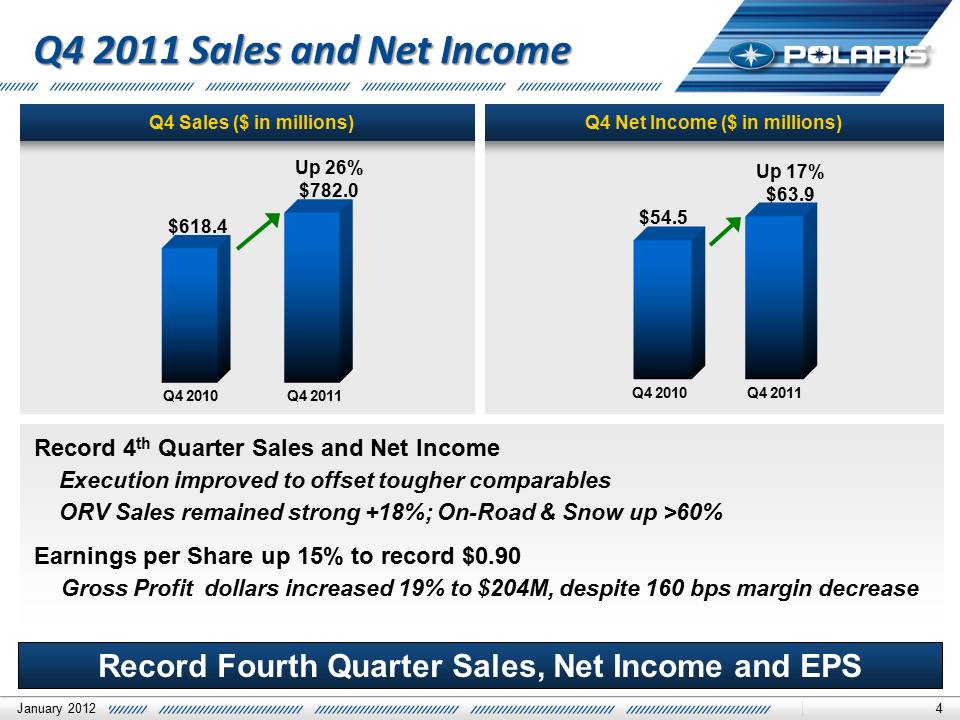
January 25, 2012 4 Q4 Net Income ($ in millions) Q4 Sales ($ in
millions) $54.5 Up 17% $63.9 Q4 2011 Q4 2010 Q4 2011 Q4 2010 Record 4th
Quarter Sales and Net Income Execution improved to offset tougher
comparables ORV Sales remained strong +18%; On-Road & Snow up >60%
Earnings per Share up 15% to record $0.90 Gross Profit dollars increased
19% to $204M, despite 160 bps margin decrease January 2012 Record Fourth
Quarter Sales, Net Income and EPS Up 26% $782.0 $618.4 Focused,
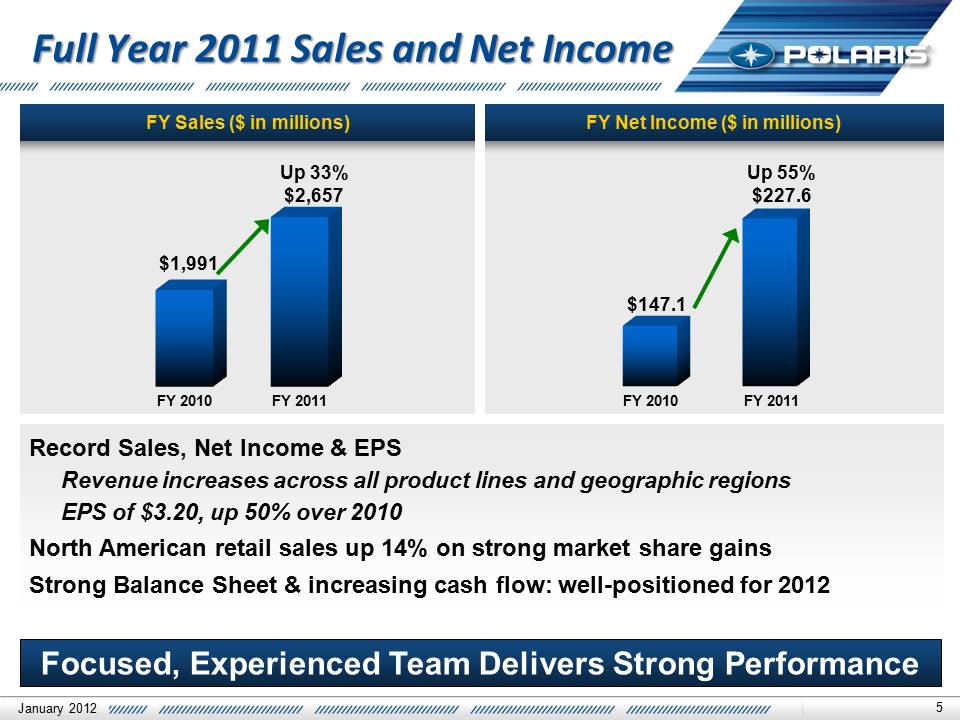
Experienced Team Delivers Strong Performance Full Year 2011 Sales and
Net Income Full Year 2011 Sales and Net Income FY Net Income ($ in
millions) FY Sales ($ in millions) $147.1 Up 55% $227.6 $1,991 Up 33%
$2,657 January 2012 FY 2011 FY 2010 FY 2011 FY 2010 Record Sales, Net
Income & EPS Revenue increases across all product lines and geographic
regions EPS of $3.20, up 50% over 2010 North American retail sales up
14% on strong market share gains Strong Balance Sheet & increasing cash
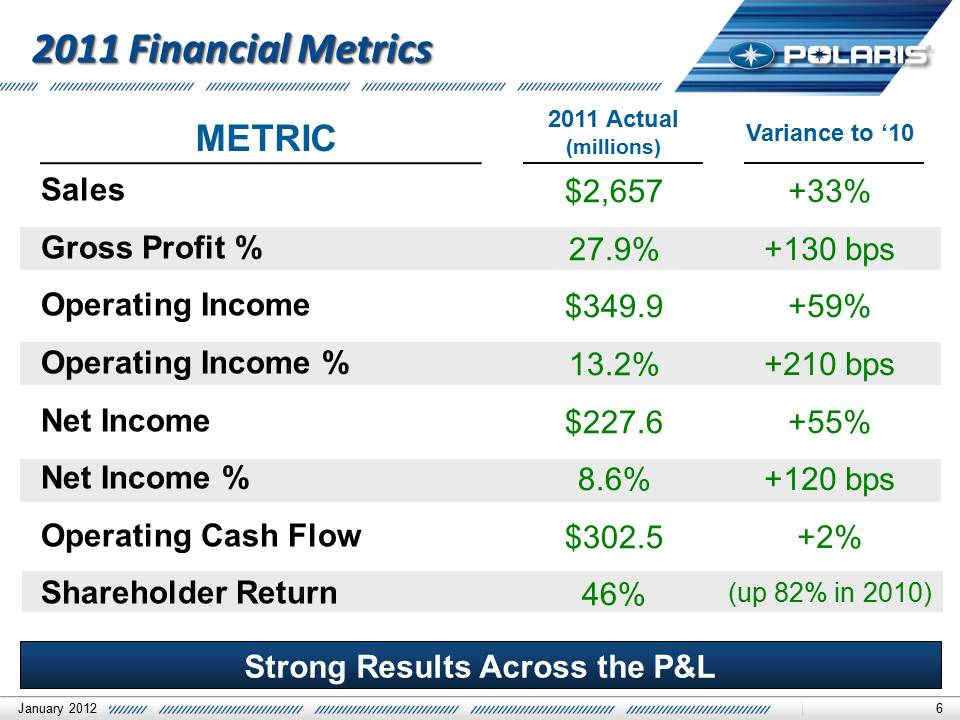
flow: well-positioned for 2012 6 Sales Gross Profit % Operating Income
Operating Income % Net Income Net Income % Operating Cash Flow
Shareholder Return $2,657 27.9% $349.9 13.2% $227.6 8.6% $302.5 46%
METRIC 2011 Actual (millions) January 2012 Variance to ‘10 +33% +130 bps
+59% +210 bps +55% +120 bps +2% (up 82% in 2010) Strong Results Across
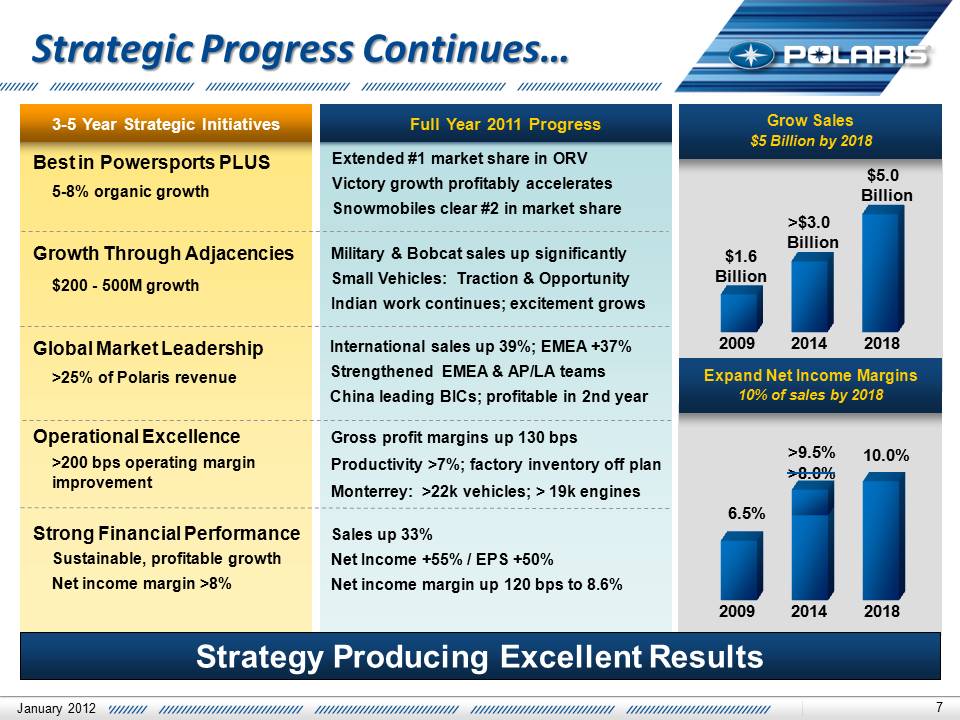
the P&L Strategic Progress Continues… Grow Sales $5 Billion by 2018
Expand Net Income Margins 10% of sales by 2018 Strategy Producing
Excellent Results Full Year 2011 Progress 3-5 Year Strategic Initiatives
Best in Powersports PLUS 5-8% organic growth Growth Through Adjacencies
$200 - 500M growth Global Market Leadership >25% of Polaris revenue
Operational Excellence >200 bps operating margin improvement Strong
Financial Performance Sustainable, profitable growth Net income margin
>8% Extended #1 market share in ORV Victory growth profitably
accelerates Snowmobiles clear #2 in market share Military & Bobcat sales
up significantly Small Vehicles: Traction & Opportunity Indian work
continues; excitement grows January 2012 7 Gross profit margins up 130
bps Productivity >7%; factory inventory off plan Monterrey: >22k
vehicles; > 19k engines Sales up 33% Net Income +55% / EPS +50% Net
income margin up 120 bps to 8.6% International sales up 39%; EMEA +37%
Strengthened EMEA & AP/LA teams China leading BICs; profitable in 2nd
year $1.6 Billion $5.0 Billion >$3.0 Billion 2009 2014 2018 2009 2014
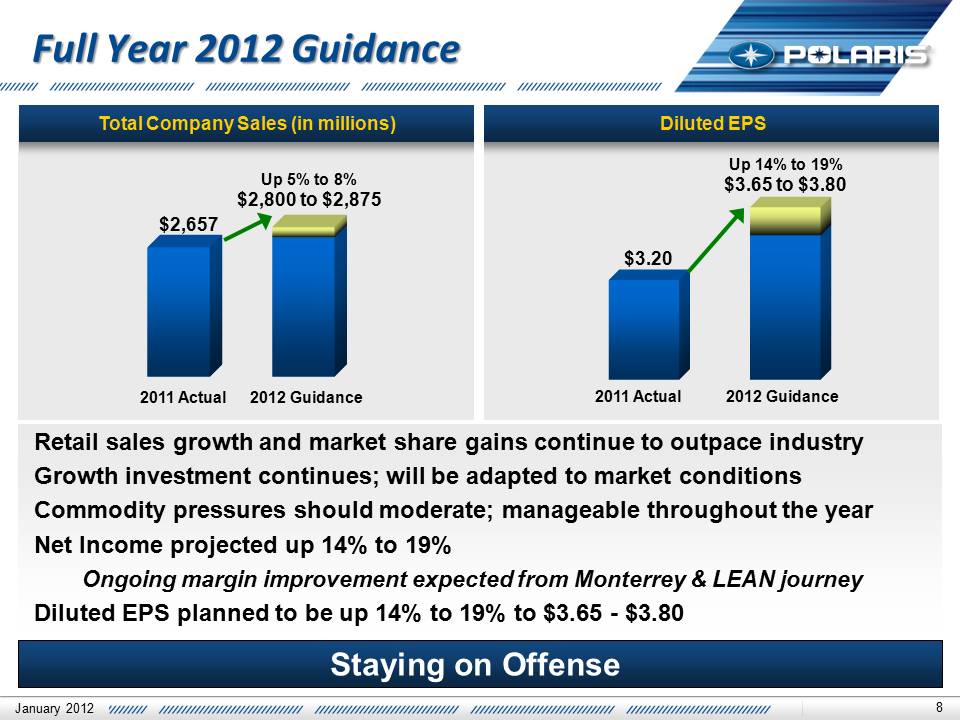
2018 6.5% 10.0% >9.5% >8.0% Total Company Sales (in millions) Diluted
EPS Full Year 2012 Guidance Full Year 2012 Guidance $2,657 Up 5% to 8%
$2,800 to $2,875 2011 Actual 2012 Guidance $3.20 Up 14% to 19% $3.65 to
$3.80 Staying on Offense Retail sales growth and market share gains
continue to outpace industry Growth investment continues; will be
adapted to market conditions Commodity pressures should moderate;
manageable throughout the year Net Income projected up 14% to 19%
Ongoing margin improvement expected from Monterrey & LEAN journey
Diluted EPS planned to be up 14% to 19% to $3.65 - $3.80 January 2012 8
2011 Actual 2012 Guidance Bennett Morgan President & COO Bennett
Morgan President & COO Fourth Quarter & Full Year 2011 Earnings Results
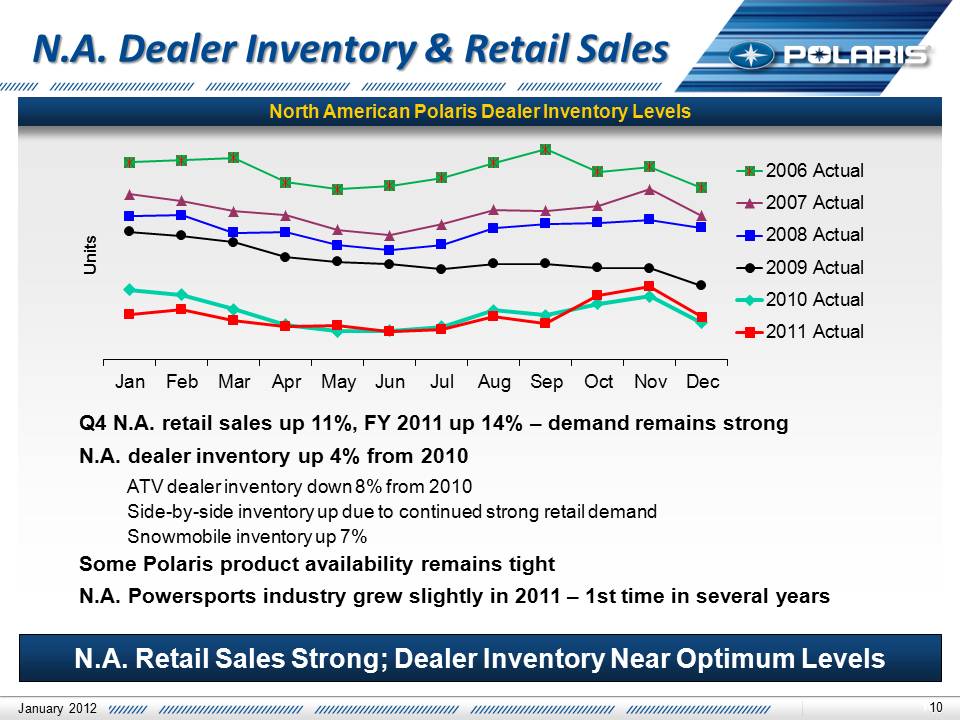
January 25, 2012 North American Polaris Dealer Inventory Levels 10 N.A.
Dealer Inventory & Retail Sales N.A. Dealer Inventory & Retail Sales Q4
N.A. retail sales up 11%, FY 2011 up 14% – demand remains strong N.A.
dealer inventory up 4% from 2010 ATV dealer inventory down 8% from 2010
Side-by-side inventory up due to continued strong retail demand
Snowmobile inventory up 7% Some Polaris product availability remains
tight N.A. Powersports industry grew slightly in 2011 – 1st time in
several years N.A. Retail Sales Strong; Dealer Inventory Near Optimum
Levels 10 Jan Feb Mar Apr May Jun Jul Aug Sep Oct Nov Dec Units 2006
Actual 2007 Actual 2008 Actual 2009 Actual 2010 Actual 2011 Actual
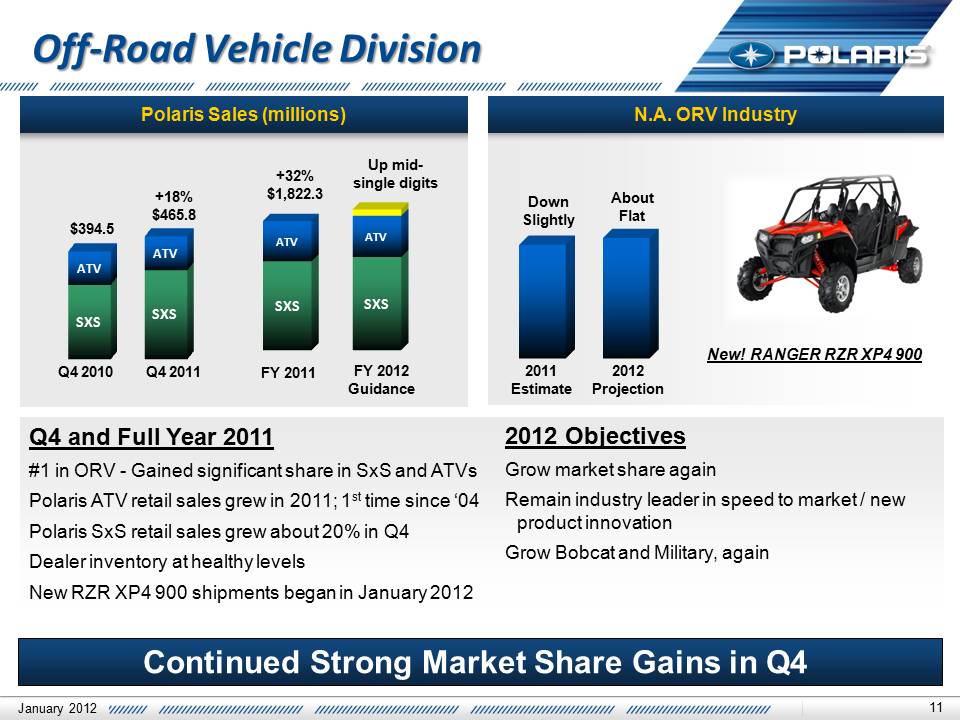
January 2012 Off-Road Vehicle Division Off-Road Vehicle Division New!
RANGER RZR XP4 900 Polaris Sales (millions) SXS SXS ATV ATV SXS SXS ATV
ATV FY 2012 Guidance FY 2011 Q4 2011 Q4 2010 $394.5 +32% $1,822.3 +18%
$465.8 Up mid- single digits January 2012 Q4 and Full Year 2011 #1 in
ORV - Gained significant share in SxS and ATVs Polaris ATV retail sales
grew in 2011; 1st time since ‘04 Polaris SxS retail sales grew about 20%
in Q4 Dealer inventory at healthy levels New RZR XP4 900 shipments began
in January 2012 2012 Objectives Grow market share again Remain industry
leader in speed to market / new product innovation Grow Bobcat and
Military, again 2012 Projection 2011 Estimate Down Slightly About Flat
Continued Strong Market Share Gains in Q4 Polaris Sales (millions) N.A.
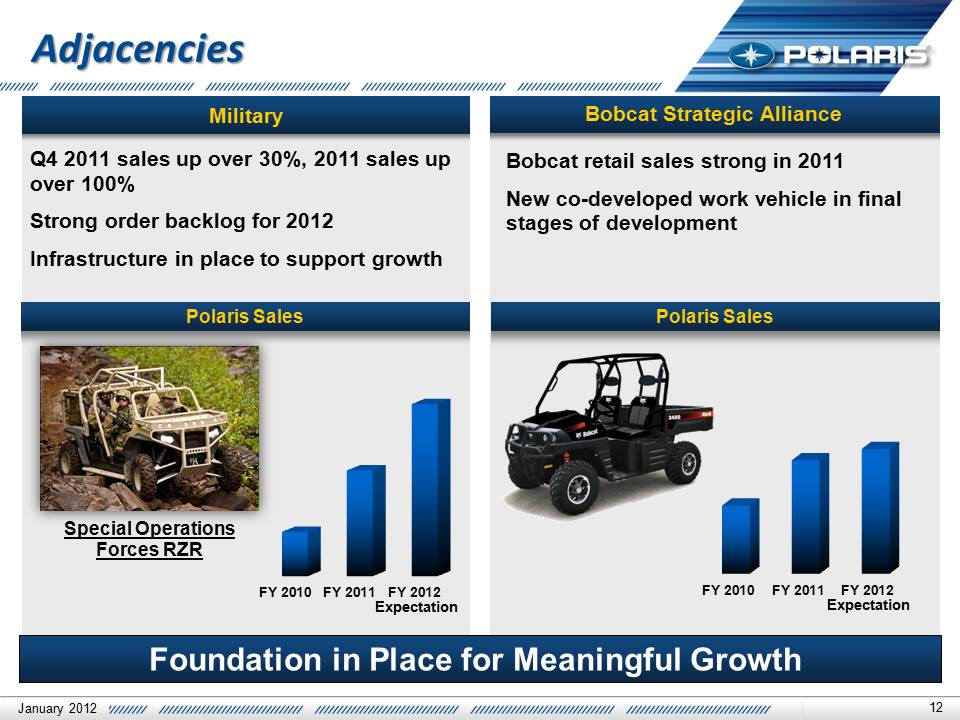
ORV Industry Bobcat retail sales strong in 2011 New co-developed work
vehicle in final stages of development Adjacencies Adjacencies Bobcat
Strategic Alliance Military January 2012 Q4 2011 sales up over 30%, 2011
sales up over 100% Strong order backlog for 2012 Infrastructure in place
to support growth Foundation in Place for Meaningful Growth FY 2010 FY
2011 FY 2012 FY 2010 FY 2011 FY 2012 Expectation Expectation Polaris
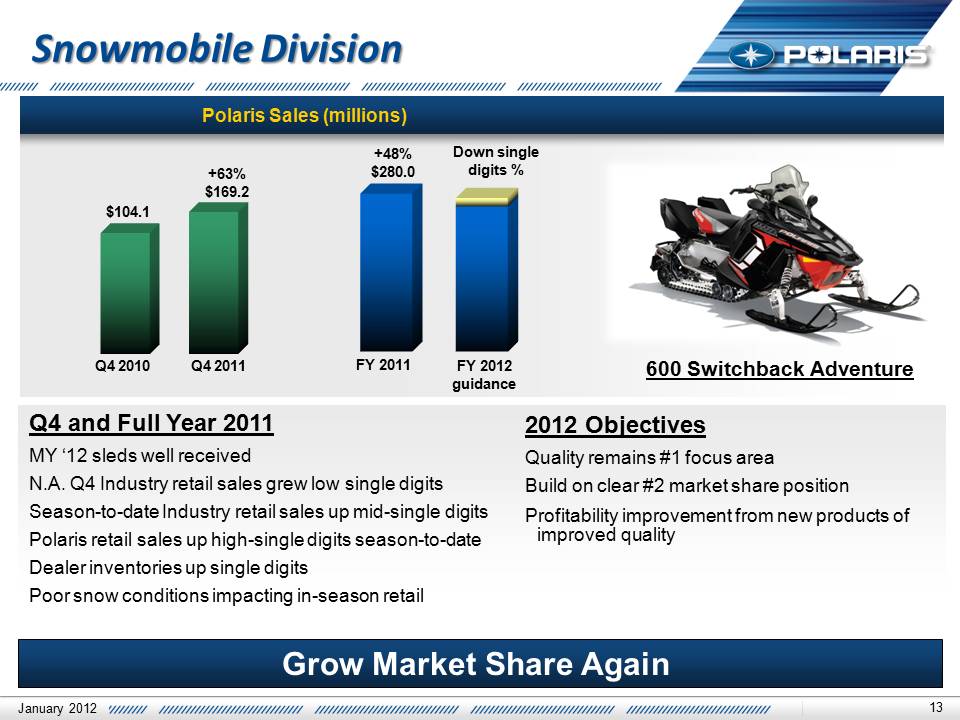
Sales Polaris Sales Special Operations Forces RZR Snowmobile Division
Snowmobile Division $104.1 +63% $169.2 FY 2012 guidance +48% $280.0 Down
single digits % FY 2011 Q4 2011 Q4 2010 Polaris Sales (millions) January
2012 Q4 and Full Year 2011 MY ‘12 sleds well received N.A. Q4 Industry
retail sales grew low single digits Season-to-date Industry retail sales
up mid-single digits Polaris retail sales up high-single digits
season-to-date Dealer inventories up single digits Poor snow conditions
impacting in-season retail 2012 Objectives Quality remains #1 focus area
Build on clear #2 market share position Profitability improvement from
new products of improved quality Grow Market Share Again 600 Switchback
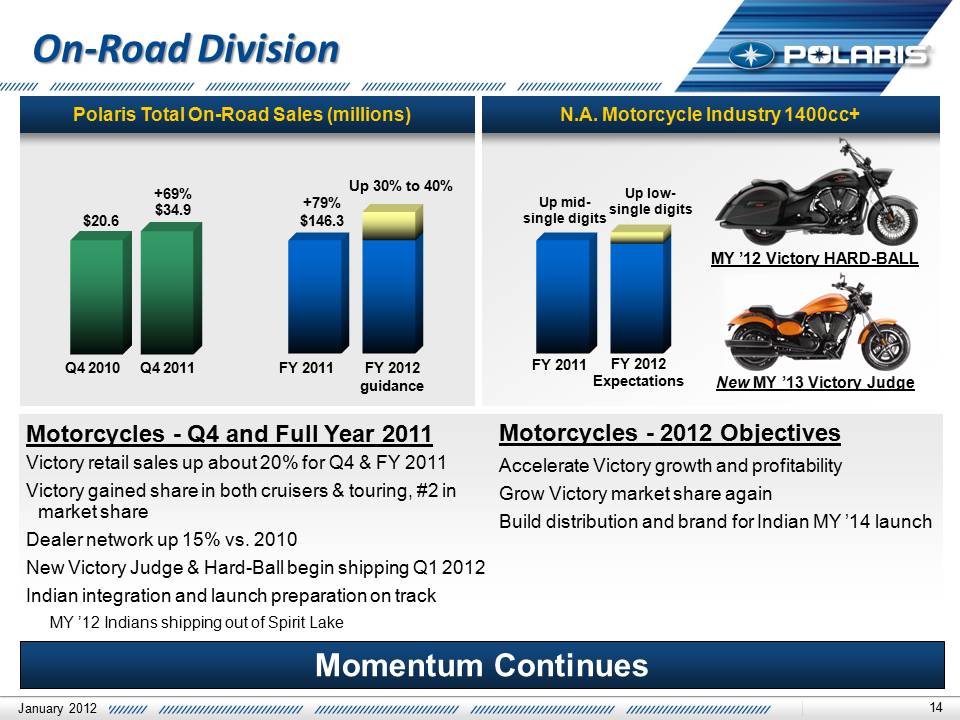
Adventure Momentum Continues Polaris Total On-Road Sales (millions)
On-Road Division On-Road Division $20.6 +69% $34.9 +79% $146.3 Up 30% to
40% FY 2012 guidance FY 2011 Q4 2011 Q4 2010 January 2012 Motorcycles -
Q4 and Full Year 2011 Victory retail sales up about 20% for Q4 & FY 2011
Victory gained share in both cruisers & touring, #2 in market share
Dealer network up 15% vs. 2010 New Victory Judge & Hard-Ball begin
shipping Q1 2012 Indian integration and launch preparation on track MY
’12 Indians shipping out of Spirit Lake Motorcycles - 2012 Objectives
Accelerate Victory growth and profitability Grow Victory market share
again Build distribution and brand for Indian MY ’14 launch New MY ’13
Victory Judge Up mid- single digits FY 2011 Up low- single digits FY
2012 Expectations MY ’12 Victory HARD-BALL N.A. Motorcycle Industry
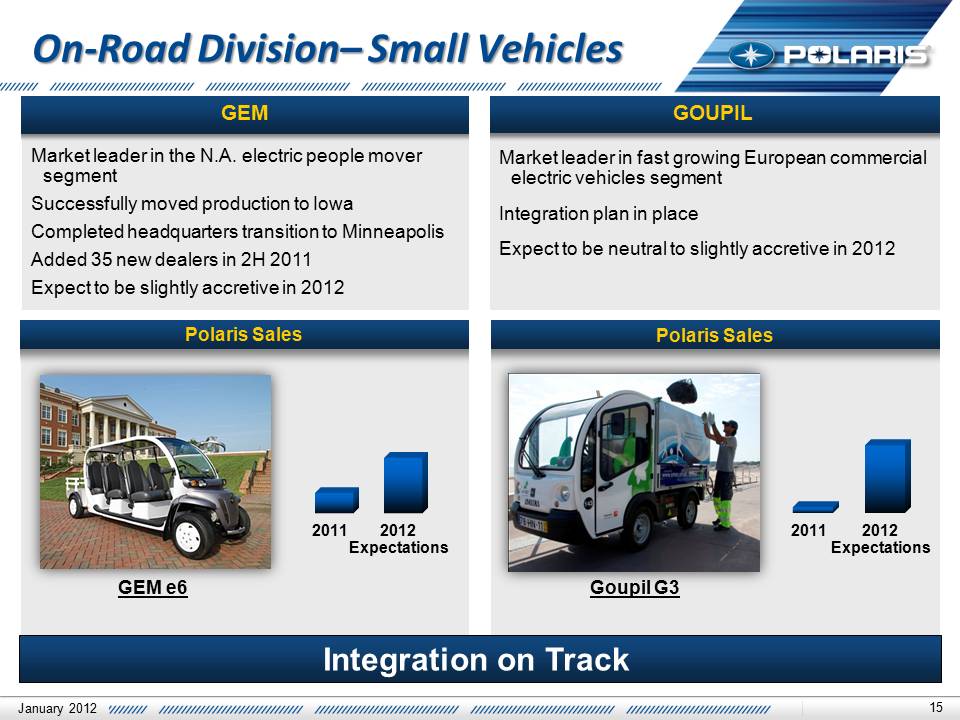
1400cc+ Market leader in the N.A. electric people mover segment
Successfully moved production to Iowa Completed headquarters transition
to Minneapolis Added 35 new dealers in 2H 2011 Expect to be slightly
accretive in 2012 15 Market leader in fast growing European commercial
electric vehicles segment Integration plan in place Expect to be neutral
to slightly accretive in 2012 On-Road Division– Small Vehicles On-Road
Division– Small Vehicles GOUPIL GEM January 2012 Integration on Track
Polaris Sales Polaris Sales GEM e6 2011 2012 2011 2012 Goupil G3
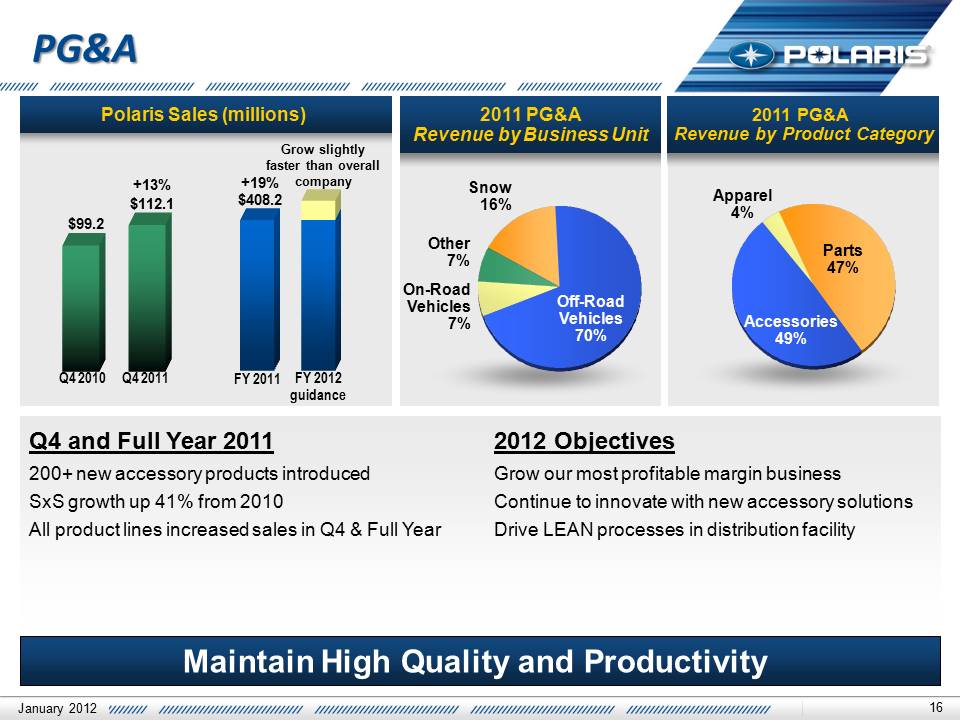
Expectations Expectations PG&A PG&A 2011 PG&A Revenue by Product
Category Maintain High Quality and Productivity Polaris Sales (millions)
2011 PG&A Revenue by Business Unit Other 7% Snow 16% Off-Road Vehicles
70% Parts 47% Accessories 49% Apparel 4% On-Road Vehicles 7% $99.2 +13%
$112.1 FY 2012 guidance FY 2011 Q4 2011 Q4 2010 +19% $408.2 January 2012
Q4 and Full Year 2011 200+ new accessory products introduced SxS growth
up 41% from 2010 All product lines increased sales in Q4 & Full Year
2012 Objectives Grow our most profitable margin business Continue to
innovate with new accessory solutions Drive LEAN processes in
distribution facility Grow slightly faster than overall company
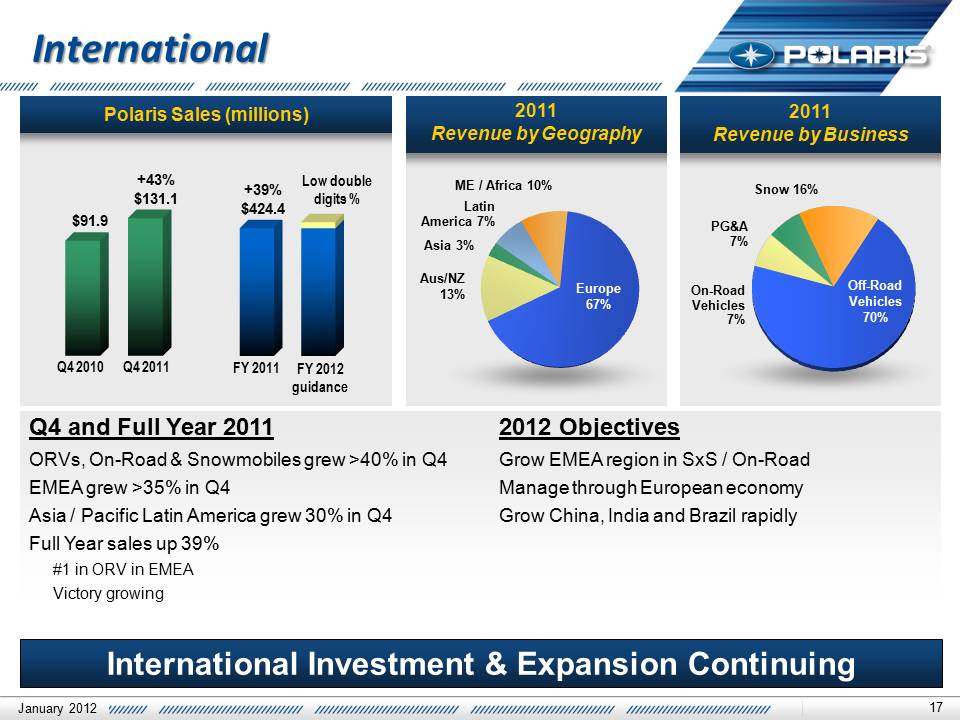
International Investment & Expansion Continuing International
International $91.9 +43% $131.1 +39% $424.4 Polaris Sales (millions)
2011 Revenue by Geography 2011 Revenue by Business FY 2012 guidance FY
2011 Q4 2011 Q4 2010 ME / Africa 10% Latin America 7% Asia 3% Aus/NZ 13%
Europe 67% Off-Road Vehicles 70% On-Road Vehicles 7% PG&A 7% Snow 16%
January 2012 Q4 and Full Year 2011 ORVs, On-Road & Snowmobiles grew >40%
in Q4 EMEA grew >35% in Q4 Asia / Pacific Latin America grew 30% in Q4
Full Year sales up 39% #1 in ORV in EMEA Victory growing 2012 Objectives
Grow EMEA region in SxS / On-Road Manage through European economy Grow
China, India and Brazil rapidly Low double digits % Operational
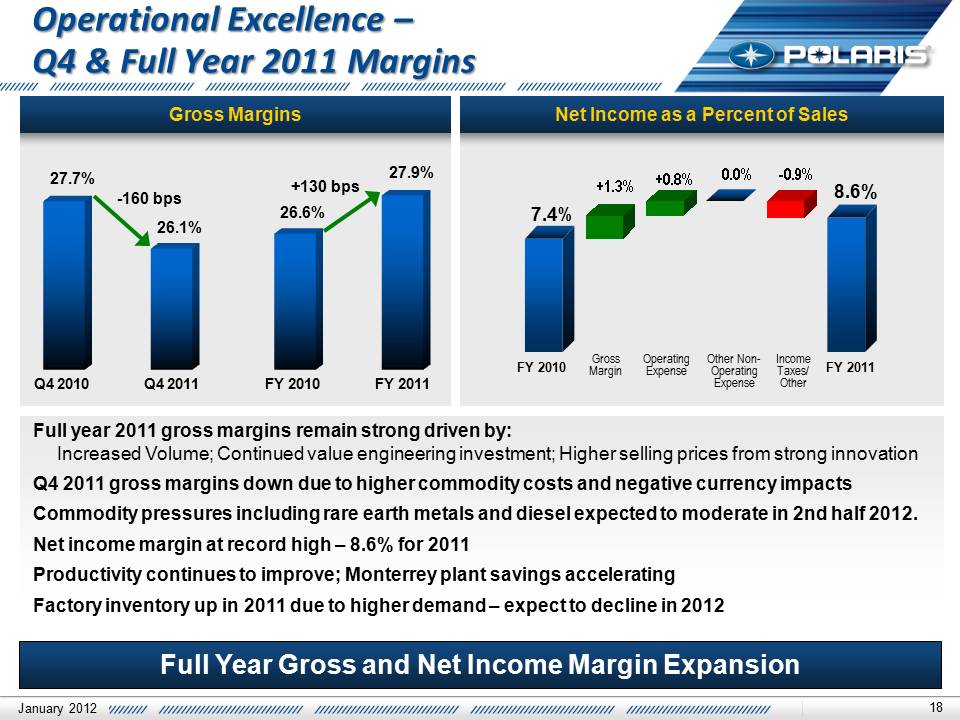
Excellence – Q4 & Full Year 2011 Margins Operational Excellence – Q4 &
Full Year 2011 Margins Net Income as a Percent of Sales Gross Margins Q4
2010 Q4 2011 +1.3%+0.8%0.0%-0.9% Gross Margin Operating Expense Other
Non- Operating Expense Income Taxes/ Other FY 2010 FY 2011 27.7% 26.1%
7.4% 8.6% -160 bps Full year 2011 gross margins remain strong driven by:
Increased Volume; Continued value engineering investment; Higher selling
prices from strong innovation Q4 2011 gross margins down due to higher
commodity costs and negative currency impacts Commodity pressures
including rare earth metals and diesel expected to moderate in 2nd half
2012. Net income margin at record high – 8.6% for 2011 Productivity
continues to improve; Monterrey plant savings accelerating Factory
inventory up in 2011 due to higher demand – expect to decline in 2012
Full Year Gross and Net Income Margin Expansion FY 2010 FY 2011 26.6%
27.9% +130 bps January 2012 Mike Malone V.P. Finance & CFO Fourth
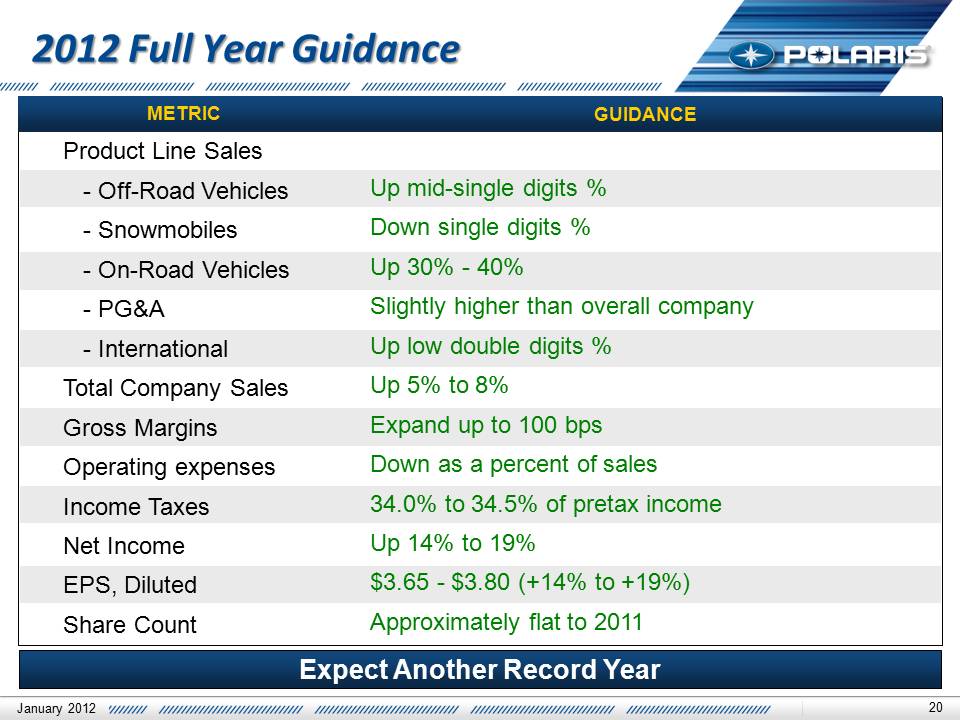
Quarter 2011 Earnings Results January 25, 2012 2012 Full Year Guidance
Product Line Sales - Off-Road Vehicles - Snowmobiles - On-Road Vehicles
- PG&A - International Total Company Sales Gross Margins Operating
expenses Income Taxes Net Income EPS, Diluted Share Count Up mid-single
digits % Down single digits % Up 30% - 40% Slightly higher than overall
company Up low double digits % Up 5% to 8% Expand up to 100 bps Down as
a percent of sales 34.0% to 34.5% of pretax income Up 14% to 19% $3.65 -
$3.80 (+14% to +19%) Approximately flat to 2011 METRIC GUIDANCE Expect
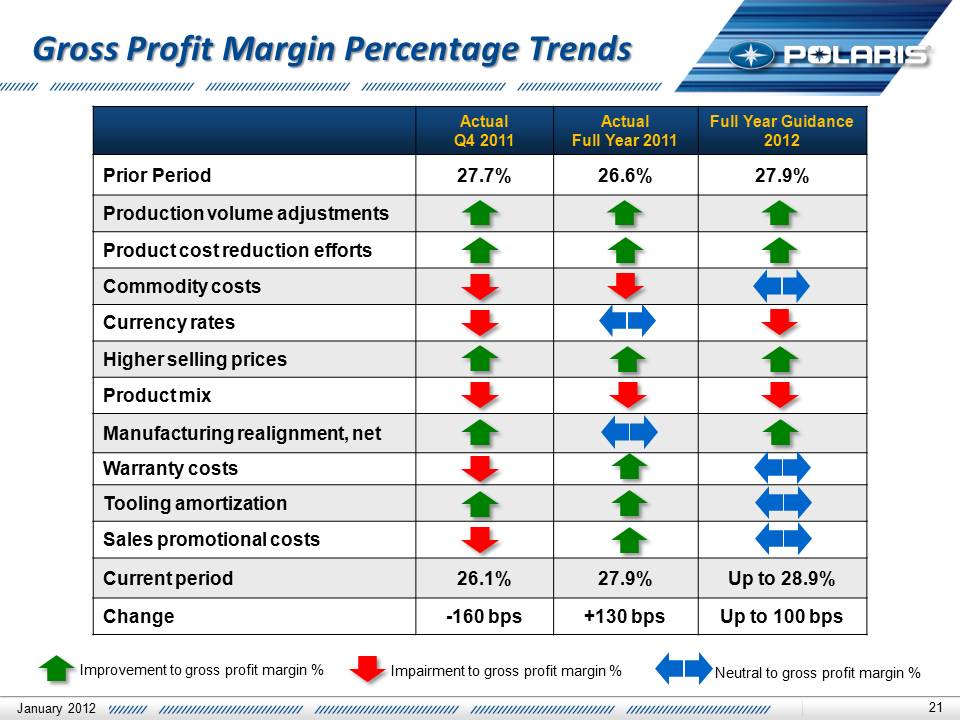
Another Record Year 20 January 2012 Actual Q4 2011 Actual Full Year
2011 Full Year Guidance 2012 Prior Period 27.7% 26.6% 27.9% Production
volume adjustments Product cost reduction efforts Commodity costs
Currency rates Higher selling prices Product mix Manufacturing
realignment, net Warranty costs Tooling amortization Sales promotional
costs Current period 26.1% 27.9% Up to 28.9% Change -160 bps +130 bps Up
to 100 bps Gross Profit Margin Percentage Trends Gross Profit Margin
Percentage Trends Improvement to gross profit margin % Impairment to
gross profit margin % Neutral to gross profit margin % January 2012
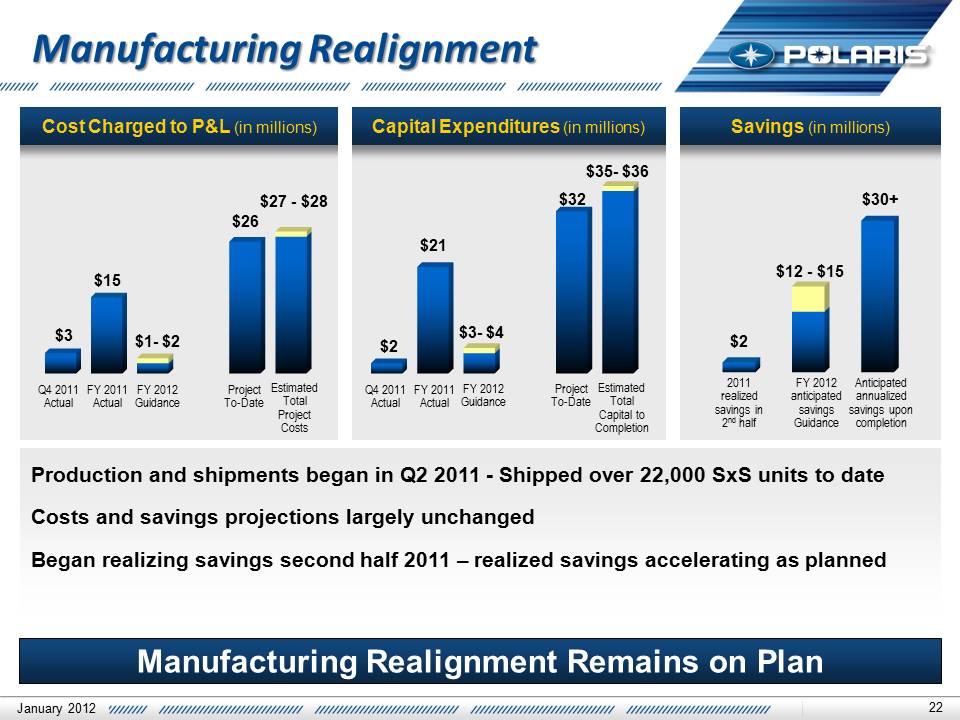
Manufacturing Realignment Production and shipments began in Q2 2011 -
Shipped over 22,000 SxS units to date Costs and savings projections
largely unchanged Began realizing savings second half 2011 – realized
savings accelerating as planned Manufacturing Realignment Remains on
Plan Cost Charged to P&L (in millions) Savings (in millions) Anticipated
annualized savings upon completion 2011 realized savings in 2nd half
$30+ FY 2012 anticipated savings Guidance January 2012 Capital
Expenditures (in millions) $2 $32 Estimated Total Capital to Completion
FY 2011 Actual FY 2012 Guidance Project To-Date Q4 2011 Actual $3 $26
Estimated Total Project Costs FY 2011 Actual FY 2012 Guidance Project
To-Date Q4 2011 Actual 22 $21 $27 - $28 $15 $12 - $15 $3- $4 $2 $1- $2
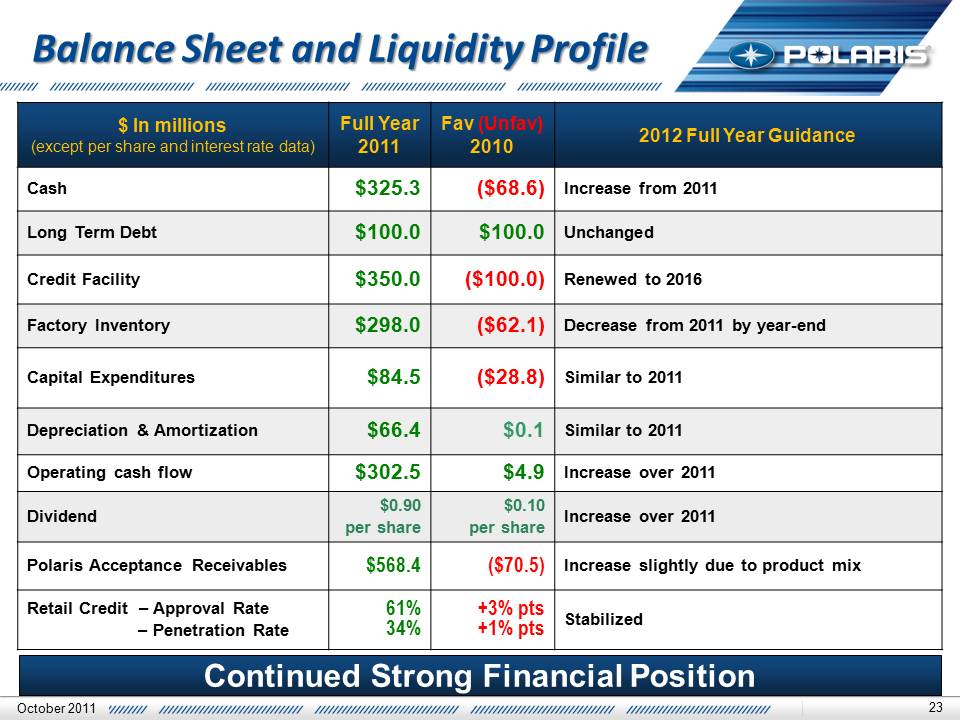
$35- $36 Balance Sheet and Liquidity Profile Balance Sheet and Liquidity
Profile $ In millions (except per share and interest rate data) Full
Year 2011 Fav (Unfav) 2010 2012 Full Year Guidance Cash $325.3 ($68.6)
Increase from 2011 Long Term Debt $100.0 $100.0 Unchanged Credit
Facility $350.0 ($100.0) Renewed to 2016 Factory Inventory $298.0
($62.1) Decrease from 2011 by year-end Capital Expenditures $84.5
($28.8) Similar to 2011 Depreciation & Amortization $66.4 $0.1 Similar
to 2011 Operating cash flow $302.5 $4.9 Increase over 2011 Dividend
$0.90 per share $0.10 per share Increase over 2011 Polaris Acceptance
Receivables $568.4 ($70.5) Increase slightly due to product mix Retail
Credit – Approval Rate – Penetration Rate 61% 34% +3% pts +1% pts
Stabilized October 2011 Continued Strong Financial Position Scott Wine
CEO Fourth Quarter & Full Year 2011 Earnings Results January 25, 2012
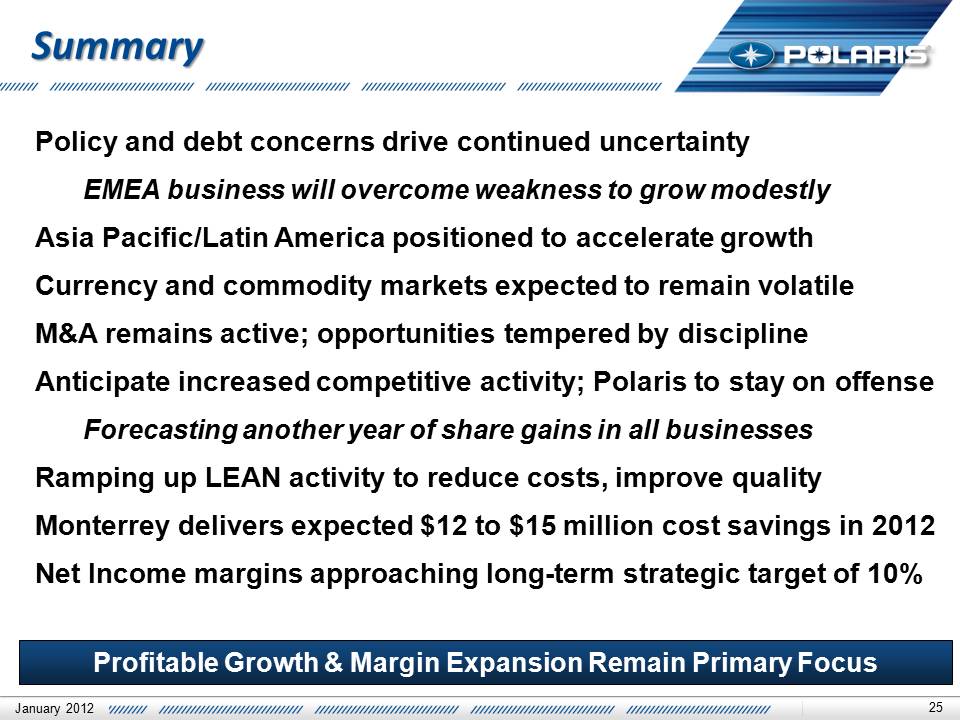
Summary Policy and debt concerns drive continued uncertainty EMEA
business will overcome weakness to grow modestly Asia Pacific/Latin
America positioned to accelerate growth Currency and commodity markets
expected to remain volatile M&A remains active; opportunities tempered
by discipline Anticipate increased competitive activity; Polaris to stay
on offense Forecasting another year of share gains in all businesses
Ramping up LEAN activity to reduce costs, improve quality Monterrey
delivers expected $12 to $15 million cost savings in 2012 Net Income
margins approaching long-term strategic target of 10% 25 Profitable
Growth & Margin Expansion Remain Primary Focus January 2012 26 Thank
you. Q & A