Attached files
| file | filename |
|---|---|
| 8-K - FORM 8-K - OCCIDENTAL PETROLEUM CORP /DE/ | form8k-20120125.htm |
| EX-99.1 - EXHIBIT 99.1 - OCCIDENTAL PETROLEUM CORP /DE/ | ex99_1-20120125.htm |
| EX-99.5 - EXHIBIT 99.5 - OCCIDENTAL PETROLEUM CORP /DE/ | ex99_5-20120125.htm |
| EX-99.2 - EXHIBIT 99.2 - OCCIDENTAL PETROLEUM CORP /DE/ | ex99_2-20120125.htm |
| EX-99.3 - EXHIBIT 99.3 - OCCIDENTAL PETROLEUM CORP /DE/ | ex99_3-20120125.htm |
EXHIBIT 99.4
Occidental Petroleum Corporation
Fourth Quarter 2011 Earnings Conference Call
January 25, 2012
Fourth Quarter 2011 Earnings Conference Call
January 25, 2012
1

2
• Net Income - $1.6 Billion in 4Q11 vs. $1.2 Billion in 4Q10
– EPS $2.01 (diluted) vs. $1.49 in 4Q10.
• Consolidated pre-tax income from continuing
operations - $2.6 Billion in 4Q11 vs. $2.9 Billion in 3Q11
operations - $2.6 Billion in 4Q11 vs. $2.9 Billion in 3Q11
• 3Q11 EPS $2.18 (diluted after tax)
– Major items resulting in the difference between 3Q11
and 4Q11 income included:
and 4Q11 income included:
» higher oil volumes and prices, +$0.07 per share;
» lower 4Q chemical and midstream income, -$0.08 per share;
» higher equity-based compensation costs, -$0.05 per share;
» higher exploration expense, -$0.02 per share, and;
» higher 4Q operating costs, -$0.08 per share.
• 4Q11 EPS $2.02 (diluted after tax)
Fourth Quarter 2011 Earnings - Highlights
Fourth Quarter 2011 Earnings - Highlights
2
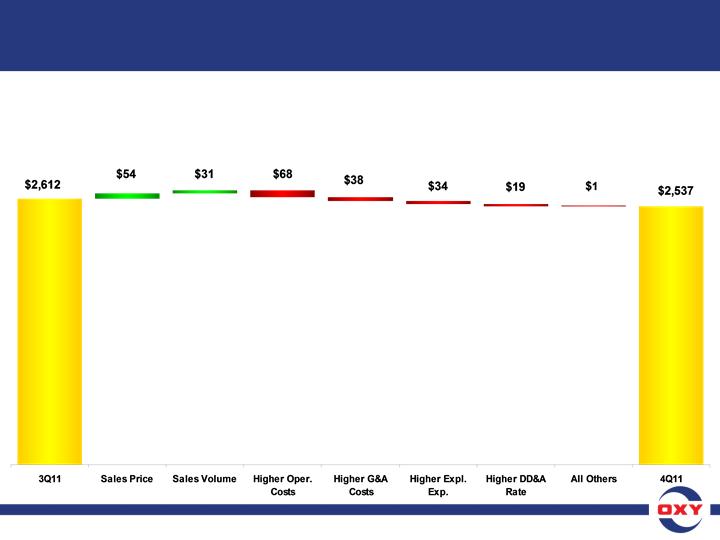
Fourth Quarter 2011 Earnings - Oil & Gas
Segment Variance Analysis - 4Q11 vs. 3Q11
Segment Variance Analysis - 4Q11 vs. 3Q11
($ in millions)
• Core Results for 4Q11 of $2.537 B vs. $2.612 B in 3Q11
– Higher oil volumes and prices, were offset by higher operating costs, higher
equity- based compensation costs, and higher exploration expense.
equity- based compensation costs, and higher exploration expense.
3

4
Fourth Quarter 2011 Earnings - Oil & Gas Segment
4Q11 3Q11
Reported Segment Earnings ($mm) $2,537 $2,612
WTI Oil Price ($/bbl) $94.06 $89.76
Brent Oil Price ($/bbl) $109.07 $112.22
NYMEX Gas Price ($/mcf) $3.68 $4.28
Oxy’s Realized Prices
Worldwide Oil ($/bbl) $99.62 $97.24
+ 2½% quarter-to-quarter
Worldwide NGLs ($/bbl) $55.25 $56.06
- 1½% quarter-to-quarter
US Natural Gas ($/mcf) $3.59 $4.23
- 15% quarter-to-quarter
4

5
4Q11 3Q11
Oil and Gas Production Volumes (mboe/d) 748 739
• Domestically, production was 449 mboe/d, representing the
highest ever domestic production volumes for the company,
compared to our guidance of 442 to 444 mboe/d.
highest ever domestic production volumes for the company,
compared to our guidance of 442 to 444 mboe/d.
• Our production rose by 13 mboe/d compared to 3Q11, with the
Permian and California contributing the bulk of the sequential
increase in our overall domestic production volumes.
Permian and California contributing the bulk of the sequential
increase in our overall domestic production volumes.
• Our better-than-expected 4Q11 domestic production reflected
the effect of the ramp up in capital spending as well as higher
levels of workover and well maintenance activity.
the effect of the ramp up in capital spending as well as higher
levels of workover and well maintenance activity.
• In addition, 4Q11 was relatively free of significant operational
disruptions, which also contributed to the better than expected
results.
disruptions, which also contributed to the better than expected
results.
Fourth Quarter 2011 Earnings - Oil & Gas Production
5

6
• Latin America volumes were 31 mboe/d.
– Colombia volumes increased slightly from 3Q11 while both periods
included pipeline interruptions caused by insurgent activity.
included pipeline interruptions caused by insurgent activity.
• In the Middle East region:
– We recorded 1 mboe/d production in Libya.
– In Iraq, we produced 9 mboe/d, an increase of 5 mboe/d from 3Q11 volumes.
The higher volume is the result of higher spending levels.
The higher volume is the result of higher spending levels.
– Yemen production was 23 mboe/d, a decrease of 5 mboe/d from 3Q11.
The decrease reflected the timing of cost recovery and the expiration of the
Masila Field contract in mid-December.
The decrease reflected the timing of cost recovery and the expiration of the
Masila Field contract in mid-December.
– In Oman, 4Q11 production was 76 mboe/d, a decrease of 3 mboe/d from 3Q11
volumes. The decrease was attributable to down time from operational issues.
volumes. The decrease was attributable to down time from operational issues.
– In Qatar, 4Q11 production was 76 mboe/d, an increase of 3 mboe/d over 3Q11.
– In Dolphin and Bahrain combined, production decreased 6 mboe/d from 3Q11.
Dolphin volumes declined 9 mboe/d because, during the quarter, it reached
annual maximum volumes allowed under its contract.
Dolphin volumes declined 9 mboe/d because, during the quarter, it reached
annual maximum volumes allowed under its contract.
• 4Q11 sales volumes were 749 mboe/d, compared to our guidance of
740 mboe/d. The improvement resulted from higher US production.
740 mboe/d. The improvement resulted from higher US production.
Fourth Quarter 2011 Earnings - Oil & Gas Production
Fourth Quarter 2011 Earnings - Oil & Gas Production
6

7
• Realized oil prices for the quarter represented 106% of
the average WTI and 91% of the average Brent price.
the average WTI and 91% of the average Brent price.
• Realized NGL prices were 59% of WTI and realized
domestic gas prices were 98% of NYMEX.
domestic gas prices were 98% of NYMEX.
• Price changes at current global prices affect our quarterly
earnings before income taxes by $38 mm for a $1.00 p/b
change in oil prices and $8 mm for a $1.00 p/b change in
NGL prices.
earnings before income taxes by $38 mm for a $1.00 p/b
change in oil prices and $8 mm for a $1.00 p/b change in
NGL prices.
• A swing of $0.50 per mm BTUs in domestic gas prices
affects quarterly pre-tax earnings by about $31 million.
affects quarterly pre-tax earnings by about $31 million.
Fourth Quarter 2011 Earnings - Oil & Gas
Segment - Realized Prices
Segment - Realized Prices
Fourth Quarter 2011 Earnings - Oil & Gas
Segment - Realized Prices
Segment - Realized Prices
7

8
• 4Q11 operating costs were about $130 mm higher
than 3Q11 as a result of higher workover and well
maintenance activity driven by our program to increase
production at these higher levels of oil prices.
than 3Q11 as a result of higher workover and well
maintenance activity driven by our program to increase
production at these higher levels of oil prices.
• Oil and gas cash production costs were $12.84 a boe
for the twelve months of 2011, compared with last year's
twelve-month costs of $10.19 a barrel.
for the twelve months of 2011, compared with last year's
twelve-month costs of $10.19 a barrel.
– The cost increase reflects higher workover and maintenance
activity mentioned earlier.
activity mentioned earlier.
• Taxes other than on income, which are directly related to
product prices, were $2.21 per boe for the twelve months
of 2011, compared to $1.83 per boe for all of 2010.
product prices, were $2.21 per boe for the twelve months
of 2011, compared to $1.83 per boe for all of 2010.
• 4Q11 exploration expense, which included the
impairment of several small leases, was $73 mm.
impairment of several small leases, was $73 mm.
Fourth Quarter 2011 Earnings - Oil & Gas
Segment - Production Costs and Taxes
Segment - Production Costs and Taxes
Fourth Quarter 2011 Earnings - Oil & Gas
Segment - Production Costs and Taxes
Segment - Production Costs and Taxes
8
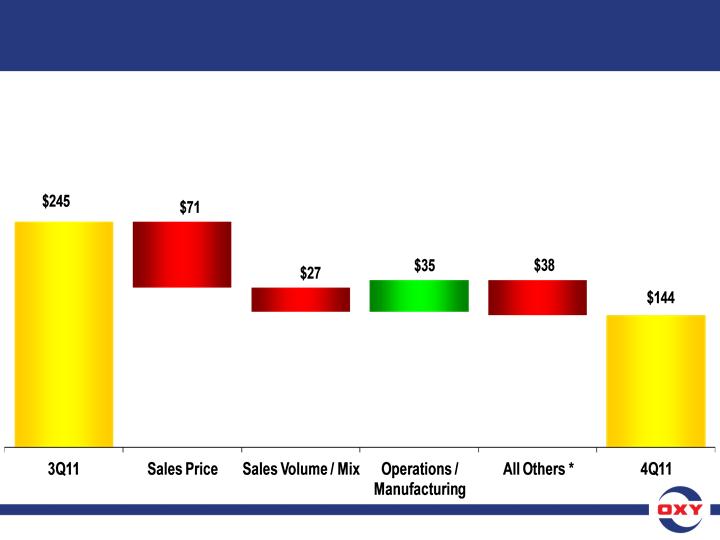
Fourth Quarter 2011 Earnings - Chemical
Segment Variance Analysis - 4Q11 vs. 3Q11
Segment Variance Analysis - 4Q11 vs. 3Q11
($ in millions)
*Power sold to the grid during Texas power shortage in 3Q11.
• Core Results for 4Q11 were $144 mm vs. $245 mm in 3Q11.
– The sequential drop in income was the result of seasonal factors.
9
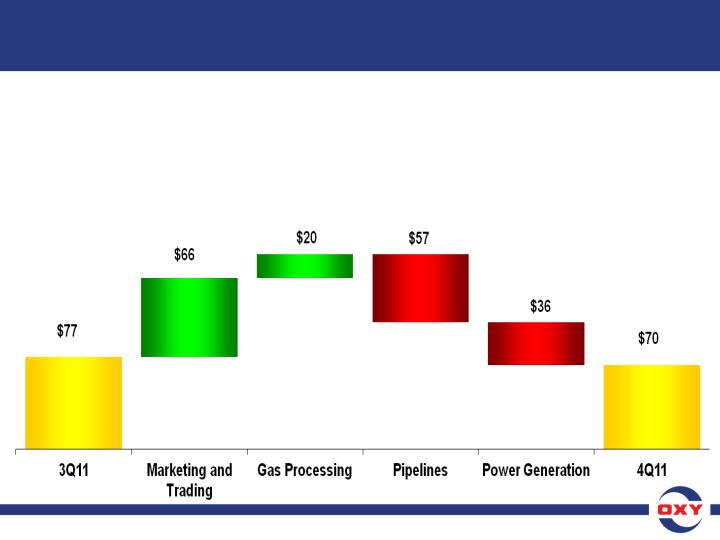
Fourth Quarter 2011 Earnings - Midstream
Segment Variance Analysis - 4Q11 vs. 3Q11
Segment Variance Analysis - 4Q11 vs. 3Q11
($ in millions)
• Core Results for 4Q11 were $70 mm vs. $77 mm in 3Q11.
10

11
• The significantly higher year-end Oxy stock price,
compared to the distressed levels at the end of 3Q11,
affected the quarterly valuation of equity-based
compensation plans reducing 4Q11 pre-tax income
of the company, compared to 3Q11, by $80 mm.
compared to the distressed levels at the end of 3Q11,
affected the quarterly valuation of equity-based
compensation plans reducing 4Q11 pre-tax income
of the company, compared to 3Q11, by $80 mm.
• The worldwide effective tax rate was 37% for 4Q11.
• Our 4Q11 US and foreign tax rates are included in
the “Investor Relations Supplemental Schedules.”
the “Investor Relations Supplemental Schedules.”
Fourth Quarter 2011 Earnings - Taxes and Other
11

12
Fourth Quarter 2011 Earnings -
Full Year 2011 Results
Full Year 2011 Results
Fourth Quarter 2011 Earnings -
Full Year 2011 Results
Full Year 2011 Results
FY2011 FY2010
• Core Income ($mm) $6,828 $4,664
• Core EPS (diluted) $8.39 $5.72
• Net Income ($mm) $6,771 $4,530
• EPS (diluted) $8.32 $5.56
• Cash flow from operations for the twelve months
of 2011 was $12.3 billion.
of 2011 was $12.3 billion.
12
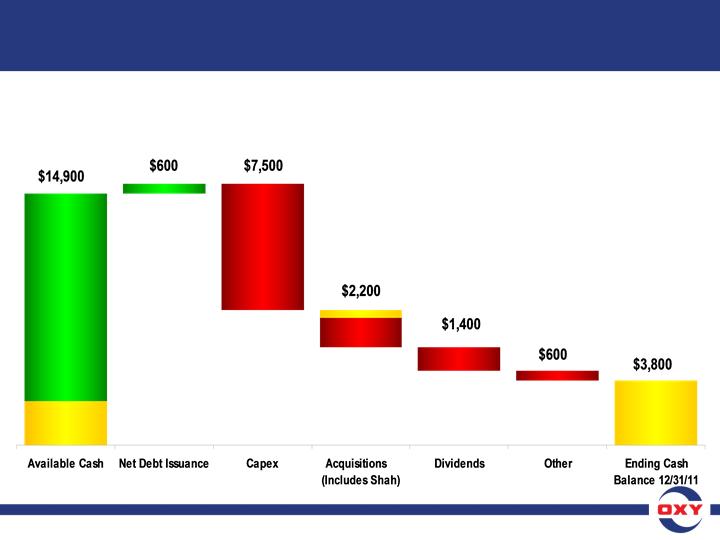
Fourth Quarter 2011 Earnings -
Full Year 2011 Cash Flow
Full Year 2011 Cash Flow
Cash Flow
From
Operations
$12,300
From
Operations
$12,300
Beginning
Cash $2,600
12/31/10
Cash $2,600
12/31/10
– Free cash flow from continuing operations after capex and dividends,
but before acquisition and debt activity, was about $3.4 billion.
but before acquisition and debt activity, was about $3.4 billion.
Shah - $500
($ in millions)
Note: See attached GAAP reconciliation.
13

14
One year cash flow 12/31/11
Total debt,
net of cash
at 12/31/10 $2.5 B
Total debt,
net of cash
at 12/31/11 $2.1 B
Net cash generated $0.4 B
Cash returned
to shareholders
• Dividends $1.4 B
• Share buybacks $275 mm
Fourth Quarter 2011 Earnings -
One and Two Year Simplified Cash Flow
One and Two Year Simplified Cash Flow
Two year cash flow 12/31/11
Total debt,
net of cash
at 12/31/09 $1.6 B
Total debt,
net of cash
at 12/31/11 $2.1 B
Net cash used $0.5 B
Cash outlays
• Capital $11.5 B
• Acquisitions $6.9 B
Cash returned to shareholders
• Dividends &
• share buybacks $2.9 B
14

15
Fourth Quarter 2011 Earnings -
2011 Capital Expenditures
2011 Capital Expenditures
Fourth Quarter 2011 Earnings -
2011 Capital Expenditures
2011 Capital Expenditures
• Capital expenditures for 2011 were approximately $7.5
billion, of which about $2.6 billion was incurred in 4Q11.
billion, of which about $2.6 billion was incurred in 4Q11.
• Higher 4Q11 capital partially reflected the gradual
ramp-up of our program during 2011.
ramp-up of our program during 2011.
– The increases were mostly at Williston domestically,
and Iraq, Oman and Qatar internationally.
and Iraq, Oman and Qatar internationally.
– 4Q11 capital also included spending for several midstream
projects, such as the Elk Hills gas processing plant, which will
drop significantly during 1H12 as these projects are completed.
projects, such as the Elk Hills gas processing plant, which will
drop significantly during 1H12 as these projects are completed.
• Total 2011 capital expenditures by segment were 82%
in oil and gas, 14% in midstream and the remainder
in chemicals.
in oil and gas, 14% in midstream and the remainder
in chemicals.
15

16
Fourth Quarter 2011 Earnings -
Net Acquisition Expenditures
Net Acquisition Expenditures
Fourth Quarter 2011 Earnings -
Net Acquisition Expenditures
Net Acquisition Expenditures
• Our net acquisition expenditures in the twelve months
were $2.2 billion, which are net of proceeds from the
sale of our Argentina operations.
were $2.2 billion, which are net of proceeds from the
sale of our Argentina operations.
• The acquisitions included the South Texas purchase,
properties in California, the Permian and Williston, and a
payment in connection with the signing of the Al Hosn
Gas project in Abu Dhabi, which is the gas development
of the Shah field.
properties in California, the Permian and Williston, and a
payment in connection with the signing of the Al Hosn
Gas project in Abu Dhabi, which is the gas development
of the Shah field.
– This payment was for Oxy’s share of development expenditures
incurred by the project prior to the date the final agreement was
signed.
incurred by the project prior to the date the final agreement was
signed.
16

17
Fourth Quarter 2011 Earnings -
Shares Outstanding, Debt and ROE & ROCE
Shares Outstanding, Debt and ROE & ROCE
Shares Outstanding (mm) 2011 12/31/11
Weighted Average Basic 812.1
Weighted Average Diluted 812.9
Basic Shares Outstanding 810.5
Diluted Shares Outstanding 811.3
12/31/11 12/31/10
Debt/Capital 13% 14%
• Our return on equity for 2011 was 19.3% and the
return on capital employed was 17.2%.
return on capital employed was 17.2%.
17

18
Fourth Quarter 2011 Earnings -
DD&A, Oil and Gas Operating Costs
DD&A, Oil and Gas Operating Costs
Fourth Quarter 2011 Earnings -
DD&A, Oil and Gas Operating Costs
DD&A, Oil and Gas Operating Costs
• Oil and Gas DD&A expense was $11.48 per BOE for 2011.
• We expect the Oil and Gas segment DD&A rate to be
about $14 per barrel in 2012.
about $14 per barrel in 2012.
• The total Chemical and Midstream DD&A expense
is expected to be about $650 million for 2012.
is expected to be about $650 million for 2012.
• We expect operating costs per barrel to be about
$13.75 in 2012.
$13.75 in 2012.
– The 2012 expected costs reflect higher levels of workovers
and well maintenance activity.
and well maintenance activity.
– However, significant and substantial product price changes,
and changes in activity levels and inflation resulting from
product prices, may affect this cost estimate during the
course of the year.
and changes in activity levels and inflation resulting from
product prices, may affect this cost estimate during the
course of the year.
18

19
Oxy’s Three Main Performance Criteria -
Production Growth, Strong Returns & Dividend Growth
Production Growth, Strong Returns & Dividend Growth
• We finished a strong year in terms of the three main
performance criteria outlined last quarter.
performance criteria outlined last quarter.
• Our domestic oil and gas production grew by about 12%
for 2011 to 428 mboe/d.
for 2011 to 428 mboe/d.
– 4Q11 domestic production of 449 mboe/d was the highest U.S. total
production volume in Oxy’s history, reflecting the highest ever
quarterly volume for liquids of 310 mb/d and the second highest
quarterly volume for gas.
production volume in Oxy’s history, reflecting the highest ever
quarterly volume for liquids of 310 mb/d and the second highest
quarterly volume for gas.
– Total company production increased about 4% for the year.
• Our chemical business delivered exceptional results
for the year, achieving one of their highest earnings
levels ever.
for the year, achieving one of their highest earnings
levels ever.
• Our return on equity was 19% for the year and return on
capital was 17%.
capital was 17%.
19

20
Oxy’s Three Main Performance Criteria -
Production Growth, Strong Returns & Dividend Growth
Production Growth, Strong Returns & Dividend Growth
• We increased our annual dividends by $0.32 or by 21%,
to $1.84 per share.
to $1.84 per share.
• We expect to announce a further dividend increase after
the meeting of our Board of Directors in the second week
of February.
the meeting of our Board of Directors in the second week
of February.
20

21
• We have ample legitimate opportunities in our domestic
oil and gas business where we could deploy capital.
oil and gas business where we could deploy capital.
• We have tried to manage the program to a level that is
realistic at current price levels, and as a result, have
deferred some projects that otherwise would have
met our hurdle rates.
realistic at current price levels, and as a result, have
deferred some projects that otherwise would have
met our hurdle rates.
• We continue to have substantial inventory of high return
projects going forward to fulfill our growth objectives.
projects going forward to fulfill our growth objectives.
2012 Capital Program
2012 Capital Program
21
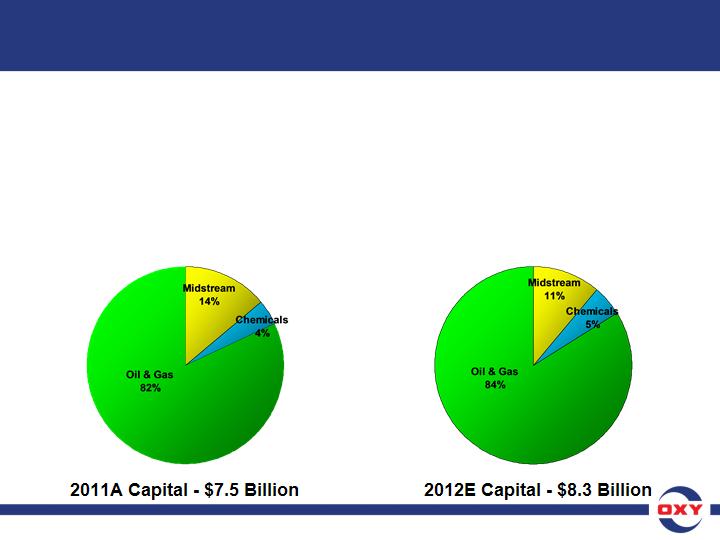
• We are increasing our capital program approximately 10% in 2012
to $8.3 billion from the $7.5 billion we spent in 2011.
to $8.3 billion from the $7.5 billion we spent in 2011.
• About $500 million of this increase will be in the US, mainly in the
Permian basin, and the rest in international projects including the
Al Hosn sour gas project and Iraq.
Permian basin, and the rest in international projects including the
Al Hosn sour gas project and Iraq.
• We will review our capital program around mid-year and adjust as
conditions dictate.
conditions dictate.
Capital Program - 2012E vs. 2011 Actual
Capital Program - 2012E vs. 2011 Actual
22
2012 Capital Program -
2012 Capital Program -
Domestic Oil & Gas and Related Midstream Projects
Domestic Oil & Gas and Related Midstream Projects
• We currently expect the rig count to
remain constant in 1H12 at 31, the same
as what we were running at YE-2011;
remain constant in 1H12 at 31, the same
as what we were running at YE-2011;
• We are seeing improvement with
respect to permitting issues in the state;
respect to permitting issues in the state;
• We have received approved field rules
and new permits for both injection wells
and drilling locations;
and new permits for both injection wells
and drilling locations;
• The regulatory agency is responsive
and committed to working through the
backlog of permits;
and committed to working through the
backlog of permits;
• We expect to maintain our capital
program at current levels for about
1H12, which will enable us to continue
to grow our production volumes;
program at current levels for about
1H12, which will enable us to continue
to grow our production volumes;
• We will reassess our capital program
when the number of permits in hand
allows it.
when the number of permits in hand
allows it.
• In domestic oil gas and related
midstream projects, development
capital will be about 55% of our
total program.
midstream projects, development
capital will be about 55% of our
total program.
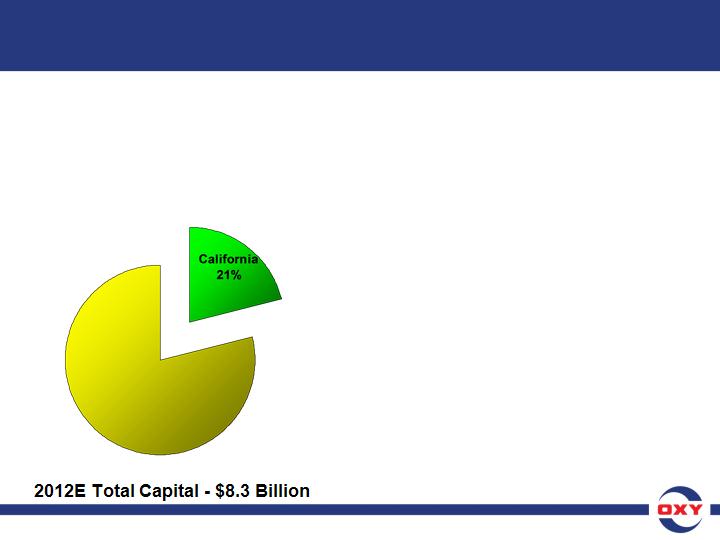
• In CA, we expect to spend about
21% of our total capital program.
21% of our total capital program.
23
2012E Total Capital - $8.3 Billion
2012 Capital Program -
2012 Capital Program -
Domestic Oil & Gas and Related Midstream Projects
Domestic Oil & Gas and Related Midstream Projects
• Our rig count at year-end 2011
was 23;
was 23;
• We expect our rig count to ramp up
during the year to around 27 rigs by
year end;
during the year to around 27 rigs by
year end;
• Our CO2 flood capital should remain
comparable to the 2011 levels;
comparable to the 2011 levels;
• In our non-CO2 operations we are
seeing additional opportunities for
good return projects;
seeing additional opportunities for
good return projects;
• As a result, we have stepped up
their development program and 2012
capital will be about 75% higher than
the 2011 levels.
their development program and 2012
capital will be about 75% higher than
the 2011 levels.
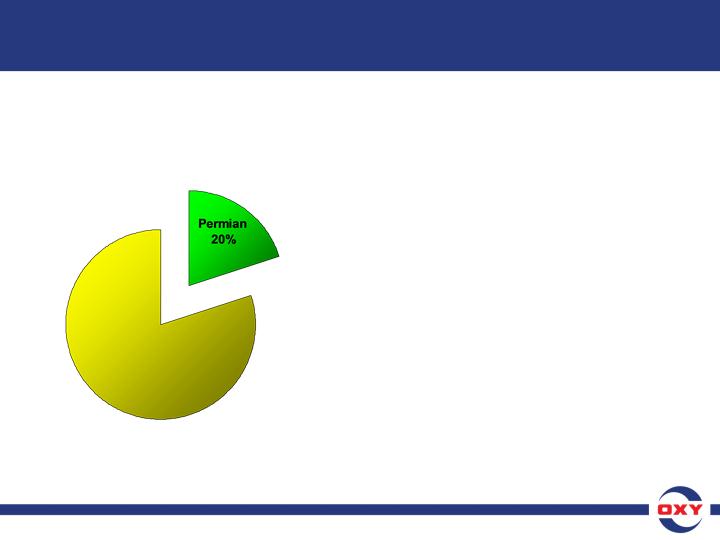
• In the Permian operations, we
expect to spend about 20% of
our total capital.
expect to spend about 20% of
our total capital.
24
2012E Total Capital - $8.3 Billion
2012 Capital Program -
2012 Capital Program -
Domestic Oil & Gas and Related Midstream Projects
Domestic Oil & Gas and Related Midstream Projects
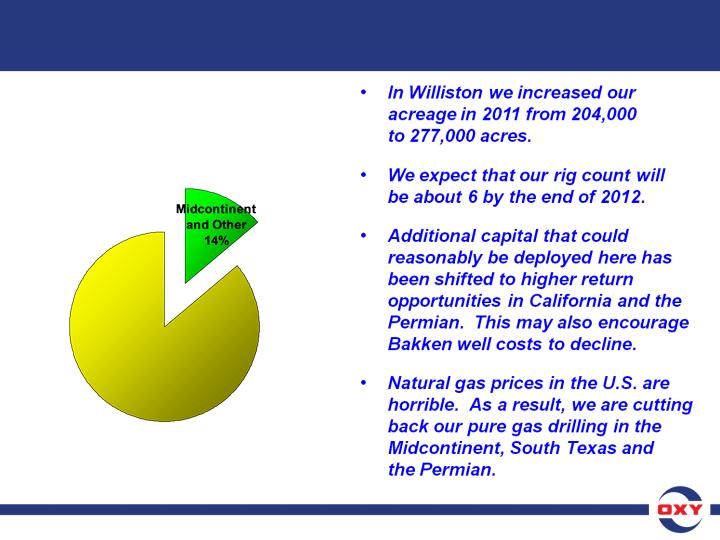
• In the Midcontinent and other
operations, we expect to spend
around 14% of our total capital
program.
operations, we expect to spend
around 14% of our total capital
program.
25
2012 Capital Program -
2012 Capital Program -
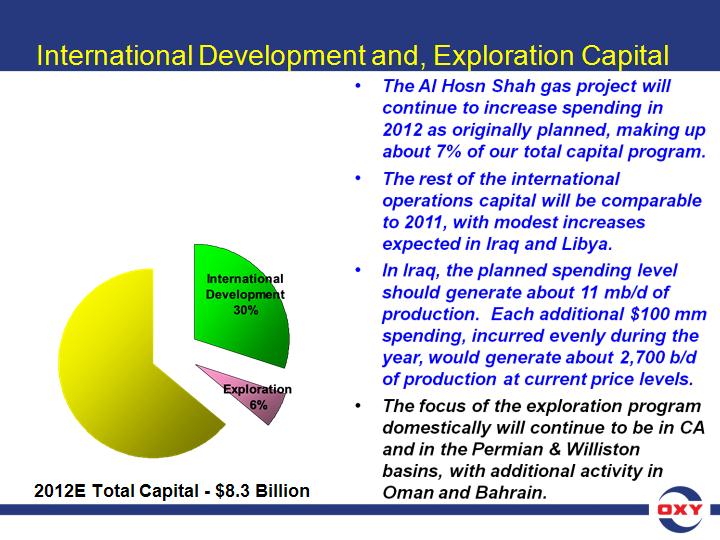
• Total international development
capital will be about 30% of the
total company capital program.
capital will be about 30% of the
total company capital program.
• Exploration capital should increase
about 10% over the 2011 spending
levels and represent 6% of the total
capital program.
about 10% over the 2011 spending
levels and represent 6% of the total
capital program.
26

27
• As we look ahead to 2012, we expect oil and gas
production to be as follows:
production to be as follows:
– In 1H12, we expect our domestic production to grow 3 to 4 mboe/d
each month from the current quarterly average of 449 mboe/d,
which would correspond to a 6 to 8 mboe/d increase per quarter.
each month from the current quarterly average of 449 mboe/d,
which would correspond to a 6 to 8 mboe/d increase per quarter.
– 4Q11 was relatively free of significant operational disruptions
resulting in better than expected domestic production. A more
typical experience with respect to such issues could moderate the
growth somewhat in 1Q12.
resulting in better than expected domestic production. A more
typical experience with respect to such issues could moderate the
growth somewhat in 1Q12.
– If the production growth rate continued at a comparable pace in
2H12, our year-over-year average domestic production growth
would be between 8 and 10% in 2012.
2H12, our year-over-year average domestic production growth
would be between 8 and 10% in 2012.
• Internationally,
– Colombia production should be about flat for the year compared
to 2011. In 1Q12, volumes should be about 3 mboe/d higher
than 4Q11, although insurgent activity has picked up recently.
to 2011. In 1Q12, volumes should be about 3 mboe/d higher
than 4Q11, although insurgent activity has picked up recently.
Fourth Quarter 2011 Earnings -
Oil and Gas - 2012 Production Outlook
Oil and Gas - 2012 Production Outlook
27

28
• The Middle East region production is expected to be as
follows for 1H12:
follows for 1H12:
– Production has resumed in our operations in Libya, and at this point, we
expect about 5 mboe/d production, with further growth to come later in
the year. At this point we reasonably expect
that total year Libya production will be about half the level that existed
prior to the cessation of operations.
expect about 5 mboe/d production, with further growth to come later in
the year. At this point we reasonably expect
that total year Libya production will be about half the level that existed
prior to the cessation of operations.
– In Iraq, as I discussed previously, production levels depend on capital
spending levels. We are still unable to reliably predict the timing of
spending levels, but we expect production to be similar to the past
quarter.
spending levels. We are still unable to reliably predict the timing of
spending levels, but we expect production to be similar to the past
quarter.
– In Yemen, as we previously disclosed, our Masila block contract expired
in December 2011. Our share of the production from Masila was about 11
mboe/d for the full year. Our remaining operations in Yemen typically
have higher volumes early in the year due to the timing of cost recovery
each year, which will partially offset the loss of Masila barrels in 1H12.
As a result, we expect our total Yemen production to drop slightly from
4Q11 levels in 1H12.
– In the remainder of the Middle East, we expect production to be
comparable to 4Q11 volumes.
comparable to 4Q11 volumes.
Fourth Quarter 2011 Earnings -
Oil and Gas - 2012 Production Outlook
Oil and Gas - 2012 Production Outlook
28

29
• At current prices, we expect total 1Q12 sales volumes to
be comparable to 4Q11 volumes, depending on the
scheduling of liftings.
be comparable to 4Q11 volumes, depending on the
scheduling of liftings.
• A $5.00 change in global oil prices would impact our PSC
daily volumes by about 3 mboe/d.
daily volumes by about 3 mboe/d.
• We expect exploration expense to be about $100 mm for
seismic and drilling for our exploration programs in
1Q12.
seismic and drilling for our exploration programs in
1Q12.
Fourth Quarter 2011 Earnings -
1Q12 Outlook - Oil and Gas
1Q12 Outlook - Oil and Gas
29

30
• The chemical segment 1Q12 earnings are expected to
be about $165 mm with seasonal demand improvement
expected in the second and third quarters.
be about $165 mm with seasonal demand improvement
expected in the second and third quarters.
– We expect that lower natural gas prices and the continuing
improvement in the global economy will have a positive impact
on our chemical business margins, which is expected to be
offset partially by higher ethylene prices.
improvement in the global economy will have a positive impact
on our chemical business margins, which is expected to be
offset partially by higher ethylene prices.
• We expect our combined worldwide tax rate in 1Q12 to
increase to about 40%.
increase to about 40%.
– The increase from 2011 reflects a higher proportional mix of
international income with higher tax rates, in particular from
Libya.
international income with higher tax rates, in particular from
Libya.
Fourth Quarter 2011 Earnings -
1Q12 Outlook - Chemicals & Taxes
1Q12 Outlook - Chemicals & Taxes
30

31
Fourth Quarter 2011 Earnings - Summary
Fourth Quarter 2011 Earnings - Summary
• To summarize: We closed out 2011 on a solid note, with
record high domestic oil and gas production in 4Q11,
which was also ahead of our guidance.
record high domestic oil and gas production in 4Q11,
which was also ahead of our guidance.
• We continued to generate strong financial returns well
above our cost of capital.
above our cost of capital.
• We enter this year raising our capital program by about
10% vs. last year in order to prudently pursue our
substantial inventory of high return growth projects.
10% vs. last year in order to prudently pursue our
substantial inventory of high return growth projects.
• The business continues to grow and generate free cash
flow after capital, which should allow us to consistently
grow the dividend at an attractive rate, further boosting
the total return to our shareholders.
flow after capital, which should allow us to consistently
grow the dividend at an attractive rate, further boosting
the total return to our shareholders.
31
32
32
|
Occidental Petroleum Corporation
|
||
|
Free Cash Flow
|
||
|
Reconciliation to Generally Accepted Accounting Principles (GAAP)
|
||
|
($ Millions)
|
||
|
Twelve Months
|
||
|
2011
|
||
|
Consolidated Statement of Cash Flows
|
||
|
Cash flow from operating activities
|
12,281
|
|
|
Cash flow from investing activities
|
(9,903
|
)
|
|
Cash flow from financing activities
|
(1,175
|
)
|
|
Change in cash
|
1,203
|
|
|
Free Cash Flow
|
||
|
Cash flow from operating activities - continuing operations
|
12,306
|
|
|
Capital spending
|
(7,518
|
)
|
|
Free cash flow before dividends
|
4,788
|
|
|
Dividends
|
(1,436
|
)
|
|
Free cash flow after dividends
|
3,352
|
|
|
Occidental Petroleum Corporation
|
|||||
|
Return on Capital Employed (ROCE)
|
|||||
|
Reconciliation to Generally Accepted Accounting Principles (GAAP)
|
|||||
|
2010
|
2011
|
||||
|
RETURN ON CAPITAL EMPLOYED (%)
|
13.2
|
17.2
|
|||
|
GAAP measure - net income attributable
|
4,530
|
6,771
|
|||
|
to common stock
|
|||||
|
Interest expense
|
93
|
284
|
|||
|
Tax effect of interest expense
|
(33
|
)
|
(99
|
)
|
|
|
Earnings before tax-effected interest expense
|
4,590
|
6,956
|
|||
|
GAAP stockholders' equity
|
32,484
|
37,620
|
|||
|
Debt
|
5,111
|
5,871
|
|||
|
Total capital employed
|
37,595
|
43,491
|
|||
|
ROCE
|
13.2
|
17.2
|
|||