Attached files
| file | filename |
|---|---|
| 8-K - 8-K - MOLEX INC | d289399d8k.htm |
| EX-99.1 - EX-99.1 - MOLEX INC | d289399dex991.htm |
    January 25,
2012 January 25, 2012
Exhibit 99.2 |
 Statements
in
this
release
that
are
not
historical
are
forward-looking
and
are
subject
to
various
risks
and
uncertainties
that
could
cause
actual
results
to
vary
materially
from
those
stated.
Words
such
as
“anticipates,”
“expects,”
“believes,”
“intends,”
“plans,”
“projects,”
“estimates,”
“potential,”
and
similar
expressions
are
used
to
identify
these
forward-looking
statements.
Forward-looking
statements
are
based
on
currently
available
information
and
include,
among
others,
the
discussion
under
“Outlook.”
These
statements
are
not
guarantees
of
future
performance
and
are
subject
to
risks,
uncertainties
and
assumptions
including
those
associated
with
the
operation
of
our
business,
including
the
risk
that
customer
demand
will
decrease
either
temporarily
or
permanently,
whether
due
to
the
Company's
actions
or
the
demand
for
the
Company's
products,
and
that
the
Company
may
not
be
able
to
respond
through
cost
reductions
in
a
timely
and
effective
manner;
the
risk
that
the
value
of
our
inventory
may
decline;
price
cutting,
new
product
introductions
and
other
actions
by
our
competitors;
fluctuations
in
the
costs
of
raw
materials
that
the
Company
is
not
able
to
pass
through
to
customers
because
of
existing
contracts
or
market
factors;
the
availability
of
credit
and
general
market
liquidity;
fluctuations
in
currency
exchange
rates;
natural
disasters;
the
financial
condition
of
our
customers;
labor
cost
increases;
and
the
ability
to
realize
cost
savings
from
cost
reduction
initiatives,
the
outcome
of
legal
proceedings
and
losses
resulting
from
unauthorized
activities
in
Molex
Japan.
Other
factors,
risks
and
uncertainties
are
set
forth
in
Item
1A
“Risk
Factors”
of
the
Company’s
Form
10-K
for
the
year
ended
June
30,
2011,
and
the
Form
10-Q
for
the
quarter
ended
September
30,
2011,
which
are
incorporated
by
reference
and
in
other
reports
that
Molex
files
or
furnishes
with
the
Securities
and
Exchange
Commission.
Forward-looking
statements
are
based
upon
assumptions
as
to
future
events
that
may
not
prove
to
be
accurate.
Actual
outcomes
and
results
may
differ
materially
from
what
is
expressed
in
these
forward-looking
statements.
As
a
result,
this
release
speaks
only
as
of
its
date
and
Molex
disclaims
any
obligation
to
revise
these
forward-looking
statements
or
to
provide
any
updates
regarding
information
contained
in
this
release
resulting
from
new
information,
future
events
or
otherwise.
Page 1
Page 1 |
 In
Molex
Incorporated’s
(“Molex”
or
the
“Company”)
conference
call
on
January
25,
2012
regarding
the
Company’s
financial
results
for
the
fiscal
quarter
and
the
following
slides,
Molex
may
refer
to
non-GAAP
financial
measures
to
describe
earnings
for
such
periods
excluding
the
items
referenced
in
the
relevant
slides
used
during
this
conference
call.
This
is
in
addition
to
disclosing
the
most
directly
comparable
measure
for
such
periods
determined
in
accordance
with
generally
accepted
accounting
principles,
or
GAAP.
Molex
believes
that
these
non-GAAP
financial
measures
provide
useful
information
to
investors
because
they
provide
information
about
the
estimated
financial
performance
of
Molex’s
ongoing
business
and
provide
for
greater
transparency
of
supplemental
information
used
by
management
in
its
financial
and
operational
decision-making.
These
non-
GAAP
financial
measures
may
be
different
from
non-GAAP
financial
measures
used
by
other
companies.
Non-GAAP
financial
measures
should
not
be
considered
as
a
substitute
for,
or
superior
to,
measures
of
financial
performance
prepared
in
accordance
with
GAAP.
Investors
are
encouraged
to
review
the
relevant
slides
reconciling
the
non-GAAP
financial
measures
intended
to
be
used
in
the
conference
call
to
the
most
comparable
GAAP
measure.
Page 2
Page 2 |
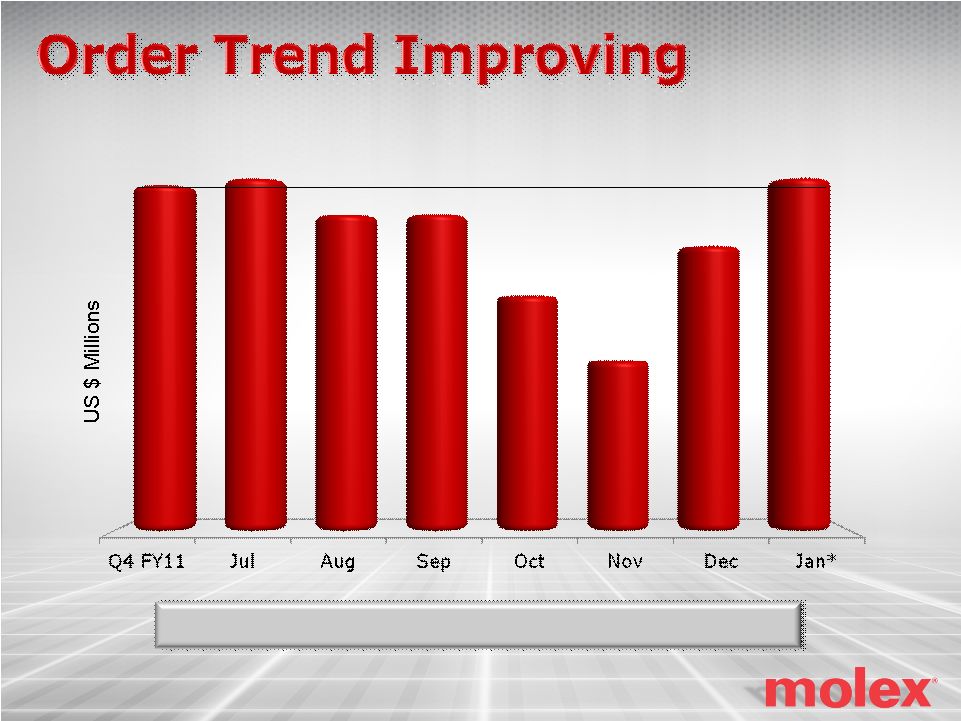
 Customers
accelerated production in September for key markets to reduce transportation costs
Impact from the flood in Thailand exceeded our
initial estimate
Strong cost control improved GM and reduced
SGA spending
Closed acquisition of Temp-Flex during the
quarter
Page 3
Page 3 |
 Flood in Thailand impacted December quarter
Page 4
Page 4 |
 Page
5 Page 5
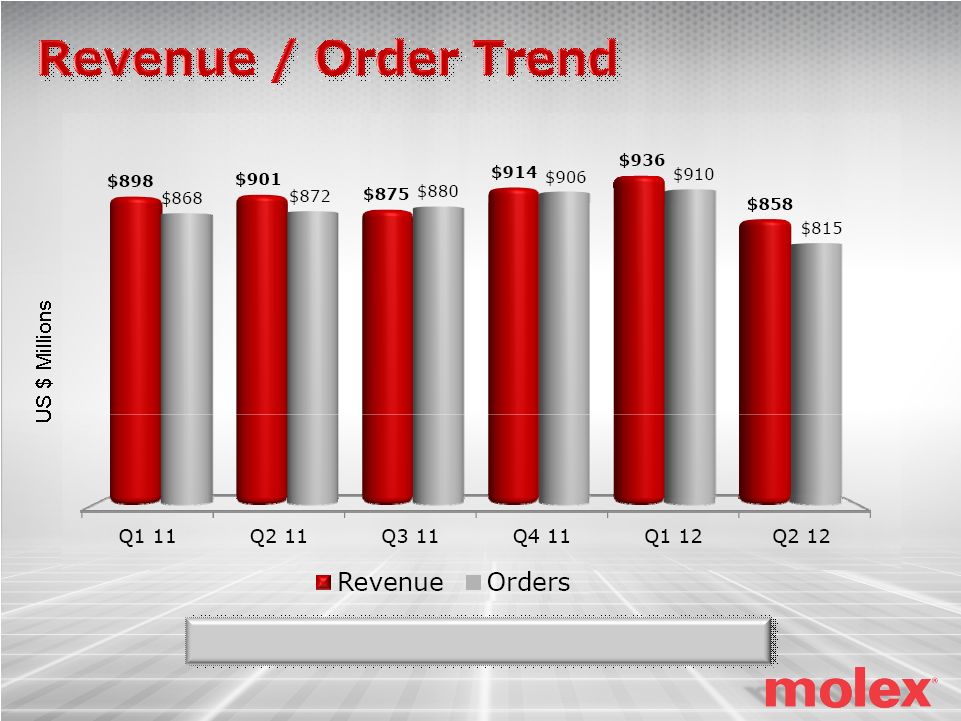
Daily Average
January MTD approximates FY11 Q4 level
*MTD Jan 22
FY11 Q4 Average |
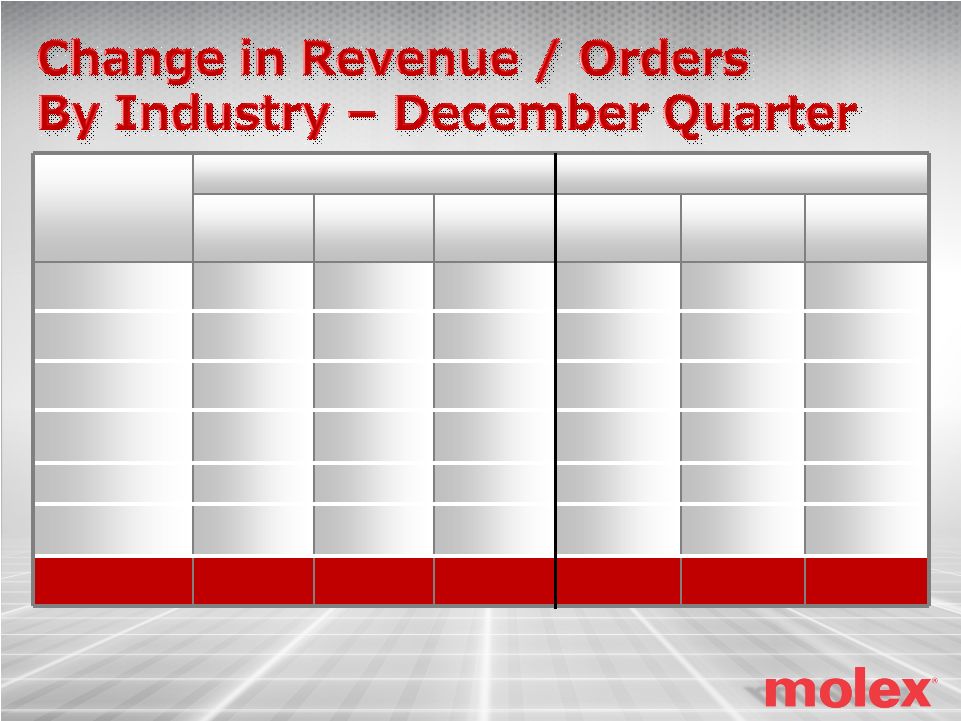 REVENUE
ORDERS
Sequential
Change
YOY
Change
%
Total
Sequential
Change
YOY
Change
%
Total
Automotive
(6)%
1%
16%
(10)%
-
17%
Infotech*
(14)%
3%
24%
(15)%
-
24%
Telecom
2%
(5)%
26%
(5)%
(10)%
25%
Consumer
Elect.*
(14)%
(11)%
18%
(17)%
(12)%
18%
Industrial
(12)%
(14)%
13%
(4)%
(10)%
13%
Medical /
Military
(3)%
(6)%
3%
2%
(1)%
3%
TOTAL
(8)%
(5)%
100%
(10)%
(7)%
100%
Page 6
Page 6
*Impacted by flood in Thailand |
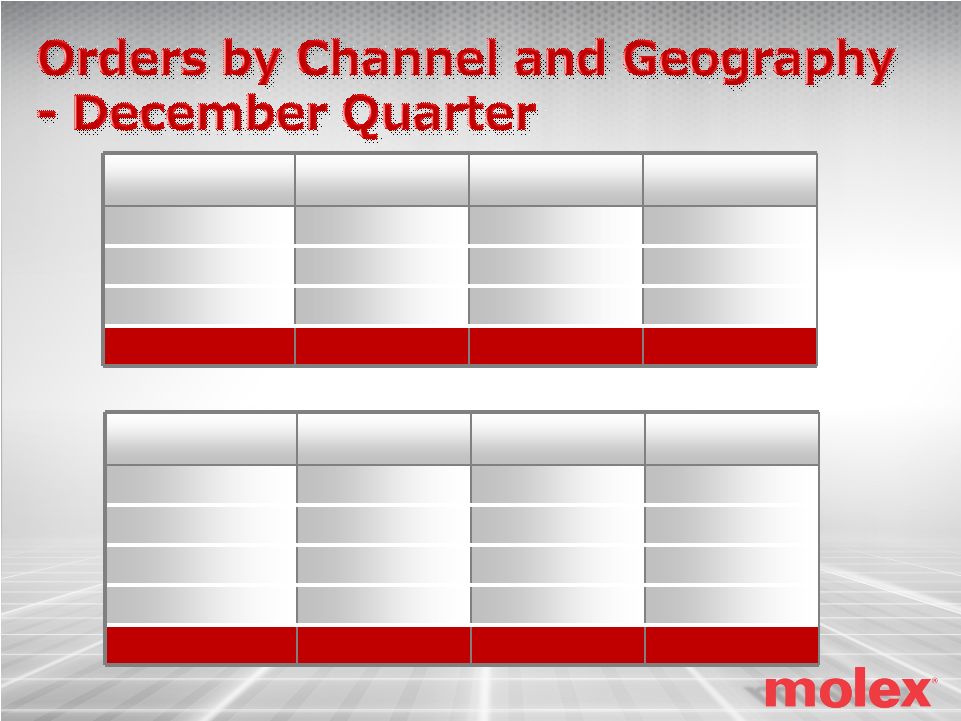 Sequential
YOY
% of Total
OEM
(15)%
(13)%
52%
Distribution
(3)%
(4)%
25%
EMS
(8)%
7%
23%
TOTAL
(10)%
(7)%
100%
Sequential
YOY
% of Total
Americas
4%
8%
27%
Europe
(6)%
(11)%
13%
APN
(20)%
(14)%
20%
APS
(15)%
(10)%
40%
TOTAL
(10)%
(7)%
100%
Page 7
Page 7 |
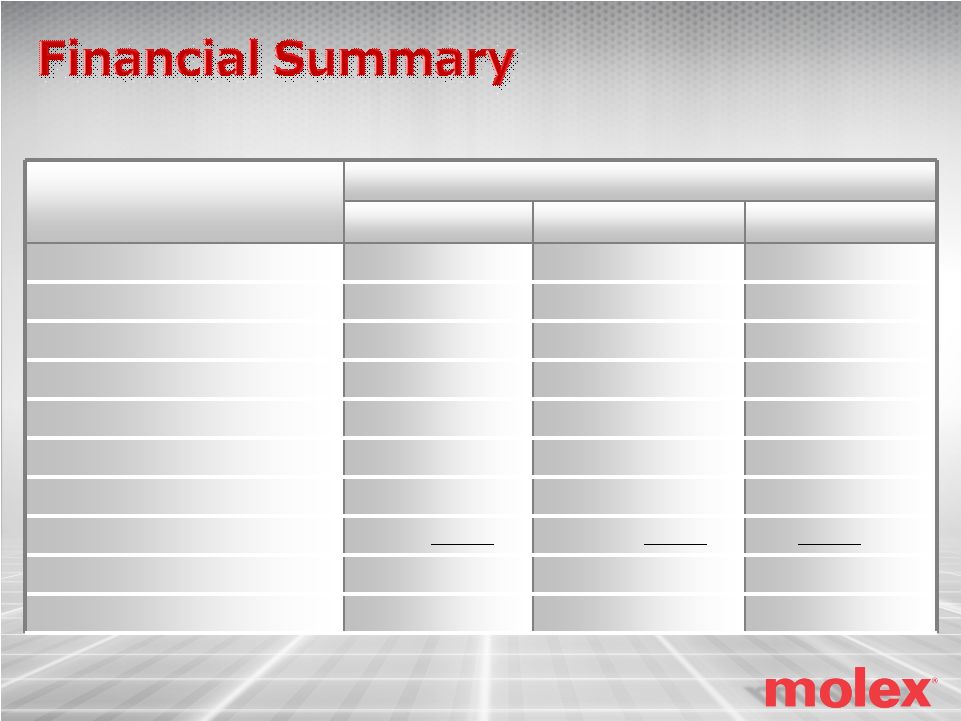 Quarter
Ended Dec 2011
Sep 2011
Dec 2010
Net revenue
$857.6
$936.0
$901.5
Gross margin
30.7%
31.3%
30.1%
SG&A
$163.1
$169.2
$159.0
Unauthorized activities in Japan
$2.7
$2.9
$2.7
Income from operations
$97.1
$120.6
$109.3
Interest (expense) net
$(2.1)
$(1.4)
$(1.8)
Other income
$1.5
$0.3
$4.8
Effective tax rate
33.7%
32.6%
30.3%
Net income
$64.0
$80.5
$78.3
Earnings per diluted share
$0.36
$0.46
$0.45
(US$ in millions, except per-share data)
Page 8
Page 8 |
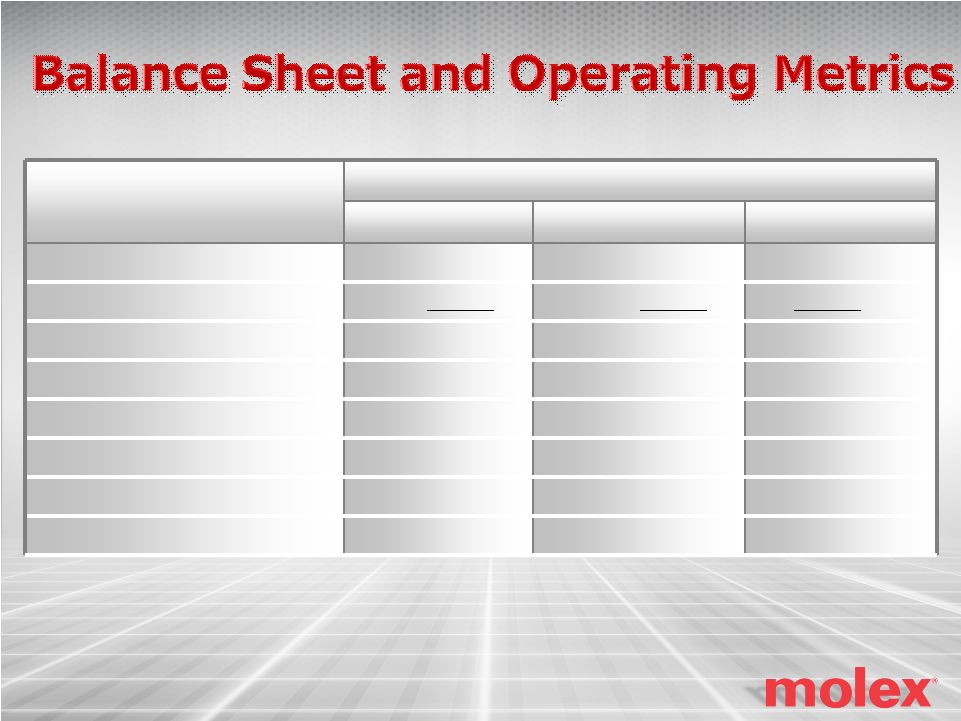 Quarter
Ended Dec 2011
Sep 2011
Dec 2010
Cash and marketable securities
$618.6
$568.5
$410.6
Total debt*
$320.5
$302.8
$302.8
Net cash
$298.1
$265.7
$107.8
Receivable days outstanding
71 days
69 days
73 days
Inventory days outstanding
91 days
84 days
87 days
Capital expenditures
$52.3
$42.8
$61.5
Research and development
$44.8
$43.9
$42.2
Cash flow from operations
$141.0
$150.5
$119.9
(US$ in millions)
*Total debt equals long-term debt plus current portion of long-term
debt and short-term loans, less current portion of capital leases
Page 9
Page 9 |
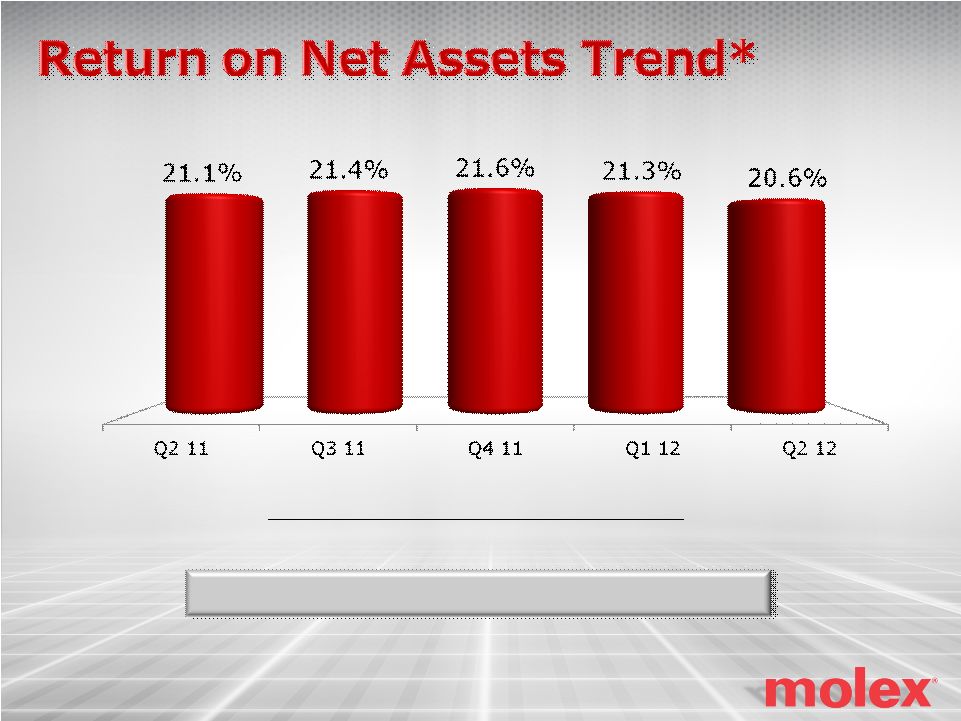 Trailing
12-months Earning our Cost of Capital
*See GAAP to non-GAAP reconciliation
Operating income excluding restructuring and special charges
Fixed assets + Inventory + A/R –
A/P
Page 10
Page 10 |
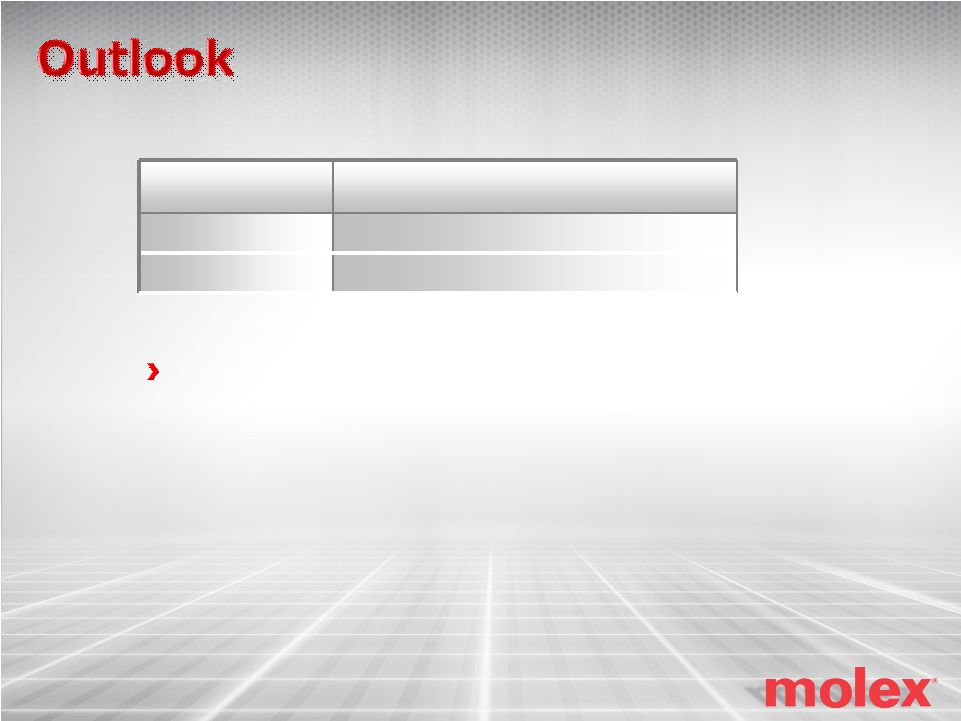 March Fiscal
Quarter Revenue
$830 to $860 million
EPS
$0.32 to $0.36
Assumes
–
32% effective tax rate
–
Constant foreign exchange rates and
commodity prices
–
EPS includes $0.01 for Japan litigation
Page 11
Page 11 |
 |
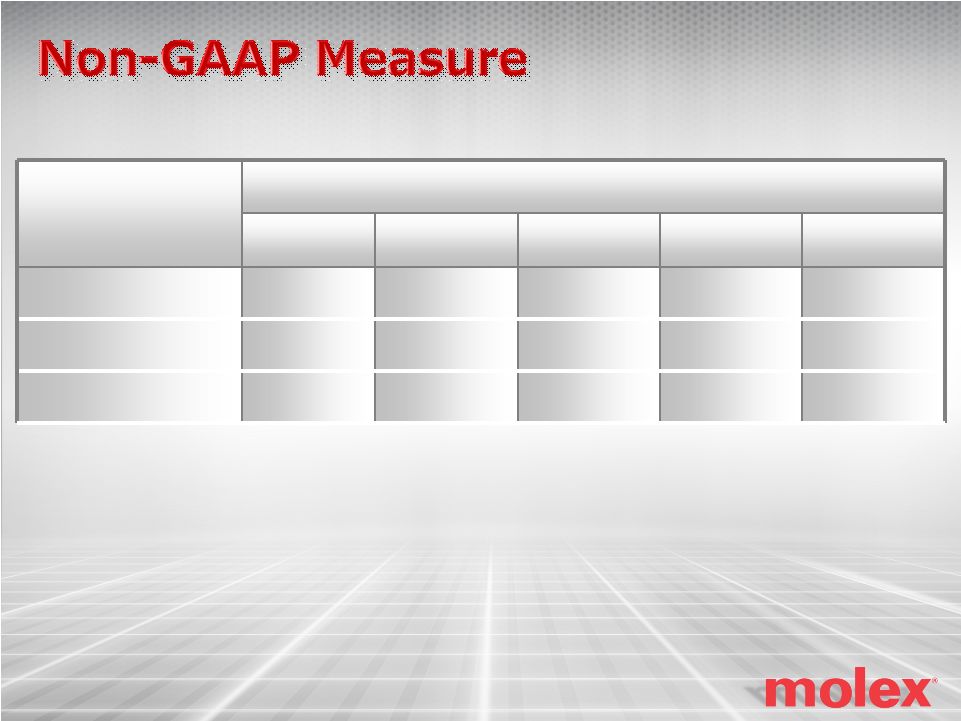 Quarter
Ended Dec
2011
Sep
2011
Jun
2011
Mar
2011
Dec
2010
Income from
operations
$97,141
$120,581
$110,122
$98,311
$109,288
Unauthorized
activities in Japan
2,723
2,922
3,366
2,855
2,713
Non-GAAP income
from operations
$99,864
$123,503
$113,488
$101,166
$112,001
(US$ in thousands)
Non-GAAP
income
from
operations
is
a
non-GAAP
financial
measure.
We
refer
to
non-GAAP
income
from
operations
to
describe
income
from
operations
excluding
the
items
referenced
above.
We
believe
that
non-
GAAP
income
from
operations
provides
useful
information
to
investors
because
it
provides
information
about
the
estimated
financial
performance
of
Molex’s
ongoing
business.
Non-GAAP
income
from
operations
is
used
by
management
in
its
financial
and
operational
decision-making
and
evaluation
of
overall
operating
performance
and
segment
level
core
operating
performance.
Non-GAAP
income
from
operations
may
be
different
from
similar
measures
used
by
other
companies. |