Attached files
| file | filename |
|---|---|
| 8-K - FORM 8-K - EXELON GENERATION CO LLC | d287105d8k.htm |
| EX-99.1 - PRESS RELEASE AND EARNINGS RELEASE ATTACHMENTS - EXELON GENERATION CO LLC | d287105dex991.htm |
 Earnings Conference Call
4
th
Quarter 2011
January 25, 2012
Exhibit 99.2 |
 Cautionary Statements Regarding
Forward-Looking Information
2
Except for the historical information contained herein, certain of the matters discussed in this
communication constitute “forward- looking statements” within the meaning of the
Securities Act of 1933 and the Securities Exchange Act of 1934, both as amended by the Private
Securities Litigation Reform Act of 1995. Words such as “may,” “will,” “anticipate,” “estimate,” “expect,” “project,” “intend,”
“plan,” “believe,” “target,” “forecast,” and words and terms
of similar substance used in connection with any discussion of future plans, actions, or events
identify forward-looking statements. These forward-looking statements include, but are not limited to, statements
regarding benefits of the proposed merger of Exelon Corporation (Exelon) and Constellation Energy
Group, Inc. (Constellation), integration plans and expected synergies, the expected timing of
completion of the transaction, anticipated future financial and operating performance and
results, including estimates for growth. These statements are based on the current expectations of
management of Exelon and Constellation, as applicable. There are a number of risks and uncertainties
that could cause actual results to differ materially from the forward-looking statements
included in this communication regarding the proposed merger. For example, (1) the companies
may be unable to obtain regulatory approvals required for the merger, or required regulatory approvals may delay
the merger or result in the imposition of conditions that could have a material adverse effect on the
combined company or cause the companies to abandon the merger; (2) conditions to the closing of
the merger may not be satisfied; (3) an unsolicited offer of another company to acquire assets
or capital stock of Exelon or Constellation could interfere with the merger; (4) problems may arise in
successfully integrating the businesses of the companies, which may result in the combined company not
operating as effectively and efficiently as expected; (5) the combined company may be unable to
achieve cost-cutting synergies or it may take longer than expected to achieve those
synergies; (6) the merger may involve unexpected costs, unexpected liabilities or unexpected delays, or the
effects of purchase accounting may be different from the companies’ expectations; (7) the credit
ratings of the combined company or its subsidiaries may be different from what the companies
expect; (8) the businesses of the companies may suffer as a result of uncertainty surrounding
the merger; (9) the companies may not realize the values expected to be obtained for properties expected or
required to be divested; (10) the industry may be subject to future regulatory or legislative actions
that could adversely affect the companies; and (11) the companies may be adversely affected by
other economic, business, and/or competitive factors. Other unknown or unpredictable factors
could also have material adverse effects on future results, performance or achievements of Exelon,
Constellation or the combined company. |
 Cautionary Statements Regarding
Forward-Looking Information (Continued)
3
Discussions of some of these other important factors and assumptions are contained in Exelon’s
and Constellation’s respective filings with the Securities and Exchange Commission (SEC),
and available at the SEC’s website at www.sec.gov, including: (1) Exelon’s 2010
Annual Report on Form 10-K in (a) ITEM 1A. Risk Factors, (b) ITEM 7. Management’s Discussion and Analysis of
Financial Condition and Results of Operations and (c) ITEM 8. Financial Statements and Supplementary
Data: Note 18; (2) Exelon’s Quarterly Report on Form 10-Q for the quarterly
period ended September 30, 2011 in (a) Part II, Other Information, ITEM 1A. Risk Factors, (b)
Part 1, Financial Information, ITEM 2. Management’s Discussion and Analysis of Financial Condition and Results of
Operations and (c) Part I, Financial Information, ITEM 1. Financial Statements: Note 13; (3)
Constellation’s 2010 Annual Report on Form 10-K in (a) ITEM 1A. Risk Factors, (b) ITEM
7. Management’s Discussion and Analysis of Financial Condition and Results of Operations
and (c) ITEM 8. Financial Statements and Supplementary Data: Note 12; and (4) Constellation’s Quarterly Report on
Form 10-Q for the quarterly period ended September 30, 2011 in (a) Part II, Other Information,
ITEM 1A. Risk Factors and ITEM 5. Other Information, (b) Part I, Financial Information, ITEM 2.
Management’s Discussion and Analysis of Financial Condition and Results of Operations and
(c) Part I, Financial Information, ITEM 1. Financial Statements: Notes to Consolidated Financial
Statements, Commitments and Contingencies. These risks, as well as other risks associated with the
proposed merger, are more fully discussed in the definitive joint proxy statement/prospectus
included in the Registration Statement on Form S-4 that Exelon filed with the SEC and that
the SEC declared effective on October 11, 2011 in connection with the proposed merger. In light of these
risks, uncertainties, assumptions and factors, the forward-looking events discussed in this
communication may not occur. Readers are cautioned not to place undue reliance on these
forward-looking statements, which speak only as of the date of this communication. Neither
Exelon nor Constellation undertake any obligation to publicly release any revision to its forward-looking
statements to reflect events or circumstances after the date of this communication.
In connection with the proposed merger between Exelon and Constellation, Exelon filed with the SEC a
Registration Statement on Form S-4 that included the definitive joint proxy
statement/prospectus. The Registration Statement was declared effective by the SEC on October
11, 2011. Exelon and Constellation mailed the definitive joint proxy statement/prospectus to their respective security
holders on or about October 12, 2011. WE URGE INVESTORS AND SECURITY HOLDERS TO READ THE DEFINITIVE
JOINT PROXY STATEMENT/PROSPECTUS AND ANY OTHER RELEVANT DOCUMENTS FILED WITH THE SEC, BECAUSE
THEY CONTAIN IMPORTANT INFORMATION about Exelon, Constellation and the proposed merger.
Investors and security holders may obtain copies of all documents filed with the SEC free of
charge at the SEC's website, www.sec.gov. In addition, a copy of the definitive joint proxy
statement/prospectus may be obtained free of charge from Exelon Corporation, Investor Relations, 10 South
Dearborn Street, P.O. Box 805398, Chicago, Illinois 60680-5398, or from Constellation Energy
Group, Inc., Investor Relations, 100 Constellation Way, Suite 600C, Baltimore, MD 21202. Additional
Information
and
Where
to
Find
it |
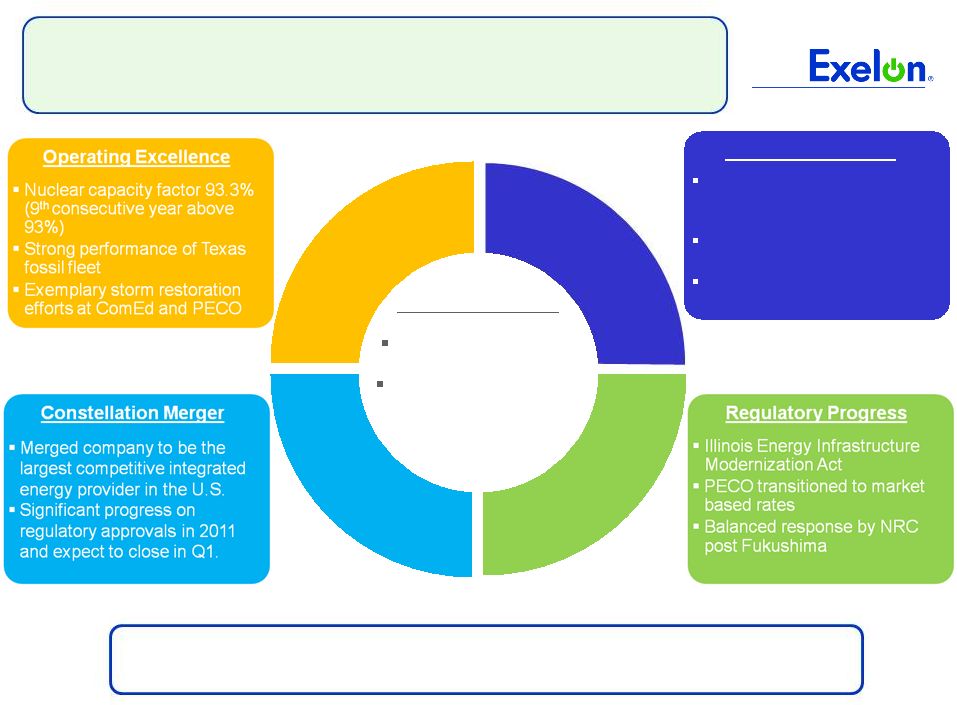 2011:
Year In Review 4
Financial Success
Q4 operating EPS of
$0.82 per share
2011 operating EPS of
$4.16 per share and
above original
expectations
Strategic
Execution
Acquired Wolf Hollow CCGT
in Texas and AVSR 1 Solar
PV facility in California
Nuclear uprate program
added 138.6 MW in 2011
Exelon Wind added 90 MW
in 2011
2011 was a year of exemplary financial and operating performance, constructive
regulatory environment and solid execution on strategic initiatives
|
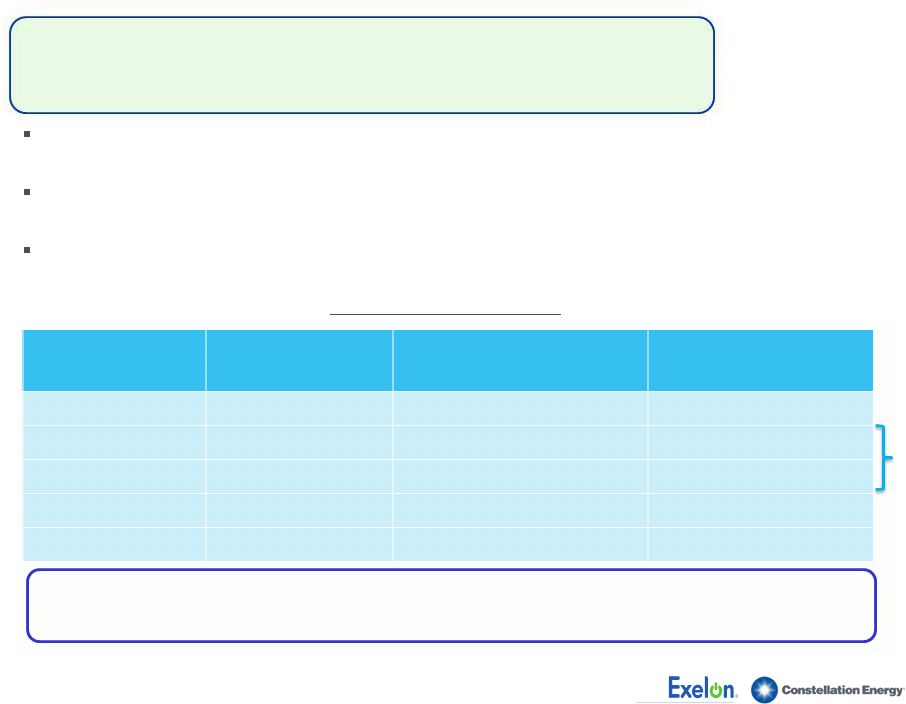
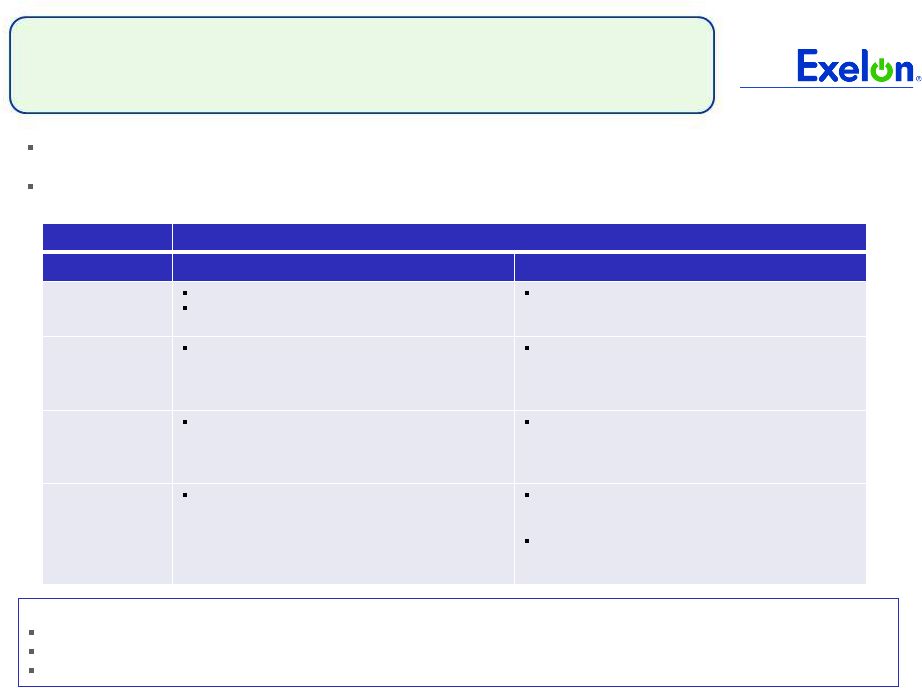
 EPA:
Clean Air Standards 5
Final rules substantially similar to proposed
rules; no significant changes to standards for
existing units
Rule provides sufficient flexibility for
compliance
•
Compliance timeline is three years
•
Some units will be granted a 1 year
extension on a case by case basis
PJM coal plant retirement estimate
unchanged by final rule
•
Expect rule to lead to the retirement
of 15 GW of coal
capacity Rule to be implemented in early 2015
D.C. Court of Appeals granted a stay on the
Cross State Air Pollution Rule (CSAPR)
Court’s recent order demonstrates
commitment to resolve this case on an
expedited basis
CSAPR is not a major driver of coal plant
retirements, as demonstrated by EPA
modeling
Minimal impact to Exelon’s 2012 gross
margin as generation position in PJM is well
hedged
Air Toxics Rule
Cross State Air Pollution Rule
•
Final
briefs
due
by
March
16
th
2012
•
Oral
arguments
on
April
13
th
2012
Air Toxics Rule is still expected to be the more impactful rule to drive coal plant
retirements, and we continue to believe the CSAPR is valid |
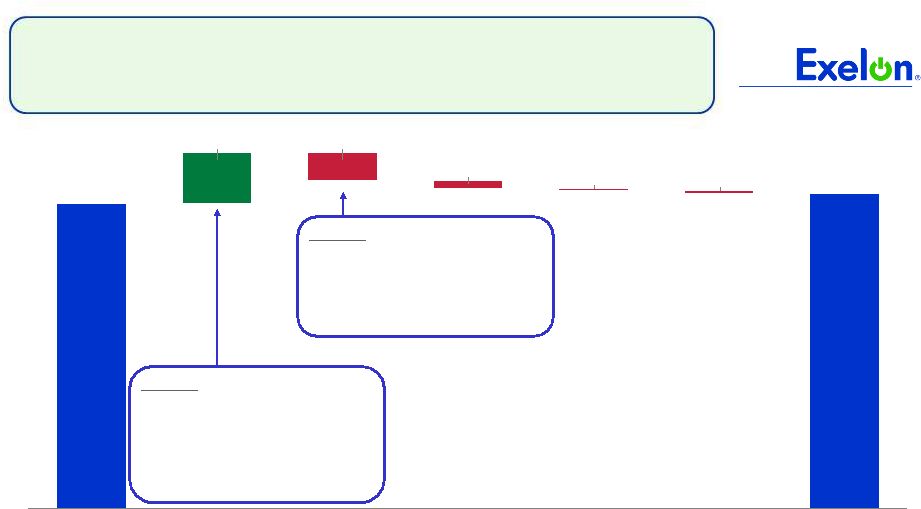
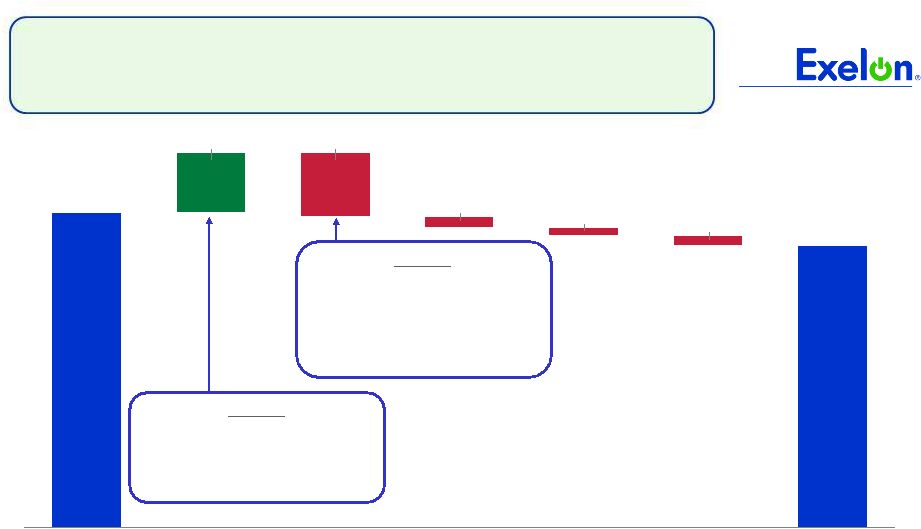
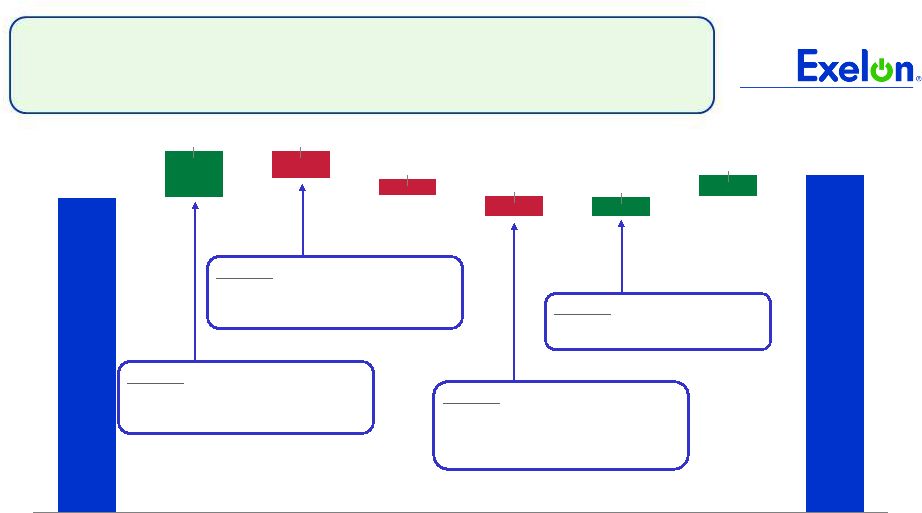
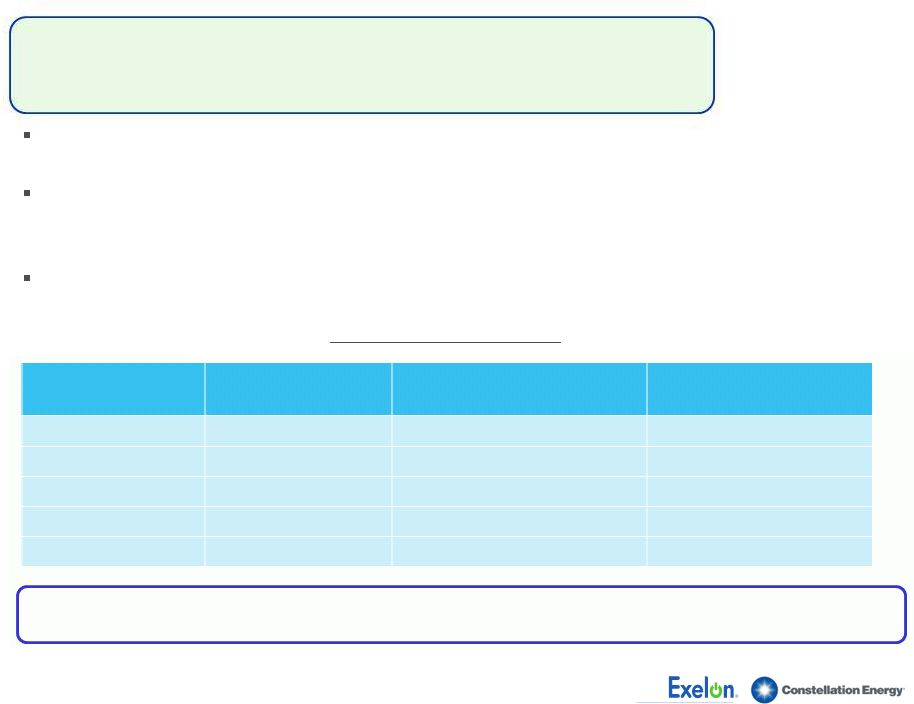
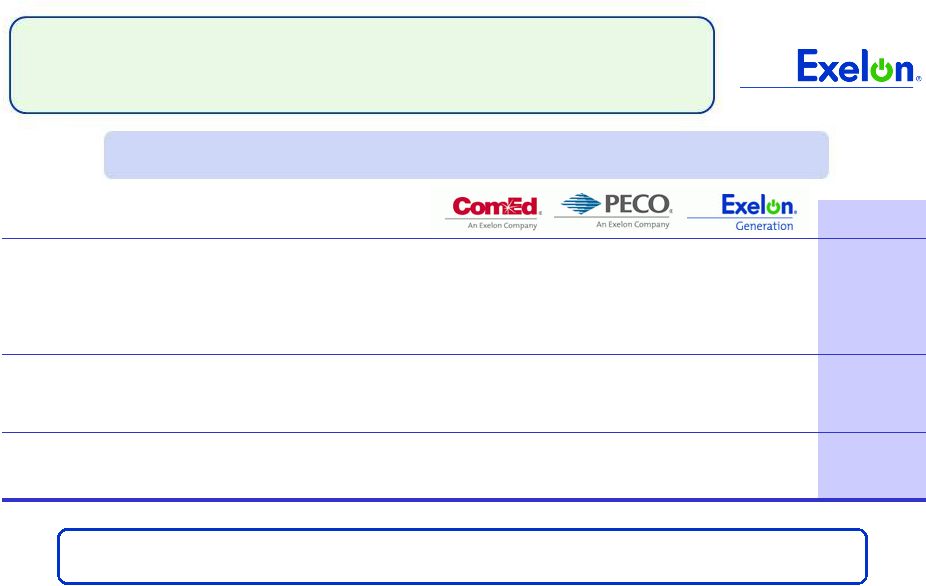
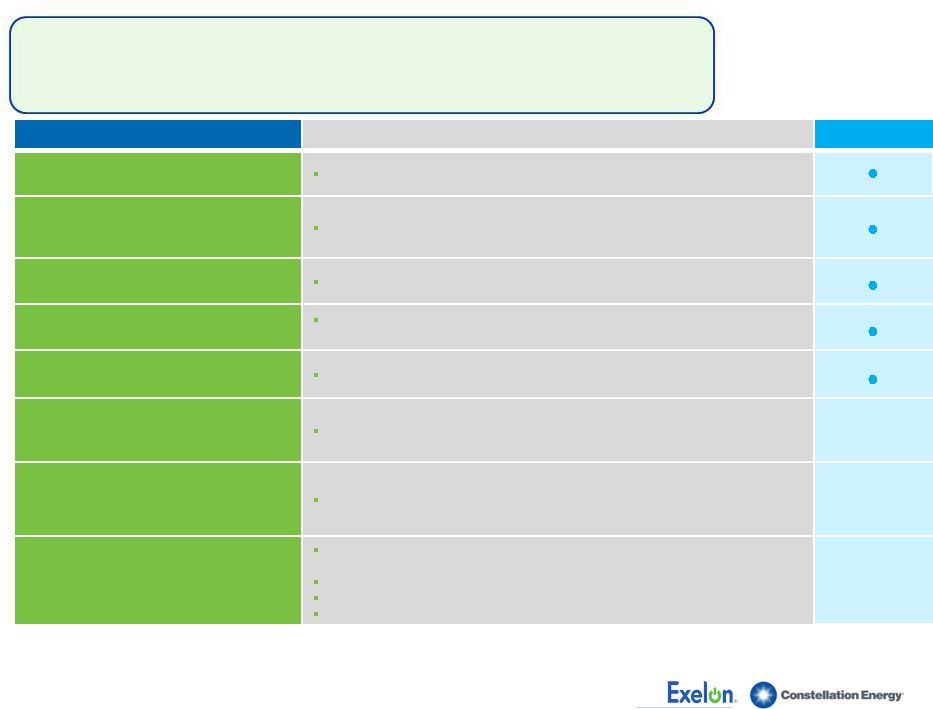 Merger
Approvals Process on Schedule (as of 1/20/2012)
6
Note: The Department of Public Utilities in Massachusetts concluded on September
26, 2011 that it does not have jurisdiction over the merger. Stakeholder
Status of Key Milestones
Approved
Texas PUC
(Case No. 39413)
Approval received on August 3, 2011
Securities and Exchange Commission
(SEC)
(File No. 333-175162)
Joint proxy statement declared effective on October 11, 2011
Shareholder Approval
Shareholders overwhelmingly approved the merger on November 17, 2011
New York PSC
(Case No. 11–E–0245)
Declaratory ruling on December 15, 2011 confirming that Commission review is
not required
Department of Justice (DOJ)
U.S. DOJ clearance received on December 21, 2011
Nuclear Regulatory Commission
(Docket Nos. 50-317, 50-318, 50-220,
50-410, 50-244, 72-8, 72-67)
Filed for indirect transfer of Constellation Energy licenses on May 12, 2011
Federal Energy Regulatory Commission
(FERC)
(Docket No. EC 11-83)
Settlement agreement filed with PJM Market Monitor on October 11, 2011
Maryland PSC
(Case No. 9271)
Settlement agreement reached with key stakeholders in Maryland on
December 15, 2011
Hearings scheduled for January 25 –
27, 2012
Briefs due February 6, 2012
Order expected on February 17, 2012 |
 7
Key Financial Messages
Q4 2011 operating earnings of $0.82 per share
Full year 2011 operating earnings of $4.16 per share
Strong cash flow from operations
Credit metrics above target range across all operating
companies
Disciplined execution of ratable hedge program continues to
create value
Note: Refer to Earnings Release Attachments for additional details and to the
Appendix for a reconciliation of adjusted (non-GAAP) operating EPS to GAAP EPS. |
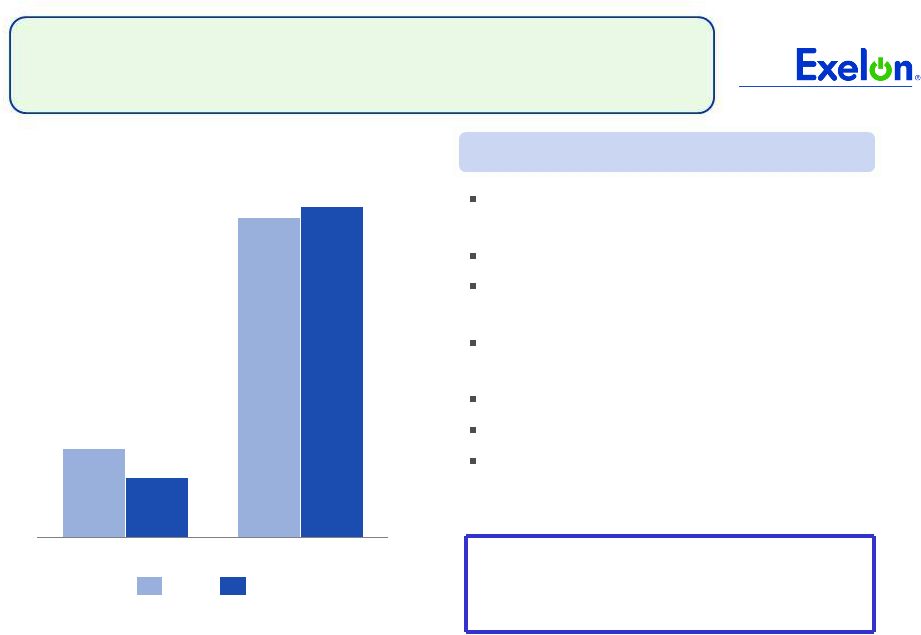 8
Exelon Generation
Operating EPS Contribution
$2.91
$0.81
$3.01
$0.54
Full Year
4Q
2011
2010
Outage Days
(3)
4Q10
4Q11
Refueling
97
103
Non-refueling
18
11
Favorable market/portfolio conditions:
$0.06
(2)
Unfavorable capacity pricing: $(0.13)
Higher O&M costs, including refueling costs
at Salem: $(0.08)
Increased planned nuclear refueling costs:
$(0.02)
Higher nuclear fuel costs: $(0.02)
Higher depreciation expense: $(0.02)
Nuclear volume: $(0.01)
Key Drivers –
4Q11 vs. 4Q10
(1)
(1) Refer to the Earnings Release Attachments for additional details and to the Appendix for a
reconciliation of adjusted (non-GAAP) operating EPS to GAAP EPS.
(2) Favorable market/portfolio conditions includes: $0.03 higher realized prices in the
Mid-Atlantic net of lower realized prices in the Midwest, $0.02 Wind and $0.01 Hydro
volume. (3) Outage days exclude Salem. |
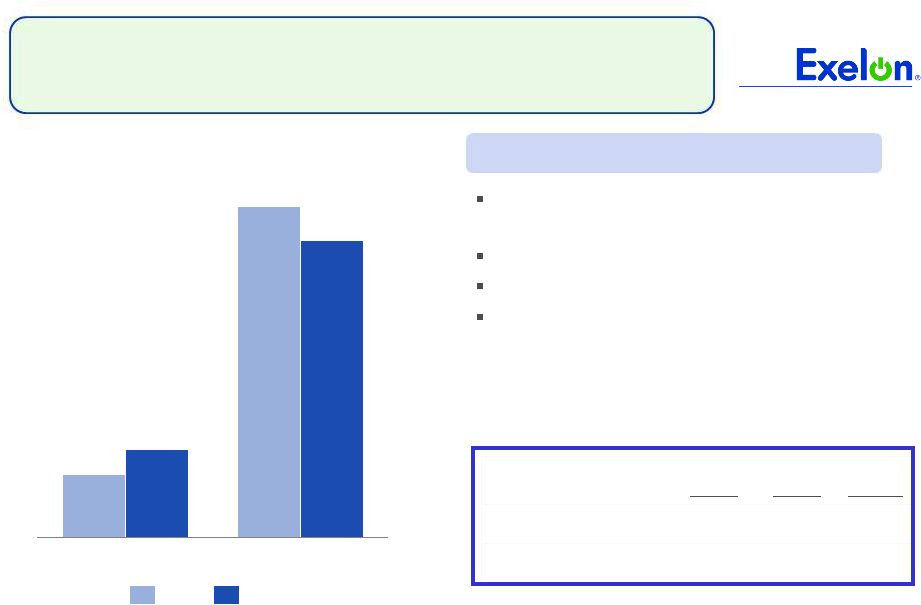 9
ComEd Operating EPS Contribution
$0.68
$0.13
$0.61
$0.18
Full Year
4Q
2011
2010
4Q10
Actual
4Q11
Actual
Normal
Heating Degree-Days
2,292
1,832
2,278
Cooling Degree-Days
15
14
7
Energy Infrastructure Modernization Act,
net
(2)
: $0.06
Electric distribution rates: $0.03
Higher O&M costs: $(0.04)
Weather: $(0.01)
Key Drivers –
4Q11 vs. 4Q10
(1)
(1)
Refer to the Earnings Release Attachments for additional details and to the Appendix for a
reconciliation of adjusted (non-GAAP) operating EPS to GAAP EPS.
(2)
O&M impacts include credit for the allowed recovery of certain 2011 storm costs, partially offset
by a one-time contribution. |
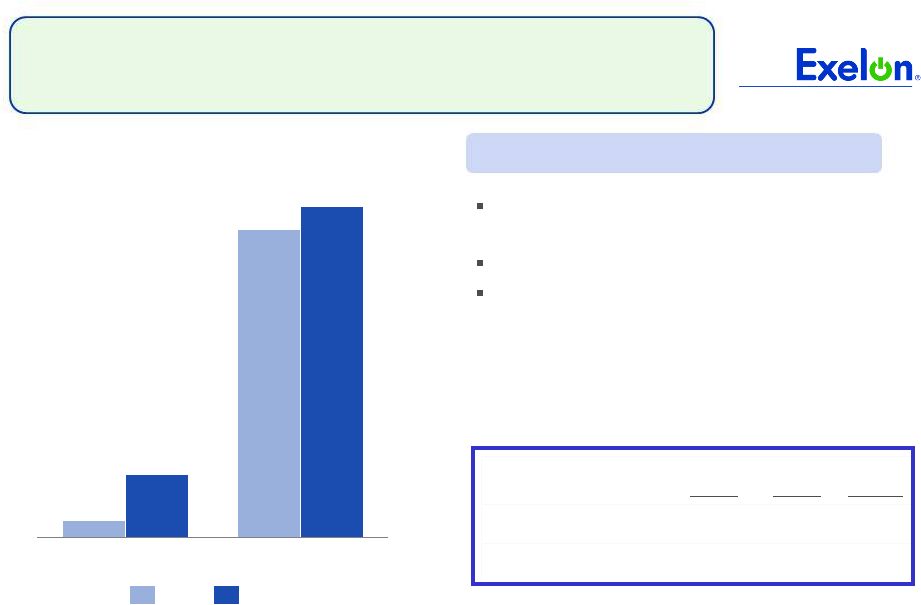 10
PECO Operating EPS Contribution
(1) Refer to the Earnings Release Attachments for additional details and to the
Appendix for a reconciliation of adjusted (non-GAAP) operating EPS to GAAP EPS.
Note: CTC = Competitive Transition Charge
$0.54
$0.03
$0.58
$0.11
Full Year
4Q
2010
2011
4Q10
Actual
4Q11
Actual
Normal
Heating Degree-Days
1,686
1,302
1,634
Cooling Degree-Days
19
14
21
2010 CTC amortization expense, net of
collections: $0.07
Electric and gas distribution rates: $0.04
Weather: $(0.04)
Key Drivers –
4Q11 vs. 4Q10
(1) |
 11
2011 Actual Sources and Uses of Cash
(1)
Excludes counterparty collateral activity.
(2)
Cash Flow from Operations primarily includes net cash flows provided by operating
activities, replacement of credit facilities and net cash flows used in investing activities other than capital
expenditures.
(3)
2011 dividend of $2.10/share. Dividends are subject to declaration by the Board of
Directors. (4)
Includes $350 million in Nuclear Uprates and $250 million for Exelon Wind
spend. (5)
Represents new business, smart grid/smart meter investment and transmission growth
projects. (6)
Excludes PECO’s $225 million Accounts Receivable (A/R) Agreement with Bank of
Tokyo. PECO’s A/R Agreement was extended in accordance with its terms through August 31, 2012.
(7)
“Other”
includes proceeds from options and expected changes in short-term debt.
(8) Includes cash flow activity from Holding Company,
eliminations, and other corporate entities. ($ millions)
Exelon
(8)
Beginning Cash Balance
(1)
$800
Cash Flow from Operations
(2)
800
800
3,475
4,975
CapEx (excluding Nuclear Fuel, Nuclear Uprates, Exelon
Wind and Utility Growth CapEx)
(750)
(350)
(825)
(1,975)
Nuclear Fuel
n/a
n/a
(1,075)
(1,075)
Dividend
(3)
(1,400)
Nuclear Uprates and Exelon Wind
(4)
n/a
n/a
(600)
(600)
Wolf Hollow Acquisition
n/a
n/a
(300)
(300)
Antelope Valley Solar Ranch One Acquisition
n/a
n/a
(75)
(75)
Utility Growth CapEx
(5)
(275)
(125)
n/a
(400)
Net Financing (excluding Dividend):
Debt Issuances
(6)
1,200
--
--
1,200
Debt Retirements
(550)
(250)
--
(800)
Other
(7)
--
(50)
25
200
Ending Cash Balance
(1)
$550 |
 Post-Merger Legal Entity Structure
BGE
•
BGE will exist as a separate subsidiary under Exelon with its current
ring-fenced structure
•
BGE
will
continue
as
a
separate
SEC
registrant
and
will
continue
to
issue
debt
Constellation Energy Group, Inc. (CEG) will be merged into Exelon Corporation
•
CEG subsidiaries, excluding BGE, will then be transferred to Exelon Generation and
become direct wholly-owned subsidiaries of Exelon Generation
•
Exelon Corporation will assume the obligations of CEG’s publicly-held
debt, guarantees and other contracts
Benefits of merging CEG into Exelon
•
Placement at HoldCo provides bondholders with diversity of cash flows from
regulated and unregulated businesses
•
Optimizes funding costs by utilizing the Exelon Generation credit as the primary
financing vehicle for the unregulated business post-merger
•
Simplifies accounting and reporting through elimination of separate CEG SEC
registrant •
No impacts on BGE ring-fencing commitments to Maryland PSC
12 |
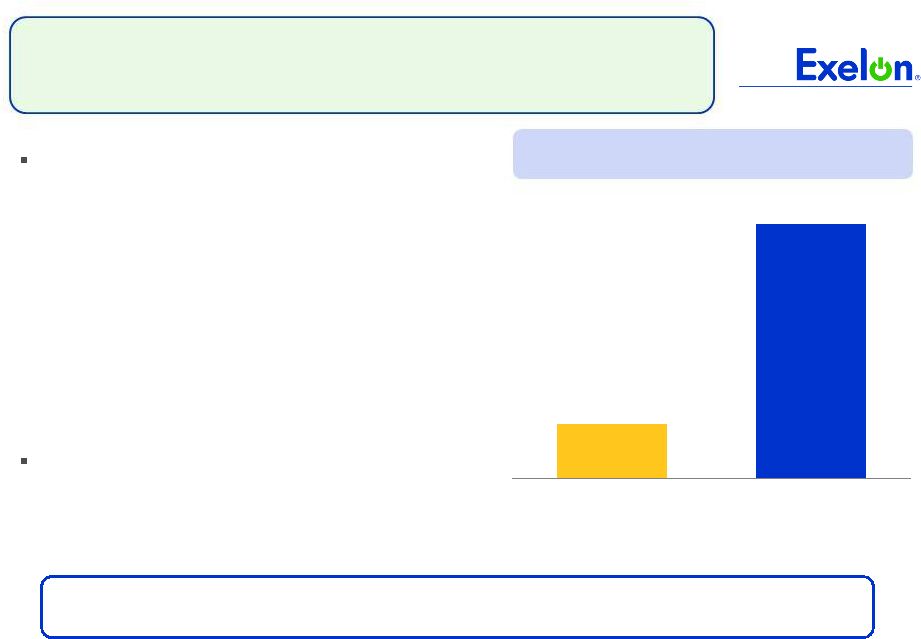
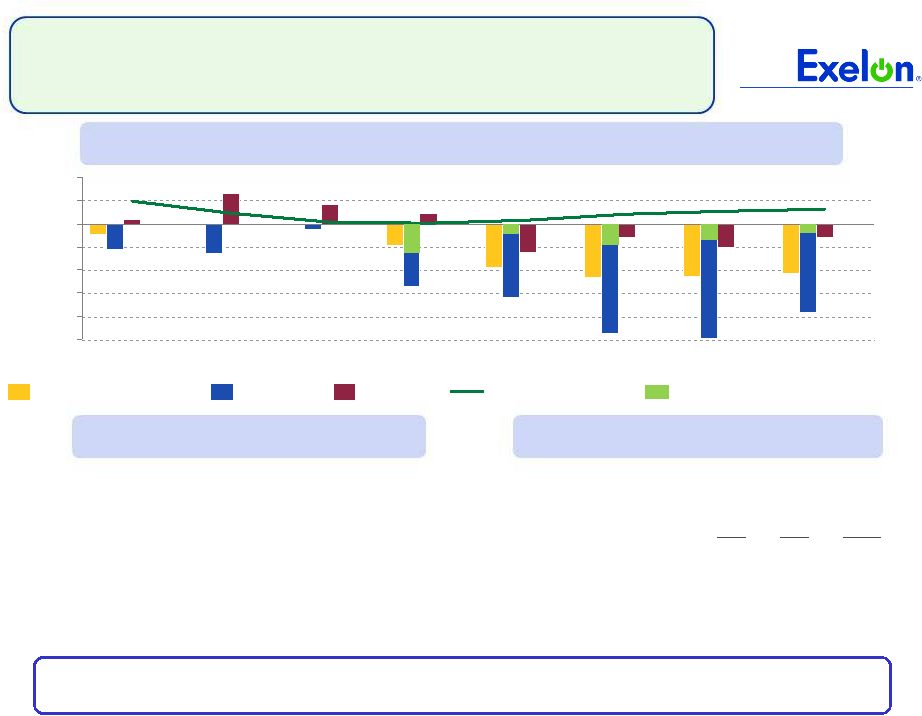
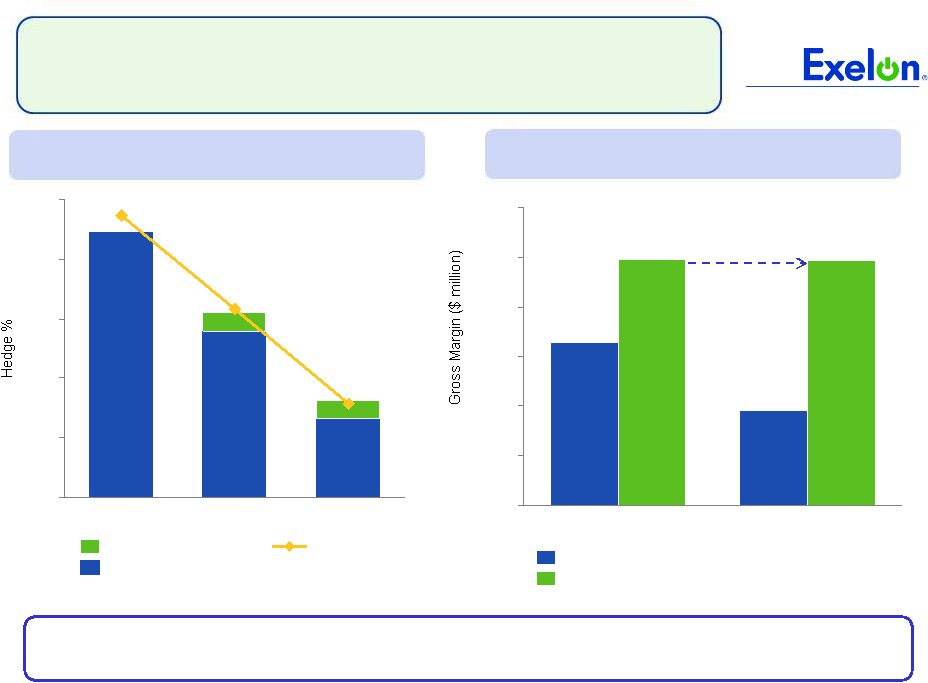 Exelon Generation Hedging Program
Percentage of Expected Generation Hedged
Being close to fully hedged in 2012 has protected us from the recent decline in power
prices 0%
20%
40%
60%
80%
100%
2014
2013
2012
Ratable
% Hedged without Options
Option %
2012 Gross Margin Comparison
(1)
4,450
5,150
3,500
4,000
4,500
5,000
5,500
6,000
6,500
5,965
09/30/2011
5,975
12/31/2011
2012 Hedged Gross Margin ($ millions)
2012 Open Gross Margin
13
(1) Gross Margin estimates are rounded. Open Gross Margin assumes no hedges.
|
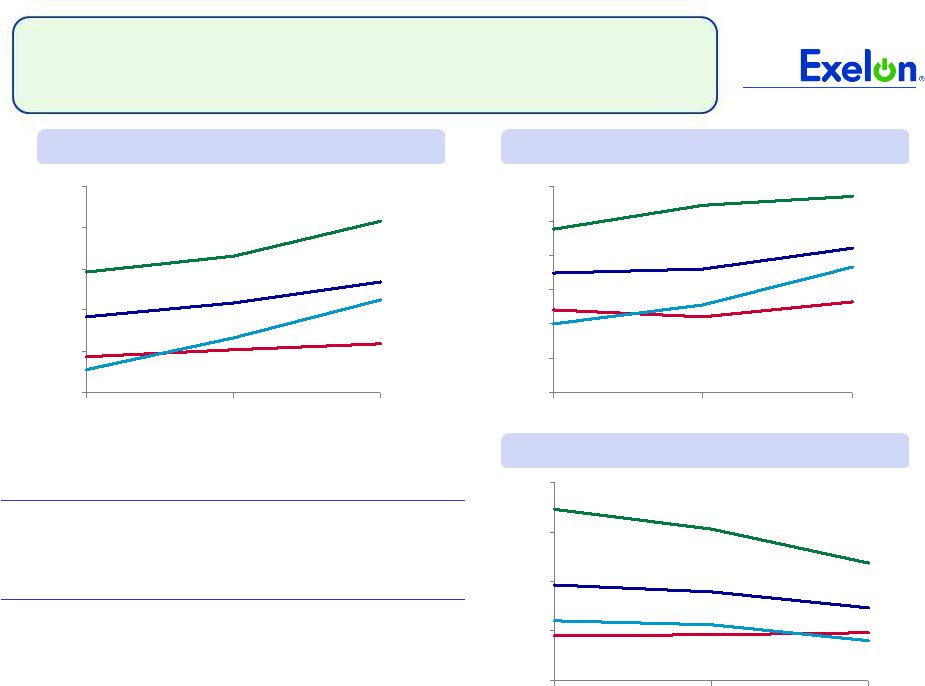
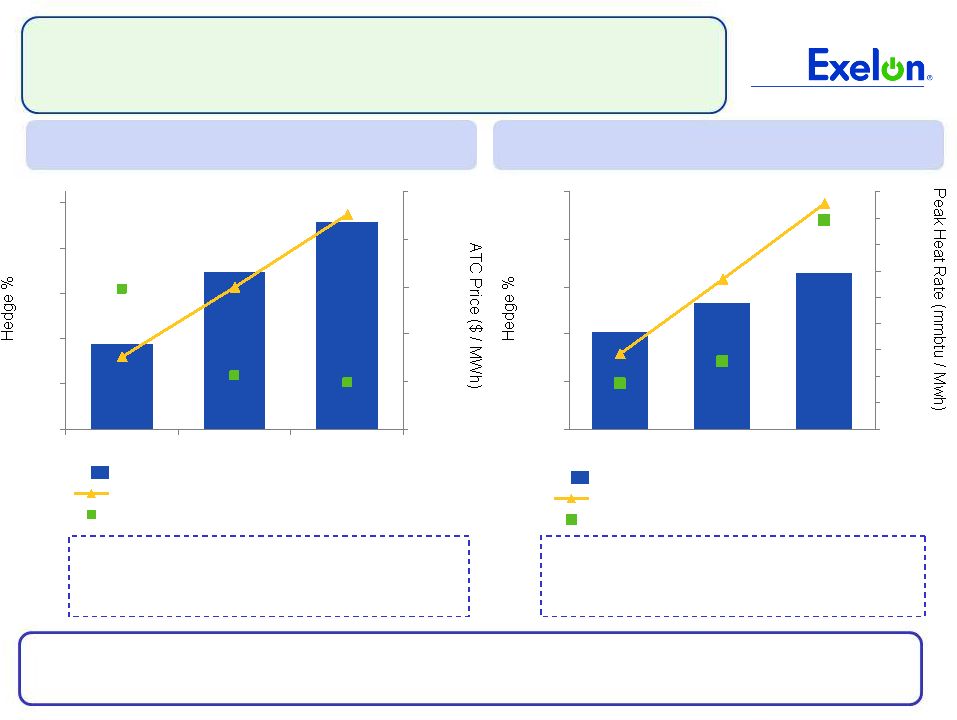 Exelon Generation Hedging Program
As a consequence of being ahead of a ratable pace in
2009 and 2010 in the PJM portfolio we were able to
capture higher market prices and be selective in 2011 by
holding off on sales when prices were low.
2012 Midwest & Mid-Atlantic Hedging
Over the Past Three Years
2012 South & West Hedging
Over the Past Three Years
We have consciously kept more open length in the
South and West region to benefit from increased heat
rates and volatility in the ERCOT market and are well
positioned to capture upside in the spot market.
$54.73
0%
20%
40%
60%
80%
100%
$40.00
$45.00
$50.00
$55.00
$60.00
$65.00
2011
2010
2009
West Hub 2012 ATC Avg Yearly Price
Ratable
2012 Year End Hedge %
9.98
0%
20%
40%
60%
80%
100%
8.40
8.60
8.80
9.00
9.20
9.40
9.60
9.80
10.00
10.20
2011
2010
2009
ERCOT North 2012 On Peak Yearly Avg Heat Rate
Ratable
2012 Year End Hedge %
14
$45.68
$44.91
8.75
8.91
While our three-year ratable hedging program ensures stable cash flows, we continue to use our
market views to create incremental value via timing, product and regional allocations of
sales |
 15
John Rowe’s Key Accomplishments
•
Unicom/PECO merger
Creating Exelon
•
Running nuclear plants at world-class levels
Turning Around Nuclear
•
Vision for a cleaner, more competitive future
Selling ComEd’s
Fossil Fleet
•
Letting competitive markets work
Separating Generation
•
Keeping the lights on
Improving ComEd’s
Service
•
Smooth transition to competitive market, starting with the
2007 settlement
Promoting Competition in Illinois
•
Environmental strategy committed to clean generation
Launching Exelon 2020
•
Maintaining a solid regulatory relationship
Making Pennsylvania Proud
•
PECO’s rate settlement and ComEd’s
infrastructure
legislation
Regulatory Outcomes
•
Cost management, risk management
Maintaining Financial Discipline |
  Exelon Generation Hedging Disclosures
(as of December 31, 2011)
16 |
 17
Important Information
The following slides are intended to provide additional information regarding the hedging
program at Exelon Generation and to serve as an aid for the purposes of modeling Exelon
Generation’s gross margin (operating revenues less purchased power and fuel expense). The
information on the following slides is not intended to represent earnings guidance or a forecast
of future events. In fact, many of the factors that ultimately will determine Exelon
Generation’s actual gross margin are based upon highly variable market factors outside of
our control. The information on the following slides is as of December 31, 2011. We
update this information on a quarterly basis. Certain
information on the following slides is based upon an internal simulation model that incorporates
assumptions regarding future market conditions, including power and commodity prices, heat rates,
and demand conditions, in addition to operating performance and dispatch characteristics of our
generating fleet. Our simulation model and the assumptions therein are subject to
change. For example, actual market conditions and the dispatch profile of our generation
fleet in future periods will likely differ – and may differ significantly – from the
assumptions underlying the simulation results included in the slides. In addition, the
forward- looking information included in the following slides will likely change over time due
to continued refinement of our simulation model and changes in our views on future market
conditions. |
 18
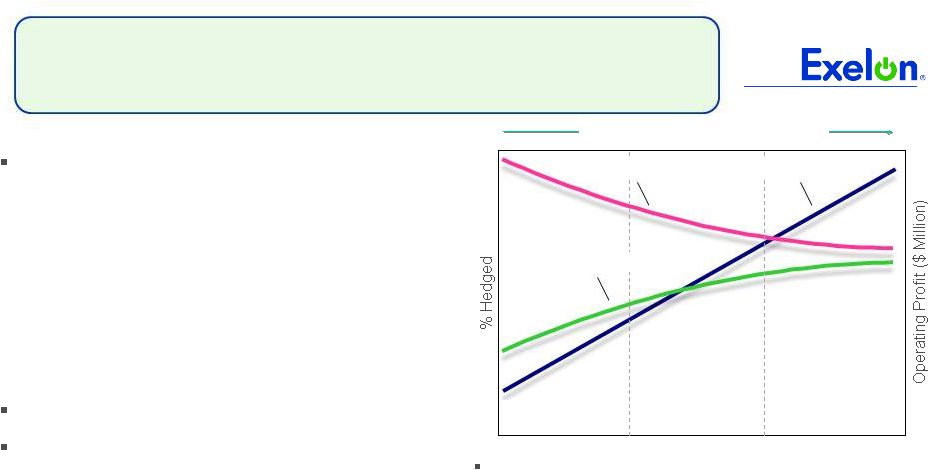
Portfolio Management Objective
Align Hedging Activities with Financial Commitments
Power Team utilizes several product types
and channels to market
•
Wholesale and retail sales
•
Block products
•
Load-following products
and load auctions
•
Put/call options
Exelon’s hedging program is designed to
protect the long-term value of our
generating fleet and maintain an
investment-grade balance sheet
•
Hedge enough commodity risk to meet future cash
requirements if prices drop
•
Consider: financing policy (credit rating objectives,
capital structure, liquidity); spending (capital and
O&M); shareholder value return policy
Consider market, credit, operating risk
Approach to managing volatility
•
Increase hedging as delivery approaches
•
Have enough supply to meet peak load
•
Purchase fossil fuels as power is sold
•
Choose hedging products based on generation
portfolio
–
sell what we own
•
Heat rate options
•
Fuel products
•
Capacity
•
Renewable credits
% Hedged
High End of Profit
Low End of Profit
Open Generation
with LT Contracts
Portfolio
Optimization
Portfolio
Management
Portfolio Management Over Time |
 19
Percentage of Expected
Generation Hedged
•
How many equivalent MW have been
hedged at forward market prices; all hedge
products used are converted to an
equivalent average MW volume
•
Takes ALL
hedges into account whether
they are power sales or financial products
Equivalent MWs Sold
Expected Generation
=
Our normal practice is to hedge commodity risk on a ratable basis
over the three years leading to the spot market
•
Carry operating length into spot market to manage forced outage and
load-following risks
•
By
using
the
appropriate
product
mix,
expected
generation
hedged
approaches
the
mid-90s percentile as the delivery period approaches
•
Participation in larger procurement events, such as utility auctions, and some
flexibility in the timing of hedging may mean the hedge program is not
strictly ratable from quarter to quarter
Exelon Generation Hedging Program |
 20
2012
2013
2014
Estimated Open Gross Margin ($ millions)
(1)(2)
$4,450
$4,950
$5,400
Reference Prices
(1)
Henry Hub Natural Gas ($/MMBtu)
NI-Hub ATC Energy Price ($/MWh)
PJM-W ATC Energy Price ($/MWh)
ERCOT
North
ATC
Spark
Spread
($/MWh)
(3)
$3.24
$29.77
$38.86
$7.29
$3.94
$31.44
$41.26
$6.37
$4.34
$33.15
$43.97
$5.22
Exelon Generation Open Gross Margin and
Reference Prices
(1)
Based on December 31, 2011 market conditions. (2)
Gross margin is defined as operating revenues less fuel expense and purchased power expense, excluding
the impact of decommissioning and other incidental revenues. Open gross
margin is estimated based upon an internal model that is developed by dispatching our expected generation to current market power and fossil
fuel prices. Open gross margin assumes there is no hedging in place other than
fixed assumptions for capacity cleared in the RPM auctions and uranium costs for nuclear power
plants. Open gross margin contains assumptions for other gross margin line items such as various ISO bill and ancillary revenues and costs and PPA
capacity revenues and payments.The estimation of open gross margin incorporates management discretion
and modeling assumptions that are subject to change.
(3)
ERCOT North ATC spark spread using Houston Ship Channel Gas, 7,200 heat rate, $2.50 variable
O&M. |
 21
2012
2013
2014
Expected Generation
(GWh)
(1)
173,100
167,600
166,100
Midwest
99,200
95,800
95,400
Mid-Atlantic
56,800
56,100
55,700
South & West
17,100
15,700
15,000
Percentage
of
Expected
Generation
Hedged
(2)
88-91%
61-64%
32-35%
Midwest
89-92
62-65
30-33
Mid-Atlantic
94-97
66-69
33-36
South & West
65-68
43-46
34-37
Effective Realized Energy Price
($/MWh)
(3)
Midwest
$40.50
$40.00
$37.50
Mid-Atlantic
$50.50
$50.50
$51.00
South & West
$2.00
$3.00
$2.00
Generation Profile
(1)
Expected generation represents the amount of energy estimated to be generated or purchased through
owned or contracted for capacity. Expected generation is based upon a simulated dispatch model
that makes assumptions regarding future market conditions, which are calibrated to market quotes for power, fuel, load following products, and options.
Expected generation assumes 10 refueling outages in 2012 and 2013 and 11 refueling outages in 2014 at
Exelon-operated nuclear plants and Salem. Expected generation assumes capacity
factors of 93.5%, 93.3% and 93.4% in 2012, 2013 and 2014 at Exelon-operated nuclear plants. These estimates of expected generation in 2012, 2013 and 2014 do not
represent guidance or a forecast of future results as Exelon has not completed its planning or
optimization processes for those years. (2)
Percent of expected generation hedged is the amount of equivalent sales divided by the expected
generation. Includes all hedging products, such as wholesale and retail sales of power,
options, and swaps. Uses expected value on options. Reflects decision to permanently retire Cromby Station and Eddystone Units 1&2 as of May 31, 2011.
(3)
Effective realized energy price is representative of an all-in hedged price, on a per MWh basis,
at which expected generation has been hedged. It is developed by considering the energy
revenues and costs associated with our hedges and by considering the fossil fuel that has been purchased to lock in margin. It excludes uranium costs and RPM capacity
revenue, but includes the mark-to-market value of capacity contracted at prices other than RPM
clearing prices including our load obligations. It can be compared with the reference prices
used to calculate open gross margin in order to determine the mark-to-market value of Exelon Generation's energy hedges. |
 22
Gross Margin Sensitivities with Existing Hedges ($ millions)
(1)
Henry Hub Natural Gas
+ $1/MMBtu
-
$1/MMBtu
NI-Hub ATC Energy Price
+$5/MWH
-$5/MWH
PJM-W ATC Energy Price
+$5/MWH
-$5/MWH
Nuclear Capacity Factor
+1% / -1%
2012
$20
$(5)
$40
$(30)
$15
$(15)
+/-
$35
2013
$260
$(230)
$185
$(180)
$115
$(110)
+/-
$40
2014
$600
$(560)
$335
$(330)
$205
$(205)
+/-
$40
Exelon Generation Gross Margin Sensitivities
(with Existing Hedges)
(1)
Based on December 31, 2011 market conditions and hedged position. Gas price sensitivities are based on
an assumed gas-power relationship derived from an internal model that is updated
periodically. Power prices sensitivities are derived by adjusting the power price assumption while keeping all other prices inputs constant. Due to
correlation of the various assumptions, the hedged gross margin impact calculated by aggregating
individual sensitivities may not be equal to the hedged gross margin impact calculated when
correlations between the various assumptions are also considered. |
 23
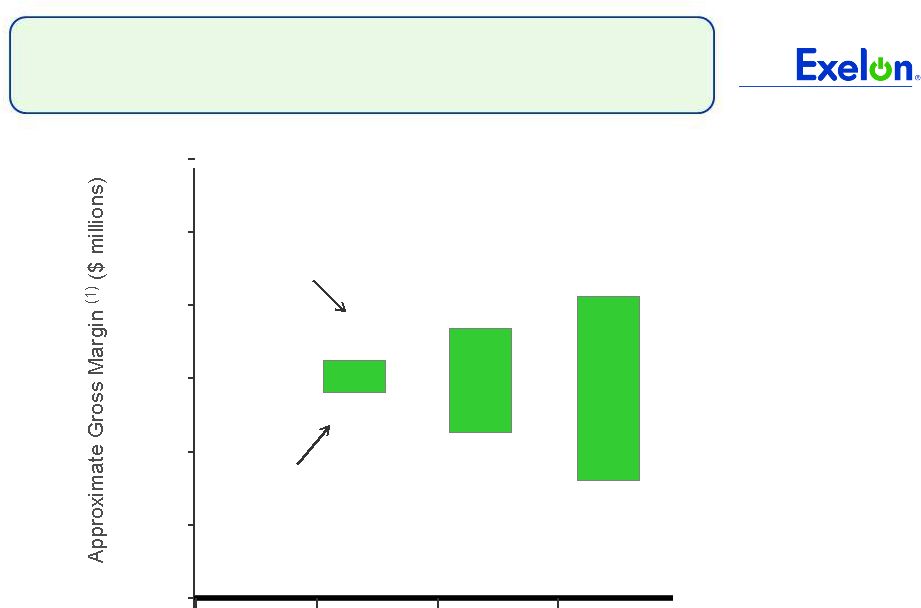
95% case
5% case
$5,300
$6,100
$5,800
$6,400
Exelon Generation Gross Margin Upside / Risk
(with Existing Hedges)
$3,000
$4,000
$5,000
$6,000
$7,000
$8,000
$9,000
2012
2013
2014
$7,000
$4,600
(1)
Represents an approximate range of expected gross margin, taking into account hedges in place, between
the 5th and 95th percent confidence levels assuming all unhedged supply is sold into the spot
market. Approximate gross margin ranges are based upon an internal simulation model and are subject to change based upon market
inputs, future transactions and potential modeling changes. These ranges of approximate gross margin
in 2012 , 2013 and 2014 do not represent earnings guidance or a forecast of future results as
Exelon has not completed its planning or optimization processes for those years. The price distributions that generate this range are calibrated to
market quotes for power, fuel, load following products, and options as of December 31, 2011.
|
 24
Midwest
Mid-Atlantic
South & West
Step 1
Start
with
fleetwide
open
gross
margin
$4.45 billion
Step 2
Determine the mark-to-market value
of energy
hedges
99,200GWh * 90% *
($40.50/MWh-$29.77MWh)
= $0.96 billion
56,800GWh * 94% *
($50.50/MWh-$38.86MWh)
= $0.62 billion
17,100GWh * 66% *
($2.00/MWh-$7.29MWh)
= $(0.06) billion
Step 3
Estimate
hedged
gross
margin
by
adding open gross margin to mark-to-
market value of energy hedges
Open gross
margin: $4.45 billion
MTM
value
of
energy
hedges:
$0.96billion
+
$0.62billion
+
$(0.06)
billion
Estimated hedged gross margin:
$5.97 billion
Illustrative Example
of Modeling Exelon Generation 2012 Gross Margin
(with Existing Hedges) |
 20
25
30
35
40
45
50
55
1/11
2/11
3/11
4/11
5/11
6/11
7/11
8/11
9/11
10/11
11/11
12/11
1/12
30
35
40
45
50
55
60
65
70
1/11
2/11
3/11
4/11
5/11
6/11
7/11
8/11
9/11
10/11
11/11
12/11
1/12
3.0
3.5
4.0
4.5
5.0
5.5
6.0
1/11
2/11
3/11
4/11
5/11
6/11
7/11
8/11
9/11
10/11
11/11
12/11
1/12
65
70
75
80
85
90
95
100
1/11
2/11
3/11
4/11
5/11
6/11
7/11
8/11
9/11
10/11
11/11
12/11
1/12
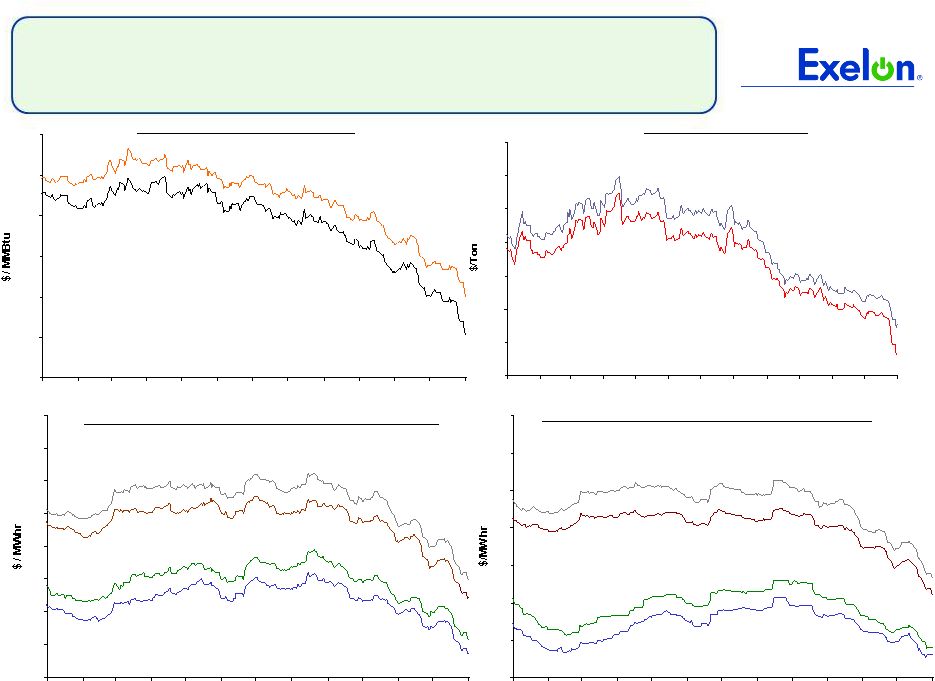
Market Price Snapshot
Forward NYMEX Natural Gas
PJM-West and Ni-Hub On-Peak Forward Prices
PJM-West and Ni-Hub Wrap Forward Prices
2014
$4.01
2013 $3.53
Forward NYMEX Coal
2014
$72.69
2013
$68.44
2013 Ni-Hub $33.58
2014 Ni-Hub
$35.73
2014 PJM-West $44.85
2013 PJM-West
$42.15
2013 Ni-Hub
$23.04
2014 Ni-Hub
$24.05
2014 PJM-West
$33.28
2013 PJM-West
$31.07
25
Rolling
12
months,
as
of
January
18
th
2012.
Source:
OTC
quotes
and
electronic
trading
system.
Quotes
are
daily. |
 6
7
8
9
10
11
12
13
14
15
16
17
1/11
2/11
3/11
4/11
5/11
6/11
7/11
8/11
9/11
10/11
11/11
12/11
1/12
8.6
8.8
9.0
9.2
9.4
9.6
9.8
10.0
10.2
10.4
10.6
10.8
11.0
11.2
11.4
11.6
11.8
12.0
12.2
1/11
2/11
3/11
4/11
5/11
6/11
7/11
8/11
9/11
10/11
11/11
12/11
1/12
35
40
45
50
55
60
65
1/11
2/11
3/11
4/11
5/11
6/11
7/11
8/11
9/11
10/11
11/11
12/11
1/12
3.0
3.5
4.0
4.5
5.0
5.5
6.0
6.5
1/11
2/11
3/11
4/11
5/11
6/11
7/11
8/11
9/11
10/11
11/11
12/11
1/12
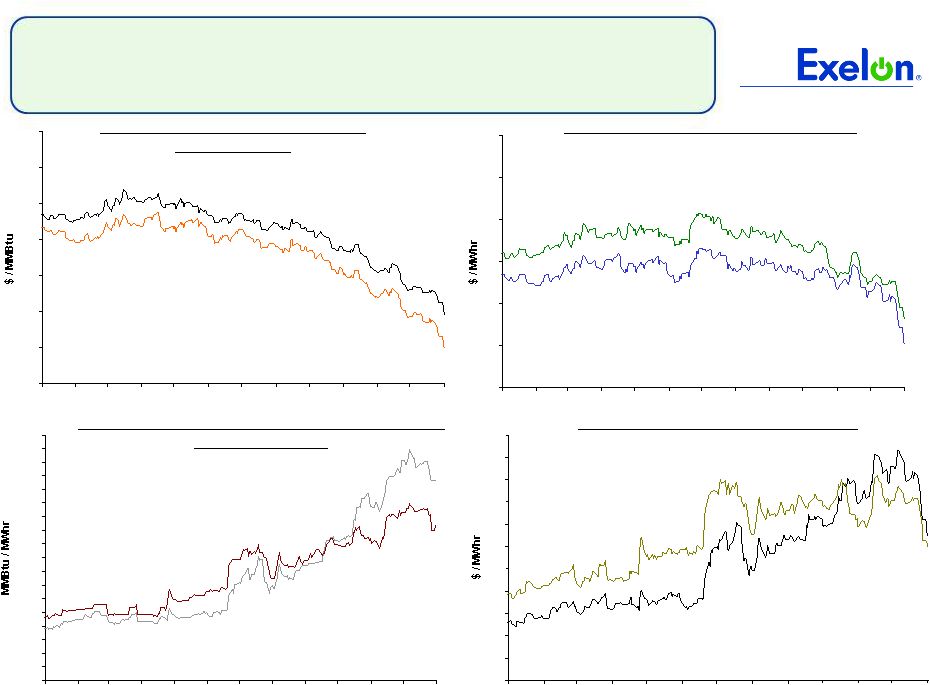
Market Price Snapshot
2014
10.88
2013
11.52
2013
$40.11
2014
$43.10
2013
$3.48
2014
$3.96
Houston Ship Channel Natural Gas
Forward Prices
ERCOT North On-Peak Forward Prices
ERCOT North On-Peak v. Houston Ship Channel
Implied Heat Rate
2013
$12.47
2014
$12.00
ERCOT North On Peak Spark Spread
Assumes a 7.2 Heat Rate, $1.50 O&M, and $.15 adder
26
Rolling
12
months,
as
of
January
18
th
2012.
Source:
OTC
quotes
and
electronic
trading
system.
Quotes
are
daily. |
  27
Appendix |
 2011 results were achieved in a very
challenging market environment due to
effectiveness of asset allocations and
hedging strategy
•
Decreased equity investments and
increased investment in fixed income
securities and alternative investments
•
The liability hedge has offset more than
50% of the pension liability increase
caused by lower interest rates
Pension plans are 83% funded as of
December 31, 2011
Pension Funds Performance
Exelon’s pension investment strategy has effectively dampened the volatility
of plan assets and plan funded status
28
S&P 500
Exelon Pension Assets
2.1%
9.8%
2011 Actual Returns |
 29
Exelon Generation 2011 EPS Contribution
$ / Share
$ 3.01
$ (0.03)
$ (0.01)
$ (0.08)
$ (0.26)
$ 0.49
$ 2.91
Other
RNF
2010A
O&M
2011A
Key Items:
Expiration of PECO PPA
$0.62
Market/portfolio conditions
(1)
$0.25
Unfavorable capacity pricing
($0.23)
Nuclear Fuel
($0.08)
Transmission
Upgrades
(2)
($0.06)
Key Items:
Inflation
($0.08)
Nuclear Outages
($0.05)
Exelon Wind
($0.04)
Higher refueling costs at Salem
($0.02)
Depreciation &
Amortization
Interest
Expense
(1)
Includes $0.15 of favorable market and portfolio conditions in the South and $0.07 related to Exelon
Wind.
(2)
Reflects intercompany expense at Generation for upgrades in transmission assets owned by ComEd, which
are reflected as assets at Exelon. |
 30
ComEd 2011 EPS Contribution
$ / Share
30
$ 0.61
$ (0.02)
$ (0.02)
$ (0.02)
$ (0.14)
$ 0.13
$ 0.68
2011A
Other
O&M
RNF
2010A
Key Items:
Distribution Revenue
(1)
$0.08
Formula Rate Legislation
(2)
$0.03
Transmission Revenue
$0.02
Weather
($0.02)
Key Items:
2010 Bad Debt Recovery
(3)
($0.06)
Inflation
($0.03)
One-time contribution
(4)
($0.01)
Storm costs
(5)
($0.01)
2010 Distribution Rate Case Order
$0.02
(1)
Increased distribution revenue pursuant to the 2011 electric distribution rate case
order, effective June 1, 2011. (2)
Increased distribution revenues as a result of the annual true-up in the
performance based formula rate tariff pursuant to the Energy Infrastructure
Modernization Act (EIMA).
(3)
Reflects a 2010 credit for the recovery of 2008 and 2009 bad debt expense pursuant
to the ICC's February 2010 approval of a bad debt rider, partially offset by
a contribution mandated by Illinois legislation. (4)
Represents a one-time contribution to a new Science and Technology Innovation
Trust accrued pursuant to EIMA. (5)
Includes a $0.04 credit for the allowed recovery of certain 2011
storm costs, net of amortization expense.
Depreciation &
Amortization
Interest
Expense |
 31
PECO 2011 EPS Contribution
$ / Share
$ 0.58
$ 0.04
$ 0.03
$ (0.04)
$ (0.03)
$ (0.05)
$ 0.08
$ 0.54
2011A
Other
Taxes
CTC, net
O&M
RNF
2010A
Key Items:
Electric & Gas Distribution Rate
(1)
$0.15
Weather
($0.05)
Key Items:
Storm costs
($0.01)
Inflation
($0.02)
(1)
Reflects increased distribution revenue pursuant to the 2010 Pennsylvania electric
and natural gas distribution rate case settlements effective January 1,
2011.
(2)
Includes associated gross receipts taxes.
Key Items:
Revenue net of amortization
(2)
($0.06)
Interest on PECO transition
$0.02
bonds
Key Items:
T&D
tax repairs deductions $0.05
Depreciation &
Amortization |
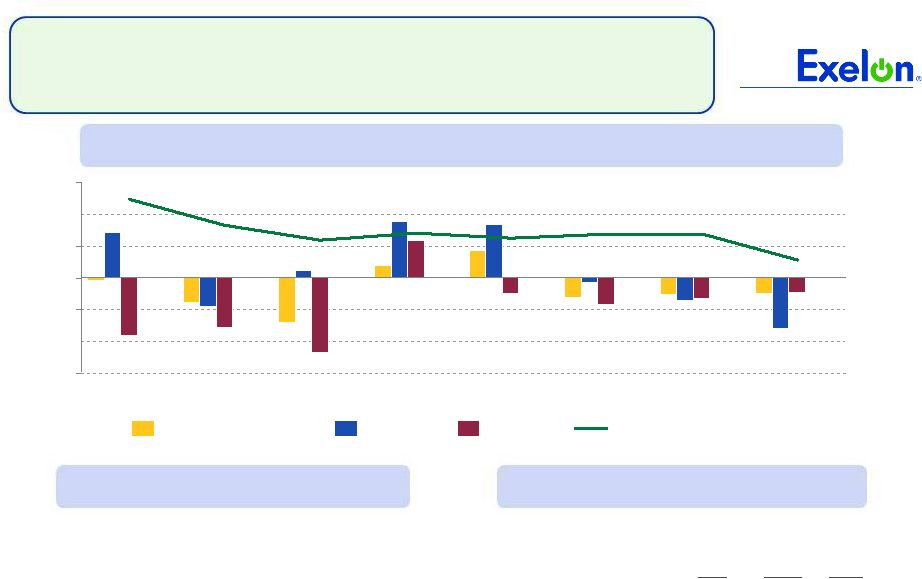 ComEd
Load Trends -3%
-2%
-1%
0%
1%
2%
3%
3Q11
2Q11
1Q11
4Q12
3Q12
2Q12
1Q12
4Q11
Residential
Gross Metro Product
All Customer Classes
Large C&I
Note: C&I = Commercial & Industrial
Chicago
U.S.
Unemployment rate
(1)
10.5%
8.5%
2011 annualized growth in
gross
domestic/metro
product
(2)
1.7%
1.8%
(1)
Source: U.S. Dept. of Labor (December 2011) and Illinois
Department of Security (November 2011)
(2)
Source: Global Insight (November 2011)
(3)
Not adjusted for leap year
4Q11
2011 2012E
(3)
Average Customer Growth
0.3%
0.4%
0.4%
Average Use-Per-Customer
0.9%
(1.7)%
(1.0)%
Total Residential
1.2%
(1.3)% (0.6)%
Small C&I
(1.2)%
(0.8)%
0.0%
Large C&I
1.8%
0.6%
(0.2)%
All Customer Classes
0.4%
(0.5)%
(0.2)%
32
Weather-Normalized Load Year-over-Year
Key Economic Indicators
Weather-Normalized Load |
 PECO
Load Trends Note: C&I = Commercial & Industrial
-12.5%
-10.0%
-7.5%
-5.0%
-2.5%
0.0%
2.5%
5.0%
4Q12
3Q12
2Q12
1Q12
4Q11
3Q11
2Q11
1Q11
Gross Metro Product
Residential
Large C&I
All Customer Classes
Philadelphia
U.S.
Unemployment rate
(1)
7.9%
8.5%
2011 annualized growth in
gross domestic/metro product
(2)
0.9%
1.8% (1)
Source:
U.S.
Dept.
of
Labor
data
(December
2011)
–
US
U.S.
Dept.
of
Labor
prelim.
data
(November
2011)
–
Philadelphia
(2)
Source: Global Insight (November 2011)
(3)
Not adjusted for leap year
4Q11
2011 2012E
(3)
Average Customer Growth
0.3%
0.3%
0.4%
Average Use-Per-Customer
0.9%
1.3%
(2.5)%
Total Residential
1.1%
1.7% (2.2)%
Small C&I
0.3%
(0.7)%
(1.7)%
Large C&I
(6.8)%
(3.3)% (10.5)%
All Customer Classes
(2.2)%
(0.9)%
(5.4)%
Large C&I (excluding refinery impact)
Oil refinery closing estimated impact to reduce Large C&I and total load in 2012
by 9.1% and 3.7%, respectively
33
Weather-Normalized Load Year-over-Year
Key Economic Indicators
Weather-Normalized Load |
 Maryland Settlement Summary
34
Settlement agreement with State of Maryland, City of Baltimore and other
key parties increases value of merger package to more than $1 billion
Package
includes
285
–
300
MW
of
new
generation
in
Maryland
•
120 MW of natural gas generation
•
125
MW
of
Tier
1
renewable
generation,
of
which
at
least
62.5
MW
will
be
wind
generation
•
30 MW of solar energy
•
10 -
25 MW of generation capacity from poultry litter
Significant benefits to the state and customers
•
$100 credit to each residential customer
•
Construction of LEED office building in Baltimore
•
$50M funding for low income weatherization measures
•
$32M funding for offshore wind research and development in Maryland
Commitments to preserve BGE as a leading Maryland company
•
Maintain capital and O&M spend and no dividend contributions to parent through
2014 •
Maintain investment in smart meters, reliability and other key initiatives
|
 35
Exelon Dividend
Exelon’s Board of Directors approved a contingent stub dividend for Exelon
shareholders of $0.00583/share
per
day
for
Q2
2012
in
anticipation
of
the
merger
close
($0.525/share
for
the
quarter)
Stub dividend declaration ensures that Exelon shareholders continue to receive all
dividends at the current $2.10 per share annualized rate
Pre-
and post-close stub dividends must be declared separately to account for
Constellation shareholders becoming Exelon shareholders at merger
close Assuming
a
February
29,
2012
close
for
illustrative
purposes
only:
(1)
Assuming a 2/29/2012 merger close; for Exelon shareholders, Q2 2012 dividend will
be based on a per diem rate of $0.00583 ($0.525 divided by 90 days).
(2)
Future dividend, following the stub dividend, is subject to approval by the Board
of Directors. $0.525
Record Date
Payment Date
Dividend Type
Per Share Amount
2/15/2011
3/9/2011
Regular Dividend
$0.525
2/28/2012
3/28/2012
Pre-
close
Stub
Dividend
(1)
$0.076
5/15/2012
6/8/2012
Post-
close
Stub
Dividend
(1)
$0.449
8/15/2012
9/10/2012
Regular
Dividend
(2)
$0.525
11/15/2012
12/10/2012
Regular
Dividend
(2)
$0.525
Current Exelon shareholders will continue to receive a total dividend of
$0.525 per quarter |
 36
Constellation Energy’s Board of Directors approved a contingent stub dividend
for Constellation shareholders of $0.00264/share per day for Q1 2012 in
anticipation of merger close Stub dividend declaration ensures that
Constellation shareholders continue to receive their existing quarterly
dividend rate prior to the merger, and benefit from the Exelon annualized dividend rate
($2.10 per share) beginning on the day the merger closes
Pre-
and post-close stub dividends must be declared separately to account for
Constellation shareholders becoming Exelon shareholders at merger
close Assuming
a
February
29,
2012
close
for
illustrative
purposes
only
:
(1)
Assuming a 2/29/2012 merger close, Q1 2012 dividend will be based on a per diem
rate of $0.00264 ($0.24 divided by 91 days). Post-close
Exelon
Q2
2012
stub
dividend
will
be
based
on
a
per
diem
rate
of
$0.00583.
(2)
Assuming a 2/29/2012 merger close, Constellation shareholders will start receiving
the full quarterly Exelon dividend of $0.525
per
share
in
Q3
2012.
Future
dividend,
following
the
stub
dividend,
is
subject
to
approval
by
the
Board
of
Directors.
Constellation Dividend
Record Date
Payment Date
Dividend Type
Per Share Amount
12/12/2011
1/3/2012
Regular CEG Dividend
$0.24
2/28/2012
3/28/2012
Pre-
close
CEG
Stub
Dividend
(1)
$0.206
5/15/2012
6/8/2012
Post-
close EXC Stub Dividend
(1)
$0.449
8/15/2012
9/10/2012
Regular EXC Dividend
(2)
$0.525
11/15/2012
12/10/2012
Regular Dividend
(2)
$0.525
Constellation shareholders will receive the Exelon dividend rate upon merger
close |
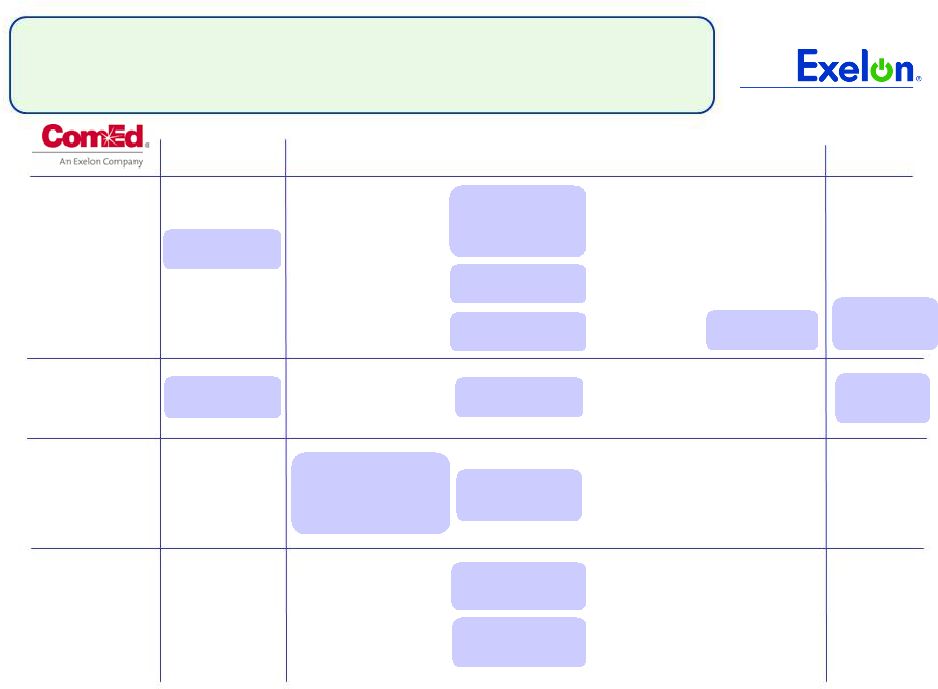 37
ComEd –
Regulatory Schedule for 2012
Q1
Q2
Q3
Q4
Initial filing with
ICC (11/8/11)
Proposed order
(around 5/1);
Final order
(by 5/31)
Procurements
for
ATC
supply
and
RECs
for
6/1/13-
12/31/17
(by
end
of
February)
Q4 2011
Distribution
Formula Rate
(Docket # 11-0721)
Performance
Metrics
(Docket # 11-0772)
Illinois Power
Agency
Procurement
Transmission
Rate Update
Annual update
filing with FERC
(5/15)
Rates effective
(June 2012 thru
May 2013)
Rates effective
June thru Dec.
Filing with ICC
(12/8/11)
Final order
(by 4/6)
Second filing with
ICC (by 5/1)
Rates
effective Jan.
thru Dec.
Regular annual
procurement
event (Spring)
Note: ICC = Illinois Commerce Commission; FERC = Federal Energy Regulatory
Commission; ATC = around-the-clock; REC = renewable energy credit
Final order
(by 12/27)
Annual
updates (by
6/1)
2013 |
 38
PECO –
Default Service Plan Filing (DSP II)
(1) FR = Full Requirements; (2) FPFR = Fixed-Price Full
Requirements Proposed Procurement Mix
Class
DSP I (1/1/11
–
5/31/13)
DSP II (6/1/13
–
5/31/15)
Large C&I
Current load
retained: 4%
100% spot-priced FR
(1)
products
2011 opt-in FPFR
(2)
product
100% of supply procured directly from the PJM spot
market
Medium
Commercial
Current load
retained: 22%
85% 1-year FPFR products, 15% spot-priced FR
products
100% 6-month FPFR products
Small
Commercial
Current load
retained: 48%
70% 1-year FPFR products, 20% 2-year FPFR
products, 10% spot-priced FR products
100% 1-year FPFR products
Residential
Current load
retained: 75%
45% 2-year FPFR products; 30% 1-year FPFR
products; targeted 20% block products of 1-yr, 2-yr,
5-yr and seasonal terms; targeted 5% spot market
purchases
As block products expire, block and spot is replaced
by FPFR products with terms ending 5/31/15 (end of
DSP II period)
Remainder of portfolio is a mix of 2-yr and 1-yr FPFR
products, with delivery periods overlapping on a semi-
annual basis
Filing Schedule:
On 1/13/12, PECO filed a new Default Service Plan with the PAPUC, which outlines
how PECO will purchase electricity for customers not purchasing from a
competitive generation supplier from 6/1/13 through 5/31/15 PAPUC will assign
an Administrative Law Judge to set a procedural schedule with a Final Order requested no later
than mid-October 2012
Note: PAPUC = Pennsylvania Public Utility Commission
Incorporates Retail Market Enhancements suggested by PAPUC Order
issued 12/15/11:
Offers a 1-year opt-in auction program with price at least 5% less than
PECO’s expected Price to Compare as of 6/1/13 Establishes a residential
customer referral program to promote the lowest 1-year, fixed price available each month
Provides
customer
information
and
referral
programs
for
various
products;
“seamless”
moves
between
properties |
 Sufficient Liquidity
($ millions)
Exelon
(3)
Aggregate
Bank
Commitments
(1)
$1,000
$600
$5,600
$7,700
Outstanding Facility Draws
--
--
--
--
Outstanding Letters of Credit
(1)
(1)
(884)
(894)
Available
Capacity
Under
Facilities
999
599
4,716
6,806
Outstanding Commercial Paper
--
--
--
(136)
Available Capacity Less Outstanding
Commercial Paper
$999
$599
$4,716
$6,670
Exelon bank facilities are largely untapped
39
(1) Excludes commitments from Exelon’s Community and Minority Bank Credit
Facility. (2) Available Capacity Under Facilities represents the unused bank
commitments under the borrower’s credit agreements net of outstanding letters of credit and
facility draws. The amount of commercial paper outstanding does not reduce the
available capacity under the credit agreements. (3) Includes Exelon
Corp’s $500M credit facility, letters of credit and commercial paper outstanding.
Available Capacity Under Bank Facilities as of January 17, 2012
(2) |
 Key
Credit Metrics Moody’s Credit
Ratings
(2) (3)
S&P Credit
Ratings
(2) (3)
Fitch Credit
Ratings
(2) (3)
FFO / Debt
Target
Range
Exelon:
Baa1
BBB-
BBB+
ComEd:
Baa1
A-
BBB+
15-18%
PECO:
A1
A-
A
15-18%
Generation:
A3
BBB
BBB+
30-35%
(4)
10%
20%
30%
40%
50%
60%
Exelon
PECO
ComEd
2011A
2010A
2009A
0X
2X
4X
6X
8X
10X
12X
Exelon
PECO
ComEd
2011A
2010A
2009A
40%
50%
60%
70%
80%
Exelon
PECO
ComEd
2011A
2010A
2009A
FFO/Debt
(1)
Interest Coverage
(1)
Debt to Cap
(1)
40
(1)
See slide 41 for reconciliations to GAAP.
(2)
Current senior unsecured ratings for Exelon and Exelon Generation and senior
secured ratings for ComEd and PECO as of January 20, 2012.
(3)
Moody’s placed Exelon and Generation under review for a possible downgrade
after the proposed merger with Constellation Energy was announced. S&P
and Fitch affirmed ratings of Exelon and subsidiaries after the proposed
merger was announced. (4)
FFO/Debt Target Range reflects Generation FFO/Debt in addition to the debt
obligations of Exelon Corp. Range represents FFO/Debt to maintain current
ratings at current business risk. ExGen/
Corp
ExGen/
Corp
ExGen/
Corp |
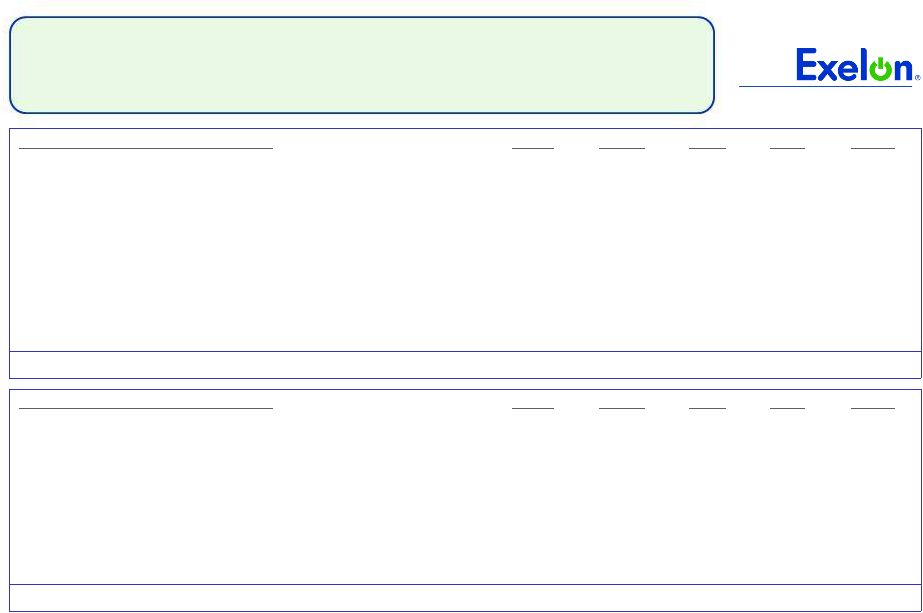
 Exelon Consolidated Metric Calculations and Ratios
Exelon 2010 YE Adjustments
FFO Calculation
2010 YE
Source - 2010 Form 10-K (.pdf version)
Net Cash Flows provided by Operating Activities
5,244
Pg 159 - Stmt. of Cash Flows
+/- Change in Working Capital
644
Pg 159 - Stmt. of Cash Flows
(1)
- PECO Transition Bond Principal Paydown
(392)
Pg 174 - Stmt. of Cash Flows
(2)
+ PPA Depreciation Adjustment
207
Pg 295 - Commitments and Contingencies
(3)
+/- Pension/OPEB Contribution Normalization
448
Pg 268-269 - Post-retirement Benefits
(4)
+ Operating Lease Depreciation Adjustment
35
Pg 299 - Commitments and Contingencies
(5)
+/- Decommissioning activity
(143)
Pg 159- Stmt. of Cash Flows
+/- Other Minor FFO Adjustments
(6)
(54)
= FFO (a)
5,989
Debt Calculation
Long-term Debt (incl. Current Maturities and A/R agreement)
12,828
Pg 161 - Balance Sheet
Short-term debt (incl. Notes Payable / Commercial Paper)
- Pg 161 - Balance Sheet
- PECO Transition Bond Principal Paydown
- N/A - no debt outstanding at year-end
+ PPA Imputed Debt
1,680
Pg 295 - Commitments and Contingencies
(7)
+ Pension/OPEB Imputed Debt
3,825
Pg 268 - Post-retirement benefits
(8)
+ Operating Lease Imputed Debt
428
Pg 299 - Commitments and Contingencies
(9)
+ Asset Retirement Obligation
- Pg 261-267 - Asset Retirement Obligations
(10)
+/- Other Minor Debt Equivalents
(11)
84
= Adjusted Debt (b)
18,845
Interest Calculation
Net Interest Expense
817
Pg 158 - Statement of Operations
- PECO Transition Bond Interest Expense
(22)
Pg 182 - Significant Accounting Policies
+ Interest on Present Value (PV) of Operating Leases
29
Pg 299 - Commitments and Contingencies
(12)
+ Interest on PV of Purchased Power Agreements (PPAs)
99
Pg 295 - Commitments and Contingencies
(13)
+/- Other Minor Interest Adjustments
(14)
37
= Adjusted Interest (c)
960
Equity Calculation
Total Equity
13,563
Pg 161 - Balance Sheet
+ Preferred Securities of Subsidaries
87
Pg 161 - Balance Sheet
+/- Other Minor Equity Equivalents
(15)
111
= Adjusted Equity (d)
13,761
(1)
Includes changes in A/R, Inventories, A/P and other accrued expenses, option
premiums, counterparty collateral and income taxes. Impact to FFO is
opposite of impact to cash flow (2)
Reflects retirement of variable interest entity + change in restricted cash
(3)
Reflects
net
capacity
payment
–
interest
on
PV
of
PPAs
(using
weighted
average
cost
of
debt)
(4)
Reflects
employer
contributions
–
(service
costs
+
interest
costs
+
expected
return
on
assets),
net
of
taxes at 35%
(5)
Reflects
operating
lease
payments
–
interest
on
PV
of
future
operating
lease
payments
(using
weighted average cost of debt)
(6)
Includes AFUDC / capitalized interest
(7)
Reflects PV of net capacity purchases (using weighted average cost of debt)
$ in millions
(8)
Reflects unfunded status, net of taxes at 35%
(9)
Reflects PV of minimum future operating lease payments (using weighted average cost
of debt) (10)
Nuclear decommissioning trust fund balance > asset retirement obligation.
No debt imputed (11)
Includes accrued interest less securities qualifying for hybrid treatment (50% debt
/ 50% equity) (12)
Reflects interest on PV of minimum future operating lease payments (using weighted
average cost of debt)
(13)
Reflects interest on PV of PPAs (using weighted average cost of debt)
(14)
Includes
AFUDC
/
capitalized
interest
and
interest
on
securities
qualifying
for
hybrid
treatment
(50% debt / 50% equity)
(15)
Includes interest on securities qualifying for hybrid treatment (50% debt / 50%
equity) 2010A Credit Metrics
41
FFO / Debt Coverage =
FFO (a)
Adjusted Debt (b)
FFO Interest Coverage =
FFO (a) + Adjusted Interest (c)
Adjusted Interest (c)
Adjusted Capitalization (e) =
Adjusted Debt (b) + Adjusted Equity (d)=
32,606
Rating Agency Debt Ratio =
Adjusted Debt (b)
Adjusted Capitalization (e)
32%
7.2x
58%
=
=
= |
 42
4Q GAAP EPS Reconciliation
Three Months Ended December 31, 2011
ExGen
ComEd
PECO
Other
Exelon
2011 Adjusted (non-GAAP) Operating Earnings (Loss) Per Share
$0.54
$0.18
$0.11
$(0.02)
$0.82
Mark-to-market adjustments from economic hedging activities
0.07
-
-
-
0.07
Unrealized gains related to nuclear decommissioning trust funds
0.07
-
-
-
0.07
Retirements of fossil generation units
(0.01)
-
-
-
(0.01)
Constellation acquisition costs
(0.01)
-
(0.00)
(0.02)
(0.03)
Non-cash remeasurement of deferred income taxes
0.01
-
-
(0.02)
(0.01)
4Q 2011 GAAP Earnings (Loss) Per Share
$0.67
$0.18
$0.11
$(0.05)
$0.91
Note:
All amounts shown are per Exelon share and represent contributions to Exelon's EPS.
Amounts may not add due to rounding. Three Months Ended December 31, 2010
ExGen
ComEd
PECO
Other
Exelon
2010 Adjusted (non-GAAP) Operating Earnings (Loss) Per Share
$0.81
$0.13
$0.03
$(0.01)
$0.96
Mark-to-market adjustments from economic hedging activities
(0.17)
-
-
-
(0.17)
2007 Illinois electric rate settlement
(0.01)
-
-
-
(0.01)
Unrealized gains related to nuclear decommissioning trust funds
0.04
-
-
-
0.04
Retirements of fossil generation units
(0.03)
-
-
-
(0.03)
Exelon Wind acquisition costs
(0.01)
-
-
-
(0.01)
Asset retirement obligation
-
0.01
-
-
0.01
4Q 2010 GAAP Earnings (Loss) Per Share
$0.63
$0.14
$0.03
$(0.01)
$0.79 |
 43
Full Year GAAP EPS Reconciliation
Twelve Months Ended December 31, 2011
ExGen
ComEd
PECO
Other
Exelon
2011 Adjusted (non-GAAP) Operating Earnings (Loss) Per Share
$3.01
$0.61
$0.58
$(0.05)
$4.16
Mark-to-market adjustments from economic hedging activities
(0.27)
-
-
-
(0.27)
Unrealized losses related to nuclear decommissioning trust funds
(0.00)
-
-
-
(0.00)
Retirement of fossil generating units
(0.05)
-
-
-
(0.05)
Asset retirement obligation
(0.03)
-
0.00
-
(0.02)
Constellation acquisition costs
(0.01)
-
(0.00)
(0.06)
(0.07)
AVSR 1 acquisition costs
(0.01)
-
-
-
(0.01)
Non-cash charge resulting from Illinois tax rate change legislation
(0.03)
(0.01)
-
(0.00)
(0.04)
Wolf Hollow acquisition
0.03
-
-
-
0.03
Recovery of costs pursuant to distribution rate case order
-
0.03
-
-
0.03
Non-cash remeasurement of deferred income taxes
0.01
-
-
(0.02)
(0.01)
FY 2011 GAAP Earnings (Loss) Per Share
$2.66
$0.63
$0.58
$(0.12)
$3.75
Twelve Months Ended December 31, 2010
ExGen
ComEd
PECO
Other
Exelon
2010 Adjusted (non-GAAP) Operating Earnings (Loss) Per Share
$2.91
$0.68
$0.54
$(0.07)
$4.06
Mark-to-market adjustments from economic hedging activities
0.08
-
-
-
0.08
2007 Illinois electric rate settlement
(0.02)
-
-
-
(0.02)
Unrealized gains related to nuclear decommissioning trust funds
0.08
-
-
-
0.08
Asset retirement obligation
-
0.01
-
-
0.01
Retirement of fossil generating units
(0.08)
-
-
-
(0.08)
Non-cash remeasurement of income tax uncertainties
0.10
(0.16)
(0.03)
(0.01)
(0.10)
Non-cash charge resulting from health care legislation
(0.04)
(0.02)
(0.02)
(0.02)
(0.10)
Emission allowances impairment
(0.05)
-
-
-
(0.05)
Exelon Wind acquisition costs
(0.01)
-
-
-
(0.01)
FY 2010 GAAP Earnings (Loss) Per Share
$2.97
$0.51
$0.49
$(0.10)
$3.87
Note:
All amounts shown are per Exelon share and represent contributions to Exelon's EPS.
Amounts may not add due to rounding. |