Attached files
| file | filename |
|---|---|
| 8-K - FORM 8-K - BANCORPSOUTH INC | d287588d8k.htm |
 BancorpSouth, Inc.
Financial Information
As of December 31, 2011
Exhibit 99.2 |
 Forward Looking Information
2
Certain statements contained in this presentation and the accompanying slides may not be based on
historical facts and are “forward-looking statements” within the meaning of
Section 27A of the Securities Act of 1933, as amended, and Section 21E of the Securities Exchange Act of 1934, as amended. These
forward-looking statements may be identified by reference to a future period or by the use of
forward-looking terminology, such as “anticipate,” “believe,”
“estimate,” “expect,” “foresee,” “may,” “might,”
“will,” “intend,” “could,” “would” or “plan,” or future or conditional verb tenses, and variations or negatives of
such terms. These forward-looking statements include, without limitation, statements about the use
of proceeds from the offering, pro forma capital ratios, regulatory stress tests, results of
operations and financial condition. We caution you not to place undue reliance on the forward-looking statements contained
in this presentation, in that actual results could differ materially from those indicated in such
forward-looking statements as a result of a variety of factors. These factors include, but
are not limited to, conditions in the financial markets and economic conditions generally, including conditions in the financial
markets and economic conditions generally, the adequacy of the Company’s provision and allowance
for credit losses to cover actual credit losses, the credit risk associated with real estate
construction, acquisition and development loans, the impact of legal or administrative proceedings, the availability of capital
on favorable terms if and when needed, liquidity risk, the Company’s ability to improve its
internal controls adequately, governmental regulation, including the Dodd Frank Act, and
supervision of the Company’s operations, the impact of regulations on service charges on the Company’s core deposit accounts, the
susceptibility of the Company’s business to local economic conditions, the soundness of other
financial institutions, changes in interest rates, the impact of monetary policies and economic
factors on the Company’s ability to attract deposits or make loans, volatility in capital and credit markets, reputational risk,
the impact of hurricanes or other adverse weather events, any requirement that the Company write down
goodwill or other intangible assets, diversification in the types of financial services the
Company offers, competition with other financial services companies, risks in connection with completed or potential
acquisitions, the Company’s growth strategy, interruptions or breaches in security of the
Company’s information systems, the failure of certain third party vendors to perform,
limitations on the Company’s ability to declare and pay dividends, dilution caused by the Company’s issuance of any additional shares of
its common stock to raise capital or acquire other banks, bank holding companies, financial holding
companies and insurance agencies, other factors generally understood to affect the financial
results of financial services companies and other factors detailed from time to time in the Company’s press
releases and filings with the Securities and Exchange Commission. Forward-looking statements speak
only as of the date they were made, and, except as required by law, we do not undertake any
obligation to update or revise forward-looking statements to reflect events or circumstances after the date of this
presentation. Certain tabular presentations may not reconcile because of rounding. Unless otherwise
noted, any quotes in this presentation can be attributed to company management. |
 This presentation contains financial information determined by methods other than
those prescribed by accounting principles generally accepted in the United
States ("GAAP'). Management uses these "non-GAAP" financial measures in its analysis of the Company's capital and
performance. Management believes that the ratio of tangible common equity to
tangible assets is important to investors who are interested in evaluating
the adequacy of the Company’s capital levels. You should not view these
disclosures as a substitute for results determined in accordance with GAAP, and they are not necessarily
comparable to non-GAAP measures used by other companies. The limitations
associated with these measures are the risks that persons might disagree as
to the appropriateness of items comprising these measures and that different companies might calculate these measures
differently. Information provided in the Appendix of this presentation reconciles
these non-GAAP measures with comparable measures calculated in
accordance with GAAP. Non-GAAP Financial Disclaimer
3 |
 Financial Highlights
At and for the three months ended December 31, 2011
Net income of $13.3 million, or $0.16 per diluted share
Improvement in many credit quality indicators including the provision
for credit losses, total NPLs and NPAs, nonaccrual loan formation, and
near-term past dues
Net interest margin remained stable at 3.69%
Mortgage production increased to $390 million, although a negative
MSR market valuation adjustment reduced mortgage revenue by $1
million
Capital levels improved:
12/31/11
9/30/11
12/31/10
Equity/Assets
9.72%
9.60%
8.98%
TIER I Leverage Capital
8.85%
8.66%
8.07%
Total Capital
13.03% 12.62%
11.87%
4 |
 Provision for credit losses declined $5.9 million, or 23.3%, from the
previous quarter
NPLs decreased $40.5 million, or 11.1%, from the previous quarter and
NPAs declined $29.4 million, or 5.6%
Nonaccrual loan formation declined from $60.8 million for the third quarter
of 2011 to $39.5 million for the fourth quarter of 2011
51% of non-accrual loans were paying as agreed
Loans 30-89 days past due, still accruing, declined from $54.1 million as
of
9/30/11 to $37.5 million as of 12/31/11
Credit Quality Highlights
At and for the three months ended December 31, 2011
5 |
 September 2011 and December 2010 noninterest revenue includes net securities
gains/losses of $2.0 million and ($0.5) million, respectively. Net
securities gains/losses were not significant for the fourth quarter of
2011 6
Recent Operating Results
NM
–
Not
meaningful
Dollars in millions, except per share data
12/31/11
9/30/11
12/31/10
Net interest revenue
$107.5
$108.1
$110.2
(2.5)
%
Provision for credit losses
19.3
25.1
43.3
(55.5)
Noninterest revenue
65.3
62.1
74.0
(11.7)
Noninterest expense
135.9
130.7
123.5
10.0
Income before income taxes
17.7
14.3
17.4
1.8
Income tax provision
4.4
2.4
1.6
NM
Net income
$13.3
$11.9
$15.8
(15.8)
Net income per share: diluted
$0.16
$0.14
$0.19
(15.8)
Three Months Ended
Q4'11 vs.
Q4'10 |
 Noninterest Revenue
Dollars in thousands
7
12/31/11
9/30/11
12/31/10
Mortgage origination and servicing
9,919
$
10,233
$
9,231
$
MSR valuation adjustment
(991)
(11,676)
8,895
Credit card, debit card and merchant fees
7,783
12,981
9,951
Service charges
17,412
17,334
16,854
Trust income
3,348
2,854
3,072
Security gains (losses), net
18
2,047
(470)
Insurance commissions
19,416
22,012
18,013
Other
8,430
6,270
8,428
Total noninterest revenue
65,335
$
62,055
$
73,974
$
Three Months Ended |
 Change
in Loan Portfolio 8
% Change
As of
Linked
YOY
12/31/11
9/30/11
12/31/10
12/31/11 vs. 9/30/11
12/31/11 vs. 12/31/10
Commercial and industrial
1,474
$
1,503
$
1,491
$
(2.0%)
(1.2%)
Real estate:
Consumer mortgages
1,945
1,966
1,952
(1.1%)
(0.3%)
Home equity
514
523
543
(1.7%)
(5.3%)
Agricultural
239
250
252
(4.1%)
(5.1%)
Commercial and industrial-owner occupied
1,302
1,330
1,331
(2.1%)
(2.2%)
Construction, acquisition and development
908
977
1,175
(7.0%)
(22.7%)
Commercial
1,754
1,772
1,817
(1.0%)
(3.5%)
Credit Cards
106
103
106
3.0%
(0.1%)
Other
627
632
665
(0.8%)
(5.7%)
Total
8,870
$
9,056
$
9,333
$
(2.0%)
(5.0%)
Dollars in millions
Loan balances shown net of unearned income |
 NPLs
Dollars in millions
Net loans and leases as of December 31, 2011
9
NPLs as a Percent
Outstanding
NPLs
of Outstanding
Commercial and industrial
$1,473.7
$13.6
0.9%
Real estate:
Consumer mortgages
1,945.2
52.6
2.7%
Home equity
514.4
2.0
0.4%
Agricultural
239.5
4.3
1.8%
Commercial and industrial-owner occupied
1,301.6
42.0
3.2%
Construction, acquisition and development
908.4
135.2
14.9%
Commercial
1,754.0
61.8
3.5%
Credit cards
106.3
3.4
3.2%
All other
627.3
7.4
1.2%
Total loans
$8,870.3
$322.3
3.6% |
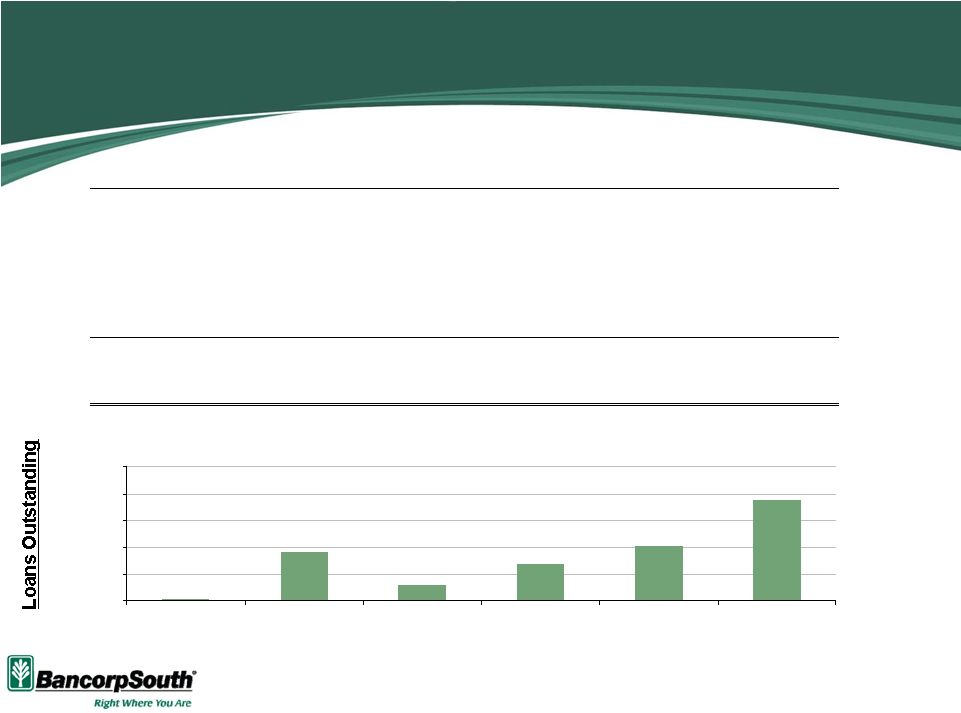
Outstanding NPLs
NPLs as a Percent of
Outstanding
Multi-Family Construction
$2.1
$1.1
1-4 Family Construction
169.8
15.0
Recreation and All Other Loans
67.2
1.3
Commercial Construction
130.1
5.2
Commercial Acquisition and Development
197.0
24.4
Residential Acquisition and Development
342.0
88.2
Real Estate Construction, Acquisition
and Development
$908.4
$135.2
12.4
25.8
14.9%
49.9%
8.8
1.9
4.0
Real Estate Construction, Acquisition and Development
$0
$100
$200
$300
$400
$500
Multi-Family
Construction
1-4 Family
Construction
Recreation & All
Other Loans
Commercial
Construction
Commercial A & D
Residential A & D
10
Dollars in millions
As of December 31, 2011 |
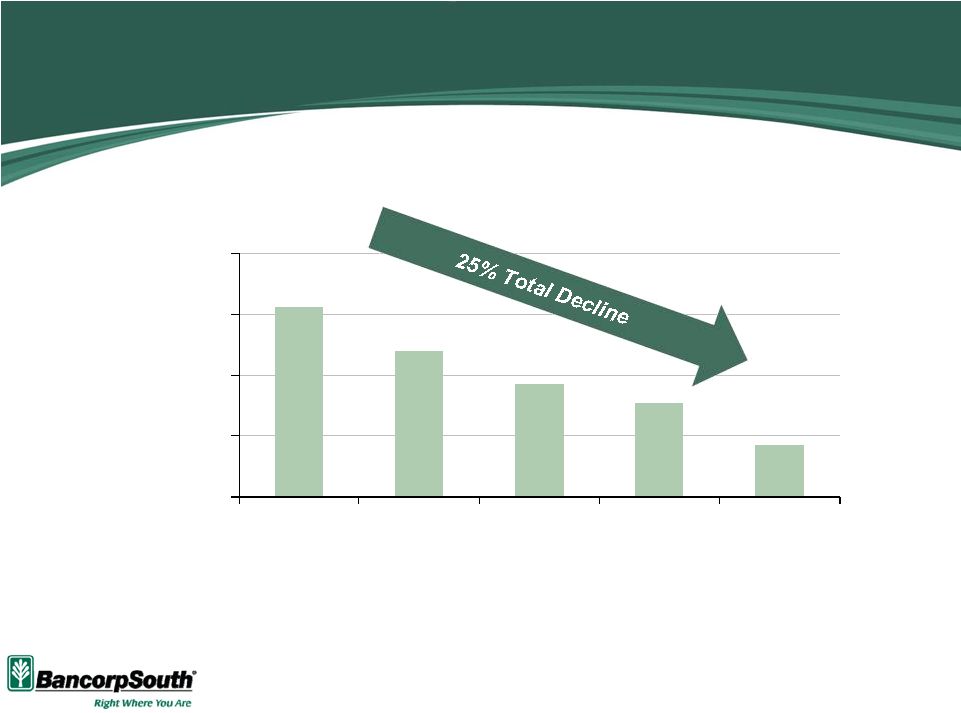 $456
$420
$393
$377
$342
$300
$350
$400
$450
$500
12/31/10
3/31/11
6/30/11
9/30/11
12/31/11
Residential Acquisition and Development
11
Dollars in millions |
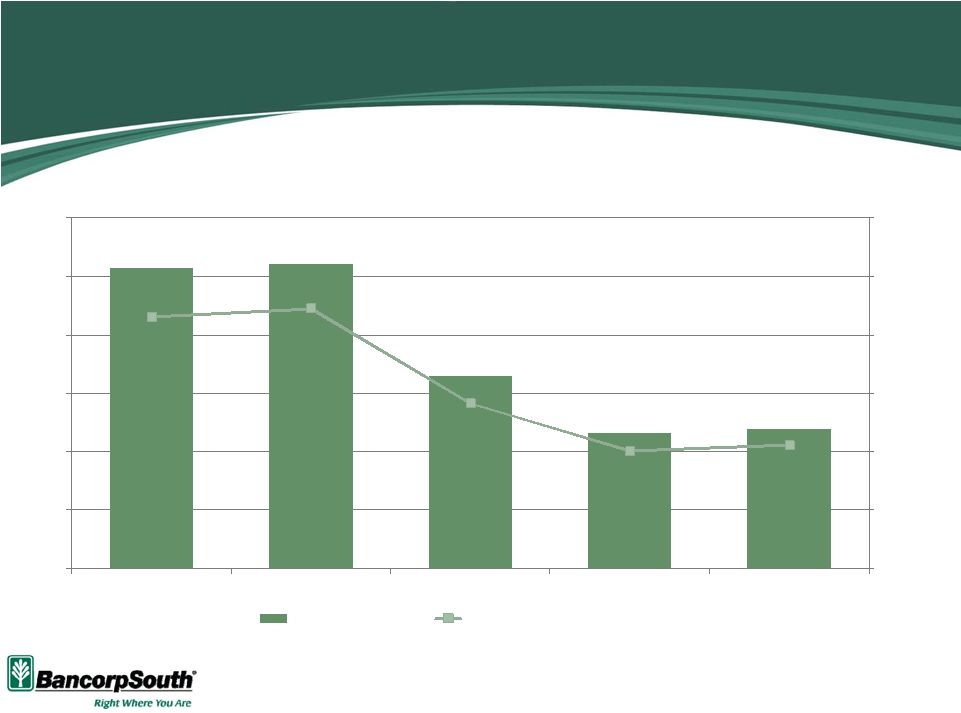
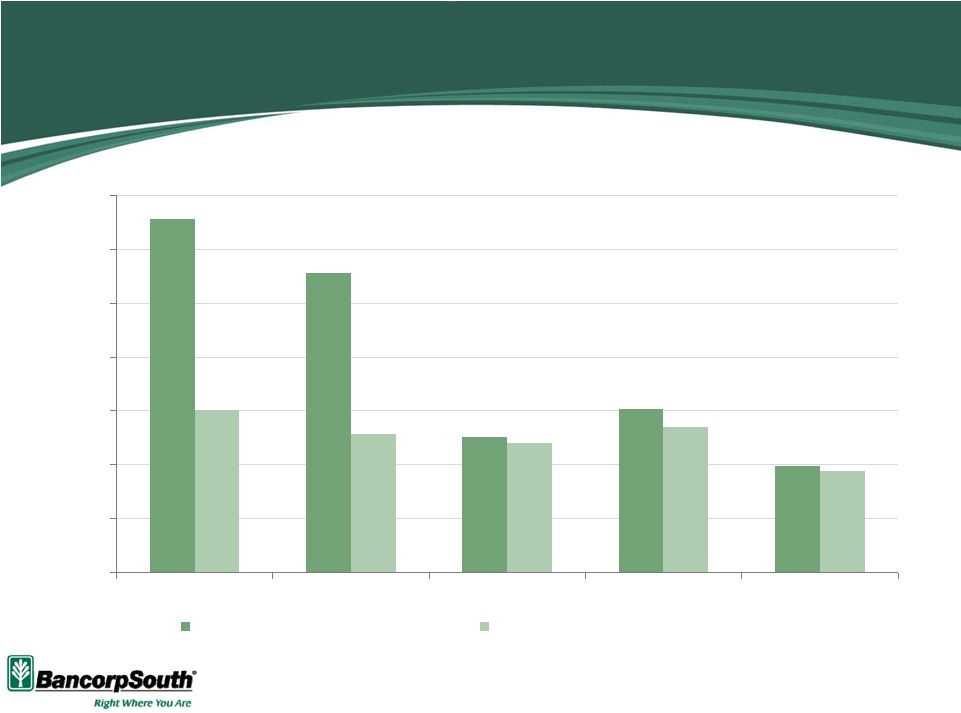 Newly
Identified Non-Accrual Loans Dollars in millions
Based on period end balances
12
$131M
$111M
$50M
$61M
$39M
$60M
$52M
$48M
$54M
$38M
$0
$20
$40
$60
$80
$100
$120
$140
12/31/10
3/31/11
6/30/11
9/30/11
12/31/11
Newly Identified Non-Accrual Loans
Loans 30-89 Days Past Due, Still Accruing |
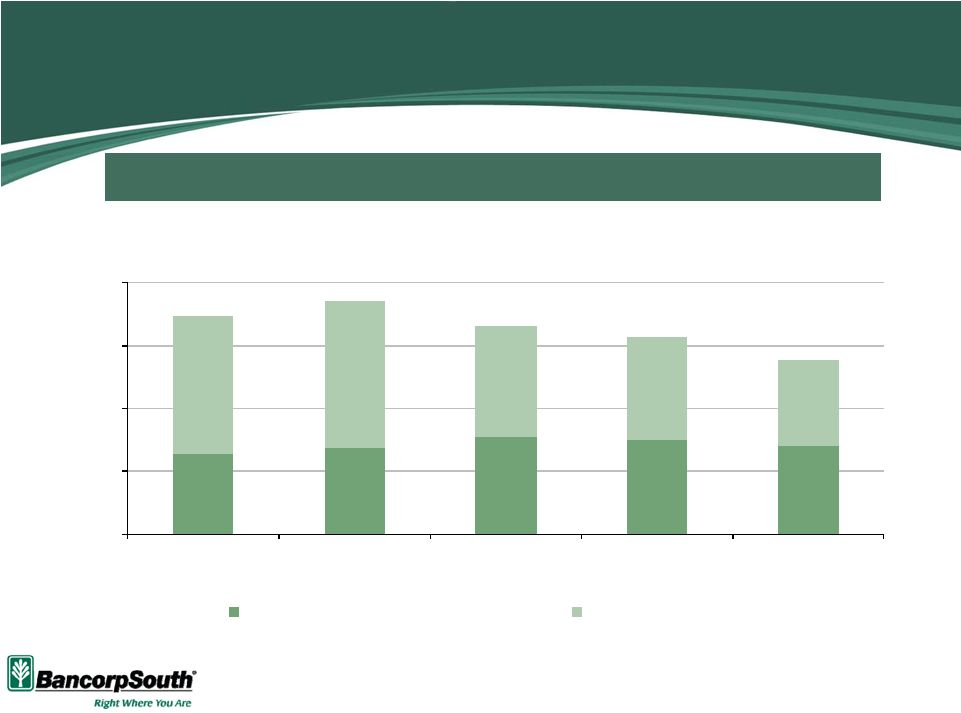 $0
$100
$200
$300
$400
12/31/10
3/31/11
6/30/11
9/30/11
12/31/11
Non-Accrual Lns Paying as Agreed
All Other Non-Accrual Lns
Non-Accrual Loans
36%
37%
47%
48%
51%
51% of non-accrual loans were paying as agreed as of December 31, 2011
13
Dollars in millions
“Paying as Agreed” includes loans < 30 days past due with payments occurring at least
quarterly |
 Dollars in millions
Net Charge-offs are Stabilizing
% Avg. Loans
14
$51
$52
$33
$23
$24
0.0%
0.5%
1.0%
1.5%
2.0%
2.5%
3.0%
$0
$10
$20
$30
$40
$50
$60
12/31/10
3/31/11
6/30/11
9/30/11
12/31/11
Net Charge-Offs
Net Charge-offs / Average loans |
 Loan
Impairment Analysis As of December 31, 2011
Dollars in millions
15
85% of non-accrual loans are impaired and are carried at 68% of UPB
Total
Unpaid principal balance ("UPB") of impaired loans
$287.1
Cumulative charge-offs on impaired loans
(52.2)
Allowance for impaired loans
(39.7)
Net book value of impaired loans
$195.2
Net book value / UPB
68% |
  Other
Real Estate Owned 16
Total
Unpaid principal balance at time of foreclosure
$319.1
Cumulative charge-offs and writedowns of OREO
(145.3)
Current book value of OREO
$173.8
Current book value / UPB
54%
Write-downs of OREO were $8.7 million for the fourth quarter of 2011
compared with $4.4 million for the third quarter of 2011
Sales
of
OREO
totaled
$16.7
million
during
the
fourth
quarter
of
2011
and
resulted in no material net gain/loss
OREO
is
carried
at
54%
of
the
aggregate
unpaid
principal
balance
at
the
time of foreclosure
Dollars in millions
As of December 31, 2011 |
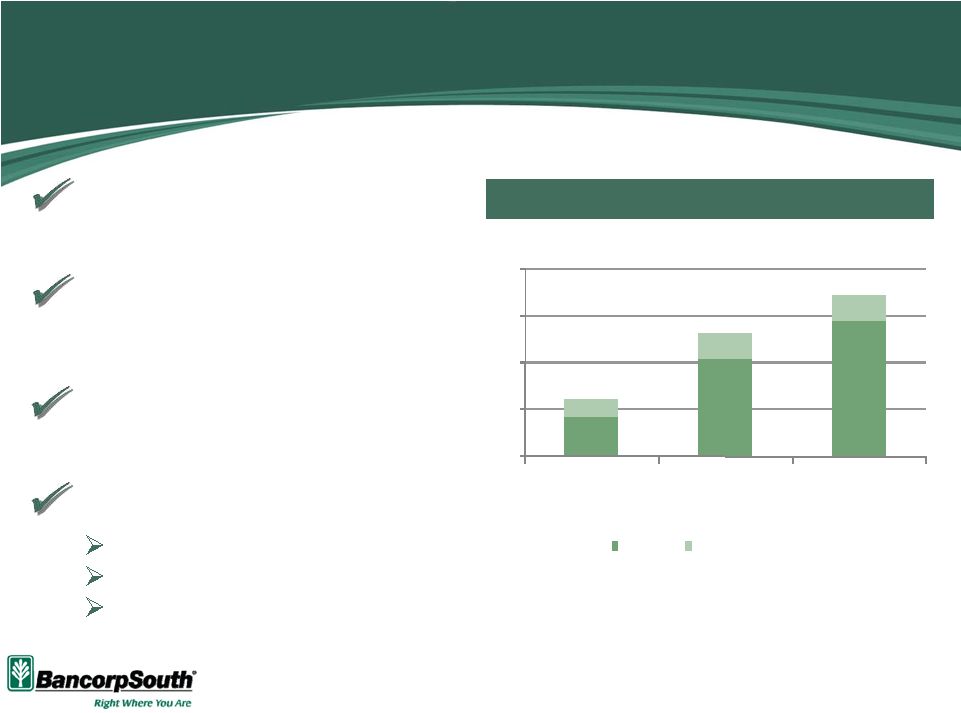 Common Stock Offering
Pro forma capital ratios assume $109 million of net proceeds.
Announced $100 million common
stock offering on January 17, 2012
Improves capitalization at the
Holding Company and maintains
flexibility at the Bank
Increases Holding Company
liquidity
Enhances strategic flexibility
Positioned for recovery
Ability to invest
Opportunistic M&A
Holding Company Capital Ratios
17
7.67%
10.15%
11.77%
8.46%
11.28%
12.90%
6.00%
8.00%
10.00%
12.00%
14.00%
TCE / TA
Tier 1 Common
Ratio
Tier 1 Ratio
12/31/11
12/31/11 Pro Forma |
 Reasons for the Offering
A strong capital position is consistent with the Company’s operating
philosophy.
The common equity raise will enhance our capital ratios, particularly
tangible common equity to tangible assets and Tier I risk-based capital, and
will bring our capital ratios more in-line with peers
In the post-financial crisis environment, all banks will be expected to
operate with higher capital levels.
As a large insured depository institution, the Company’s bank subsidiary
will be subjected to a regulatory “stress test”
on capital. Since the final
parameters of this upcoming test are unknown, capital ratios in line with
peers is a prudent position.
18 |
 Appendix |
 20
Non-GAAP Financial Reconciliation
Tangible Common Equity / Tangible Assets (TCE/TA)
As of
As of
As of
12/31/2011
9/30/2011
12/31/2010
(Dollars In Thousands)
Common Equity --> A
$1,262,912
$1,266,753
$1,222,244
Assets --> B
12,995,851
13,198,518
13,615,010
Intangibles --> C
287,910
288,723
289,720
Tangible Common Equity --> D=A-C
975,002
978,030
932,524
Tangible Assets --> E=B-C
12,707,941
12,909,795
13,325,290
TCE/TA --> D/E
7.67%
7.58%
7.00% |