Attached files
| file | filename |
|---|---|
| 8-K - TAIWAN FUND INC | v300112_8-k.htm |
|
THE TAIWAN FUND, INC. (THE ‘FUND’)
|
|
|
Net asset value per share
|
US$15.94
|
|
Market price
|
US$14.49
|
|
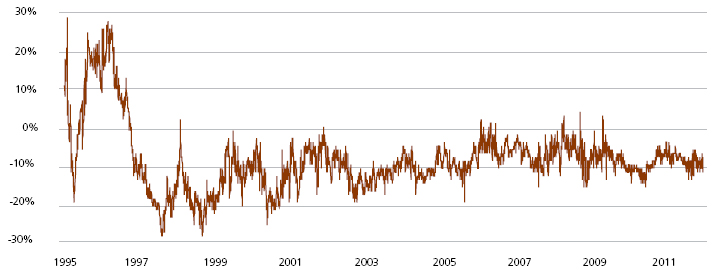
Premium/(discount)
|
(9.10%)
|
|
Fund size
|
US$296.1m
|
|
At December 31, 2011
|
US$ return
|
|||||||
|
Fund*
|
TAIEX Index†
|
|||||||
|
%
|
%
|
|||||||
|
One month
|
2.1 | 2.6 | ||||||
|
Three months
|
(5.2 | ) | (1.5 | ) | ||||
|
One year
|
(20.8 | ) | (21.0 | ) | ||||
|
Three years % pa
|
18.6 | 22.8 | ||||||
On November 9, 2011, the Fund entered into an Interim Investment Advisory and Management Agreement with Martin Currie Inc. (‘Martin Currie’) and on November 10, 2011, Martin Currie entered into an Interim Sub-Advisory Agreement with APS Asset Management Pte Ltd. (‘APS’) to manage the Fund’s portfolio until new permanent management arrangements are put in place. APS is a Singapore based investment management firm that specializes in Asia Pacific equity investments with a particular focus on China and Greater China. APS has a team of ten analysts based across Beijing, Shanghai and Shenzhen. The interim arrangements will remain in place for a maximum of 150 days.
The Board of Directors has selected Martin Currie and APS to manage the Fund’s portfolio subject to stockholder approval. The proposal to approve a new investment management agreement with Martin Currie and a new sub-advisory agreement with APS will be submitted to stockholders at the annual stockholders meeting, scheduled for February 23, 2012.
 |
 |
|||
|
Wong Kok Hoi
|
James Liu
|
The TAIEX Total Return Index was down 21% in 2011, underperforming most other countries in a year of exceptional uncertainty and volatility. With its mature domestic market and heavy exposure to the ups and downs of the external environment, Taiwan was adversely affected by a series of events that either hindered the production of, or dampened demand for, its exports. In March 2011, the tsunami in Japan disrupted the global electronics supply chain and left many Taiwanese technology companies unable to obtain critical raw materials. The eurozone crisis and the sluggish US job market left consumers reluctant to spend on the latest electronic gadgets. To make things more difficult for Taiwan, its largest export market, mainland China, experienced slower economic growth as its central government adopted tightening measures to rein in high inflation. And, exacerbating the impact from the economic developments, foreign funds pulled capital out of Taiwan in droves, reallocating to ‘safe havens’.
In mid-December, the TAIEX dropped to its lowest point of the year. It then rebounded strongly, after the National Stabilization Fund (‘NSF’) indicated that it had allocated NT$500 billion to support the market should it continue to decline unreasonably. Compared with a daily stock-market turnover of less than NT$60 billion, this is a staggering amount of capital. The NSF is expected to keep an eye on market movements at least until the presidential election on January 14, 2012. Overall, the TAIEX was up 2.6% in December.
The electronics sector performed roughly in line with the market, rising 2.3%. Our industry checks show that overall end-demand for electronics products remains unexciting, with smartphones the only exception. Consumers are still unwilling to spend, and the good Black Friday sales were mainly driven by steep discounts. The PC sector seemed to be particularly weak going into December, as Intel downgraded its fourth-quarter guidance, citing a shortage of hard drives caused by the Thai floods. It is also worth noting that there has been an acceleration in the number of employees on unpaid leave in Taiwan’s factories.
Financials dropped a disastrous 8.6% before the NSF stepped in and finally ended the month up 1.2%. Taiwan’s central bank, the CBC, left the discount rate unchanged at 1.875% in its last policy meeting. The bank’s chairman noted the ‘three low, one high’ (low exports, low investment, low consumption, and high unemployment rate) difficulties that Taiwan currently faces.
The Fund returned 2.1% in December. The top contributors included President Chain Store and Uni-President Enterprises, which benefited from a switch to more defensive stocks ahead of the elections. As the NSF started to buy into the market, Chinatrust Financial Holding also performed well.
The largest detractors included Goldsun Development & Construction, Wistron Neweb Corporation and KGI Securities. Goldsun’s sales fell 6.2% in November. Wistron Neweb was affected by component shortages caused by the flooding in Thailand, as well as by slowing sales at a major handset customer. Consequently, its November sales declined by 5%. Meanwhile, the pre-election switch into defensives weighed on KGI Securities’ share price.
MONTHLY INSIGHT
INVESTMENT STRATEGY
We bought a new holding in First Steamship, which owns 52% of Grand Ocean, a leading operator of department stores in mainland China’s second- and third-tier cities. With 15 stores in operation and 4 in planning, Grand Ocean was among the first firms to penetrate lower-tier Chinese cities. It also has an experienced management team. Grand Ocean’s earnings should grow by more than 40% in 2012, contributing 70% of First Steamship’s earnings. Bulk shipping, the firm’s other major business, is still profitable and generates good cashflow for the company. As a warm winter has led to slower department-store sales in the fourth quarter, the share price has corrected sharply. We saw this as a good buying opportunity, given an attractive valuation (less than 10 x 2012e P/E) and good growth prospects.
We sold Globe Union, which makes bathroom equipment. There is nothing to suggest that market conditions in the United States and Europe will take a turn for the better any time soon.
Source: Martin Currie Inc. and APS Asset Management Pte Ltd.
*Martin Currie Ltd and Heartland Capital Management Ltd (‘HCML’) established MC China Ltd (‘MCCL’), as a joint venture company, to provide investment consultancy services to the range of China investment products managed by Marin Currie and its affiliates. HCML seconded Shifeng Ke to Martin Currie Inc. and its affiliates, on a full time basis. Effective November 7, 2011, Martin Currie’s interest in MCCL terminated and Shifeng Ke ceased to be the lead manager of the Fund. At that time, Martin Currie Inc entered into an interim investment advisory agreement with the Fund and also entered into an interim sub-advisory agreement with APS Asset Management Pte Ltd for management of the Fund’s portfolio.
The Fund announced that its Board of Directors has commenced a process to review investment manager alternatives for the Fund. The Board expects that this process will be completed by the end of November 2011.
For further information please go to www.thetaiwanfund.com.
Martin Currie Inc. took over management of the Fund on May 9, 2010.
| FUND DETAILS | |
|
December 31, 2011
|
|
|
Market cap
|
US$269.15m
|
|
Shares outstanding
|
18,575,214
|
|
Exchange listed
|
NYSE
|
|
Listing date
|
1986
|
|
Investment manager
|
Martin Currie Inc
|
|
PERFORMANCE
|
(US$ RETURNS)
|
|||||||
|
(US$ returns)
|
NAV %
|
Market price %
|
||||||
|
One month
|
2.1 | 1.7 | ||||||
|
Three months
|
(5.2 | ) | (0.1 | ) | ||||
|
Three years % pa
|
18.6 | 18.3 | ||||||
| SECTOR ALLOCATION | ||
| Fund %* | Benchmark %† | |
| Wholesale and retail | 20.0 | 6.6 |
| Finance | 19.8 | 12.8 |
| Electronics | 19.6 | 50.0 |
| Construction | 8.8 | 1.6 |
| Healthcare | 7.9 | — |
| Transportation | 4.1 | 2.1 |
| Foods | 3.9 | 1.9 |
| Textiles | 3.1 | 1.9 |
| Steel and iron | 3.0 | 3.2 |
| Electric and machinery | 2.3 | 1.3 |
| Plastic | 1.5 | 8.4 |
| Cement | 1.2 | 1.4 |
| Others | — | 2.2 |
| Chemicals | — | 2.1 |
| Rubber | — | 1.6 |
| Automobile | — | 1.3 |
| Electrical appliance and cable | — | 0.4 |
| Glass and ceramics | — | 0.4 |
| Tourism | — | 0.5 |
| Paper and pulp | — | 0.3 |
| Other assets and liabilities, net | 4.8 | — |
*Source: State Street Bank and Trust Company.
†Source: TWSE.
15 LARGEST HOLDINGS*
| 50.2% of holdings | Sector | % of net |
| assets | ||
| President Chain Store | Wholesale and retail | 5.2 |
| WT Microelectronics | Electronics | 4.1 |
| Chinatrust Financial Holding | Finance | 3.6 |
| Ruentex Development | Construction | 3.5 |
| Uni-President Enterprises | Foods | 3.4 |
| Mercuries & Associates | Wholesale and retail | 3.4 |
| Yuanta Financial Holding | Finance | 3.3 |
| YungShin Global Holding | Healthcare | 3.3 |
| KGI Securities | Finance | 3.2 |
| HTC | Electronics | 3.0 |
| Tung Ho Steel Enterprise | Steel and iron | 3.0 |
| SinoPac Financial Holdings | Finance | 2.9 |
| Far Eastern Department Stores | Wholesale and retail | 2.8 |
| Fubon Financial Holding | Finance | 2.8 |
| Clevo | Wholesale and retail | 2.7 |
*Source: State Street Bank and Trust Company.
| PERFORMANCE | (US$ returns at December 31, 2011) | |||||||||||||
| One month | Three months | Calendar year | One year | Three years | Five years | Ten years | Since launch | |||||||
| % | % | to date | % | % pa | % pa | % pa | % pa | |||||||
| % | ||||||||||||||
| The Taiwan Fund, Inc.* | 2.1 | (5.2 | ) | (20.8 | ) | (20.8 | ) | 18.6 | 0.7 | 4.2 | 8.5 | |||
| TAIEX Index† | 2.6 | (1.5 | ) | (24.1 | ) | (24.1 | ) | 18.6 | (0.6 | ) | 3.9 | 8.3 | ||
| TAIEX Total Return Index† | 2.6 | (1.5 | ) | (21.0 | ) | (21.0 | ) | 22.8 | 3.3 | na | na | |||
| MSCI Taiwan Index† | 3.0 | (0.4 | ) | (20.2 | ) | (20.2 | ) | 20.9 | 0.9 | 4.8 | na | |||
Past performance is not a guide to future returns. Returns are annualized, except for periods of less than one year.
*Source: State Street Bank and Trust Company. Launch date December 23, 1986. Returns for the Fund are historical total returns that reflect changes in net asset value per share during each period and assume that dividends and capital gains, if any, were reinvested.
†Source: MSCI for the MSCI Taiwan Index and TWSE for the TAIEX Total Return Index and the TAIEX Index. For a full description of each index please see the index descriptions section.
Returns for the TAIEX Index are not total returns and reflect only changes in the share price but do not assume that cash dividends, if any, were reinvested, and thus are not strictly comparable to the Fund returns.
The TAIEX Total Return Index commenced January 1, 2003.
| PORTFOLIO IN FULL | ||||||||
| Company | % of | |||||||
| Sector | (BGB ticker) | Price | Holding | Value US$ | net assets | |||
| WHOLESALE AND RETAIL | 20.0 | |||||||
| President Chain Store | 2912 | TT | NT$165.0 | 2,840,000 | $15,476,073 | 5.2 | ||
| Mercuries & Associates | 2905 | TT | NT$28.8 | 10,576,169 | $10,059,568 | 3.4 | ||
| Far Eastern Department Stores | 2903 | TT | NT$35.7 | 6,953,070 | $8,197,913 | 2.8 | ||
| Clevo | 2362 | TT | NT$47.9 | 5,082,000 | $8,039,493 | 2.7 | ||
| Test-Rite International | 2908 | TT | NT$20.8 | 10,622,000 | $7,296,727 | 2.5 | ||
| PC Home Online | 8044 | TT | NT$186.5 | 1,071,588 | $6,600,322 | 2.2 | ||
| Taiwan Tea | 2913 | TT | NT$13.3 | 8,231,000 | $3,615,453 | 1.2 | ||
| FINANCE | 19.8 | |||||||
| Chinatrust Financial Holding | 2891 | TT | NT$18.9 | 17,223,268 | $10,750,678 | 3.6 | ||
| Yuanta Financial Holding | 2885 | TT | NT$15.5 | 19,238,900 | $9,816,738 | 3.3 | ||
| KGI Securities | 6008 | TT | NT$10.8 | 26,527,658 | $9,461,961 | 3.2 | ||
| SinoPac Financial Holding | 2890 | TT | NT$9.2 | 28,093,205 | $8,554,422 | 2.9 | ||
| Fubon Financial Holding | 2881 | TT | NT$32.1 | 7,716,706 | $8,168,051 | 2.8 | ||
| Jih Sun Financial Holding | 5820 | TT | NT$8.2 | 19,227,000 | $5,206,955 | 1.8 | ||
| China Life Insurance | 2823 | TT | NT$24.5 | 5,193,784 | $4,202,507 | 1.4 | ||
| Union Bank of Taiwan | 2838 | TT | NT$9.9 | 7,507,000 | $2,454,483 | 0.8 | ||
| ELECTRONICS | 19.6 | |||||||
| WT Microelectronics | 3036 | TT | NT$39.1 | 9,461,556 | $12,217,934 | 4.1 | ||
| HTC | 2498 | TT | NT$497.0 | 545,000 | $8,945,639 | 3.0 | ||
| Wah Lee Industrial | 3010 | TT | NT$36.0 | 5,971,000 | $7,099,178 | 2.4 | ||
| Advantech | 2395 | TT | NT$83.8 | 2,426,100 | $6,714,461 | 2.3 | ||
| Aurora | 2373 | TT | NT$46.7 | 4,060,000 | $6,255,128 | 2.1 | ||
| Wistron NeWeb | 6285 | TT | NT$49.5 | 3,117,000 | $5,095,660 | 1.7 | ||
| Taiflex Scientific | 8039 | TT | NT$33.3 | 3,452,821 | $3,797,316 | 1.3 | ||
| GeoVision | 3356 | TT | NT$108.0 | 989,000 | $3,527,594 | 1.2 | ||
| MPI | 6223 | TT | NT$66.1 | 1,448,000 | $3,161,029 | 1.1 | ||
| Tatung | 2371 | TT | NT$7.6 | 4,770,897 | $1,199,066 | 0.4 | ||
| CONSTRUCTION | 8.8 | |||||||
| Ruentex Development | 9945 | TT | NT$32.4 | 9,598,082 | $10,270,414 | 3.5 | ||
| Goldsun Development & Construction | 2504 | TT | NT$10.5 | 11,314,980 | $3,905,067 | 1.3 | ||
| Hung Poo Real Estate Development | 2536 | TT | NT$20.0 | 4,929,873 | $3,256,298 | 1.1 | ||
| Taiwan Land Development | 2841 | TT | NT$11.6 | 8,177,799 | $3,119,442 | 1.1 | ||
| Acter | 5536 | TT | NT$95.5 | 941,179 | $2,968,480 | 1.0 | ||
| King’s Town Construction | 2524 | TT | NT$18.0 | 4,261,680 | $2,526,410 | 0.8 | ||
| HEALTHCARE | 7.9 | |||||||
| YungShin Global Holding | 3705 | TT | NT$40.7 | 7,239,000 | $9,730,417 | 3.3 | ||
| Excelsior Medical | 4104 | TT | NT$61.8 | 3,133,729 | $6,395,999 | 2.2 | ||
| St.Shine Optical | 1565 | TT | NT$320.0 | 392,000 | $4,142,805 | 1.4 | ||
| Pacific Hospital Supply | 4126 | TT | NT$76.7 | 1,223,142 | $3,098,352 | 1.0 | ||
| FOODS | 3.9 | |||||||
| Uni-President Enterprises | 1216 | TT | NT$44.3 | 6,996,000 | $10,224,017 | 3.4 | ||
| Gourmet Master | 2723 | TT | NT$203 | 206,200 | $1,382,430 | 0.5 | ||
| Company | % of | |||||||
| Sector | (BGB ticker) | Price | Holding | Value US$ | net assets | |||
| STEEL AND IRON | 3.0 | |||||||
| Tung Ho Steel Enterprise | 2006 | TT | NT$26.6 | 10,099,000 | $8,871,938 | 3.0 | ||
| TEXTILES | 3.1 | |||||||
| Far Eastern New Century | 1402 | TT | NT$35.2 | 4,216,836 | $4,895,201 | 1.7 | ||
| Makalot Industrial | 1477 | TT | NT$70.1 | 1,828,000 | $4,232,068 | 1.4 | ||
| TRANSPORTATION | 4.1 | |||||||
| First Steamship | 2601 | TT | NT$35.3 | 4,515,000 | $5,263,697 | 1.8 | ||
| Farglory F T Z Investment Holding | 5607 | TT | NT$14.9 | 9,624,000 | $4,719,984 | 1.6 | ||
| Taiwan High Speed Rail | 2633 | TT | NT$5.0 | 12,597,600 | $2,071,933 | 0.7 | ||
| ELECTRIC AND MACHINERY | 2.3 | |||||||
| Yungtay Engineering | 1507 | TT | NT$45.6 | 3,274,000 | $4,930,625 | 1.7 | ||
| Good Friend International Holdings | 2398 | TT | NT$13.2 | 4,145,000 | $1,806,995 | 0.6 | ||
| PLASTICS | 1.5 | |||||||
| Yem Chio | 4306 | TT | NT$22.9 | 5,979,833 | $4,522,546 | 1.5 | ||
| CEMENT | 1.2 | |||||||
| Wei Mon Industry | 8925 | TT | NT$16.8 | 6,433,854 | $3,559,135 | 1.2 | ||
| OTHER ASSETS AND LIABILITIES, NET | $14,327,442 | 4.8 |
TAIEX Index
The TWSE, or TAIEX Index is a capitalization-weighted index of all listed common shares traded on the Taiwan Stock Exchange. The index was based in 1966 and does not include re-invested dividends.
TAIEX Total Return Index
The TAIEX Total Return Index is a capitalization-weighted index of all listed common shares traded on the Taiwan Stock Exchange, based in 1966, which includes re-invested dividends.
MSCI Taiwan Index
The MSCI Total Return Taiwan Index is a free-float adjusted market capitalization index. The index represents Taiwanese companies that are available to investors worldwide. The Index has a base date of December 31, 1987. As of October 31, 2011, it contained 122 constituents.
The Fund was launched on December 23, 1986 to allow US and other investors to access and participate in the growth of the economy and the stock market in Taiwan, the Republic of China. The Fund’s investment objective is to seek long-term capital appreciation primarily through investments in equity securities listed in Taiwan. The Fund is a diversified, closed-end management investment company listed on the New York Stock Exchange (NYSE) under the symbol ‘TWN’.
Taiwan, with its global market leadership in high technology goods and its significant investments throughout mainland China and Southeast Asian economies, is now an integral economic player in the Asia Pacific Region as well as around the world. Investing in Taiwan not only allows investors to capitalize on Taiwan’s dynamic economy, but also allows investors to reap the growth and investment potential of the mainland China and other emerging economies of the region.
This document is issued and approved by Martin Currie Inc (‘MC Inc’), as investment adviser of The Taiwan Fund, Inc. (the ‘Fund’). MC Inc is authorised and regulated by the Financial Services Authority (‘FSA’) and incorporated under limited liability in New York, USA. Registered in Scotland (No BR2575), registered address Saltire Court, 20 Castle Terrace, Edinburgh, EH1 2ES. Information herein is believed to be reliable but has not been verified by MC Inc. MC Inc makes no representation or warranty and does not accept any responsibility in relation to such information or for opinion or conclusion which the reader may draw from this newsletter.
The Fund is classified as a diversified investment company under the US Investment Company Act of 1940 as amended. It meets the criteria of a closed ended US fund and its shares are listed on the New York Stock Exchange. MC Inc has been appointed investment adviser to the Fund.
Investors are advised that they will not generally benefit from the rules and regulations of the United Kingdom Financial Services and Markets Act 2000 and the FSA for the protection of investors, nor benefit from the United Kingdom Financial Services Compensation Scheme, nor have access to the Financial Services Ombudsman in the event of a dispute. Investors will also have no rights of cancellation under the FSA’s Conduct of Business Sourcebook of the United Kingdom.
This newsletter does not constitute an offer of shares. MC Inc, its ultimate and intermediate holding companies, subsidiaries, affiliates, clients, directors or staff may, at any time, have a position in the market referred to herein, and may buy or sell securities, currencies, or any other financial instruments in such markets. The information or opinion expressed in this newsletter should not be construed to be a recommendation to buy or sell the securities, commodities, currencies or financial instruments referred to herein.
The information provided in this report should not be considered a recommendation to purchase or sell any particular security. There is no assurance that any securities discussed herein will remain in an account’s portfolio at the time you receive this report or that securities sold have not been repurchased.
It should not be assumed that any of the securities transactions or holdings discussed here were or will prove to be profitable, or that the investment recommendations or decisions we make in the future will be profitable or will equal the investment performance of the securities discussed herein.
Investing in the Fund involves certain considerations in addition to the risks normally associated with making investments in securities. The value of the shares issued by the Fund, and the income from them, may go down as well as up and there can be no assurance that upon sale, or otherwise, investors will receive back the amount originally invested. There can be no assurance that you will receive comparable performance returns, or that investments will reflect the performance of the stock examples contained in this document. Movements in foreign exchange rates may have a separate effect, unfavorable as well as favorable, on the gain or loss otherwise experienced on an investment. Past performance is not a guide to future returns. Accordingly, the Fund is only suitable for investment by investors who are able and willing to withstand the total loss of their investment. In particular, prospective investors should consider the following risks:
 |
It should be noted that investment in the Fund is only suitable for sophisticated investors who are aware of the risk of investing in Taiwan and should be regarded as long term. Funds which invest in one country carry a higher degree of risk than those with portfolios diversified across a number of markets.
|
|
|
Investment in the securities of smaller and unquoted companies can involve greater risk than is customarily associated with investment in larger, more established, companies. In particular, smaller companies often have limited product lines, markets or financial resources and their management may be dependent on a smaller number of key individuals. In addition, the market for stock in smaller companies is often less liquid than that for stock in larger companies, bringing with it potential difficulties in acquiring, valuing and disposing of such stock. Proper information for determining their value, or the risks to which they are exposed, may not be available.
|
|
|
Investments within emerging markets such as Taiwan can be of higher risk. Many emerging markets, and the companies quoted on their stock exchanges, are exposed to the risks of political, social and religious instability, expropriation of assets or nationalization, rapid rates of inflation, high interest rates, currency depreciation and fluctuations and changes in taxation which may affect the Fund's income and the value of its investments.
|
|
|
The marketability of quoted shares may be limited due to foreign investment restrictions, wide dealing spreads, exchange controls, foreign ownership restrictions, the restricted opening of stock exchanges and a narrow range of investors. Trading volume may be lower than on more developed stockmarkets, and equities are less liquid. Volatility of prices can also be greater than in more developed stockmarkets. The infrastructure for clearing, settlement and registration on the primary and secondary markets may be undeveloped. Under certain circumstances, there may be delays in settling transactions in some of the markets.
|

