Attached files
| file | filename |
|---|---|
| 8-K - FORM 8-K - BUCKEYE PARTNERS, L.P. | d287335d8k.htm |
 Buckeye Partners, L.P.
U.S. Capital Advisors
Midstream Corporate Access Day
January 24, 2012
Exhibit 99.1 |
 Legal Notice / Forward–Looking Statements
Forward–Looking Statements
The information contained in this presentation includes forward-looking
statements that we believe to be reasonable as of the date of this presentation. Such statements are identified by
use of the words “anticipates,”
“believes,”
“estimates,”
“expects,”
“intends,”
“plans,”
“predicts,”
“projects,”
“should,”
and similar expressions. Actual results may differ significantly
because of risks and uncertainties that are difficult to predict
and that may be beyond our control. Among them are (1) changes
in federal, state, local, and foreign laws or regulations to
which we are subject, including those that permit the treatment of us as a
partnership for federal income tax purposes, (2) terrorism, adverse weather conditions, including hurricanes,
environmental releases, and natural disasters, (3) changes in the marketplace
for our products or services, such as increased competition, better energy efficiency, or general reductions in
demand, (4) adverse regional, national, or international economic conditions,
adverse capital market conditions, and adverse political developments, (5) shutdowns or interruptions at the
source points for the products we transport, store, or sell, (6)
unanticipated capital expenditures in connection with the construction, repair,
or replacement of our assets, (7) volatility in the price of refined
petroleum products and the value of natural gas storage services, (8)
nonpayment or nonperformance by our customers, and (9) our ability to integrate acquired assets
with
our
existing
assets
and
to
realize
anticipated
cost
savings
and
other
efficiencies.
You
should
read
our
filings
with
the
U.S.
Securities
and
Exchange
Commission,
including
our
Annual Report on Form 10-K/A for the year ended December 31, 2010 and our
most recently filed Quarterly Reports on Form 10-Q, for a more extensive list of factors that could
affect results. We undertake no obligation to revise our
forward-looking statements to reflect events or circumstances occurring after the date of this presentation.
2 |
 3
About Buckeye
Buckeye Partners, L.P. (“Buckeye”) (NYSE: BPL) is a publicly traded
partnership that provides midstream logistics services Buckeye celebrating
over 125 years of continuous operations and over 25 years as an MLP listed on the NYSE
Current market capitalization of approximately $6.0 billion Investment
grade credit rating Buckeye’s operations are conducted in five
business segments: Pipelines & Terminals
International Operations
Natural Gas Storage
Energy Services
Development & Logistics
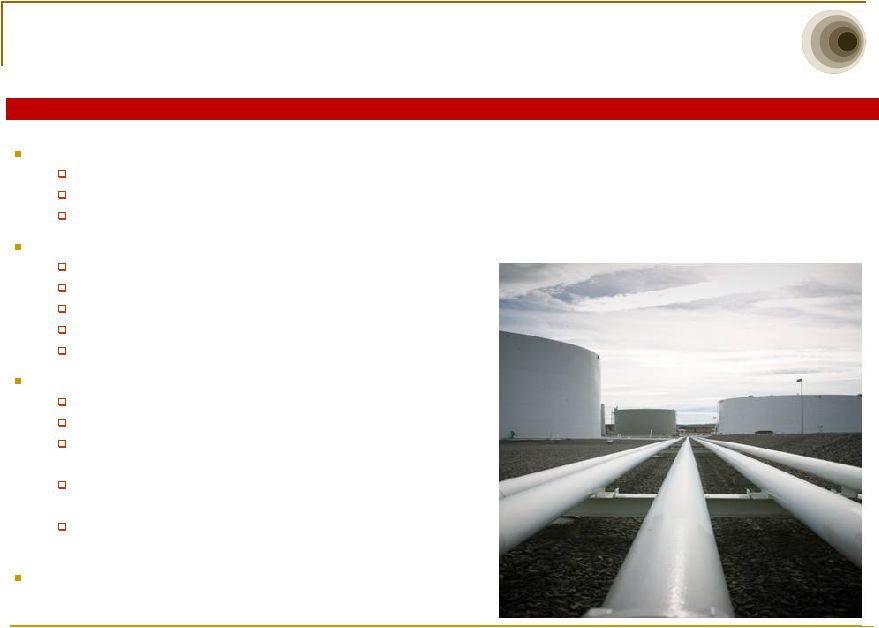
Asset Highlights
Over 6,000 miles of pipeline with ~ 100 delivery locations
More than 100 liquid petroleum product terminals
Over 64 million barrels of liquid petroleum product
storage capacity
~30 Bcf of working natural gas storage capacity
in northern California
~2,800 miles of pipeline under operation and maintenance
contracts
Buckeye’s revenue is largely fee-based providing consistent cash
flows that support distribution growth
Organizational Overview |
 4
Investment Highlights
Distributions per Unit
Buckeye’s current management team is both driving increased utilization of
the legacy assets and successfully delivering record growth through
accretive acquisitions Reorganization in 2009 supports the
partnership’s objective to transform Buckeye into the best-in-class asset
manager operating with a highly commercialized and entrepreneurial focus
Buy-in
of our general partner positions Buckeye to successfully compete for high
growth acquisition opportunities and expansion projects
Recently
announced
strategic
organizational
realignment
provides
for
realignment
of
our
business
units
under
experienced leaders to provide increased focus and drive growth.
Recent acquisitions provide Buckeye with increased geographic and product
diversity, including access to international logistics
opportunities Buckeye has investment grade financial metrics and a
conservative approach toward financing growth Buckeye has a proven
26-year track record as a publicly traded partnership through varying economic and commodity price
cycles
Buckeye has paid cash distributions to unitholders each quarter since its
formation in 1986 and has consecutively increased distributions for the
past 30 quarters Driving Unitholder Value
$0.00
$0.30
$0.60
$0.90
$1.20 |
 5
Management Objectives
The current management team has consistently executed on each element of our
strategy to transform Buckeye into a best-in-class asset manager
by: Implementing best practices across our business
Improving our cost structure through an organizational restructuring in
2009 Expanding
our
asset
portfolio
through
accretive
acquisitions
and
organic
growth
projects
Diversifying
our
legacy
business
into
new
geographies,
products,
and
asset
classes
Reducing cost of capital through the buy-in of our general partner
Conservatively financing acquisitions to maintain a strong balance sheet
Increasing cash distributions each quarter
We continue to be committed to our mission of delivering superior returns
through our talented, valued employees and our core strengths of:
Best-in-class customer service
Operational excellence that provides consistent, reliable performance to
optimize the assets we own and operate An unwavering commitment to safety,
environmental responsibility, and personal integrity An entrepreneurial
approach toward asset acquisition and development Achieving Financial and
Operational Excellence |
 6
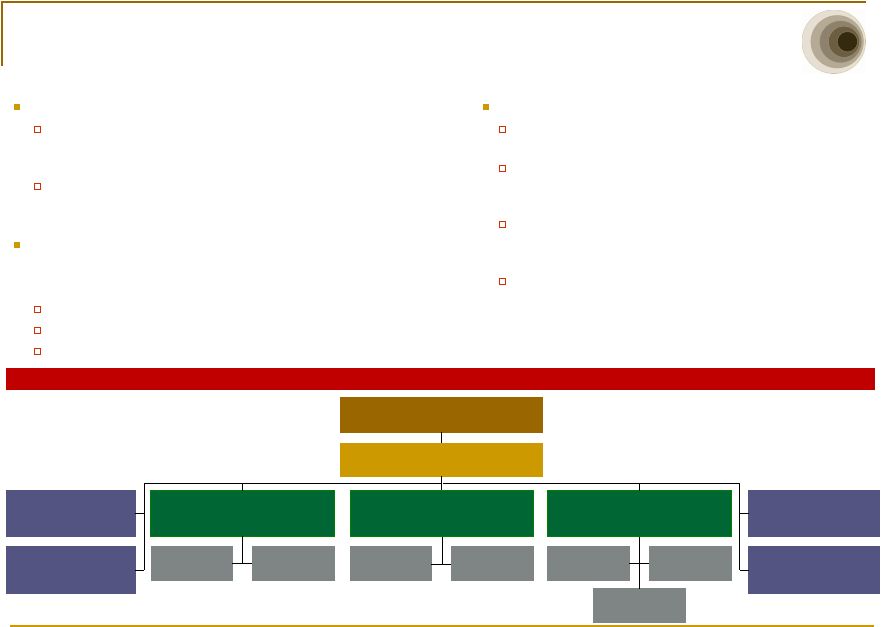
CEO Succession and Strategic Organizational
Realignment
Management Structure after Reorganization
CEO succession effective February 10, 2012:
Clark C. Smith, Buckeye’s President and Chief Operating Officer,
to succeed Forrest E. Wylie as Chief Executive Officer, and will
join the Board of Directors of Buckeye’s general partner.
Forrest E. Wylie to continue to serve as Non-Executive
Chairman of the Board, where he will remain active in developing
our strategic vision.
Strategic Organizational Realignment, effective January 16,
2012; Buckeye operations organized into three business
units, each headed by a President.
Domestic Pipelines and Terminals
International Pipelines and Terminals
Buckeye Services
Clark C. Smith
Chief Executive Officer
Mary F. Morgan
President, International
Pipelines and Terminals
Robert A. Malecky
President, Domestic
Pipelines and Terminals
Jeremiah J. Ashcroft III
President,
Buckeye Services
Domestic
Pipelines
Domestic
Terminals
BORCO
Terminal
Yabucoa
Terminal
Energy
Services
Natural Gas
Storage
Strategic Organizational Realignment benefits:
Previous structure organized around functions (e.g.,
commercial, operations, etc.)
Growth has resulted in increased complexities in each of
Buckeye’s business areas, requiring focus and ownership of
skilled executives on daily basis.
Allows business unit Presidents to focus on all aspects -
including commercial, operational and financial performance -
of their respective business unit.
Presidents of business units accountable for overall
performance of those units.
Development
& Logistics
Keith E. St.Clair
Chief Financial
Officer
William H.
Schmidt, Jr.
General Counsel
Mark S. Esselman
Global
Human Resources
Forrest E. Wylie, Chairman
Board of Directors
Forrest E. Wylie, Chairman
Khalid A. Muslih
Corp. Development
Strategic Planning |
 7
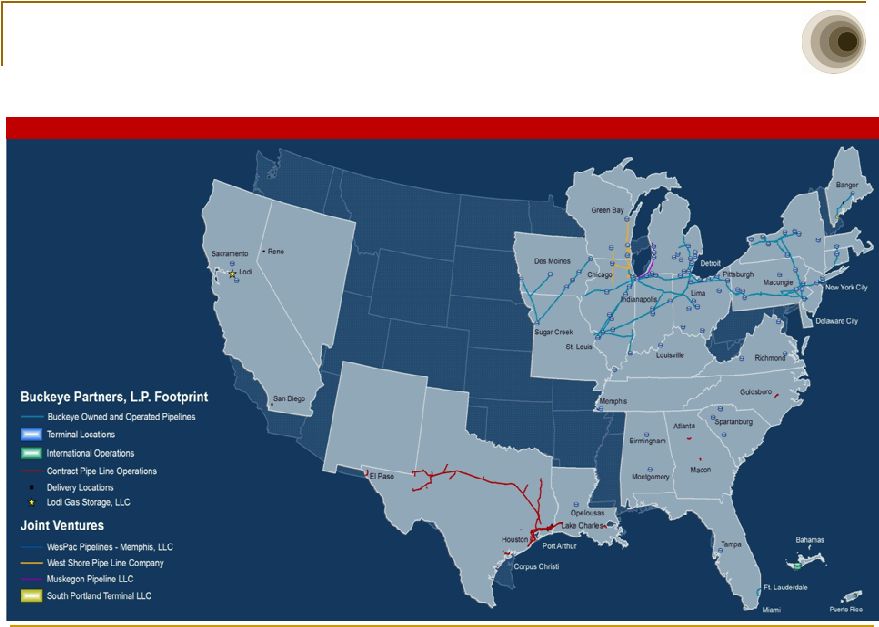
Pipeline, Terminal, Storage and Delivery Locations
Current Asset Map |
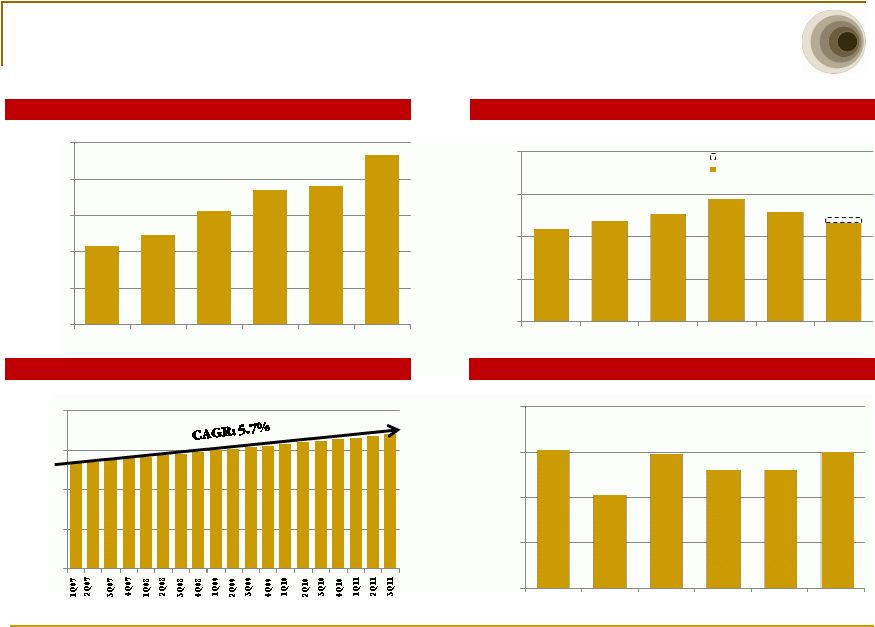
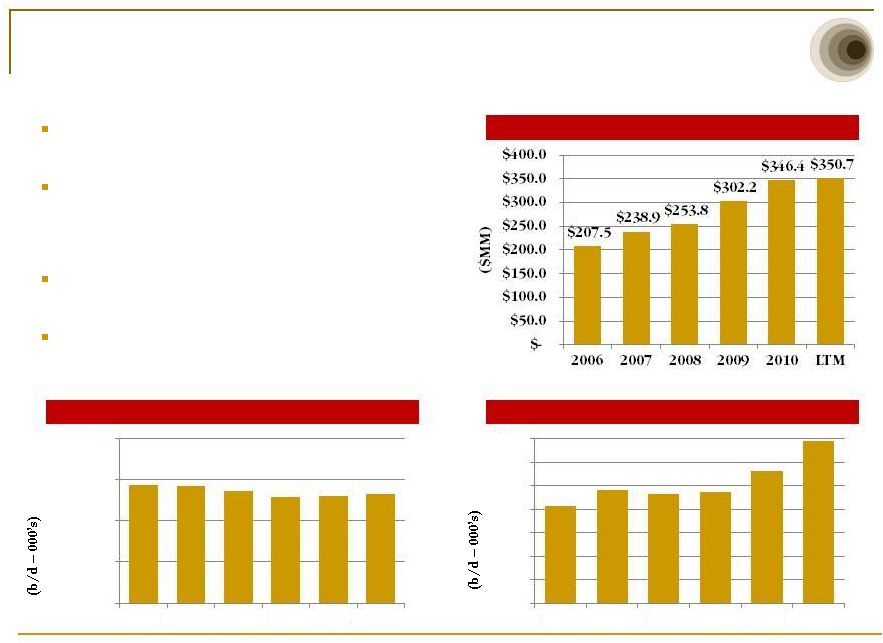 Pipelines & Terminals
Pipelines and Terminals represents Buckeye’s largest
segment contribution to Adjusted EBITDA
Over 6,000 miles of pipeline located primarily in the
Northeast and Midwest United States moving
approximately 1.3 million barrels per day with more
than 100 delivery points
Nearly 100 liquid petroleum product storage terminals
located throughout the United States
Over 37 million barrels of storage capacity
(1)
LTM as of September 30, 2011. See Appendix for Non-GAAP
Reconciliations (2)
YTD as of September 30, 2011
(3)
Pipeline volumes exclude contribution from the Buckeye NGL Pipeline sold in
January of 2010 1,430.5
1,427.0
1,361.3
1,296.0
1,304.5
1,321.2
0.0
500.0
1,000.0
1,500.0
2,000.0
2006
2007
2008
2009
2010
2011
414.7
482.3
464.4
471.9
562.5
688.4
0
100
200
300
400
500
600
700
2006
2007
2008
2009
2010
2011
8
Pipeline
Throughput
Volumes
(2)(3)
Terminal
Throughput
Volumes
(2)
Segment
Adjusted
EBITDA
(1) |
 9
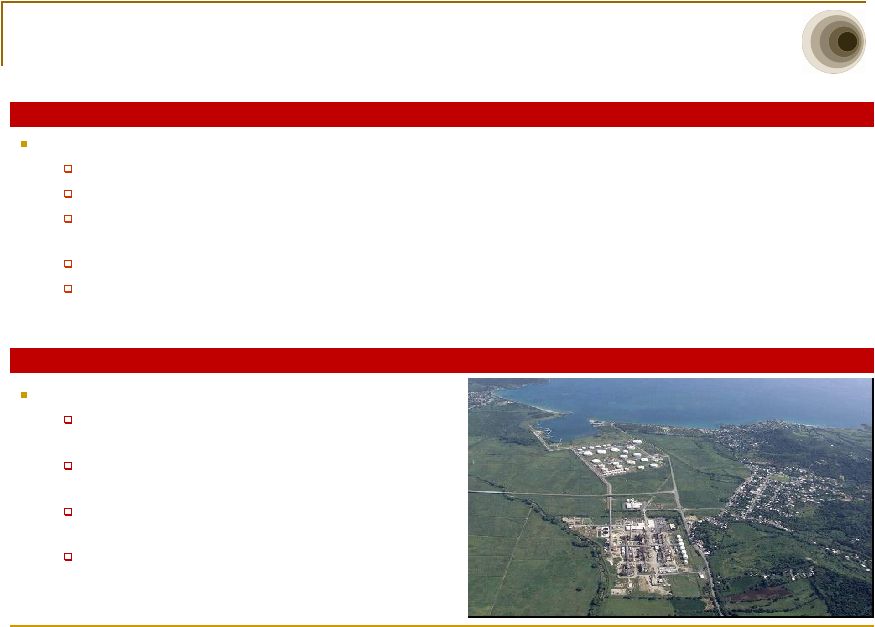
International Operations
BORCO
Yabucoa, Puerto Rico
Bahamas Oil Refining Company International (“BORCO”)
BORCO owns and operates a world-class marine storage terminal for liquid
petroleum products 80 tanks providing 21.6 million barrels of crude oil,
fuel oil, and refined petroleum product storage Strategically positioned
along major shipping lanes off the southern tip of Grand Bahama Island only 80 miles
from Florida and 920 miles from New York Harbor
Deep water berthing capability to handle ULCCs and VLCCs
Identified near term expansion project and room to ultimately double the
existing storage capacity Yabucoa Terminal
Well maintained facility with superior
blending/manufacturing facilities
4.6 million barrels of gasoline, jet fuel, diesel, fuel
oil, and crude oil storage capacity
Strategic location supports a strong local market
and also provides regional growth opportunities
Long term fee-based revenues supported by multi-
year volume commitments from Shell |
 10
Natural Gas Storage
Buckeye’s Lodi Gas Storage facility is a high performance natural gas
storage facility with approximately 30 Bcf of working gas capacity in
Northern California serving the greater San Francisco Bay Area
Revenue
is
generated
through
contract
lease
rates
as
well
as
hub
services
The
Lodi
and
Kirby
Hills
sites
collectively
have
a
maximum
injection
and
withdrawal
capability
of
approximately
550
million
cubic
feet
per
day
(MMcf/day)
and
750
MMcf/day,
respectively
Lodi's
facilities
are
designed
to
provide
high
deliverability
natural
gas
storage
service
and
have
a
proven
track
record
of
safe and reliable operations
Kirby Hills Compressor Station
Lodi Compressor Station |
 11
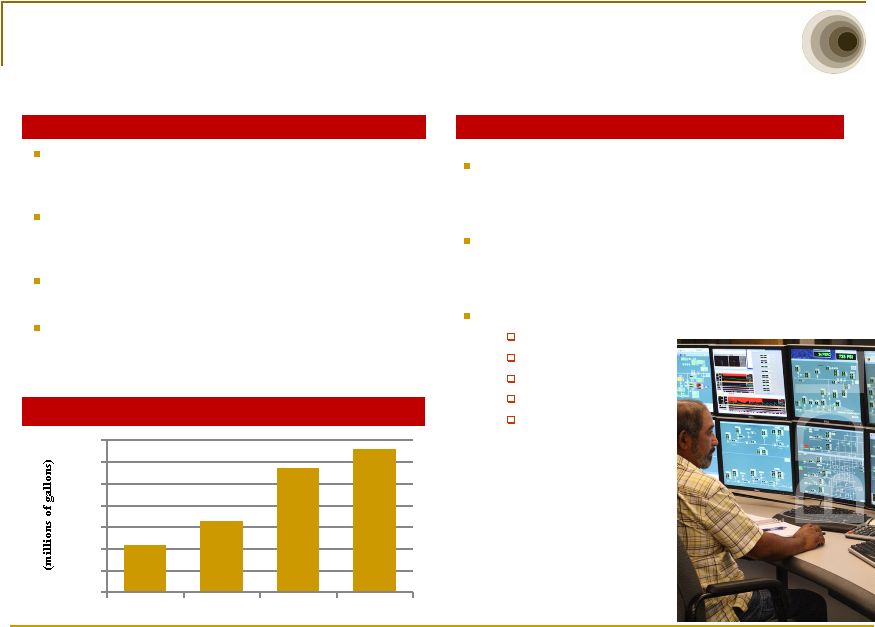
Energy Services and Development & Logistics
Buckeye Energy Services LLC (“BES”) markets
refined petroleum products in areas served by
Buckeye’s pipelines and terminals
BES offers a wide range of products such as heating
oil, diesel, kerosene, propane, gasoline, and ethanol
and other bio fuels
Over 1 billion gallons of refined petroleum products
sold annually
Year to date, BES has contributed $31 million in
revenue to the Pipelines and Terminals segment by
utilizing that segment’s assets to transport and store
BES product.
Energy Services
Development & Logistics
Buckeye Development & Logistics (“BDL”)
currently operates approximately 2,800 miles of
pipelines and 1.4 million barrels of storage capacity
BDL is also responsible for identifying and
completing potential acquisitions and organic growth
projects for Buckeye
BDL services offered to customers
Contract operations
Project origination
Asset development
Engineering design
Project management
(1)
As of September 30, 2011
435
655
1,139
1,320
0
200
400
600
800
1,000
1,200
1,400
2008
2009
2010
LTM
(1)
BES Refined Product Sales
(1)
|
 12
Growth Drivers
$ in millions
Organic Growth Capital Spending
Projected Organic Growth Spend
Low
Midpoint
High
2011 Projected
Legacy Assets
$70
$75
$80
BORCO Facility
170
185
200
Total Expected Spend
$240
$260
$280
2012 Projected
Legacy Assets
$75
$90
$105
BORCO Facility
100
140
180
Total Expected Spend
$175
$230
$285
Range of Expected Spend
2011 (YTD)
(1)
BORCO Marine Terminal, $1.7 billion
BP Terminal & Pipeline Assets, $165.0 million
Maine terminals and pipeline, $23.5 million
2010
(1)
Buy-in of BGH general partner, 20 million units issued
Yabucoa, Puerto Rico Terminal, $32.6 million
Opelousas, Louisiana Terminal, $13.0 million
Additional Joint Venture Interest in West Shore, $13.5
million
2009
Blue/Gold Pipeline and Terminal Assets, $54.4 million
2008
(1)
Lodi Natural Gas Storage, $442.4 million
Farm & Home Oil Company
(2)
, $146.2 million
(3)
Niles and Ferrysburg, Michigan Terminals, $13.9 million
Albany, NY Terminal, $46.9 million
(1)
Includes acquisitions with a value of $10 million or higher
(2)
Now Buckeye Energy Services
(3)
Buckeye sold the retail division of Farm & Home Oil Company in 2008 for $52.6
million Recent Asset Acquisitions
$0.0
$80.0
$160.0
$240.0
$320.0
2008
2009
2010
2011P
2012P
$91.5
$46.5
$63.8
$260.0
$230.0
Legacy Assets (excl. NGS)
Natural Gas Storage
BORCO |
 13
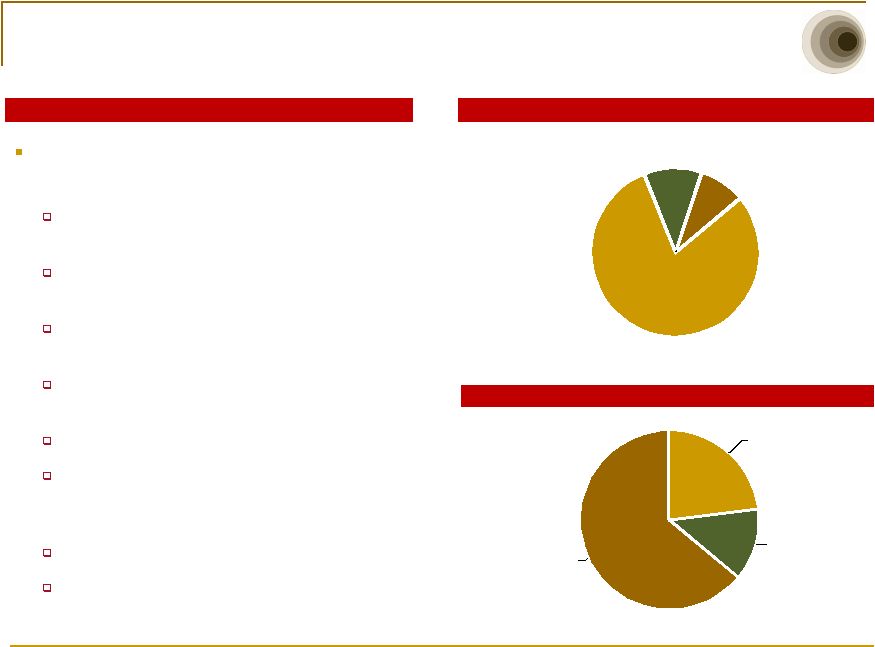
BORCO Acquisition
BORCO Acquisition Overview
BORCO owns and operates a world-class marine
storage terminal for liquid petroleum products
21.6 MMBbls capacity located in Freeport,
Bahamas
Located 80 miles from Southern Florida and 920
miles from New York Harbor
Deepwater access up to 91 feet and the ability to
berth VLCCs and ULCCs
Majority of capacity under long term (3-5 year)
take or pay contracts
World class customer base
Variable revenue generation from ancillary
services such as berthing, blending, bunkering,
and transshipping
Hub for international logistics
Near term expansion project of up to 7.9 million
barrels with room to double existing storage
capacity
Product Breakdown
2010 Revenue Breakdown
Crude oil
23%
CPP
13%
Fuel oil
64%
Storage
80%
Berthing
11%
Other Ancillary
9%
Take or Pay
Variable |
 14
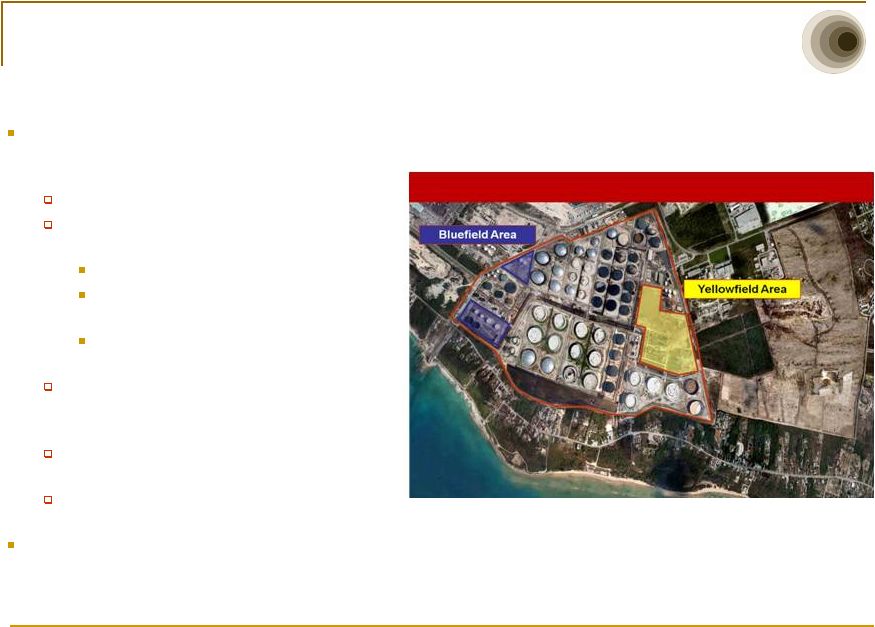
BORCO Expansion Project
Near term expansion project at BORCO is
expected to provide up to an additional 7.9
million barrels of storage capacity
Project to be completed in phases
Phase 1 to add approximately 3.5 million
barrels of storage capacity
Initiated in the second quarter of 2011
First incremental capacity expected to
be online in the second half of 2012
Combination of clean products and
fuel oil
Later phases expected to provide up to an
additional 4.4 million barrels of storage
capacity
Total project cost expected to be $350-400
million
Combined EBITDA from all phases
expected to be $70-80 million
Longer term opportunity to double existing
storage capacity
Identified Near Term Project |
 15
BP Pipelines & Terminals Acquisition
BP Pipelines and Terminals Acquisition Overview
Total transaction purchase price of $165 million
Transaction benefits:
Represents a key step in Buckeye’s continued expansion and geographic
diversification efforts Facilitates participation in several key growth
markets outside Buckeye’s current system footprint Provides stable
tariff and fee-based revenue streams, supported by multi-year throughput commitments by BP
Expected to be immediately accretive to distributable cash flow
Several identified opportunities for further commercial development of these
assets Rapid realization of operating synergies with Buckeye’s
existing assets 33 liquid products terminals located in:
Alabama-
2 terminals
California-
2 terminals
Florida-
1 terminal
Iowa -5 terminals
Indiana-
1 terminal
643 miles of refined product pipeline including:
590-mile “Lower V”
pipeline system that originates in Dubuque, Iowa and runs southwest into
Missouri and then northwest back into Iowa
53-miles of other assorted pipelines in northern Ohio
Kentucky -1 terminal
Michigan-
3 terminals
Missouri-
1 terminal
Ohio-
8 terminals
Pennsylvania-
2 terminals
South Carolina-
3 terminals
Virginia-
3 terminals
Wisconsin-
1 terminal |
 16
Strong Financial Performance
Adjusted EBITDA ($MM)
(1)
Cash Distributions per Unit
Cash
Distribution
Coverage
(1)(2)
(1)
LTM as of September 30, 2011. See Appendix for Non-GAAP
Reconciliations (2)
Distributable cash flow divided by cash distributions declared for the respective
period (3)
Long-term debt less cash and cash equivalents divided by Adjusted
EBITDA Net LT Debt/ Adjusted EBITDA
(1)(3)(4)
(4)
For purposes of calculating the leverage, Adjusted EBITDA for the LTM period
includes BORCO Adjusted EBITDA post-acquisition as included in
reported results and pro forma BORCO Adjusted EBITDA of $34.0 million for
the period prior to the acquisition (5)
Pro forma distribution coverage excludes $13.0 million of acquisition and
integration expenses incurred in 2011 and $4.1 million incurred in Q4
2010 $217.1
$248.5
$313.6
$370.2
$382.6
$466.4
$0.0
$100.0
$200.0
$300.0
$400.0
$500.0
2006
2007
2008
2009
2010
LTM
$0.00
$0.30
$0.60
$0.90
$1.20
4.58x
3.09x
4.44x
3.95x
3.94x
4.51x
0.00x
1.50x
3.00x
4.50x
6.00x
2006
2007
2008
2009
2010
LTM
0.87x
0.95x
1.01x
1.16x
1.03x
0.94x
0.00x
0.40x
0.80x
1.20x
1.60x
2006
2007
2008
2009
2010
LTM
Proforma Distribution Coverage
Declared Distribution Coverage
0.99x
(5
) |
 17
Summary
Proven 25-year track record as a publicly traded partnership through varying
economic and commodity price cycles Diversified portfolio of assets
provides balanced mix of stability and growth and is well positioned to take advantage of
improving economic conditions
Recent acquisitions provide Buckeye with increased geographic and product
diversity, including access to international logistics
opportunities Significant near term organic growth projects
Management
continues
to
drive
operational
excellence
through
its
best practices initiative
Execution of our strategy has allowed Buckeye to increase distributions to
unitholders for 30 consecutive quarters Investing in Stability and
Growth |
 18
Non–GAAP Reconciliations |
 19
Explanation of Non–GAAP Measures
Explanation of Non–GAAP Measures
Buckeye’s equity-funded merger with Buckeye GP Holdings L.P.
(“BGH”) in the fourth quarter of 2010 has been treated as a reverse merger for accounting purposes. As a result, the
historical results presented herein for periods prior to the completion of the
merger are those of BGH, and the diluted weighted average number of
limited partnership (“LP”) units outstanding
increased
from
20.0
million
in
the
fourth
quarter
of
2009 to 44.3 million in the fourth quarter of 2010. Additionally, Buckeye
incurred a non-cash charge to compensation expense of $21.1 million
in the fourth quarter of 2010 as a result of a distribution of LP units owned by BGH GP Holdings, LLC to certain officers of Buckeye, which triggered a
revaluation of an equity incentive plan that had been instituted
in 2007.
EBITDA, a measure not defined under U.S. generally accepted accounting
principles (“GAAP”), is defined by Buckeye as net income attributable to Buckeye’s unitholders before
interest and debt expense, income taxes, and depreciation and amortization. The
EBITDA measure eliminates the significant level of non-cash depreciation and amortization expense
that results from the capital-intensive nature of Buckeye’s businesses
and from intangible assets recognized in business combinations. In addition, EBITDA is unaffected by Buckeye’s
capital structure due to the elimination of interest and debt expense and income
taxes. Adjusted EBITDA, which also is a non-GAAP measure, is defined by Buckeye as EBITDA
plus:
(i)
non-cash
deferred
lease
expense,
which
is
the
difference
between
the
estimated annual land lease expense for Buckeye’s natural gas storage
facility in the Natural Gas Storage segment to be recorded under GAAP and
the actual cash to be paid for such annual land lease; (ii) non-cash
unit-based compensation expense; (iii) the 2009 non-cash impairment
expense
related
to
the
natural
gas
liquids
pipeline
that
Buckeye
sold in January 2010 (the “Buckeye NGL Pipeline”); (iv) the 2009
expense for organizational restructuring (the “Organizational
Restructuring Expense”); (v) the 2010 non-cash BGH GP Holdings, LLC equity plan modification expense (the “Equity Plan Modification Expense”); (vi) income
attributable to noncontrolling interests related to Buckeye for periods prior to
the merger of Buckeye and BGH (the “Merger”); and (vii) the goodwill impairment expense associated
with Lodi; less: (i) amortization of unfavorable storage contracts acquired in
connection with the acquisition of Bahamas Oil Refining Company International (“BORCO”); and (ii)
gain on the sale of our equity interest in West Texas LPG limited partnership
(“WT LPG”). The EBITDA and Adjusted EBITDA data presented may not be directly comparable to
similarly titled measures at other companies because EBITDA and Adjusted EBITDA
exclude some items that affect net income attributable to Buckeye’s unitholders, and these
measures may be defined differently by other companies. Management of Buckeye
uses Adjusted EBITDA to evaluate the consolidated operating performance and the operating
performance of the business segments and to allocate resources and capital to
the business segments. In addition, Buckeye’s management uses Adjusted EBITDA as a performance
measure to evaluate the viability of proposed projects and to determine overall
rates of return on alternative investment opportunities. Distributable
cash flow, which is a financial measure included in this presentation, is another measure not defined under GAAP. Distributable cash flow is defined by Buckeye as net
income attributable to Buckeye’s unitholders, plus: (i) depreciation and
amortization expense; (ii) noncontrolling interests related to Buckeye that were eliminated as a result of the
Merger; (iii) deferred lease expense for Buckeye’s Natural Gas Storage
segment; (iv) non-cash unit-based compensation expense; (v) Equity Plan Modification Expense; (vi) the
Buckeye NGL Pipeline impairment expense; (vii) the senior administrative charge;
(viii) the goodwill impairment expense associated with Lodi; (ix) write-off of deferred financing
costs;
(x)
amortization
of
deferred
financing
costs
and
debt
discounts;
and
(xi)
the
Organizational
Restructuring
Expense
(items
(i) through (x) of which are non-cash expense); less:
(i) maintenance capital expenditures; (ii) amortization of unfavorable storage
contracts acquired in connection with the BORCO acquisition; and (iii) gain on the sale of our equity
interest in WT LPG. Buckeye’s management believes that distributable
cash flow is useful to investors because it removes non-cash items from net income and provides a clearer
picture of Buckeye’s cash available for distribution to its
unitholders. EBITDA, Adjusted EBITDA, and distributable cash flow should not be considered alternatives to net income,
operating income, cash flow from operations, or any other measure of financial
performance presented in accordance with GAAP. Buckeye believes that
investors benefit from having access to the same financial measures used by Buckeye’s management. Further, Buckeye believes that these measures are useful to
investors because they are one of the bases for comparing Buckeye’s
operating performance with that of other companies with similar operations, although Buckeye’s measures may
not be directly comparable to similar measures used by other companies.
|
 20
Non-GAAP Reconciliations
Net Income to Adjusted EBITDA ($M)
(1)
LTM as of September 30, 2011
(2)
On November 19, 2010, Buckeye merged with Buckeye GP Holdings L.P.
(3)
In
2010,
Buckeye
revised
its
definition
of
Adjusted
EBITDA
to
exclude
non-cash
unit-based
compensation
expense,
the
2010
non-cash
equity
plan
modification
expense
and
income
attributable
to
noncontrolling
interests
affected
by
the
merger
for
periods
prior
to
our
buy-in
of
our
general
partner.
These
amounts
were
excluded from Adjusted EBITDA presented for 2008, 2009 and 2010 in our Annual
Report on Form 10-K for the year ended December 31, 2010, as
amended. Adjusted EBITDA for 2006 and 2007 has been restated in this
presentation to exclude these amounts for comparison purposes. 2006
2007
2008
2009
2010
LTM
(1)
Net income attributable to BPL
8,734
22,921
26,477
49,594
43,080
57,176
Interest and debt expense
60,702
51,721
75,410
75,147
89,169
114,373
Income tax expense (benefit)
596
760
801
(343)
(919)
(677)
Depreciation and amortization
39,629
40,236
50,834
54,699
59,590
102,558
EBITDA
109,661
115,638
153,522
179,097
190,920
273,430
Net income attributable to noncontrolling interests affected by
merger
(2)
107,091
131,941
153,546
90,381
157,467
27,262
Amortization of unfavorable storage contracts
-
-
-
-
-
(4,813)
Gain on sale of equity investment
-
-
-
-
-
(34,112)
Non-cash deferred lease
-
-
4,598
4,500
4,235
4,150
Non-cash unit-based compensation expense
329
968
1,909
4,408
8,960
9,894
Equity plan modification expense
-
-
-
-
21,058
21,058
Asset impairment expense
-
-
-
59,724
-
-
Goodwill impairment expense
-
-
-
-
-
169,560
Reorganization expense
-
-
-
32,057
-
-
217,081
248,547
313,575
370,167
382,640
466,429
Adjusted Segment EBITDA
Pipelines & Terminals
207,455
238,830
253,790
302,164
346,447
350,732
International Operations
-
-
-
(4,655)
81,593
Natural Gas Storage
-
41,814
41,950
29,794
11,749
Energy Services
-
9,443
19,335
5,861
15,099
Development & Logistics
9,626
9,717
8,528
6,718
5,193
7,256
Total Adjusted EBITDA
217,081
248,547
313,575
370,167
382,640
466,429
Adjusted EBITDA
(3)
|
 21
Non-GAAP Reconciliations
Net Income to Distributable Cash Flow ($M)
(1)
LTM as of September 30, 2011
(2)
On November, 19, 2010, Buckeye merged with Buckeye GP Holdings L.P.
(3)
In 2011, Buckeye revised its definition of Distributable Cash Flow to exclude
amortization of deferred financing costs and debt discounts. Distributable Cash Flow for 2006-2010 have been restated to exclude those amounts for comparison purposes.
(4)
Represents cash distributions declared for limited partner units
(LP units) outstanding as of each respective period. 2011 amounts reflect actual
cash distributions paid on LP units for the quarters ended March 31 and
June 30, 2011 and estimated cash distributions for the quarter ended September 30, 2011. Distributions with respect
to the 6,915,725 and 7,042,771 Class B units outstanding on the record
date for the quarter ending March 31 and June 30, 2011,
respectively, and the 7,175, 839 Class B units expected to be outstanding for the
quarter ending September 30, 2011 are paid in additional Class B units rather than in cash.
2006
2007
2008
2009
2010
LTM
(1)
Net income attributable to BPL
8,734
22,921
26,477
49,594
43,080
57,176
Depreciation and amortization
39,629
40,236
50,834
54,699
59,590
102,558
Net income attributable to noncontrolling interests affected by
merger
(2)
107,091
131,941
153,546
90,381
157,467
27,262
Gain on sale of equity investment
-
-
-
-
-
(34,112)
Non-cash deferred lease expense
-
-
4,598
4,500
4,235
4,150
Non-cash unit-based compensation expense
329
968
1,909
4,408
8,960
9,894
Equity plan modification expense
-
-
-
-
21,058
21,058
Asset impairment expense
-
-
-
59,724
-
-
Reorganization expense
-
-
-
32,057
-
-
Non-cash senior administrative charge
-
950
1,900
475
-
-
Amortization of unfavorable storage contracts
-
-
-
-
-
(4,813)
Write-off of deferred financing costs
-
-
-
-
-
3,331
Amortization of deferred financing costs and debt discounts
(3)
3,347
1,448 1,737
3,134
4,411
4,386
Goodwill impairment expense
-
-
-
-
-
169,560
Maintenance capital expenditures
(30,234)
(33,803)
(28,936)
(23,496)
(31,244)
(41,815)
Distributable Cash Flow
128,896
164,661
212,065
275,746
267,557
311,150
Cash Distributions for Coverage ratio
(4)
147,979
173,689
209,412
237,687
259,315
332,441
Cash Coverage Ratio
0.87
0.95
1.01
1.16
1.03
0.94 |