Attached files
| file | filename |
|---|---|
| 8-K - 8-K - DORAL FINANCIAL CORP | d285031d8k.htm |
| EX-99.1 - EX-99.1 - DORAL FINANCIAL CORP | d285031dex991.htm |
 Doral Financial Corporation
Q4 ‘11 Investor Presentation
January 2012
Exhibit 99.2 |
 Disclaimer
2
This presentation may include forward-looking statements as defined in the Private Securities
Litigation Reform Act of 1995 (the “PSLRA”). These include comments with
respect to our objectives and strategies, and the results of our operations and our business.
Forward-looking statements can be identified by the fact that they do not relate strictly to
historical or current facts. They often include words such as “expects,”
“anticipates,” “intends,” “plans,” “believes,”
“seeks,” “estimates,” or words of similar meaning, or future or conditional verbs
such as “will,” “would,” “should,” “could” or
“may.” We intend these forward-looking statements to be covered by the safe harbor provisions of the PSLRA.
Forward-looking statements provide our expectations or predictions of future conditions, events or
results. They are, by their nature, subject to risks and uncertainties. They are not guarantees
of future performance, and actual results may differ materially. By their nature, these
forward-looking statements involve numerous assumptions and uncertainties, both general and
specific, including those discussed in Doral Financial Corporation’s 2010 Annual Report on Form 10-K
and other filings we make with the Securities and Exchange Commission. Risk factors and uncertainties
that could cause the Company's actual results to differ materially from those described in
forward-looking statements can be found in the Company's 2010 Annual Report on Form
10-K, which is available in the Company's website at www.doralfinancial.com, as they may be updated from time to time in the Company’s periodic and other reports filed with
the Securities and Exchange Commission.
The statements in this presentation speak only as of the date they are made. We do not
undertake to update forward- looking statements to reflect the impact of circumstances or
events that arise after the date the forward-looking statements were made.
|
 Q4
Overview 3
Sustained improvements in income drivers
o
Net Interest Margin growth of $1 million
o
Non Interest Expense reduction of $2 million
o
Pre-tax, Pre-Provision income of $13 million
NPL’s
remain
flat
at
9.7%
of
total
loans
and
loss
provision
returned
to
pre-third
quarter levels.
Tax savings of $8.9MM realized on efficiencies from US thrift and Doral Bank
merger and release of Deferred Tax Asset reserve related to improvements in
profitability in Puerto Rico entities.
Doral generated $12 million in Net Income in Q4 |
 Though Stabilizing, Puerto Rico Economy Remains a Challenge
4
Overview
Economic stabilization tied to employment stability.
Employment continues to hold steady at ~918k jobs with
moderate growth expected in 2012.
o
Unemployment rate expected to decline from 16.1% in ‘10 to
14.2% in ‘12.
Recent Government and industry reports indicate that
affordable housing continues to recover faster than the
overall economy.
o
Affordable units projected to make up 75% of total sales over
next 5-years
Source: Puerto Rico Government Development Bank, Puerto Rico Planning Board,
Moody’s economy.com Puerto Rico Government Construction Estimates
New Affordable Housing To Increase Over The Next 5 Years
2.7%
1.9%
0.5%
(1.2)%
(2.9)%
(4.0)%
(3.8)%
<1.0%
GNP Evolution
Employment
Housing
(1.0)% |
 Doral
Financial Corporation Profile 5
Overview
Doral’s Geographic diversification continues:
o
US loans now account for 25% of total loans (up from
22% in Q3)
o
$308MM in US Retail deposits as of Q4
o
$1.8MM of tax efficiencies from US thrift and Doral Bank
merger benefits realized in 4Q
Puerto Rican loan portfolio repositioned to leverage
stabilized economy:
o
Liquidation of Puerto Rico construction and development
loan portfolio continues as these loans now account for
only 4% of total loans
o
80% of loans are Residential mortgages. Doral’s
mortgage portfolio is seasoned and concentrated in
affordable price segments (<$150K)
Doral has a Book Value per share of $3.80 plus an
additional $2.78 per share of tax reserves.
o
Doral currently has a valuation allowance against its deferred
tax asset equal to an additional $2.78 per share.
o
Doral released $7.1MM ($0.06 per share) of DTA reserve in Q4
Doral exceeds well capitalized standards
o
Tier-1 Leverage Ratio: 9.13%
o
Total Risk-Based Capital Ratio: 13.43%
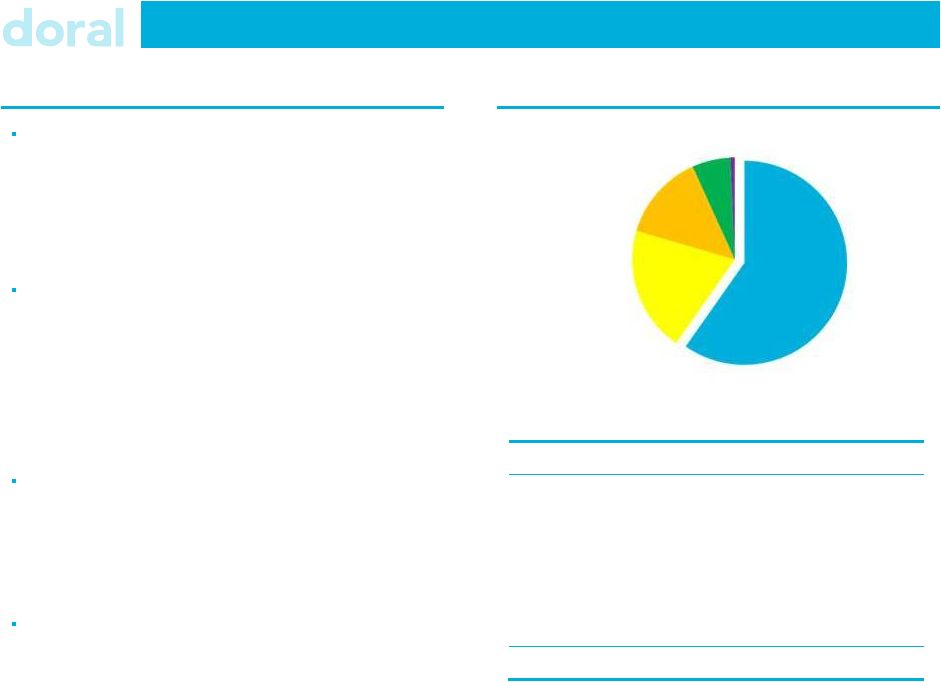
Loan Portfolio Composition
$ mm
Loan Category
PR
USA
Total
Residential
$3,722.2
$11.9
$3,734.1
CRE
588.1
267.0
855.1
C&I
50.8
1,188.3
1,239.1
Construction and
Development
281.1
97.4
378.5
Consumer / Other
38.7
5.9
44.6
Total
4,680.9
1,570.5
6,251.4
Mortgage
(60%)
C&I
(20%)
CRE
(14%)
Construction & Development
(6%)
Consumer / Other
(<1%)
$6,251 MM |
 Q4
2011 Financial Results 6
Continued NIM growth of $1MM in Q4
to $49.4MM (267bps) and lower Non
Interest Expense drives pre-tax pre-
provision income of $13MM.
Provision has returned to a more
normalized level of $9.9MM.
Tax benefits:
o
Released $7.1MM of DTA valuation
allowance due to sustained
profitability in PR entities
o
Realized $1.8MM of tax efficiencies
related to US thrift and Doral Bank
Merger
Selected Financial Highlights
($ MM)
Net Interest Income
$49.4
Non Interest Income
25.3
Non Interest Expense
61.7
Pre-Tax Pre-Provision Income
$13.0
Provision
9.9
Tax Expense
(8.6)
Net Income
$11.7
Total Assets
$7,975
Net Interest Margin
2.67%
Tier 1 Leverage Ratio
9.13%
Book Value per Share
1
$3.80
1
Does not include $2.78 per share of valuation allowance against Doral’s
Deferred Tax Asset |
 7
Highlights
Net Interest Margin further improved to 2.67% (82 bps
improvement since Q4 2010).
Retail deposit costs declined to 1.15% (61 bps
improvement since Q4 2010).
Non Interest Expense declined $2.3MM on lower credit
costs.
Continued strength in Non-Interest Income driven by
solid performance in Mortgage, Insurance and Retail
Banking.
Core Profitability
7
($ MM)
Net Interest Margin
Cost of Retail Deposits
Pre-Tax, Pre-Provision Income
1.76%
1.61%
1.39%
1.26%
1.15% |
 Credit Coverage Ratios
Q4 Asset Quality & Provision
NPLs to total loans flat at 9.7%.
1
In addition to $113MM in loan loss reserves,
Doral’s credit exposure is further reduced by
$156MM from partial charge-offs, discounts,
and deferred fees.
Including these items the modified coverage
ratio is at 4.5% of total loans and 32.0% of
NPLs.
($mm)
Balance (12/31/11)
Modified
Coverage Ratio
Loans
1
NPLs
1
NPLs
1
/
Loans
1
Loans
2
NPLs
3
Residential
$3,451
$307
8.9%
3.8%
27.3%
Consumer
45
0
0.8%
11.3%
1,233.7%
CRE
855
173
20.2%
6.0%
23.2%
C&I
1,239
2
0.2%
0.8%
349.8%
Constr. &
Dev.
379
98
25.9%
16.8%
45.6%
Total
$5,969
$581
9.7%
4.5%
32.0%
2 (Reserves + Partial Charge-offs + Discounts + Deferred Fees) / (Loan
Receivable Balance Excluding Held for Sale + Partial Charge-offs +
Discounts + Deferred Fees)
3 (Reserves + Partial Charge-offs + Discounts + Deferred Fees) / (NPLs
Excluding Held for Sale + Partial Charge-offs + Discounts + Deferred
Fees) 1 Excludes Residential loans guaranteed by FHA / VA
8 |
 Doral Strengthened the
Business During 2011 9
4Q ‘11 resulted in an additional ~$100MM in annualized earnings power over 4Q ‘10:
o
Net Interest Margin annualized growth of ~$47MM
o
Non Interest Expense annualized savings of ~$59MM
Doral has Improved Asset Quality:
o
NPL’s
to
loan
ratios
have
decreased
from
11.3%
in
Q4
’10
to
9.7%
o
Added $68MM of provisions in 2011
o
Modified coverage ratio at a solid 32% of NPLs
Doral continues to exceed well capitalized standards:
o
Leverage ratio increased from 8.56% in Q4 ’10 to 9.13% as a result of our successful
asset substitution strategy |
 Investor Relations Contact and Conference Replay Details
10
Investor Relations:
Christopher Poulton
212 / 329-3794
christopher.poulton@doralfinancial.com
Conference Call:
January 20, 2012 10.00 am (Eastern)
Tel. (800) 288-8967 or (612) 332-0335
Conference Call Replay:
January 20, 2012 –
February 20, 2012
Tel. (800) 475-6701 or (320) 365-3844
Access Code: 233992 |
 Exhibit A
Summary Financials |
 Summary Financials
12
($ mm)
31-
Dec -
11
30-Sep-11
30-Jun-11
31-Mar-11
31-Dec-10
Income Statement
Net Interest Income
49.4
$48.2
$45.5
$43.2
$37.6
Provision for Credit Losses
9.9
41.7
13.3
2.6
21.1
NII After Provisions
39.4
6.5
32.2
40.6
16.5
Non-Interest Income
25.3
29.6
38.8
28.6
27.8
Non-Interest Expense
61.7
64.0
63.6
60.8
76.4
Pre-Tax Income
3.1
(27.8)
7.4
8.4
(32.1)
Taxes
(8.6)
2.3
2.9
5.1
4.0
Net Income
11.7
(30.2)
4.5
3.3
(36.1)
Pre-Tax Pre-Provision Income
13.0
13.9
20.6
11.0
(11.0)
Balance Sheet
Total Gross Loans (incl. HFS)
$6,251
$6,111
$5,991
$5,844
$5,908
Loan Loss Reserves
113
118
93
120
124
Total Deposits
4,395
4,349
4.321
4,500
4,636
Total Assets
7,975
8,014
8,016
8,464
8,646
Profitability Metrics
Net Interest Margin
2.67%
2.60%
2.36%
2.23%
1.85%
Capital & Credit Ratios
NPL / Loans¹
9.7%
9.8%
9.9%
10.4%
11.3%
Leverage Ratio
9.13%
8.98%
9.07%
8.87%
8.56%
1 Excludes Residential loans guaranteed by FHA / VA |