Attached files
| file | filename |
|---|---|
| 8-K - WESTERN ALLIANCE BANCORPORATION 8-K - WESTERN ALLIANCE BANCORPORATION | a50136571.htm |
| EX-99.1 - EXHIBIT 99.1 - WESTERN ALLIANCE BANCORPORATION | a50136571ex99_1.htm |
Exhibit 99.2
Ken VecchionePresident & COODale GibbonsExecutive Vice President & CFO 4th Quarter 2011 Earnings Call Western Alliance Bancorporation (NYSE: WAL) January 20, 2012
Forward-Looking Information This presentation contains forward-looking statements that relate to expectations, beliefs, projections, future plans and strategies, anticipated events or trends and similar expressions concerning matters that are not historical facts. The forward-looking statements contained herein reflect our current views about future events and financial performance and are subject to risks, uncertainties, assumptions and changes in circumstances that may cause our actual results to differ significantly from historical results and those expressed in any forward-looking statement. Some factors that could cause actual results to differ materially from historical or expected results include: factors listed in the Company’s annual report on Form 10-K as filed with the Securities and Exchange Commission; changes in general economic conditions, either nationally or locally in the areas in which we conduct or will conduct our business; inflation, interest rate, market and monetary fluctuations; increases in competitive pressures among financial institutions and businesses offering similar products and services; higher defaults on our loan portfolio than we expect; changes in management’s estimate of the adequacy of the allowance for loan losses; legislative or regulatory changes or changes in accounting principles, policies or guidelines; supervisory actions by regulatory agencies which may limit our ability to pursue certain growth opportunities; management’s estimates and projections of interest rates and interest rate policy; the execution of our business plan; and other factors affecting the financial services industry generally or the banking industry in particular.We do not intend and disclaim any duty or obligation to update or revise any industry information or forward-looking statements set forth in this presentation to reflect new information, future events or otherwise.
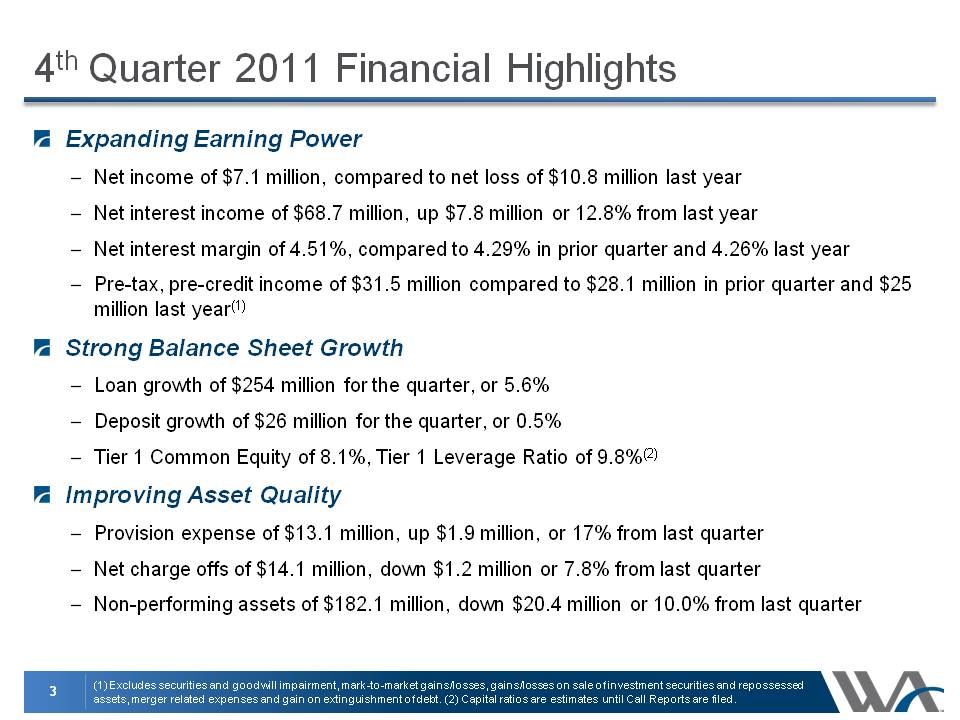
4th Quarter 2011 Financial Highlights Expanding Earning PowerNet income of $7.1 million, compared to net loss of $10.8 million last yearNet interest income of $68.7 million, up $7.8 million or 12.8% from last yearNet interest margin of 4.51%, compared to 4.29% in prior quarter and 4.26% last yearPre-tax, pre-credit income of $31.5 million compared to $28.1 million in prior quarter and $25 million last year(1)Strong Balance Sheet GrowthLoan growth of $254 million for the quarter, or 5.6%Deposit growth of $26 million for the quarter, or 0.5%Tier 1 Common Equity of 8.1%, Tier 1 Leverage Ratio of 9.8%(2)Improving Asset QualityProvision expense of $13.1 million, up $1.9 million, or 17% from last quarterNet charge offs of $14.1 million, down $1.2 million or 7.8% from last quarterNon-performing assets of $182.1 million, down $20.4 million or 10.0% from last quarter
(1) Excludes securities and goodwill impairment, mark-to-market gains/losses, gains/losses on sale of investment securities and repossessed assets, merger related expenses and gain on extinguishment of debt. (2) Capital ratios are estimates until Call Reports are filed.
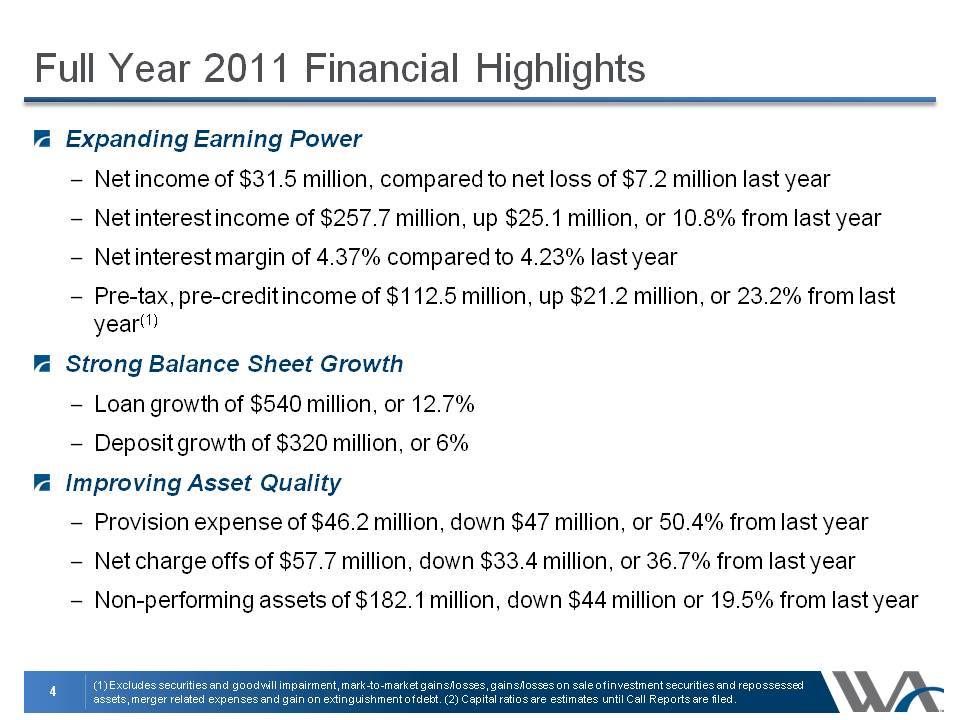
Full Year 2011 Financial Highlights Expanding Earning PowerNet income of $31.5 million, compared to net loss of $7.2 million last yearNet interest income of $257.7 million, up $25.1 million, or 10.8% from last yearNet interest margin of 4.37% compared to 4.23% last yearPre-tax, pre-credit income of $112.5 million, up $21.2 million, or 23.2% from last year(1)Strong Balance Sheet GrowthLoan growth of $540 million, or 12.7%Deposit growth of $320 million, or 6%Improving Asset QualityProvision expense of $46.2 million, down $47 million, or 50.4% from last yearNet charge offs of $57.7 million, down $33.4 million, or 36.7% from last yearNon-performing assets of $182.1 million, down $44 million or 19.5% from last year (1) Excludes securities and goodwill impairment, mark-to-market gains/losses, gains/losses on sale of investment securities and repossessed assets, merger related expenses and gain on extinguishment of debt. (2) Capital ratios are estimates until Call Reports are filed.
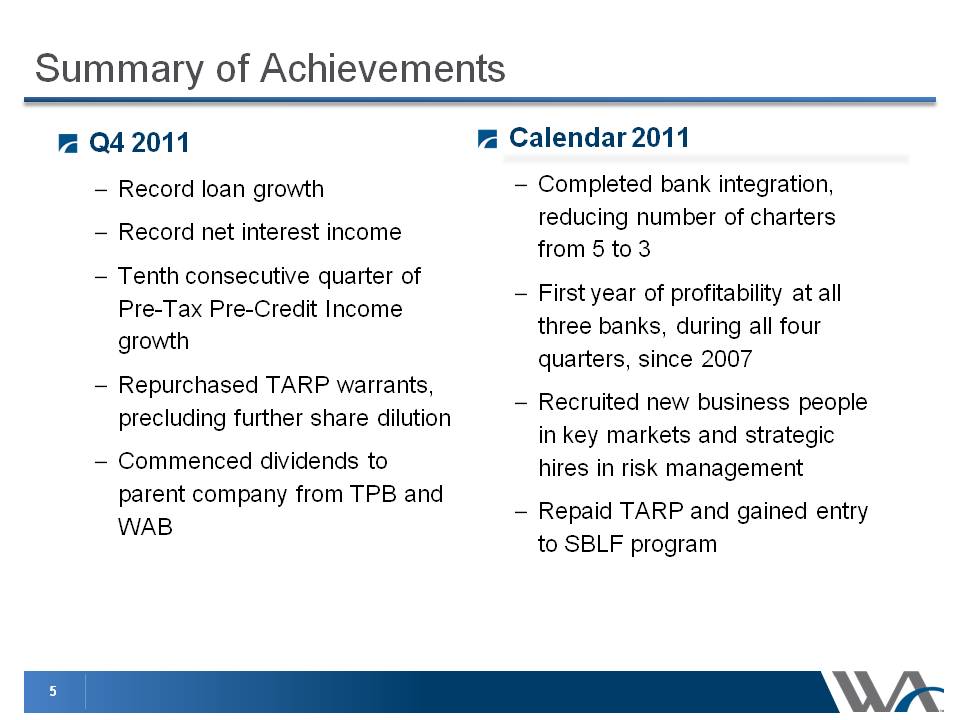
Summary of Achievements Q4 2011 Record loan growthRecord net interest incomeTenth consecutive quarter of Pre-Tax Pre-Credit Income growthRepurchased TARP warrants, precluding further share dilutionCommenced dividends to parent company from TPB and WAB Calendar 2011Completed bank integration, reducing number of charters from 5 to 3First year of profitability at all three banks, during all four quarters, since 2007Recruited new business people in key markets and strategic hires in risk managementRepaid TARP and gained entry to SBLF program
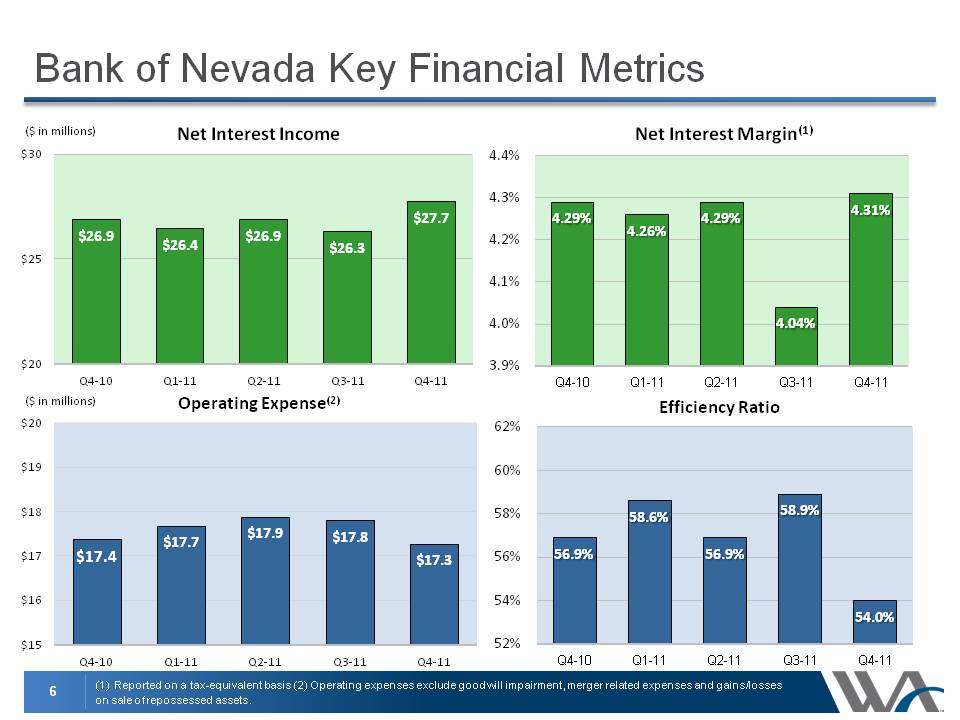
Bank of Nevada Key Financial Metrics ($ in millions) (1) Reported on a tax-equivalent basis (2) Operating expenses exclude goodwill impairment, merger related expenses and gains/losses on sale of repossessed assets. ($ in millions) Operating Expense(2)
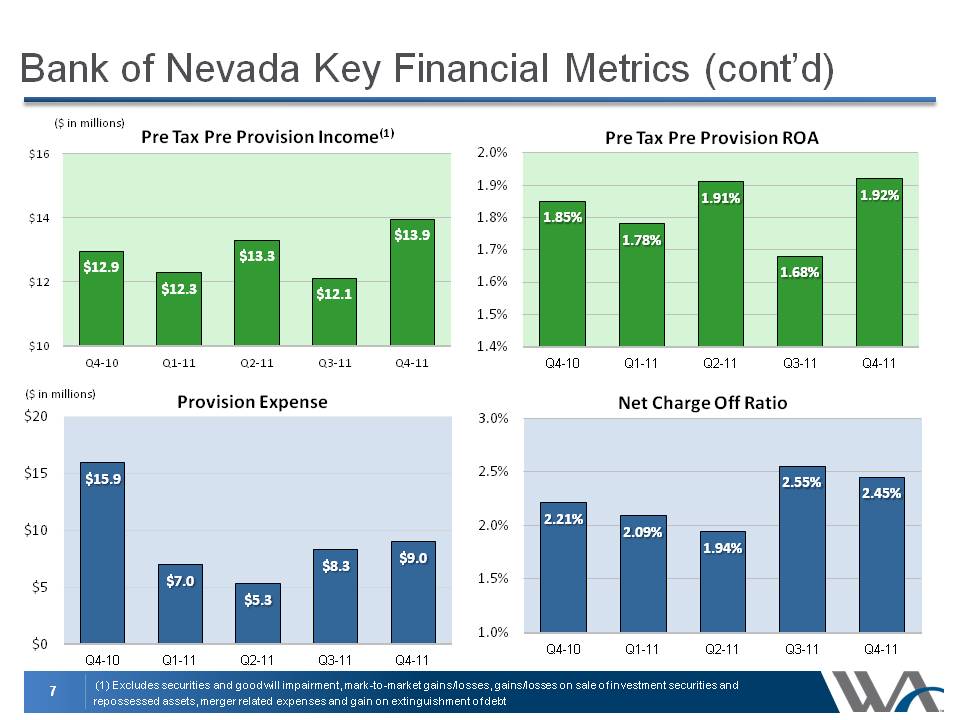
Bank of Nevada Key Financial Metrics (cont’d) Provision Expense ($ in millions) (1) Excludes securities and goodwill impairment, mark-to-market gains/losses, gains/losses on sale of investment securities and repossessed assets, merger related expenses and gain on extinguishment of debt
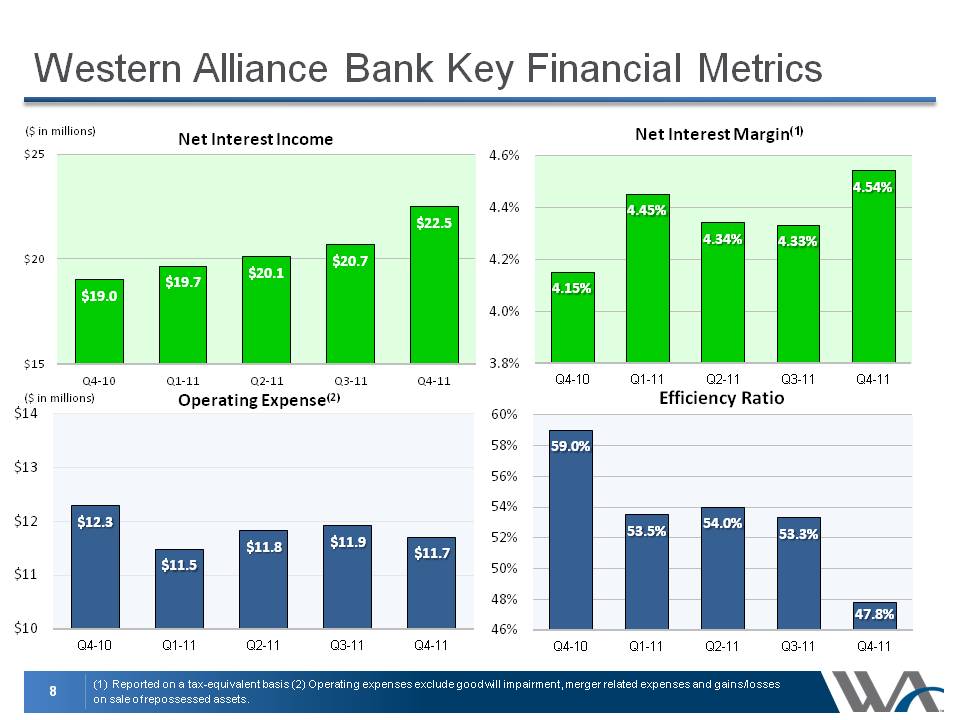
Western Alliance Bank Key Financial Metrics Body: (1) Reported on a tax-equivalent basis (2) Operating expenses exclude goodwill impairment, merger related expenses and gains/losses on sale of repossessed assets. ($ in millions) ($ in millions) Operating Expense(2)
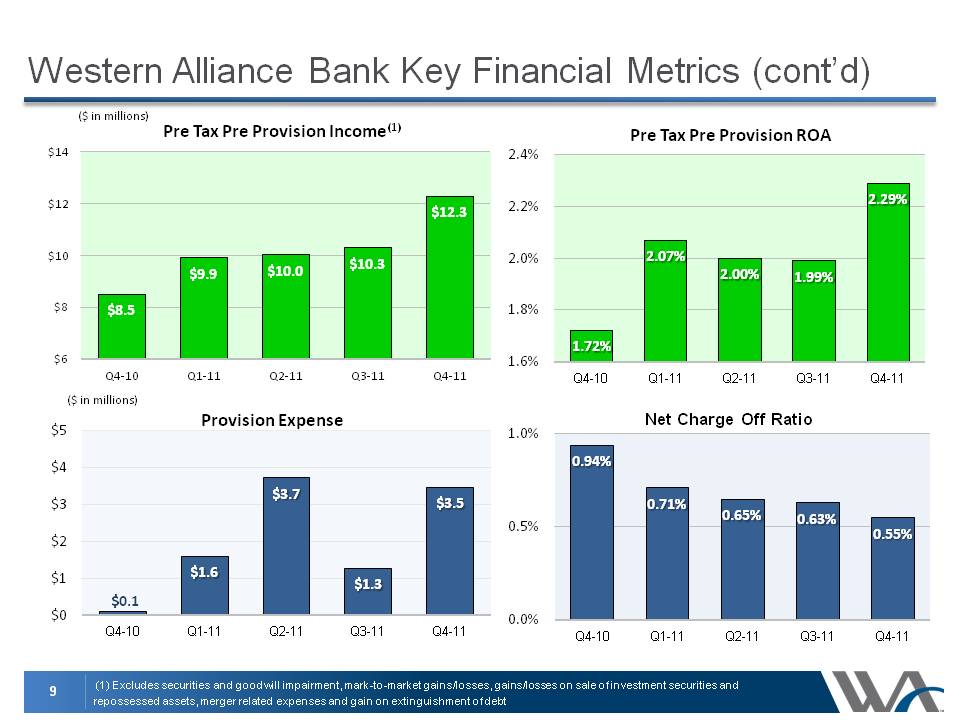
Western Alliance Bank Key Financial Metrics (cont’d) Body: (1) Excludes securities and goodwill impairment, mark-to-market gains/losses, gains/losses on sale of investment securities and repossessed assets, merger related expenses and gain on extinguishment of debt Provision Expense ($ in millions) $0.1
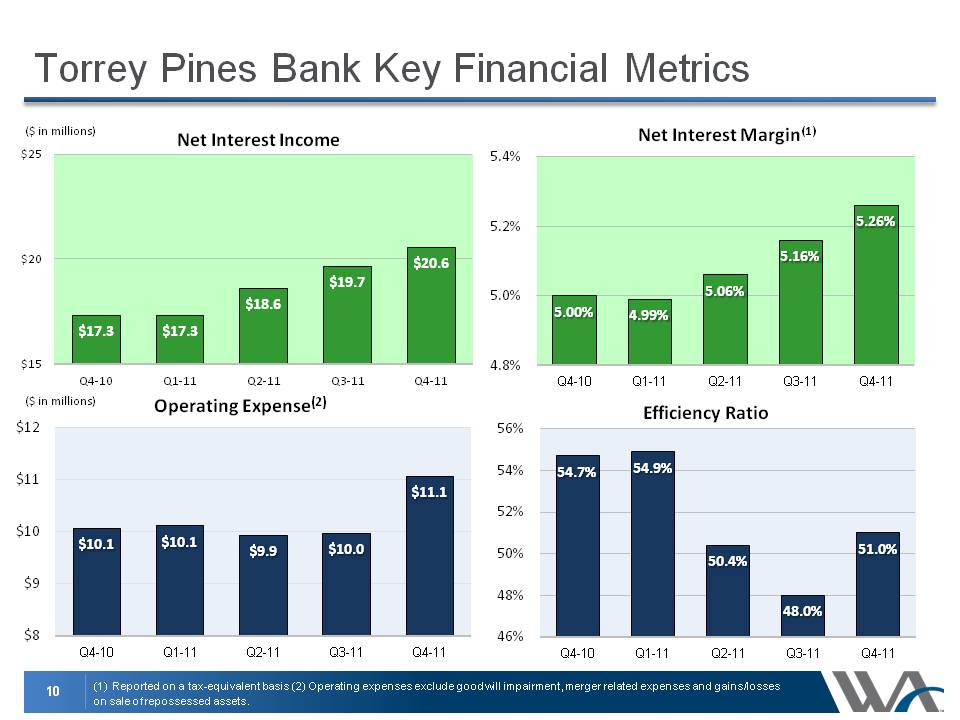
Torrey Pines Bank Key Financial Metrics ($ in millions) (1) Reported on a tax-equivalent basis (2) Operating expenses exclude goodwill impairment, merger related expenses and gains/losses on sale of repossessed assets. ($ in millions) Operating Expense(2)
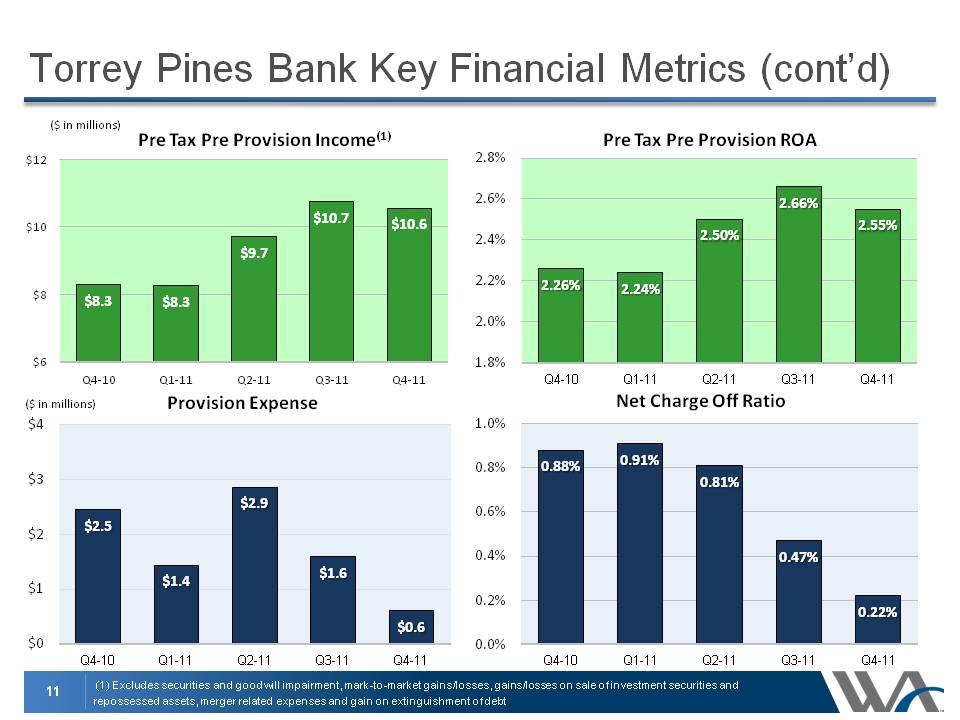
Torrey Pines Bank Key Financial Metrics (cont’d) ($ in millions) Provision Expense (1) Excludes securities and goodwill impairment, mark-to-market gains/losses, gains/losses on sale of investment securities and repossessed assets, merger related expenses and gain on extinguishment of debt
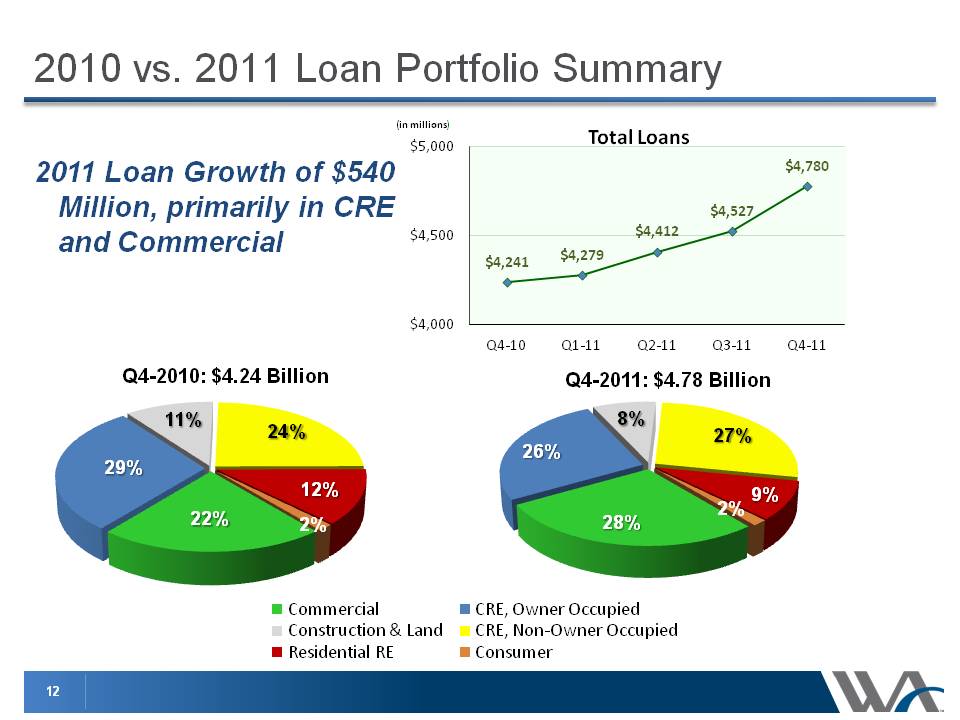
2010 vs. 2011 Loan Portfolio Summary (in millions) 2011 Loan Growth of $540 Million, primarily in CRE and Commercial
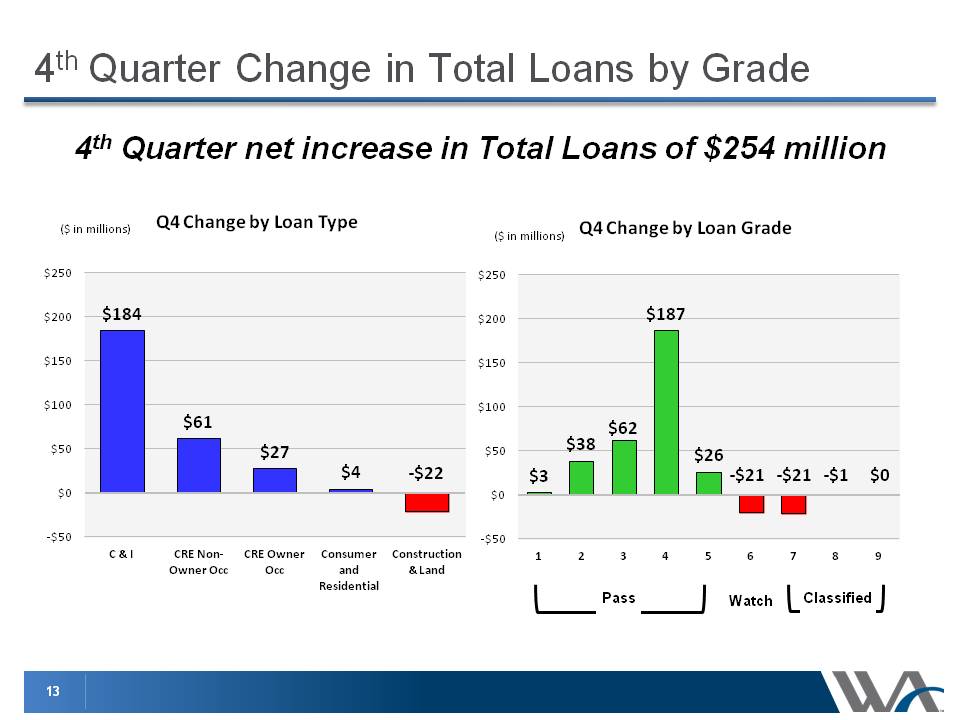
4th Quarter Change in Total Loans by Grade 4th Quarter net increase in Total Loans of $254 million (Gp:) Pass Watch (Gp:) Classified
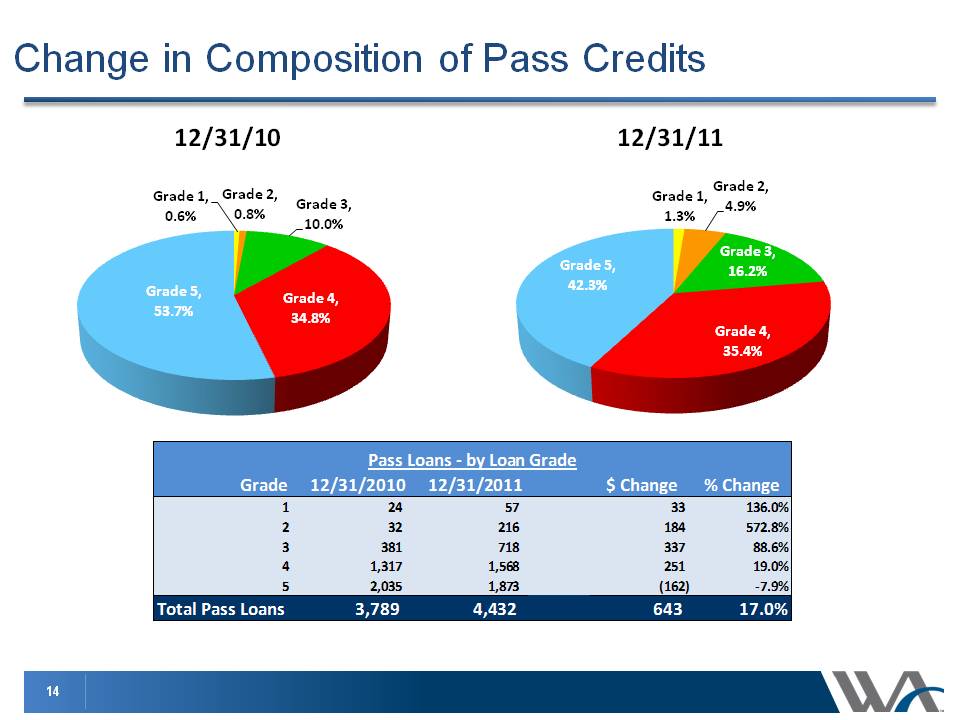
Change in Composition of Pass Credits 12/31/10 12/31/11
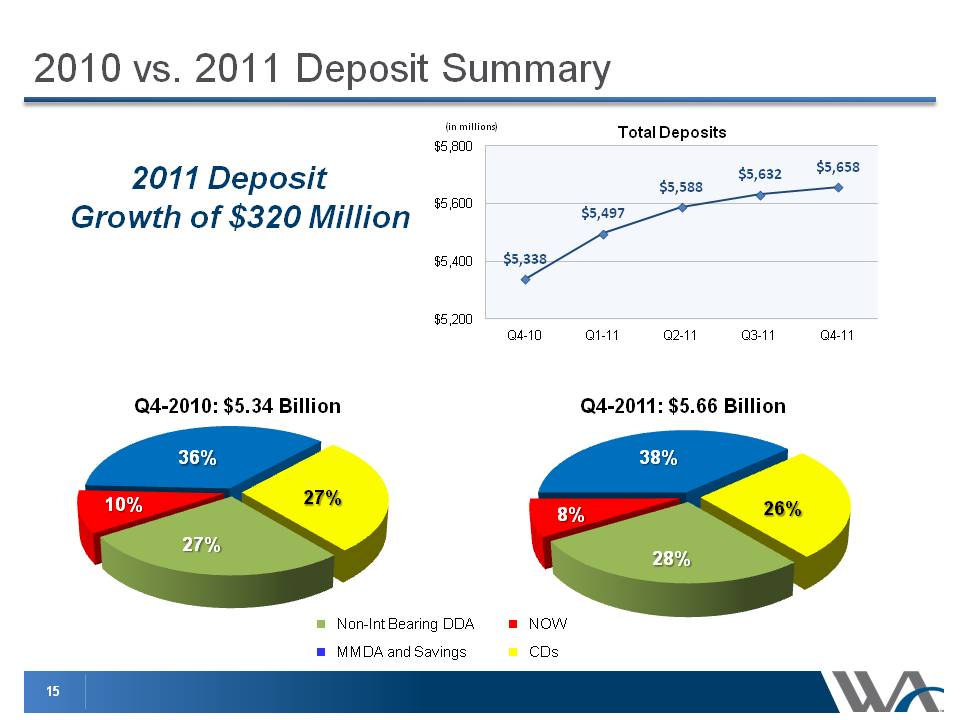
2010 vs. 2011 Deposit Summary 2011 Deposit Growth of $320 Million (in millions)
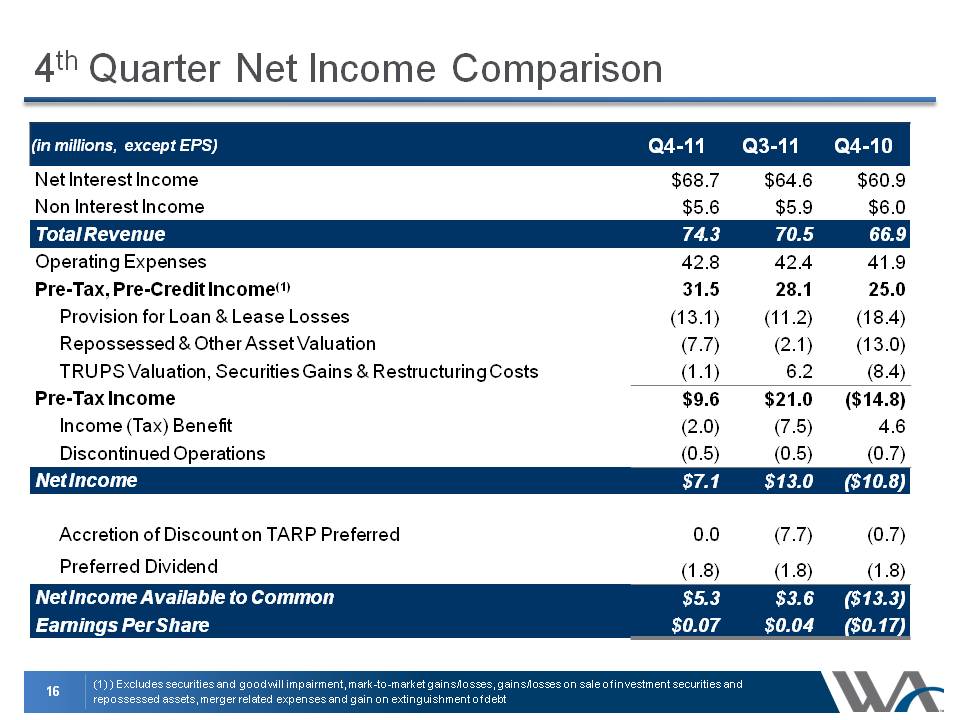
4th Quarter Net Income Comparison Body: (1) ) Excludes securities and goodwill impairment, mark-to-market gains/losses, gains/losses on sale of investment securities and repossessed assets, merger related expenses and gain on extinguishment of debt
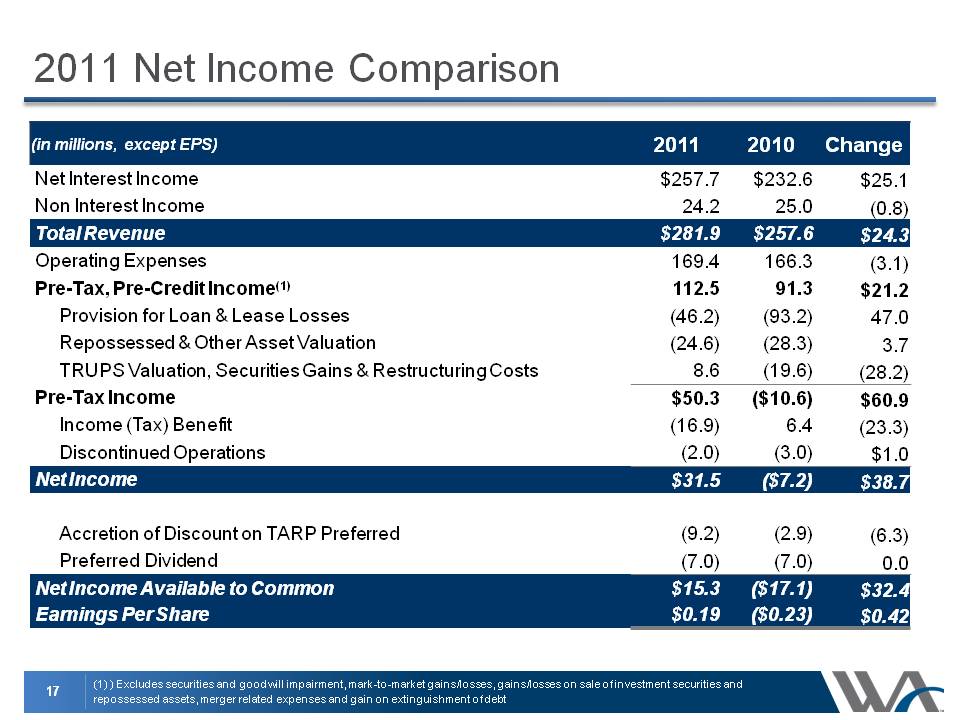
2011 Net Income Comparison Body: (1) ) Excludes securities and goodwill impairment, mark-to-market gains/losses, gains/losses on sale of investment securities and repossessed assets, merger related expenses and gain on extinguishment of debt
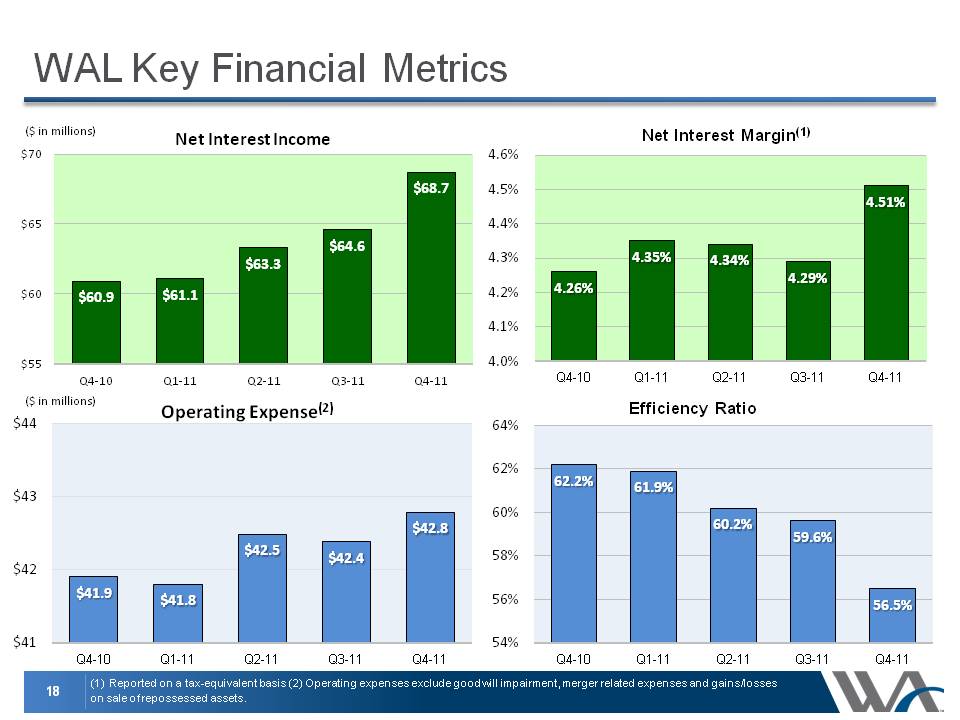
WAL Key Financial Metrics ($ in millions) (1) Reported on a tax-equivalent basis (2) Operating expenses exclude goodwill impairment, merger related expenses and gains/losses on sale of repossessed assets. ($ in millions) Operating Expense(2)
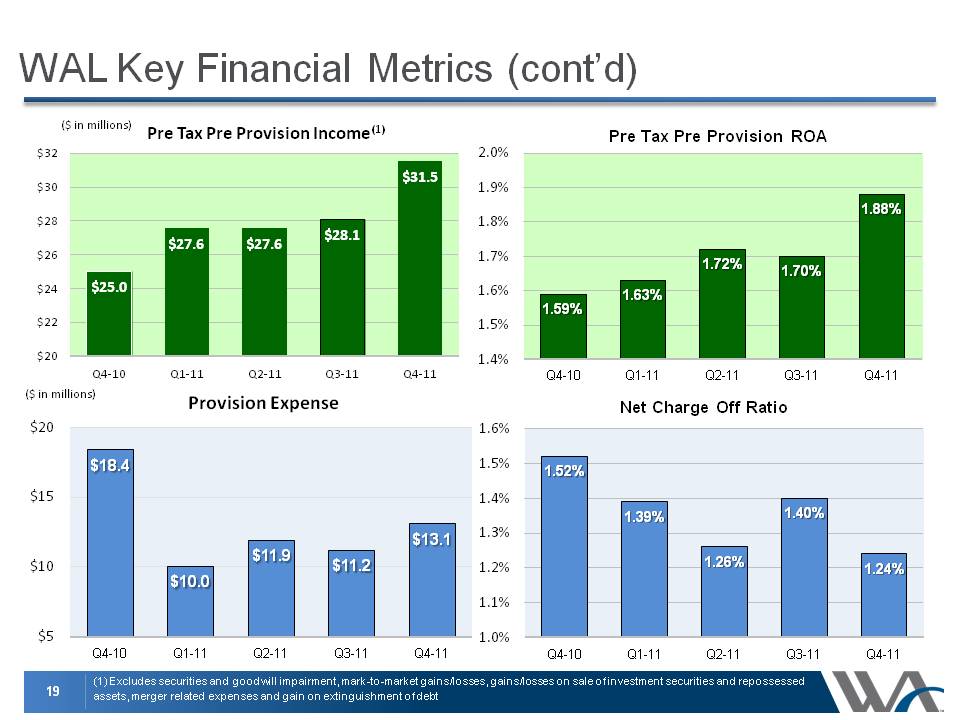
WAL Key Financial Metrics (cont’d) Body: (1) Excludes securities and goodwill impairment, mark-to-market gains/losses, gains/losses on sale of investment securities and repossessed assets, merger related expenses and gain on extinguishment of debt Provision Expense ($ in millions)
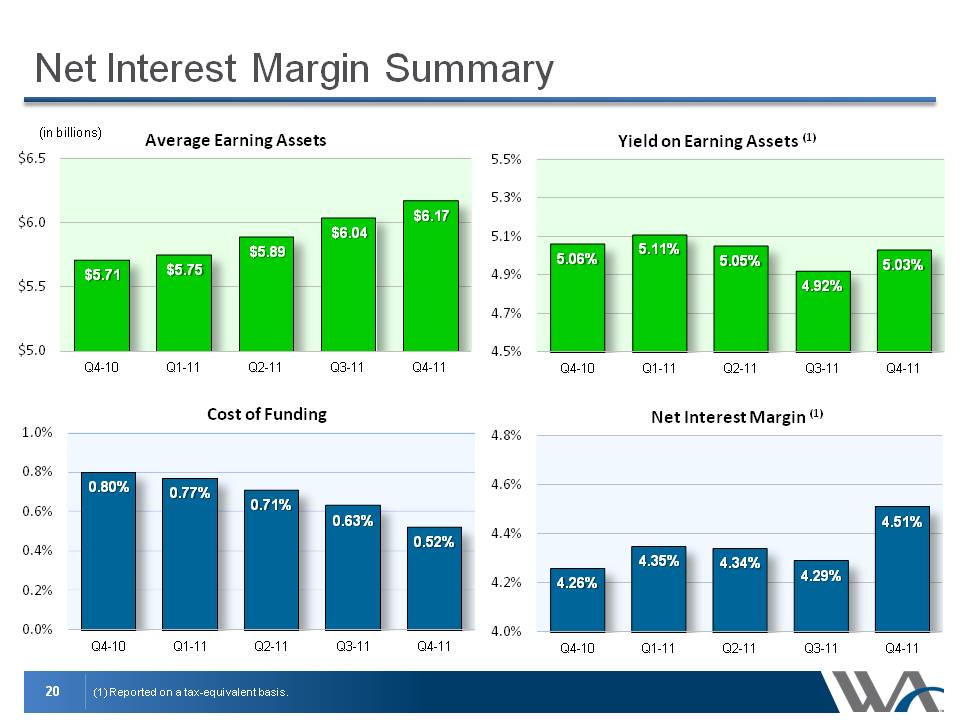
Net Interest Margin Summary (1) Reported on a tax-equivalent basis. (in billions)
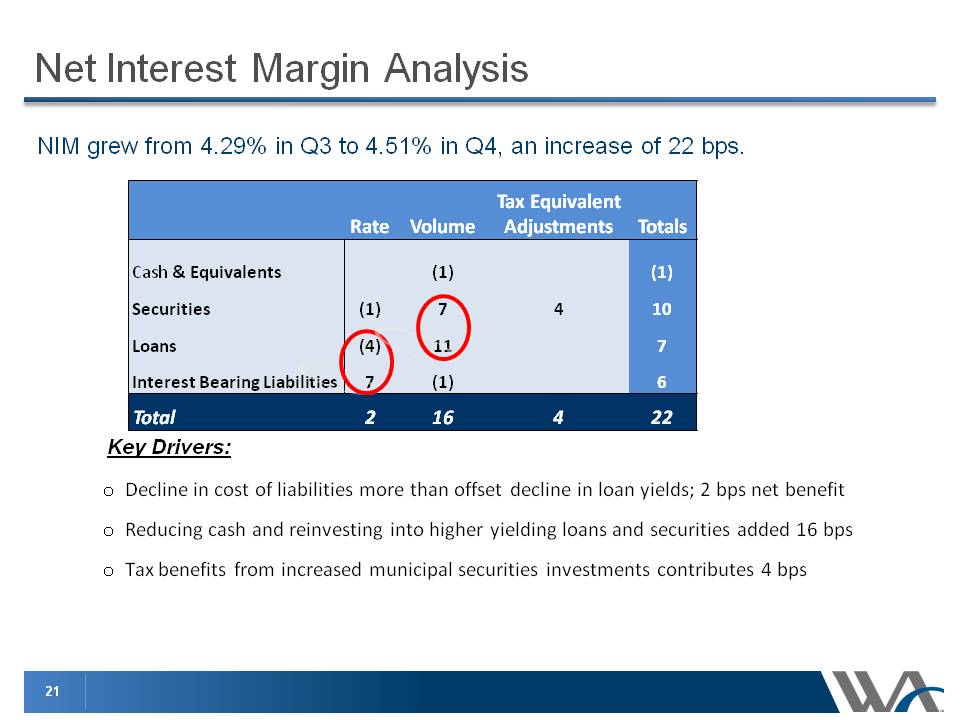
NIM grew from 4.29% in Q3 to 4.51% in Q4, an increase of 22 bps. Net Interest Margin Analysis Decline in cost of liabilities more than offset decline in loan yields; 2 bps net benefitReducing cash and reinvesting into higher yielding loans and securities added 16 bpsTax benefits from increased municipal securities investments contributes 4 bps Key Drivers:
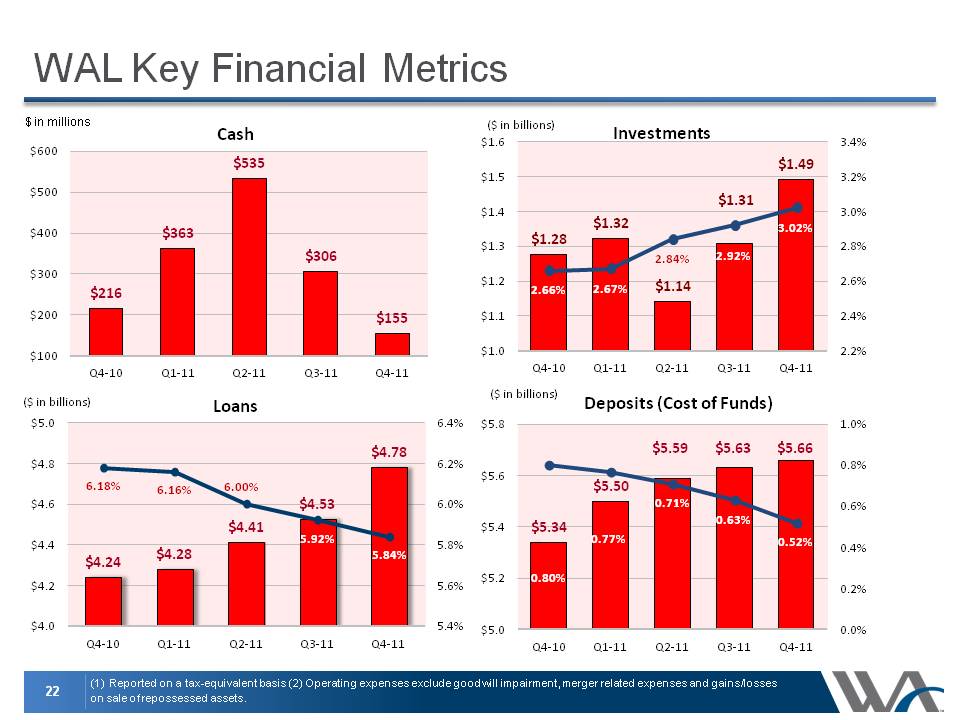
WAL Key Financial Metrics ($ in billions) (1) Reported on a tax-equivalent basis (2) Operating expenses exclude goodwill impairment, merger related expenses and gains/losses on sale of repossessed assets. ($ in billions) ($ in billions) $ in millions
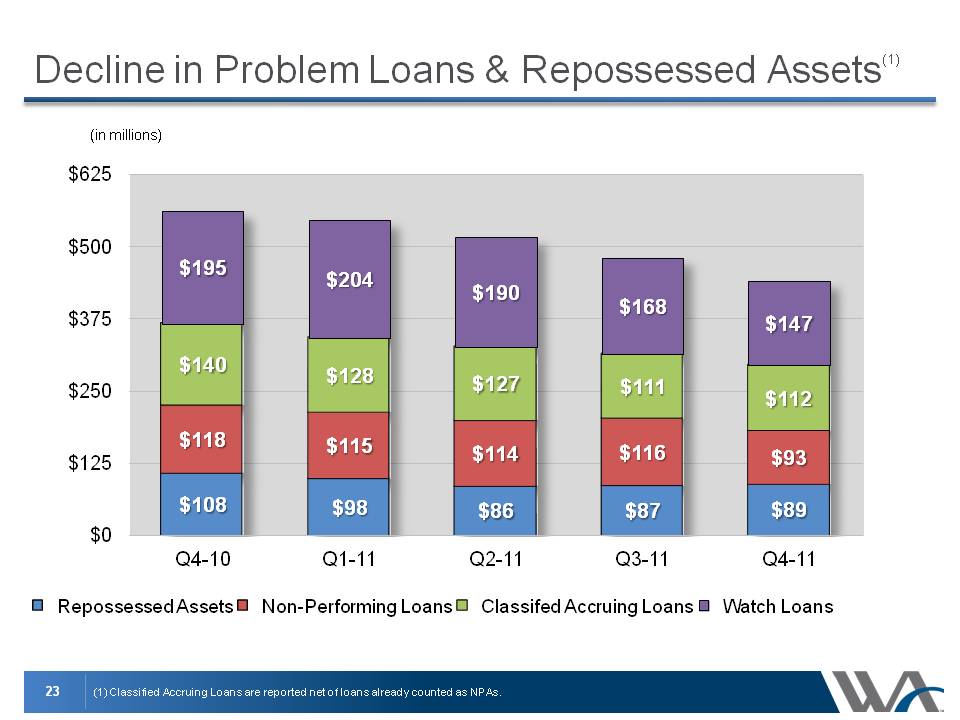
Decline in Problem Loans & Repossessed Assets(1) Body: (1) Classified Accruing Loans are reported net of loans already counted as NPAs. (in millions)
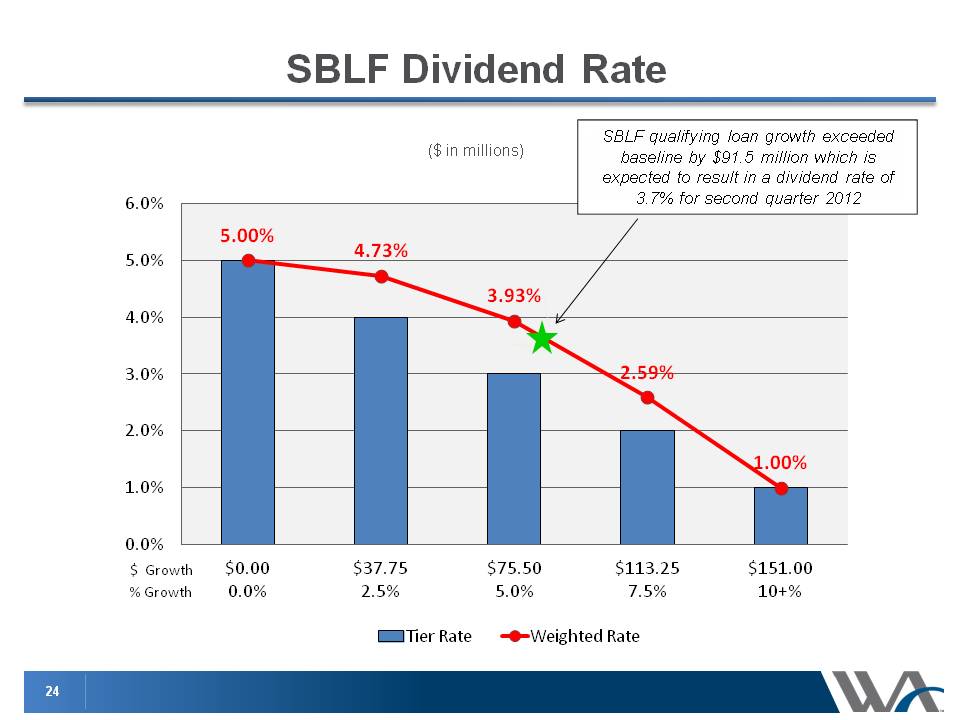
SBLF Dividend Rate ($ in millions) SBLF qualifying loan growth exceeded baseline by $91.5 million which is expected to result in a dividend rate of 3.7% for second quarter 2012
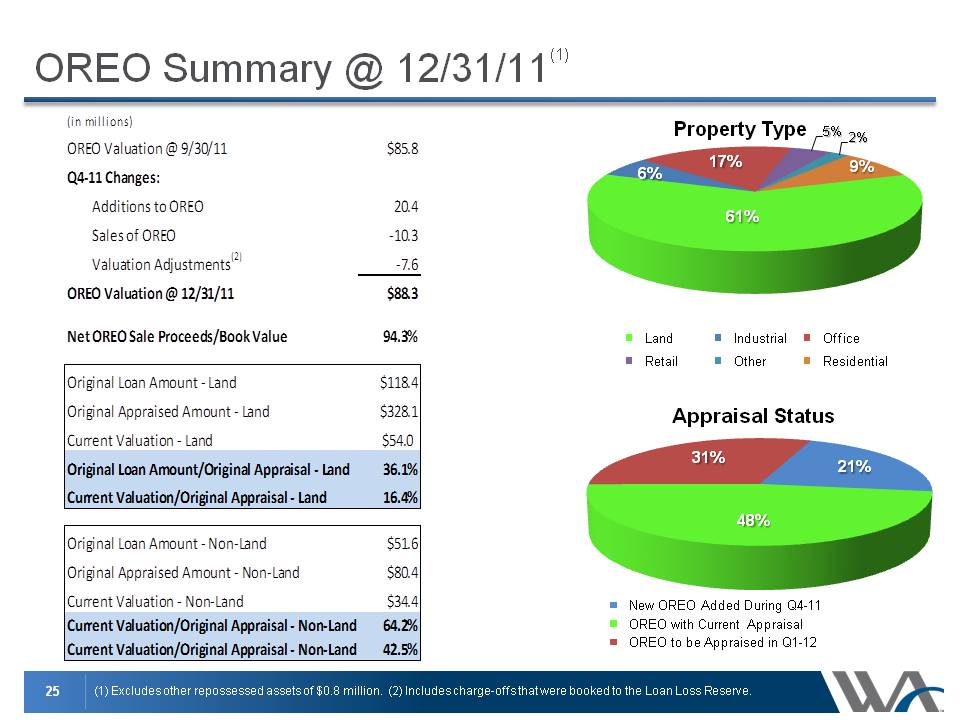
OREO Summary @ 12/31/11(1) Body: (1) Excludes other repossessed assets of $0.8 million. (2) Includes charge-offs that were booked to the Loan Loss Reserve.
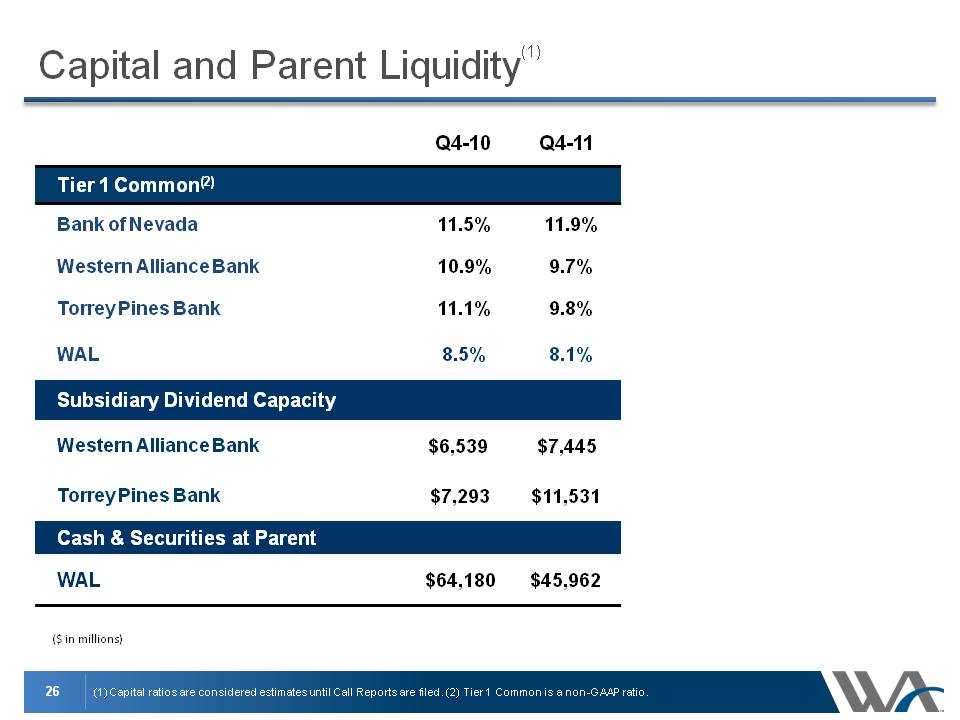
Capital and Parent Liquidity(1) Body: (1) Capital ratios are considered estimates until Call Reports are filed. (2) Tier 1 Common is a non-GAAP ratio. ($ in millions) Q4-10 Q4-11
Loan and deposit growthNet interest marginEfficiency ratioAsset QualityBranch Strategy Title: Outlook 2012

Question & Answer