Attached files
| file | filename |
|---|---|
| EX-23.1 - EXHIBIT 23.1 - Trellis Earth Products Inc | ex231.htm |
| EX-10.14 - EXHIBIT 10.14 - Trellis Earth Products Inc | ex1014.htm |
Registration No. 333- 176970
UNITED STATES
SECURITIES AND EXCHANGE COMMISSION
Washington, D.C. 20549
AMENDMENT NO. 2
TO
FORM S-1
Trellis Earth Products, Inc.
(Exact name of registrant as specified in its charter)
|
Nevada
|
2821
|
20-8066386
|
||
|
(State or jurisdiction of
|
(Primary Standard Industrial
|
(I.R.S. Employer
|
||
|
incorporation or organization)
|
Classification Code Number)
|
Identification No.)
|
9125 S.W. Ridder Road, Suite D
Wilsonville, OR 97070
(503) 582-1300
(Address and telephone number of principal executive offices)
William Collins
Chairman, President and Chief Executive Officer
Trellis Earth Products, Inc.
9125 S.W. Ridder Road, Suite D
Wilsonville, OR 97070
(503) 582-1300
(Name, address and telephone number of agent for service)
|
With copies to:
Gregory Sichenzia, Esq.
Marcelle Balcombe, Esq.
Sichenzia Ross Friedman Ference LLP
61 Broadway, 32 nd Floor
New York, NY 10006
(212) 930-9700
|
||
APPROXIMATE DATE OF PROPOSED SALE TO PUBLIC: As soon as practicable after the effective date of this registration statement.
If any securities being registered on this Form are to be offered on a delayed or continuous basis pursuant to Rule 415 under the Securities Act of 1933, other than securities offered only in connection with dividend or interest reinvestment plans, check the following box: x
If this Form is filed to register additional securities for an offering pursuant to Rule 462(b) under the Securities Act, please check the following box and list the Securities Act registration statement number of the earlier effective registration statement for the same offering.
If this Form is a post-effective amendment filed pursuant to Rule 462(c) under the Securities Act, check the following box and list the Securities Act registration statement number of the earlier effective registration statement for the same offering.
If this Form is a post-effective amendment filed pursuant to Rule 462(d) under the Securities Act, check the following box and list the Securities Act registration statement number of the earlier effective registration statement for the same offering.
Indicate by check mark whether the registrant is a large accelerated filed, an accelerated filer, a non-accelerated filed, or a smaller reporting company. See definitions of “large accelerated filer,” “accelerated filer,” and “smaller reporting company” in Rule 12b-2 of the Exchange Act.
|
Large accelerated filer o
|
Accelerated filer o
|
|
Non-accelerated filer o
|
Smaller reporting company x
|
|
(Do not check if a smaller reporting company)
|
CALCULATION OF REGISTRATION FEE
|
Title of Each Class
of Securities to be Registered
|
Proposed Maximum Aggregate
Offering Price (1)
|
Amount of
Registration Fee (2)
|
||||||
|
Common Stock, $0.0001 par value per share (2)
|
$ | $ | ||||||
|
Common Stock Purchase Warrant
|
___
|
(3 | ) | |||||
|
Shares of Common Stock underlying Common Stock Purchase Warrant (2)
|
$ | $ | ||||||
|
Placement Agent’s Common Stock Purchase Warrant
|
___
|
(3 | ) | |||||
|
Shares of Common Stock underlying Placement Agent’s Common Stock Purchase Warrant (2)
|
$ | $ | ||||||
|
Total Registration Fee
|
$ | 8,000,000 | $ | 916.80 | (4) | |||
|
(1)
|
Estimated solely for the purpose of calculating the amount of registration fee pursuant to Rule 457(o) under the Securities Act.
|
|
(2)
|
Pursuant to Rule 416, the securities being registered hereunder include such indeterminate number of additional shares of common stock as may be issued after the date hereof as a result of stock splits, stock dividends or similar transactions
|
|
(3)
|
No registration fee required pursuant to Rule 457(g) under the Securities Act.
|
|
(4)
|
$3,378.51 was previously paid.
|
_________________
The registrant hereby amends this Registration Statement on such date or dates as may be necessary to delay its effective date until the registrant shall file a further amendment which specifically states that this Registration Statement shall thereafter become effective in accordance with Section 8(a) of the Securities Act of 1933 or until this Registration Statement shall become effective on such date as the Commission, acting pursuant to said Section 8(a), may determine.
The information in this preliminary prospectus is not complete and may be changed. We may not sell these securities until the registration statement filed with Securities and Exchange Commission is effective. This preliminary prospectus is not an offer to sell these securities and is not soliciting an offer to buy these securities in any state where the offer or sale is not permitted.
|
PRELIMINARY PROSPECTUS
|
SUBJECT TO COMPLETION
|
JANUARY 18, 2012
|
|
Up to $8,000,000 of Common Stock and
Warrants to purchase up to _____ shares of Common Stock
|
We are offering up to __ shares of our common stock and warrants to purchase up to ______ shares of common stock at an exercise price of $____ per share. Each purchaser will receive a warrant to purchase one share of common stock for each share of common stock purchased in this offering. We are not required to sell any specific number or dollar amount of shares of common stock or warrants, but will use our best efforts to sell all of the shares of common stock and warrants being offered. This offering expires on the earlier of (i) the date upon which all of the shares of common stock and warrants being offered have been sold, or (ii) _________.
As of the date of this prospectus, there is no trading market in our common stock or warrants, and there is no assurance that a trading market will develop. A market maker has submitted an application for our common stock to be approved for quotation on the Over-The-Counter Bulletin Board upon the effectiveness of this prospectus. There is no assurance the application will be approved.
Investing in our securities involves a high degree of risk. See “Risk Factors” beginning on page 5 of this prospectus for a discussion of information that should be considered in connection with an investment in our securities .
Neither the Securities and Exchange Commission nor any state securities commission has approved or disapproved of these securities or determined if this prospectus is truthful or complete. Any representation to the contrary is a criminal offense.
|
|
Per share
|
Total
|
||||||
|
Public offering price
|
$
|
$
|
||||||
|
Placement Agent’s fees (1)
|
$
|
$
|
||||||
|
Proceeds, before expenses, to us
|
$
|
$
|
||||||
|
(1)
|
Tripoint Global Equities, LLC has agreed to act as our placement agent in connection with this offering. In addition, we may engage one or more sub placement agents or selected dealers. The placement agent is not purchasing the securities offered by us, and is not required to sell any specific number or dollar amount of securities offered by us, but will assist us in this offering on a reasonable “best efforts” basis. See “Plan of Distribution” for a description of compensation payable to the placement agent.
|
This offering will terminate on __________, unless the offering is fully subscribed before that date or we decide to terminate the offering prior to that date. In either event, the offering may be closed without further notice to you. All costs associated with the registration will be borne by us.
Brokers or dealers effecting transactions in these securities should confirm that the securities are registered under the applicable state law or that an exemption from registration is available.
The date of this prospectus is ___, 2012.
iv
Table of Contents
|
Page
|
|
|
Prospectus Summary
|
1
|
|
Risk Factors
|
5
|
|
Special Note Regarding Forward-Looking Statements
|
12
|
|
Use of Proceeds
|
13
|
|
Dividend Policy
|
14
|
|
Capitalization
|
14
|
|
Dilution
|
15
|
|
Management’s Discussion and Analysis Of Financial Condition and Results of Operations
|
16
|
|
Business
|
23
|
|
Management
|
34
|
|
Executive Compensation
|
37
|
|
Certain Relationships and Related Transactions
|
39
|
|
Principal Stockholders
|
40
|
|
Description of Capital Stock
|
41
|
|
Shares Eligible for Future Sale
|
43
|
|
Plan of Distribution
|
44
|
|
Experts
|
45
|
|
Legal Matters
|
45
|
|
Commission Position on Indemnification for Securities Act Liabilities
|
45
|
|
Where You Can Find More Information
|
45
|
|
Index to Financial Statements
|
F-1
|
You may only rely on the information contained in this prospectus or that we have referred you to. We have not authorized anyone to provide you with different information. This prospectus does not constitute an offer to sell or a solicitation of an offer to buy any securities other than the common stock offered by this prospectus. This prospectus does not constitute an offer to sell or a solicitation of an offer to buy any common stock in any circumstances in which such offer or solicitation is unlawful. Neither the delivery of this prospectus nor any sale made in connection with this prospectus shall, under any circumstances, create any implication that there has been no change in our affairs since the date of this prospectus or that the information contained by reference to this prospectus is correct as of any time after its date.
Notice to California investors: Each purchaser of our shares and common stock hereunder in California must meet one of the following suitability standards:
|
·
|
any bank as defined in section 3(a)(2) of the Securities Act, or any savings and loan association or other institution as defined in section 3(a)(5)(A) of the Securities Act whether acting in its individual or fiduciary capacity; any broker or dealer registered pursuant to section 15 of the Securities Exchange Act of 1934; any insurance company as defined in section 2(a)(13) of the Securities Act; any investment company registered under the Investment Company Act of 1940 or a business development company as defined in section 2(a)(48) of that Act; any Small Business Investment Company licensed by the U.S. Small Business Administration under section 301(c) or (d) of the Small Business Investment Act of 1958; any plan established and maintained by a state, its political subdivisions, or any agency or instrumentality of a state or its political subdivisions, for the benefit of its employees, if such plan has total assets in excess of $5,000,000; any employee benefit plan within the meaning of the Employee Retirement Income Security Act of 1974 if the investment decision is made by a plan fiduciary, as defined in section 3(21) of such act, which is either a bank, savings and loan association, insurance company, or registered investment adviser, or if the employee benefit plan has total assets in excess of $5,000,000 or, if a self-directed plan, with investment decisions made solely by persons that are accredited investors;
|
|
·
|
any private business development company as defined in section 202(a)(22) of the Investment Advisers Act of 1940;
|
|
·
|
any organization described in section 501(c)(3) of the Internal Revenue Code, corporation, Massachusetts or similar business trust, or partnership, not formed for the specific purpose of acquiring the securities offered, with total assets in excess of $5,000,000;
|
|
·
|
any director, executive officer, or general partner of the issuer of the securities being offered or sold, or any director, executive officer, or general partner of a general partner of that issuer
|
|
·
|
any natural person whose individual net worth, or joint net worth with that person's spouse, at the time of his purchase exceeds $225,000 (exclusive of home, home furnishings and automobile);
|
|
·
|
any natural person who had an individual income in excess of $200,000 in each of the two most recent years or joint income with that person's spouse in excess of $300,000 in each of those years and has a reasonable expectation of reaching the same income level in the current year;
|
|
·
|
any trust, with total assets in excess of $5,000,000, not formed for the specific purpose of acquiring the securities offered, whose purchase is directed by a sophisticated person as described in Rule 506(b)(2)(ii) and
|
|
·
|
any entity in which all of the equity owners are accredited investors.
|
vi
|
PROSPECTUS SUMMARY
The following summary highlights selected information contained in this prospectus. This summary does not contain all the information you should consider before investing in our common stock. Before making an investment decision, you should read this entire prospectus carefully, including the “Risk Factors” section.
About Us
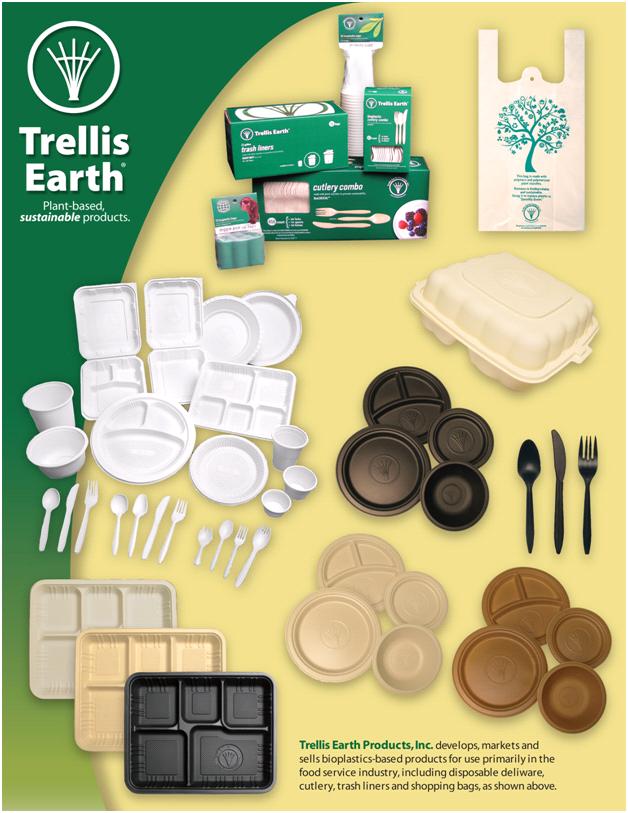
Trellis Earth Products, Inc. develops, markets and sells bioplastics-based products for use primarily in the food service industry, including disposable deliware, cutlery, trash liners and shopping bags. Bioplastics are compounds or blends of materials that incorporate or are derived from renewable biomass sources (such as corn starch, soybeans , wheat chaff, rice hulls and sugar cane) as a substitute for conventional plastics which are commonly comprised entirely of petroleum derivatives. Using advanced technology that we have developed, we believe our bioplastics-based products can be sold on a cost neutral basis with similar conventional plastic products. Annual global bioplastics production in 2010, according to the University of Applied Sciences and Arts in Hanover, Germany, as quoted on the European Bioplastics website, was 1.6 billion pounds, with a market value of $2.7 billion, as reported by Environmental and Energy Management News, an independent organization.
Our bioplastics-based products are presently manufactured to our specifications by a factory in China. Since January 2010, this factory has produced for us at least 200,000 pounds of bioplastics-based products per month. In the first quarter of 2011, we began transitioning manufacturing operations to our current headquarters in Wilsonville, Oregon (about 15 miles south of Portland) and expect to commence production there in mid- 2012. In 2013, subject to obtaining additional funding of approximately $8,000,000, we plan to equip a second plant in Illinois. Together, these facilities are expected to have an estimated annual production capacity of 40 million pounds of bioplastics-based products.
Many well-established trends favor bioplastics production in the United States. Global demand for petroleum products remains strong as emerging economies, such as China, grow and compete with the United States for finite supplies. At the same time, traditional plastic bags, food containers and food contact service items require significant amounts of energy and raw materials to produce, such as natural gas and crude oil in the form of various plastic feedstocks, with their recent prices reaching record high levels. Meanwhile, renewable biomass in forms such as starch -- the primary raw material component of many bioplastics -- has remained comparatively less expensive and in abundant supply. As a result, bioplastics producers, with highly automated facilities, can experience high operating margins if they can leverage these materials’ cost advantages in the manufacture of finished goods that compete directly with pure petroleum-based plastics.
In addition to consumer preference for "green" products like bioplastics, state and city government policies are increasingly supportive of bioplastic alternatives to reduce the volume of waste in landfills, and accomplish other ecological objectives, by requiring that some food contact service items be certified as compostable, which almost always excludes pure petroleum-based plastics. Bioplastics address the economic, social and environmental issues associated with the prolonged and broad use of disposable petroleum-based plastic products.
Our growth strategy is to capitalize on these favorable trends by:
· expanding our manufacturing capacity by equipping and facilitizing a highly automated Oregon-based manufacturingfacility in 2012;
· increasing the number of products we sell through our distribution channel partners across North America;
· growing our customer base and recurring business with major national brands;
· developing new wholesale product lines for core food service clients;
· expanding into conventional non-food product packaging; and
· making opportunistic acquisitions that serve our vertical markets within the bioplastics industry.
|
1
|
Our objective is to become one of the largest U.S. suppliers of bioplastics-based products by leveraging our domestic manufacturing capacity, distribution reach and proprietary process technologies. Because there is a significant gap between prospective demand and potential supply, we believe that United States and global markets can absorb all of our production, and that of our competitors, for the foreseeable future.
We are currently marketing and distributing our bioplastics products through a combination of distribution arrangements, select resellers, brokers, agents, direct sales and vertical market suppliers. As of January 17, 2012, more than 500 customers are using our bioplastics-based products. We sell through distributors, such as Bunzl Distribution USA, Inc., which in turn sell directly to their customers and to other distributors such as Sysco Corporation, which has authorized our products for national distribution.
Additional distributors carrying our products include Food Services of America (FSA), West Coast Paper Company and Walter E. Nelson Co. Grocery stores and resellers that purchase our products include Costco Wholesale Corporation, Smart & Final Inc., The Kroger Co., The Trader Joe’s Company, Wegmans Food Markets, Inc., Smart Foodservice, Cash & Carry and Restaurant Depot LLC. Hospitality companies that use our products include Marriott International Inc., Canyon Ranch, Shilo Inns and more recently Westin Hotels. Additionally, health food stores, farm stores, food co-ops, farmer’s markets and Internet-based resellers purchase our products online. To date, we have primarily sold our products on the West Coast. In 2011, we have expanded our sales reach to the Midwest and to the East Coast.
We are also exploring new vertical market sales opportunities in customized biodegradable product packaging for certain current and potential new customers that have indicated their willingness to incorporate our bioplastic packaging into their consumer goods products. We successfully developed a test package for one maker of nationally-branded merchandise, and have had ongoing discussions with other potential customers about having us produce their product packaging. In addition, we have created sample test food containers for use by a national quick-service restaurant chain. Once our U.S. manufacturing platform is fully operational. we believe that we can compete in this market on the basis of price, while maintaining strong operating margins,
Our current bioplastics product line consists of:
|
|
|
·
|
Deliware - We design and sell plates, clamshells, cups, trays and other similar types of food containers. The deliware items typically comprise a bioplastics blend made of approximately 70% plasticized corn starch compounded with various base polymers and ingredients that make our food containers resistant to heat and water, sanitary, capable of a long shelf life and partially biodegradable. The bioplastic used to create these products can be processed by modern, automated-forming equipment, which is integral to the low cost characteristics of the products.
|
|
We have invented a new blend of bioresin that combines the best features of our starch-based, pure biomass and fiber-based products into a new type of bioplastic resin. This innovative blend creates a new type of deliware that performs like plastic (is waterproof and food-contact safe, for instance ) and has the manufacturing economies of scale of plastic, yet is entirely petroleum-free and compostable. It can also be significantly lower priced than petroleum-based plastics. We believe this material will make possible our consumer-value proposition captured by the slogan “Go Green for Free.” Sm
|
|
|
·
|
Cutlery - Our cutlery is made with the same blends as our deliware, but is injection molded instead of thermoformed. The cutlery bioplastic blends range from 55% biomass to 99+% biomass, depending on specific characteristics sought by customers. For example, 99% biomass cutlery is compostable using commercial composting processes available in various locations (such as in Seattle and San Francisco). Cutlery that is 55% biomass is more heat resistant and partially biodegradable, yet is lower priced than fully compostable cutlery. We sell more than 30 part numbers (SKUs) of cutlery covering a range of premium, lightweight, bagged, colored and specialty cutlery items.
|
|
·
|
Film Products - We sell a wide range of shopping bags, produce bags, trash liners and similar bioplastic “film” items, all of which are made with a blend that is part plant starch, part polymer and part bonding compounds needed to incorporate biomass into their matrix.
|
|
We believe that recent market conditions make bioplastics increasingly commercially competitive with entrenched petroleum-based plastic products. We have recently developed two new methods for production of formulations featuring our proprietary bioplastics resin technology, focusing on what customer features are most desirable, the chemistry to construct those features in new materials and our ability to design manufacturing equipment and processes that are highly automated and cost-efficient throughout the production cycle.
Although bioplastics are commonly a hybrid blend of conventional polymers and biomass, along with the agents necessary to cross link them and give them various qualities, our newest material removes all petrochemicals from the blending and composition of the bioplastics resin. We have submitted a provisional patent application in the United States for this improved method of bioplastics production. We believe that by introducing proprietary process technologies and formulations, we can increase operating margins and potential profitability.
We were incorporated in December 2006 as an Oregon corporation and reincorporated in August 2011 as a Nevada corporation. Our principal executive offices are located at 9125 S.W. Ridder Road, Suite D, Wilsonville, Oregon 97070, and our telephone number is (503) 582-1300. Our website address is www.trellisearth.com. Our website and the information contained on our website are not incorporated into this prospectus.
|
|
2
|
The Offering
|
||
|
Securities offered by us
|
Up to [●] shares of common stock and warrants to purchase up to [●] shares of common stock. The warrants will be exercisable at a price of $___ per share and have a ___ year term.
|
|
|
Offering price
|
$___ per share and warrant.
|
|
|
Common Stock to be outstanding after this offering assuming the sale of all shares covered by this prospectus and assuming no exercise of the warrants for the shares covered by this prospectus
|
[●] shares.
|
|
|
Common Stock to be outstanding after this offering assuming the sale of all shares covered by this prospectus and assuming the exercise of all warrants for the shares covered by this prospectus
|
[●] shares.
|
|
|
Use of proceeds
|
We plan to use the net proceeds of this offering to finance capital expenditures for our planned Oregon manufacturing facility, purchase raw materials, repay outstanding indebtedness, expand marketing and brand development and for other general corporate purposes. For a more complete description of our intended use of the net proceeds from this offering, see “Use of Proceeds.”
|
|
|
Risk factors
|
The securities offered by this prospectus are speculative and involve a high degree of risk and investors purchasing our securities should not purchase the securities unless they can afford the loss of their entire investment. See “Risk Factors” beginning on page 5 of this prospectus.
|
|
|
General Information About this Prospectus
Unless otherwise noted, throughout this prospectus the number of shares of common stock to be outstanding after this offering is based on 5,543,870 shares of common stock outstanding as of January 17, 2012 , and excludes 1,005,000 shares of common stock issuable upon exercise of outstanding stock options with an exercise price of $2.00 per share as of January 17, 2012 .
Unless otherwise indicated, all information in this prospectus gives effect to the 1-for-2 reverse stock split of our outstanding shares of common stock, which became effective on September 16, 2011.
|
||
3
|
Summary Financial Data
The following tables set forth summary financial data. The financial data as of and for the nine months ended September 30, 2011 and 2010 have been derived from our unaudited financial statements, included in this prospectus. The statements of operations data for the years ended December 31, 2010 and December 31, 2009 have been derived from our audited financial statements included in this prospectus. The unaudited financial statements include all adjustments, consisting of normal recurring accruals, which we consider necessary for a fair presentation of the financial position and the results of operations for these periods. You should read this summary financial data in conjunction with the section “Management’s Discussion and Analysis of Financial Condition and Results of Operations” and our financial statements and related notes, included in this prospectus. Our historical results are not necessarily indicative of the results to be expected for any future period.
|
|||||||||||||
| Nine Months ended September 30, |
Years ended December 31,
|
||||||||||||
|
2011
|
2010
|
2010
|
2009
|
||||||||||
|
Statement of Operations Data:
|
|||||||||||||
|
Revenues
|
$
|
2,151,837
|
$
|
1,987,085
|
$
|
2,686,255
|
$
|
2,178,534
|
|||||
|
Cost of Revenues
|
1,517,792
|
1,345,832
|
1,946,782
|
1,569,600
|
|||||||||
|
Gross Profit
|
634,045
|
641,253
|
739,473
|
608,934
|
|||||||||
|
Operating Expenses:
|
|||||||||||||
|
Selling, general and administrative expenses
|
1,753,310
|
623,572
|
879,676
|
889,895
|
|||||||||
|
Research and development expenses
|
45,600
|
31,000
|
42,300
|
38,500
|
|||||||||
|
Employee severance expense
|
-
|
-
|
160,000
|
-
|
|||||||||
|
Depreciation expense
|
9,422
|
6,528
|
10,899
|
8,126
|
|||||||||
|
Loss from Operations
|
(1,174,287
|
)
|
(72,454
|
) |
(353,402
|
)
|
(327,587
|
)
|
|||||
|
Other Income (Expense):
|
|||||||||||||
|
Loss on disposition of fixed assets
|
-
|
-
|
(1,583)
|
-
|
|||||||||
|
Interest expense
|
(77,314)
|
(52,607
|
) |
(104,487)
|
(116,494)
|
||||||||
|
Net Loss
|
$
|
(1,251,601)
|
$
|
(72,454
|
) | $ |
(459,472)
|
$ |
(444,081
|
)
|
|||
|
Net loss per share – basic and diluted
|
$ |
(0.30)
|
$ |
(0.02
|
) | $ |
(0.12)
|
$ |
(0.12
|
)
|
|||
|
Weighted average common shares outstanding- basic and diluted
|
4,227,783
|
4,773,812
|
3,782,213,
|
3,656,056
|
|||||||||
|
September 30, 2011
|
|||||||||||||
|
Balance Sheet Data:
|
|
||||||||||||
|
Cash and cash equivalents
|
$
|
88,825
|
|||||||||||
|
Total assets
|
$ |
858,308
|
|||||||||||
|
Total current liabilities
|
$ |
1,189,754
|
|||||||||||
|
Long-term notes payable
|
100,000
|
||||||||||||
|
Total liabilities
|
$ |
1,289,754
|
|||||||||||
|
Total stockholders’ (deficit)
|
$ |
(329,542
|
) | ||||||||||
4
RISK FACTORS
You should carefully consider the risks described below as well as other information provided to you in this document, including information in the section “Special Note Regarding Forward-Looking Statements.” If any of the following risks actually occur, our business, financial condition or results of operations could be materially and adversely affected, the value of our common stock could decline and you may lose all or part of your investment.
Risks Related to Our Company and Business
We have a limited operating history upon which an evaluation of our prospects can be made, and we received a going concern qualification in our 2010 audit; there can be no assurance we will succeed.
We have been in the bioplastics business since December 2006. We have had limited operations to date upon which to evaluate our business prospects. As a result, an investor does not have access to the same type of information in assessing his or her proposed investment as would be available to purchasers in a company with a longer history of prior operations. We face all the risks inherent in a new business, including the expenses, difficulties, complications and delays frequently encountered in connection with conducting operations, including capital requirements and management’s potential underestimate of initial and ongoing costs (including with respect to our new planned facilities in Oregon and Illinois). We also face the risk that we may not be able to effectively implement our business plan. If we are not effective in addressing these risks, we may not operate profitably and we may not have adequate working capital to meet our obligations as they become due. The report of our independent registered public accounting firm with respect to our audited financial statements in this prospectus includes a “going concern” paragraph indicating that our accumulated deficit as of December 31, 2010, limited liquidity and failure to complete our efforts to establish a recurring source of revenues sufficient to cover operating costs for the next 12-month period, raises substantial doubt about our ability to continue as a going concern.
We have a history of net losses and we may not be able to achieve profitability in the future, which may have a detrimental effect on the long-term capital appreciation of our common stock.
We recorded revenues of $2,686,255 and $2,178,534 for the years ended December 31, 2010 and 2009, respectively, and a net loss of $459,472 and $444,081 for the years ended December 31, 2010 and 2009, respectively. We recorded revenues of $2,151,837 and $1,987,085 for the nine months ended September 30, 2011 and 2010, respectively, and a net loss of $1,251,601 and $72,454 for the nine months ended September 30, 2011 and 2010, respectively. From our date of inception (December 5, 2006) through September 30, 2011, we have an accumulated deficit of $3,375,605. Our losses to date have been due to expenses related to start-up costs incurred as we grew our business, and the costs of developing our sales and marketing organization. A component of the losses can be attributed to stock compensation charges and one-time expenses relating to legal settlement of employee severance pay 2011. There can be no assurance that we will generate significant revenues or be profitable in the future. If we are not profitable and cannot obtain sufficient capital, we may have to curtail or even cease our operations.
There can be no assurance that bioplastics will achieve market acceptance and grow; thus, the future of our business and the bioplastics industry is uncertain.
The market for biodegradable and sustainable materials may be disrupted by the introduction of new products and services, and is subject to changing consumer preferences and industry trends, which may adversely affect our ability to plan for the future development and marketing of our products. Though rising and volatile oil prices, environmental concerns, regulatory initiatives, and increasing consumer demand for products that have a smaller ecological impact are long ‐ term drivers for the adoption of bioplastics, and are creating consumer demand for the types of products we sell, there is no assurance such trends will continue or, even if they do, that general market acceptance for bioplastics will continue to grow.
We rely on a single distributor for a majority of our revenues, and if we lose this distributor for any reason, we would lose a significant amount of our revenue and need to divert our efforts and resources to this area.
Since mid-2007, we have been highly dependent on sales of our bioplastics products through Bunzl to its customers and other distributors. We sell products to Bunzl pursuant to purchase orders; we do not have a long-term written contract or any oral contract with Bunzl. Approximately 59%, 64% and 71% of our revenues for the nine months ended September 30, 2011 and the years ended December 31, 2010 and 2009, respectively, resulted from sales through Bunzl and its affiliates. Therefore, at present, a significant portion of our business depends largely on the success of Bunzl in the disposable plastic food service items market. Our business could be adversely affected if Bunzl’s share of this market declined or if its customer base in that market eroded. A decision by Bunzl to discontinue ordering products from us could have a material and adverse impact on our business, and result in a significant loss of revenue to us.
5
We have been historically dependent upon a single manufacturer for substantially all of the products we sell, and could be adversely impacted through the loss of customers if this relationship were to end without reasonable notice.
We are currently dependent upon a single manufacturer for substantially all of the products we sell. This manufacturer, Zhejiang Wafa Ecosystem Science & Technology Co. Ltd., is located in the People’s Republic of China. Each shipment of the products to us could be delayed, waylaid, rerouted, stolen, lost or damaged, the occurrence of each of which could adversely affect our performance and profitability. We may also face increased pressure for the supply of finished products that are produced by the manufacturer, as a result of increased demand and competitors seeking to displace us. Further, we have no written or oral agreement with the manufacturer by which we may ensure that our products will be manufactured and shipped to us on a timely basis, the failure for which we would have no legal remedy.
We may face additional barriers and costs as a result of importing our products from China, which could increase our prices and make our products less desirable.
China and the United States may create additional barriers to business between our principal manufacturer and us, including new tariffs, restrictions, controls or embargos that could negatively impact our business. For example, new or increased tariffs would result in higher prices (and thus lower sales volumes) and/or lower operating margins on our products, and thus negatively impact our operating results.
We may be unable to protect our proprietary and technology rights, which may cause an erosion of our competitive strengths.
Our success will depend in part on our ability to protect our proprietary rights and technologies. We intend to rely on a combination of patents, trademark laws, trade secret laws of general applicability, employee confidentiality and invention assignment agreements and other contractual provisions to protect our proprietary rights. However, these measures afford only limited protection. For example, we currently do not own any patents, and we have two patent applications pending with the U.S. Patent and Trademark Office, for technologies that have yet to be tested and produced on a large scale (see “Business”).If these applications are not approved, or if we otherwise fail to adequately protect our proprietary rights, our competitive prospects will be adversely affected. Despite our efforts to protect our proprietary rights, unauthorized parties may attempt to copy aspects of our products or obtain and use trade secrets or other information that we regard as proprietary. There can be no assurance that our technology will remain proprietary.
Litigation or other legal proceedings or third-party claims of intellectual property infringement could require us to spend significant time and money, could prevent us from selling our products and could adversely impact the price of our common stock.
Our commercial success depends in part on our non-infringement of the patents or proprietary rights of third parties and the ability to protect our own intellectual property. Third parties may assert that we are employing their proprietary technology without authorization even if we are not. As we enter new markets, if any, competitors may assert that our products infringe their intellectual property rights as part of a business strategy to impede our successful entry into those markets. Third parties may have obtained and may in the future obtain patents and claim that manufacture, use and/or sale of our technologies, methods or products infringes these patents. We could incur substantial costs and divert the attention of our management and technical personnel in defending ourselves against these claims even if we are eventually successful in such defense. Furthermore, parties making claims against us may be able to obtain injunctive or other relief, which effectively could block our ability to further develop, commercialize, manufacture, use and sell methods and products, and could result in the award of substantial damages against us. In the event of a successful claim of infringement against us, we may be required to pay damages and obtain one or more licenses from third parties, or we may be prohibited from making, using or selling certain methods and/or products. We may not be able to obtain such a license at a reasonable cost, or at all. In that event, we could encounter delays in product introductions while we attempt to develop alternative methods or products. Defense of any lawsuit or failure to obtain any of these licenses on favorable terms could prevent us from commercializing products, and the prohibition of sale of any of our products could materially affect our ability to grow and to maintain profitability.
Our revenues and operating results could decline due to macroeconomic and other factors outside of our control, such as changes in consumer confidence.
Changes in international, national, regional and local economic conditions may result in reduced purchases of the products we sell by consumers and reduction in the prices we are able to charge for the products we sell. These economic conditions involve, among other things, conditions of supply and demand in local markets and changes in consumer confidence and income, employment levels and government regulations. If these changes in economic conditions have an adverse effect on consumer demand for and the pricing of our products, our operating results will suffer.
6
Because we are smaller and have fewer financial resources than many of our competitors, we may not be able to successfully compete in the intensely competitive bioplastics industry.
The bioplastics industry is new but intensely competitive and highly fragmented. We compete with numerous companies, many of which are larger and more established and have significantly greater financial, technical, marketing and other resources than we do. These competitors may be able to respond more quickly to new or changing opportunities and customer requirements and may be able to undertake more extensive promotional activities, offer more attractive terms to customers, and adopt more aggressive pricing policies. We cannot assure you that we will be able to compete effectively or successfully with current or future competitors or that the competitive pressures we face will not harm our business. We also expect to encounter intense competition from other entities seeking to pursue new business opportunities or business combinations. Many of these entities are well-established and have extensive experience in connection with identifying new prospective business opportunities or in effecting business combinations. Many of these competitors possess greater financial, technical, human and other resources than we do and there can be no assurance that we will have the ability to compete successfully for new opportunities or business combinations. Based upon limited financial and personnel resources, we may lack sufficient resources as compared to those of many of potential competitors.
There are risks associated with conducting business operations with China, including increased costs resulting from possible labor shortages and the ability to effectively monitor product quality.
Our primary supplier, from whom we have secured distribution rights for certain bioplastic products, is located in China. As a result, we are subject to the risk of possible increased costs resulting from possible labor shortages in China. In addition, since we do not assemble or otherwise manufacture these products, we are subject to risks associated with the quality-control infrastructure at this manufacturer. Since we are not in control of the actual manufacture or production of these products, we cannot guarantee the quality of their production.
Our success will be influenced by the price of petroleum, the primary ingredient in conventional petroleum-based plastics, relative to the cost of bioplastic raw materials such as cornstarch.
Our success will be influenced by the cost of our eco-friendly alternative products relative to the cost of petroleum-based plastics. The cost of petroleum-based plastic is in part based on the price of petroleum. The prices of our products will depend in part on the cost of certain raw materials such as cornstarch. For example, in past years, the prices of petroleum and corn have diverged. If the price of corn or were to dramatically increase or if the price of petroleum decreases, any of our products based on cornstarch may be less competitive relative to petroleum-based plastics. A material decrease in the cost of conventional petroleum-based plastics may require a reduction in the prices of our products for them to remain attractive in the marketplace. In such instance, if corn prices or the cost of other bioplastic inputs remain stable or increase, we may be required to price our products at a level that causes us to operate at a loss. Recently, the prices of both corn and petroleum have fluctuated. However, based on the nature and scope of such increases, we believe that the fluctuation is a normal part of the price cycle. At this time, we have yet to discern what impact, if any, the recent fluctuations in corn and petroleum prices will have on our business.
Fluctuations in the Chinese RMB to U.S. dollar exchange rate may adversely affect our reported operating results.
We have a significant relationship with a supplier in China, and thus will be affected by the strength of the U.S. dollar relative to the value of the Chinese RMB. A decline in the value of the dollar relative to the Chinese RMB could negatively affect our actual operating costs in U.S. dollars and our reported results of operations, since we may have to pay more for the same products. We do not currently engage in any currency hedging transactions intended to reduce the effect of fluctuations in foreign currency exchange rates on our results of operations. We cannot guarantee that we will enter into any such currency hedging transactions in the future or, if we do, that these transactions will successfully protect us against currency fluctuations.
Changes in government regulations encouraging the use of biodegradable alternatives to plastic products and changes in regulations pertaining to marketing of biodegradable products may have an adverse effect on our business.
One of the key markets for our products is as compostable and biodegradable substitutes for non-biodegradable petroleum-based plastics. This market is driven in part by laws, regulations and policies designed to encourage or mandate the increased use of biodegradable and sustainable alternatives to petroleum-based plastics. Numerous countries, states and localities have enacted such laws and regulations, including bans and taxes on the use of single-use plastic and non-biodegradable plastic bags, due to ecological and waste management concerns. For example, the cities of San Francisco, Manhattan Beach, Malibu and Palo Alto in California, all have imposed bans on single-use non-biodegradable plastic bags. Similar laws have been proposed or enacted in parts of Europe, China, Taiwan and India. The phasing out or elimination of these or similar laws and regulations may adversely affect the demand for our products.
7
The State of California has enacted legislation limiting the use of the terms “compostable,” “biodegradable” and similar terms in connection with certain plastic products. Similar legislation has been adopted or is being proposed in other jurisdictions. While these restrictions also impact our competitors, these laws and regulations may limit our ability to promote or market our products based on their biodegradability characteristics. This could adversely affect the demand for our products which, in turn, could have a material adverse effect on our business, financial condition and results of operations.
We may not be successful in identifying market needs for new technologies and developing new products to meet those needs.
The success of our business model depends on our ability to correctly identify market opportunities for biologically produced plastics. We intend to identify new market needs, but we may not always have success in doing so because the markets for new materials and other products are not well-developed.
The materials and manufacturing technologies we research and develop are new and are steadily changing and advancing. The products that are derived from these technologies may not be applicable or compatible with the demands in existing markets. Our existing products and technologies may become uncompetitive or obsolete if our competitors adapt more quickly than we do to new technologies and changes in customers' requirements. Furthermore, we may not be able to identify new opportunities as they arise for our products since future applications of any given product may not be readily determinable, and we cannot reasonably estimate the size of any markets that may develop. If we are not able to successfully develop new products, we may be unable to increase our product revenues.
Our success depends on our executive officers and other key personnel; the loss of any of them could disrupt our business operations and jeopardize our competitive position.
Our future success will depend in substantial part on the active participation and technical expertise of our senior management, namely William Collins, our Chairman, President and Chief Executive Officer, and Michael Senzaki, our Chief Operating Officer and Chief Financial Officer. The loss of the services of Messrs. Collins or Senzaki, or one or more of our other key personnel, could jeopardize our ability to maintain a competitive position in the bioplastics industry. Effective upon completion of this offering, we will be party to an employment agreement with Mr. Collins. We do not currently have any employment agreements in place with our other executive officers and key personnel, and we do not carry key-man life or other insurance for our benefit on the lives of any of our executive officers and key personnel. Our future success will also depend on the continued ability to attract, retain and motivate highly qualified technical sales and marketing customer support personnel. We cannot guarantee that we will be able to retain our key personnel or that we will be able to attract and retain qualified personnel in the future.
If we fail to maintain effective internal controls over financial reporting, the price of our common stock may be negatively affected.
Because we have not yet evaluated the effectiveness of our internal control over financial reporting, it may have weaknesses and conditions that could require correction or remediation, the disclosure of which may have a negative impact on the price of our common stock. We are required to establish and maintain appropriate internal controls over financial reporting. Failure to establish those controls, or any failure of those controls once established, could adversely impact our public disclosures regarding our business, financial condition or results of operations. In addition, management’s assessment of internal controls over financial reporting may identify weaknesses and conditions that need to be addressed in our internal controls over financial reporting or other matters that may raise concerns for investors. Any actual or perceived weaknesses and conditions that need to be addressed in our internal control over financial reporting, disclosure of management’s assessment of our internal controls over financial reporting or disclosure of our public accounting firm’s attestation to or report on management’s assessment of our internal controls over financial reporting may have a negative impact on the price of our common stock.
If we fail to comply in a timely manner with Section 404 of the Sarbanes Oxley Act of 2002, our business could be harmed and our stock price could decline.
Rules adopted by the SEC pursuant to Section 404 of the Sarbanes-Oxley Act of 2002 require annual assessment of our internal controls over financial reporting. The standards that must be met for management to assess the internal controls over financial reporting as effective are evolving and complex, and require significant documentation, testing and possible remediation to meet the detailed standards. We expect to incur significant expenses and to devote resources to Section 404 compliance on an ongoing basis. It is difficult for us to predict how long it will take or costly it will be to complete the assessment of the effectiveness of our internal control over financial reporting for each year and to remediate any deficiencies in our internal control over financial reporting. As a result, we may not be able to complete the assessment and remediation process on a timely basis. In the event that our chief executive officer or chief financial officer determine that our internal control over financial reporting is not effective as defined under Section 404, we cannot predict how regulators will react or how the market price of our shares will be affected; as such, we believe that there is a risk that investor confidence and share value may be negatively impacted.
8
Risks Relating to Our Common Stock and this Offering
There is no trading market for our common stock and as a result you may not be able to sell our common stock.
There is no market for our common stock and there may never be a market for our common stock. We do not anticipate that a market for our common stock will develop, if at all, until after the registration statement of which this prospectus is a part has been declared effective by the SEC. In the absence of an active trading market, you may have difficulty buying and selling or obtaining market quotations; the market visibility for our stock may be limited, and the lack of visibility for our common stock may have a depressive effect on the market price for our common stock.
There is no trading market for the warrants to purchase common stock in this offering.
There is no established public trading market for the warrants being offered in this offering, and we do not expect a market to develop. In addition, we do not intend to list the warrants on a national securities exchange or arrange to have the warrants quoted on the OTC Bulletin Board following this offering. Without an active market, the liquidity of the warrants will be limited.
You will experience immediate and substantial dilution as a result of this offering and may experience additional dilution in the future.
You will incur immediate and substantial dilution as a result of this offering. After giving effect to the sale by us of up to [●] shares and warrants offered in this offering at a public offering price of $[●] per share and warrant, and after deducting the placement agent’s fees and estimated offering expenses payable by us, investors in this offering can expect an immediate dilution of $[●] per share, or [●] %, at the public offering price. In addition, in the past, we issued options and warrants to acquire shares of common stock and will issued warrants in this offering. To the extent these options or warrants are ultimately exercised, you will sustain future dilution.
9
Additional stock offerings in the future may dilute your percentage ownership of our company.
Given our plans and expectations that we may need additional capital and personnel, we may need to issue additional shares of common stock or securities convertible or exercisable for shares of common stock, including convertible preferred stock, convertible notes, stock options or warrants. The issuance of additional securities in the future will dilute the percentage ownership of then current stockholders.
There is no minimum amount required to be raised in the offering, and if we cannot raise sufficient funds from this offering, we may need to curtail or cease operations.
There is not a minimum amount of securities that need to be sold in this offering for us to access the funds. Therefore, the proceeds of this offering will be immediately available for use by us and we do not have to wait until a minimum number of shares have been sold to keep the proceeds from any sales. We cannot assure you that subscriptions for the entire offering will be obtained. We have the right to terminate this offering at any time, regardless of the number of securities we have sold since there is no minimum subscription requirement. Our ability to meet our financial obligations, cash needs, and to achieve our objectives, could be adversely affected if the entire offering is not fully subscribed for and as a result we could be forced to curtail or cease our operations.
The rights of holders of common stock may be impaired by the possible future issuance of preferred stock.
Our board of directors has the right, without stockholder approval, to issue preferred stock with voting, dividend, conversion, liquidation and other rights which could adversely affect the voting power and equity interest of the holders of common stock, which could be issued with the right to more than one vote per share, and could be utilized as a method of discouraging, delaying or preventing a change of control. The possible negative impact on takeover attempts could adversely affect the price of our common stock. Although we have no present intention to issue any shares of preferred stock or to create any series of preferred stock, we may issue these shares in the future.
William Collins will continue to own a substantial amount of our common stock after this offering, which could delay or prevent a change in corporate control or result in the entrenchment of our management and board of directors.
Upon completion of this offering, assuming the sale of all the securities offered hereby, William Collins, our Chairman, President and Chief Executive Officer, will beneficially own approximately [●]% of the outstanding shares of our common stock. As a result of his continuing ownership interest, Mr. Collins will have the ability to exert substantial control over the outcome of certain matters requiring a stockholder vote, including the election of directors and offers to acquire our company. In addition, Mr. Collins will have the ability to exert substantial control over the management and affairs of our company. Accordingly, this concentration of ownership may harm the market price of our common stock by:
|
•
|
delaying, deferring or preventing a change in control;
|
|
•
|
entrenching our management or our board of directors;
|
|
•
|
impeding a merger, consolidation, takeover or other business combination; or
|
|
•
|
discouraging a potential acquirer from making a tender offer or otherwise attempting to obtain control of the company.
|
We have not paid dividends in the past and do not expect to pay dividends in the future. Any return on your investment will likely be limited to the value of our common stock.
We have never paid cash dividends on our common stock and do not anticipate paying cash dividends in the foreseeable future. The payment of dividends on our common stock will depend on earnings, financial condition and other business and economic factors affecting us at such time as our board of directors may consider relevant. If we do not pay dividends, our common stock may be less valuable because a return on your investment will only occur if our stock price appreciates.
We have broad discretion in the use of the net proceeds of this offering and may not use them effectively.
Management will retain broad discretion over the use of the net proceeds of this offering. Stockholders may not agree with such uses, and our use of the proceeds may not yield a significant return or any return at all for our stockholders. We plan to use the net proceeds from this offering for capital expenditures relating to our new planned facility in Oregon, working capital and general corporate purposes. Because of the number and variability of factors that will determine our use of the proceeds from this offering, their ultimate use may vary substantially from their currently intended use. The failure by our management to apply these funds effectively could have a material and adverse effect on our business. For a further description of our intended use of the net proceeds of the offering, see “Use of Proceeds.”
10
Because we are seeking a limited offering qualification in California, sales of our shares and warrants will be limited in California.
We are seeking a limited offering qualification of our units in California. If the offering is approved in California on the basis of such limited offering qualification, in the absence of any other exemptions, offers and sales of our units can only be made to proposed California purchasers based on their meeting certain suitability standards. California investors must meet at least one of the following criteria:
|
·
|
|
·
|
|
·
|
|
·
|
any natural person whose individual net worth, or joint net worth with that person's spouse, at the time of his purchase exceeds $1,000,000 (exclusive of home, home furnishings and automobile);
|
|
·
|
|
·
|
|
·
|
any entity in which all of the equity owners are accredited investors.
|
If the offering is approved in California on the basis of a limited offering qualification, we will not have to demonstrate compliance with some of the merit regulations of the California Department of Corporations as found in Title 10, California Code of Regulations, Rule 260.140 et seq. In addition, the exemptions for secondary trading in California available under California Corporations Code Section 25104(h) will be withheld, although there may be other exemptions to cover private sales in California of a bona fide owner for his own account without advertising and without being effected by or through a broker dealer in a public offering.
Because our common stock will be subject to the SEC’s penny stock rules, broker-dealers may experience difficulty in completing customer transactions and trading activity in our securities may be adversely affected.
Our common stock will be subject to the “penny stock” rules adopted under Section 15(g) of the Exchange Act. The penny stock rules generally apply to companies whose common stock is not listed on The Nasdaq Stock Market or other national securities exchange and trades at less than $1.00 per share, other than companies that have had average revenue of at least $6,000,000 for the last three years or that have tangible net worth of at least $5,000,000 ($2,000,000 if the company has been operating for three or more years). So long as our common stock remains subject to the “penny stock” rules promulgated under the Securities Exchange Act of 1934, broker-dealers may find it difficult to effectuate customer transactions and trading activity in our securities may be adversely affected.
In accordance with these rules, broker-dealers participating in transactions in low-priced securities must first deliver a risk disclosure document that describes the risks associated with such stocks, the broker-dealer's duties in selling the stock, the customer's rights and remedies and certain market and other information. Furthermore, the broker-dealer must make a suitability determination approving the customer for low-priced stock transactions based on the customer's financial situation, investment experience and objectives. Broker-dealers must also disclose these restrictions in writing to the customer, obtain specific written consent from the customer, and provide monthly account statements to the customer. The effect of these restrictions will probably decrease the willingness of broker-dealers to make a market in our common stock, decrease liquidity of our common stock and increase transaction costs for sales and purchases of our common stock as compared to other securities. Our management is aware of the abuses that have occurred historically in the penny stock market.
As a result, so long as our common stock remains subject to the penny stock rules, the market price of our securities may be depressed, and you may find it more difficult to sell our securities.
11
SPECIAL NOTE REGARDING FORWARD-LOOKING STATEMENTS
Some of the statements contained in this prospectus that are not historical facts are "forward-looking statements" which can be identified by the use of terminology such as “estimates,” “projects,” “plans,” “believes,” “expects,” “anticipates,” “intends,” or the negative or other variations, or by discussions of strategy that involve risks and uncertainties. We urge you to be cautious of the forward-looking statements, that such statements, which are contained in this prospectus, reflect our current beliefs with respect to future events and involve known and unknown risks, uncertainties and other factors affecting our operations, market growth, and products. No assurance can be given regarding the achievement of future results, as actual results may differ materially as a result of the risks we face, and actual events may differ from the assumptions underlying the statements that have been made regarding anticipated events. Factors that may cause actual results, our performance or achievements, or industry results, to differ materially from those contemplated by such forward-looking statements include without limitation:
|
·
|
Uncertainties regarding the growth or sustainability of the market for biodegradable materials;
|
|
·
|
Changes in consumer preferences with regard to plastic products;
|
|
·
|
The risk that we may not be able to achieve or maintain a technological advantage over any of our competitors in the industry;
|
|
·
|
Risks relating to the protection of our intellectual property and proprietary technology; and
|
|
·
|
The risks associated with limited management, employees and financial resources.
|
12
USE OF PROCEEDS
We estimate that the aggregate net proceeds to us assuming the sale of all the securities in this offering will be approximately $6,780,000, after deducting placement agent fees and approximately $300,000 of estimated offering expenses that will be payable by us from the proceeds of this offering. However, this is a best efforts offering, with no minimum, and there can be no assurance that the offering will result in significant proceeds, or enough proceeds to continue to operate our business operations.
We intend to use the net proceeds from this offering as follows:
|
Use of Proceeds
|
Approximate Dollar Amount
|
Approximate Percentage of Net Proceeds
|
||||||
|
Purchasing Machinery for Production Facilities (1)
|
$
|
5,000,000
|
73.8
|
%
|
||||
|
Purchasing Components for Tooling (2)
|
250,000
|
3.7
|
%
|
|||||
|
Equipping Facilities for Operations (3)
|
250,000
|
3.7
|
%
|
|||||
|
Repaying Debt (4)
|
654,775
|
9.7
|
%
|
|||||
|
Expanding Marketing and Brand Development (5)
|
175,000
|
2.6
|
%
|
|||||
|
Purchasing Raw Materials (6)
|
175,000
|
2.6
|
%
|
|||||
|
General Corporate Purposes (7)
|
275,225
|
4.1
|
%
|
|||||
|
Total
|
$
|
6,780,000
|
100.0
|
%
|
||||
______________________
(1) We plan to use approximately $5,000,000 in net proceeds to purchase extrusion, thermoforming and injection- molding equipment, and associated materials handling, packaging and operating equipment needed in our planned manufacturing facility in Oregon.
(2) We plan to use approximately $250,000 in net proceeds to purchase tooling components such as our initial product molds for our injection-molding lines (such as forks, knives and spoons) and thermoforming lines (such as clamshells, bowls, cups and plates) in our planned manufacturing facility in Oregon.
(3) We plan to use approximately $250,000 in net proceeds to prepare our planned manufacturing facility in Oregon for adequate power distribution, chilled water, compressed air and similar utility services.
(4) We plan to use $654,775 in net proceeds to retire the inventory financing note due Zhejiang Wafa Ecosystem Science & Technology Co. Ltd. (known as Zwest) in the amount of $450,000, and a related-party note payable to William Collins, our Chairman, President and Chief Executive Officer, in the amount of $204,775 (including $145,679 in principal and $59,096 in accrued interest). Zwest’s note accrues interest at the rate of 18% per year and is payable on September 30, 2012. Mr. Collins’s note accrues interest at the rate of 12% per year and is payable on demand. We used the proceeds from both of these notes to finance our purchase of inventory.
( 5) We plan to use approximately $175,000 in net proceeds to increase our visibility and brand awareness in the marketplace. Specific uses of such net proceeds will include design patent and trademark registration costs, trade show collateral and attendance expenses, advertising and related marketing activities.
(6) In order to initiate manufacturing, we will be required to take delivery by railcar of the raw materials in an amount roughly equivalent to our holding capacity, or approximately 154 metric tons of supplies at an approximate cost of $175,000.
|
(7) We plan to use the remaining $275,225 in net proceeds for working capital and general corporate purposes, including interest and overhead.
|
13
As of the date of this prospectus, we cannot predict with certainty the amounts that we will actually spend on the uses set forth above. The amounts and timing of our actual expenditures will depend upon numerous factors, including the progress of our research, product development, and commercialization efforts, and our operating costs and expenditures. Accordingly, our management will have significant flexibility in applying the net proceeds of this offering.
We believe that the net proceeds of this offering, together with operating revenues and the remaining proceeds from our prior private placement, will be sufficient to meet our projected requirements for working capital and capital expenditures through at least the next 12 months. Pending use of the proceeds from this offering as described above or otherwise, we intend to invest the net proceeds in short-term interest-bearing, investment grade securities.
We have never declared or paid cash dividends on our capital stock. Following the completion of this offering, we intend to retain our future earnings, if any, to finance the further development and expansion of our business and do not expect to pay cash dividends on our common stock in the foreseeable future. Payment of future cash dividends, if any, will be at the discretion of our board of directors after taking into account various factors, including our financial condition, operating results, current and anticipated cash needs, outstanding indebtedness and plans for expansion and restrictions imposed by lenders, if any.
CAPITALIZATION
The following table sets forth our short-term debt and capitalization as of September 30, 2011, (a) on an actual basis and (b) on a pro forma, as adjusted basis, to reflect: (i) the estimated net proceeds of $6,780,000 from the sale of all of the securities offered hereby and (ii) the repayment of short-term debt and long-term debt in the amounts of $204,775 and $450,000, respectively.
You should read this table together with our financial statements and the related notes included in this prospectus.
|
As of September 30, 2011
|
||||||||||||||
|
Actual
|
Pro forma adjustment
|
Pro forma, as adjusted
|
||||||||||||
|
Current liabilities:
|
||||||||||||||
|
Note payable and accrued interest - related party
|
$ | 204,775 | $ | (204,775 | ) | (2 | ) | $ | - | |||||
|
Long-term debt:
|
||||||||||||||
|
Notes payable
|
$ | 550,000 | $ | (450,000 | ) | (2 | ) | $ | 100,000 | |||||
|
Stockholders’ (deficit) equity:
|
||||||||||||||
|
Preferred stock, $0.001 par value, 20,000,000 shares authorized, 0 shares issued and outstanding
|
- | - | - | |||||||||||
|
Common stock, $0.001 par value, 100,000,000 shares authorized, 6,493,345 shares issued, actual, 5,493,345 shares issued and outstanding, actual; _______ shares issued, pro forma, as adjusted, ________- shares issued and outstanding, pro forma, as adjusted
|
6,493 | (1 | ) | |||||||||||
|
Additional paid-in capital
|
2,183,283 | (1 | ) | |||||||||||
|
Treasury stock
|
(100,000 | ) | - | (100,000 | ) | |||||||||
|
Accumulated deficit
|
(3,375,605 | ) | - | (3,337,605 | ) | |||||||||
|
Total shareholders’ (deficit) equity
|
(329,542 | ) | 6,780,000 | 6,450,458 | ||||||||||
|
Total capitalization
|
$ | 220,458 | $ | 6,330,000 | $ | 6,550,458 | ||||||||
|
Footnotes for the pro forma adjustments:
|
||||||||||||||
|
(1) Assumes that all of the shares of common stock and warrants to purchase [●] shares of common stock are sold in this offering at an offering price of $ per share and warrant and that the net proceeds thereof are approximately $6,780,000 after deducting placement agent’s fees and our estimated offering expenses.
|
||
|
(2) Represents repayment of short-term debt and long-term debt in the amounts of $204,775 and $450,000, respectively.
|
||
14
DILUTION
If you invest in shares of our common stock, your interest will be diluted to the extent of the difference between the public offering price per share and warrant and our net tangible book value per share after this offering. Dilution results from the fact that the public offering price per share is substantially in excess of the book value per share attributable to the existing shareholders for our presently outstanding shares.
Our net tangible book value as of September 30, 2011 was approximately ($329,542) or ($0.06) per share as of that date. Net tangible book value represents the amount of our total assets (all tangible), less the amount of our total liabilities. Dilution is determined by subtracting net tangible book value per share, after giving effect to the estimated net proceeds of $6,780,000 which we will receive from the sale of shares of our common stock and warrants in this offering at an offering price of $ per share, after deducting placement agent’s fee and other estimated offering expenses payable by us.
Without taking into account any other changes in net tangible book value after September 30, 2011, other than giving effect to the sale of the common stock offered in this offering at an offering price of $_______ per share less placement agent’s fees and other estimated offering expenses payable by us, our pro forma net tangible book value as of September 30, 2011 would have been $6,450,458, or $ per share. This represents an immediate increase in net tangible book value of $ per share to the existing shareholders and an immediate dilution in net tangible book value of $ per share to investors purchasing shares in this offering. The following table illustrates such dilution
|
Public offering price per share
|
$
|
|||||||
|
Historical net tangible book value per share as of September 30, 2011
|
$
|
(0.06)
|
||||||
|
Increase in net tangible book value per share attributable to purchasing shares offered hereby
|
|
|||||||
|
Pro forma net tangible book value per share after this offering
|
||||||||
|
Amount of dilution in net tangible book value per share to new investors in this offering
|
$
|
The following table summarizes, on a pro forma basis as of September 30, 2011, the differences between existing shareholders and new investors with respect to the number of shares purchased from us, the total consideration paid and the average price per share paid, without deducting the placement agent’s fees and other estimated expenses payable by us in connection with this offering.
|
Shares Purchased
|
Total Consideration
|
||||||||||||||||
|
Number
|
Percent
|
Amount
|
Percent
|
Average Price Per Share
|
|||||||||||||
|
Existing shareholders
|
5,493,345
|
%
|
$
|
%
|
$
|
||||||||||||
|
New investors
|
%
|
$
|
8,000,000
|
%
|
$
|
||||||||||||
|
Total
|
100.0
|
%
|
$
|
100.0
|
%
|
||||||||||||
The foregoing illustration does not reflect potential dilution from the exercise of outstanding options or warrants to purchase shares of our common stock, including the shares underlying the warrants sold in this offering or the placement agent’s warrants. If the holders of these derivative securities exercise them at a price per share that is less than the $ [●] public offering price per share and warrant, our new investors will have further dilution.
15
MANAGEMENT'S DISCUSSION AND ANALYSIS OF FINANCIAL CONDITION
AND RESULTS OF OPERATIONS
This Management’s Discussion and Analysis contains not only statements that are historical facts, but also statements that are forward-looking. These forward-looking statements involve certain known and unknown risks, uncertainties and other factors which may cause our actual results, performance or achievements to be materially different from any future results, performance or achievements expressed or implied by these forward-looking statements. These factors include, among others, the factors set forth above under “Risk Factors.” The words “believe,” “expect,” “anticipate,” “intend,” “plan” and similar expressions identify forward-looking statements. We caution you not to place undue reliance on these forward-looking statements. Except as required by U.S. federal securities laws, we undertake no obligation to update and revise any forward-looking statements or to publicly announce the result of any revisions to any of the forward-looking statements in this document to reflect any future events or developments.
Although the forward-looking statements in this prospectus reflect the good faith judgment of our management, such statements can only be based on facts and factors currently known by us. Consequently, and because forward-looking statements are inherently subject to risks and uncertainties, the actual results and outcomes may differ materially from the results and outcomes discussed in the forward-looking statements. You are urged to carefully review and consider the various disclosures made by us in this prospectus as we attempt to advise interested parties of the risks and factors that may affect our business, financial condition, and results of operations and prospects.
The report of our independent registered public accounting firm with respect to our audited financial statements in this prospectus includes a “going concern” paragraph indicating that our accumulated deficit as of December 31, 2010, limited liquidity and failure to complete our efforts to establish a recurring source of revenues sufficient to cover operating costs for the next 12-month period, raises substantial doubt about our ability to continue as a going concern.
The following discussion of our financial condition and results of operations should be read in conjunction with our financial statements and the related notes, and other financial information included in this prospectus.
Overview
Trellis Earth Products, Inc. specializes in developing and marketing bioplastics technology and products, specifically products focused on the food service industry including disposable deliware, cutlery and trash liners and shopping bags. We provide customers with an alternative to traditional petroleum-based food packaging, reducing the consumption of oil, which is the primary objective of sustainability. We market and distribute our products through distribution arrangements, select resellers, brokers, agents, direct sales and vertical market suppliers. As of January 17, 2012, more than 500 customers are using our bioplastics products.
We have two customers representing approximately 78% of total revenues for the nine months ended September 30, 2011.
Bunzl Distribution USA, Inc. (Bunzl), one of the largest distributors of paper and plastic food service items in the United States, and its affiliates accounted for approximately 59%, 64% and 71% of our revenues for the nine months ended September 30, 2011 and the years ended December 31, 2010 and 2009, respectively. United Management Group (UMG) accounted for approximately 19% and 10% of our revenues for the nine months ended September 30, 2011 and the year ended December 31, 2010, respectively. UMG distributes our products to school districts and public organizations across the country. UMG has been our distributor to the Denver Public School District and several smaller school districts across the West Coast.
Except for Bunzl and United Management, no other single entity has accounted for more than 10% of our sales during the nine months ended September 30, 2011 and the years ended December 31, 2010 and 2009.
Revenue is recognized when the products being sold have been shipped, title and risk of loss have been transferred, collectability is probable and pricing is fixed. Title and risk of loss is determined by the terms and conditions of each sale. The majority of our sales are to distributors in the United States. We deliver our products to customers through either shipments from our distribution center in Portland, Oregon or direct shipments from the vendor's manufacturing facility in China. For the years ended December 31, 2010 and 2009, approximately 90% and 100%, respectively, of our revenue was derived from shipments made from Portland, Oregon. For the years ended December 31, 2010 and 2009, approximately 10% and 0%, respectively, of our revenue was derived from direct shipments from China. Revenues for the direct shipments are recognized when the customers received shipments. There are no provisions with our distributors for returns without cause, and payment is due within 30 - 35 days within transfer of title. We have not had any material collections issues with any of our distributors.
Beginning in March 2011, an affiliate of our largest distributor Bunzl takes title to shipments in China. Under this arrangement, we recognize revenue when title and risk of loss are transferred and when shipments are delivered to the customer’s facility in China. Payments for these sales are due 30 - 35 days from the date of transfer of title.
We currently outsource the production of substantially all of our products to Zhejiang Wafa Ecosystem Science & Technology Co. Ltd. (known as Zwest) in the People’s Republic of China. Approximately 99% of our total purchases of manufactured products and supplies, or $1,260,294, $1,554,389 and $1,371,356 for the nine months ended September 30, 2011 and the years ended December 31, 2010 and 2009, respectively, were from Zwest.
In the first quarter of 2011, we began transitioning manufacturing operations to our current headquarters in Wilsonville, Oregon and expect to commence production there in mid-2012. In 2013, subject to obtaining additional funding of approximately $8 million, we plan to equip a second plant in Illinois. Together, these facilities are expected to have an estimated annual production capacity of 40 million pounds of bioplastics-based products. The raw material, finishing and other manufacturing costs involved with our future plants are described under "Business -- Competitive Advantages" and " -- Manufacturing Strategy."
Matters that May or Are Currently Affecting Our Business
The main challenges and trends that could affect or are affecting our financial results include:
Increased sourcing costs from Asia - The combined effect of labor shortages in China, the falling dollar relative to the Chinese RMB, increased trans-Pacific shipping costs due to increasing fuel prices, increase in raw material prices paid by our factory and other increases in costs which are passed on to us, which we might not be able to fully pass on to our customers, has in the past caused our margins to suffer and has negatively impacted our cash flow and profitability. These conditions could be more prevalent in coming years.
Increased materials costs in the U.S . - Increased costs associated with our planned sourcing of raw materials including polymer supplies, which are tightly correlated to rising crude oil costs, increases in costs driven by corn rising prices, and similar cost component increases could impair our operating margins.
Results of Operations
Nine Months Ended September 30, 2011 Compared to Nine Months Ended September 30, 2010 (unaudited )
The following table sets forth, for the periods indicated, data derived from our statements of operations:
|
Nine Months Ended September 30,
|
||||||||||||||||||||
|
2011
|
% of Revenues
|
2010
|
% of Revenues
|
$ Increase (Decrease)
|
||||||||||||||||
|
Revenues
|
$
|
2,151,837
|
$
|
1,987,085
|
$
|
164,752
|
||||||||||||||
|
Cost of revenues
|
1,517,792
|
70.5%
|
1,345,832
|
67.7%
|
171,960
|
|||||||||||||||
|
Gross profit
|
634,045
|
29.5%
|
641,253
|
32.3%
|
(7,208)
|
|||||||||||||||
|
Selling, general and admin. expenses
|
1,753,310
|
81.5%
|
623,608
|
31.4%
|
1,129,702
|
|||||||||||||||
|
Research and development expense
|
45,600
|
2.1%
|
31,000
|
1.6%
|
14,600
|
|||||||||||||||
|
Depreciation expense
|
9,422
|
0.4%
|
6,492
|
0.3%
|
2,930
|
|||||||||||||||
|
Loss from operations
|
(1,174,287)
|
(54.6)%
|
(19,847)
|
(1.0)%
|
1,154,440
|
|||||||||||||||
|
Interest expense
|
(77,314)
|
(3.6)%
|
(52,607)
|
(2.6)%
|
24,707
|
|||||||||||||||
|
Net loss
|
$
|
(1,251,601)
|
(58.2)%
|
$
|
(72,454)
|
(3.6)%
|
$
|
1,179,147
|
||||||||||||
17
Revenues
Net revenues increased by $164,752, or 8.29%, to $2,151,837 for the nine months ended September 30, 2011 compared to the nine months ended September 30, 2010. The sales increase for the period was attributable to volume increases associated with a new sales contract entered into the latter part of the third quarter of 2010 to provide products to the Denver Public School District along with increases in existing customer volumes.
Cost of Revenues
Cost of revenues increased by $171,960, or 12.78%, to $1,517,792 for the nine months ended September 30, 2011 compared to the nine months ended September 30, 2010. The increase was primarily due to a price increase from our contract manufacturer in China of 5-9% which increased cost of sales as a percentage of revenues by 4%, or approximately $86,000, compared to the nine months ended September 30, 2010. The price increase, coupled with 8% growth in revenues during the nine months ended September 30, 2011, accounts for the increase in cost of revenues for the nine months ended September 30, 2011.
Gross Profit
Gross profit decreased by $7,208 to $634,045 for the nine months ended September 30, 2011 compared to the nine months ended September 30, 2010. As a percentage of net sales, gross profit margin decreased by 2.8% to 29.5% for the nine months ended September 30, 2011 compared to 32.3% for the nine months ended September 30, 2010. The decrease in gross profit percentage was primarily due to an overall price increase from our outsourced manufacturer. Due to rising labor rates in China and the deflating dollar versus the Chinese RMB, our outsourced manufacturer has placed a 5-8% overall price increase on our products. Coupled with increased fuel charges from our trans-Pacific shipping carriers, gross margin percentages have decreased for the nine months ended September 30, 2011.
Selling, General and Administrative Expenses
Overall, total selling, general and administrative expenses increased by $1,129,702, or 181.16%, to $1,753,310 for the nine months ended September 30, 2011 compared to the nine months ended September 30, 2010. The increase was largely attributable to increases in professional fees and increased head count as discussed below.
On February 14, 2011, we granted 100,000 shares of common stock to engage an investor relations firm to prepare us for the planned public offering of our common stock. The fair value of $200,000, or $2.00 per share, was a non-cash charge to selling, general and administrative expenses for the nine months ended September 30, 2011. The increase can also be attributed to additional professional fees of $230,455 related to the year-end audit, legal fees related to the settlement and mediation of a legal dispute and billings from SEC counsel associated with the preparation of a registration statement. In addition to professional fees, we increased our head-count which accounted for approximately $326,000 of the increase in selling, general, and administrative expense for the nine months ended September 20, 2011. In addition, we incurred moving expenses and increased rent associated with our new facility in Wilsonville, Oregon of approximately $40,000.
During the nine months ended September 30, 2011, we hired key personnel to assist in the expansion of our operations. As such, payroll-related expenses for the nine months ended September 30, 2011 increased compared to the same period in 2010.
Research and Development Expense
Research and development expenses increased by $14,600 or 47.1% to $45,600 for the nine months ended September 30, 2011 compared to the nine months ended September 30, 2010. The increase is directly attributable to our efforts to file two patents related to our proprietary biomass blended polymers and the hiring of our Vice President of Research and Development in June of 2011.
Interest Expense
Interest expense increased by $24,707 or 46.97% to $77,314 for the nine months ended September 30, 2011 compared to the nine months ended September 20, 2010. The increase in interest expense is directly attributable to the increase in our inventory payable from our outsourced manufacturer and the note payable to Yip which was executed December 15, 2010.
Net Loss
Net loss increased by $1,179,147, or 1,627.44%, to $1,251,601 for the nine months ended September 30, 2011 compared to the nine months ended September 30, 2010. This increase was due primarily to the increase in selling, general and administrative expenses as discussed above.
18
Year Ended December 31, 2010 Compared to Year Ended December 31, 2009
The following table sets forth, for the periods indicated, data derived from our statements of operations:
|
Year Ended December 31,
|
||||||||||||||||||||
|
2010
|
% of Revenues
|
2009
|
% of Revenues
|
$ increase (decrease)
|
||||||||||||||||
|
Revenues
|
$
|
2,686,255
|
100
|
%
|
$
|
2,178,534
|
100
|
%
|
507,721
|
|||||||||||
|
Cost of revenues
|
1,946,782
|
72.5
|
%
|
1,569,600
|
72.1
|
%
|
377,182
|
|||||||||||||
|
Gross profit
|
739,473
|
27.5
|
%
|
608,934
|
28.0
|
%
|
130,539
|
|||||||||||||
|
Selling, general and admin. expenses
|
879,676
|
32.8
|
%
|
889,895
|
40.9
|
%
|
(10,219
|
)
|
||||||||||||
|
Research and development expense
|
42,300
|
1.6
|
%
|
38,500
|
1.8
|
%
|
3,800
|
|||||||||||||
|
Employee severance expense
|
160,000
|
6.0
|
%
|
-
|
-
|
-
|
||||||||||||||
|
Depreciation expense
|
10,899
|
0.4
|
%
|
8,126
|
0.4
|
%
|
2,773
|
|||||||||||||
|
Loss from operations
|
(353,402
|
)
|
-13.2
|
%
|
(327,587
|
)
|
-15.0
|
%
|
25,815
|
|||||||||||
|
Loss on disposition of fixed assets
|
(1,583
|
)
|
0.0
|
%
|
-
|
-
|
-
|
|||||||||||||
|
Interest expense
|
(104,487
|
)
|
-3.9
|
%
|
(116,494
|
)
|
-5.4
|
%
|
(12,007
|
)
|
||||||||||
|
Net loss
|
$
|
(459,472
|
)
|
-17.1
|
%
|
$
|
(444,081
|
)
|
-20.4
|
%
|
15,391
|
|||||||||
Revenues
Net revenues increased by $507,721, or 23%, to $2,686,255 for the year ended December 31, 2010 compared to the year ended December 31, 2009. The sales increase for the period was attributable to volume increases associated with both existing customer contracts and a new contract with the Denver Public Schools entered into during the third quarter of 2010 which accounted for $160,738 in new revenue during the period. In 2010, we had one customer that accounted for approximately 64% of total gross sales. In 2009, the same customer accounted for 71% of total gross sales.
Cost of Revenues
Cost of revenues increased by $377,182, or 24%, to $1,946,782 for the year ended December 31, 2010 compared to the year ended December 31, 2009. The increase was primarily due to 23% growth in revenues during the year ended December 31, 2010 compared to the same period in 2009. In addition to the increase in revenue, inbound freight surcharges caused an increase of approximately 1% of the change in cost of revenues for the period. Cost of revenues as a percentage of revenues remained materially consistent over the two periods.
Gross Profit
Gross profit increased by $130,539, or 21%, to $739,473 for the year ended December 31, 2010 compared to the year ended December 31, 2009. The increase in gross profit was primarily due to the increase in retail sales and high margin contracts signed in the third quarter of 2010.
Selling, General and Administrative Expenses
Overall, selling general and administrative expenses decreased by $10,219, or 1%, to $879,676 for the year ended December 31, 2010 compared to the year ended December 31, 2009.The decrease was due to a combination of the following factors: During the year ended December 31, 2009, we granted 289,625 shares of common stock to our employees and contractors for services with a fair value of $289,625, or $1.00 per share, compared to the year ended December 31, 2010 when only 56,000 shares of common stock were issued with a fair value of $56,000. The fair value of the stock grants were charged to selling, general and administrative expenses in the period the services were rendered. To offset the stock grants, professional fees increased by $112,000, to $127,000 for the year ended December 31, 2010 compared to the year ended December 31, 2009. The increase was primarily driven by fees incurred by accounting firms for the audit of our financial statements, as well as increased legal fees relating to litigation with our former employees.
Employee Severance Expense
In 2011, we settled with two former employees on their severance pay. The settlement amount of approximately $160,000 was charged to operations in 2010.
Research and Development Expense
Research and development expenses increased by $3,800 or 10% to $42,300 for the year ended December 31, 2010 compared to year ended December 31, 2009. The increase is directly attributable to our testing of various materials and processing combinations in order to develop our proprietary biomass blended polymers to be used within our product line.
19
Interest Expense
Interest expense was $104,487 for the year ended December 31, 2010 compared to $116,494 for the same period of 2009, a decrease of $12,007, or 10%. The decrease in interest expense was due to the fact that approximately $340,000 of notes were retired in the third quarter of 2010 and the convertible note of $200,000 to Yip was not entered into until late in the fourth quarter of 2010.
Net Loss
Net loss increased by $15,391, or 3%, to $459,472 for the year ended December 31, 2010 compared to $444,081 for the year ended December 31, 2009. The minimal change in net loss was primarily due to factors discussed in the accounts above.
Liquidity and Capital Resources
We have financed our operations primarily through sales of our products, sales of our common stock and preferred stock and the issuance of promissory notes.
The following tables sets forth, for the periods indicated, selected cash flow information:
|
|
Nine Months Ended September 30,
|
|||||||
|
|
2011
|
2010
|
||||||
|
Cash flows provided by (used in) operating activities
|
|
$
|
(902,967
|
)
|
$
|
426,739
|
||
|
Cash flows used in investing activities
|
|
(16,587)
|
)
|
(16,667
|
)
|
|||
|
Cash flows provided by (used in) financing activities
|
|
986,425
|
(424,062
|
)
|
||||
|
|
||||||||
|
Net increase (decrease) in cash and cash equivalents
|
|
$
|
66,871
|
$
|
(13,990
|
)
|
||
|
|
||||||||
|
|
Year Ended December 31,
|
|||||||
|
|
2010
|
2009
|
||||||
|
Cash flows provided by operating activities
|
|
$
|
462,199
|
$
|
15,000
|
|||
|
Cash flows used in investing activities
|
|
(31,588
|
)
|
(80,749
|
)
|
|||
|
Cash flows (used in) provided by financing activities
|
|
(447,062
|
)
|
80,754
|
||||
|
|
||||||||
|
Net increase (decrease) in cash and cash equivalents
|
|
$
|
(16,451
|
)
|
15,005
|
|||
|
|
||||||||
We did not have any cash or cash equivalents held in financial institutions located outside of the United States as of December 31, 2010 and September 30, 2011 . We do not anticipate this practice will change in the future.
Nine Months Ended September 30, 2011 Compared to Nine Months Ended September 30, 2010 (unaudited)
Cash and cash equivalents as of September 30, 2011 were $88,825 compared to $24,415 as of September 30, 2010. The increase in cash was primarily due to proceeds from sale of common stock offset by expenses related to an offering of our common stock.
Net cash used in operating activities was $902,967 for the nine months ended September 30, 2011 compared to $426,739 provided by operations for the same period in 2010. Cash used by operations increased due to the increase in spending related to professional fees combined with a slight increase in payroll-related expenses and the timing of payments to our outsourced manufacturer to pay down our inventory payable.
Net cash used in investing activities was $16,587 for the nine months ended September 30, 2011 compared to $16,667 for the same period in 2010. During the nine months ended September 30, 2011, we purchased a vacuum forming prototyping machine for approximately $10,000 to produce samples for our customers at our facility in Oregon. The machine has not yet been placed in service.
20
Net cash provided by financing activities was approximately $986,425 for the nine months ended September 30, 2011 compared to $424,062 used by financing activities for the same period in 2010. From February 21, 2011 to September 30, 2011, we sold shares of common stock at $2.00 per share. We raised funds through the sale of common stock to finance the growth of our operations and to cover the costs associated with becoming a public company. During the nine months ended September 30, 2010, we made repayments on Zwest debt combined with other notes payable and a related party debt in the amount of $412,062 and $15,000, respectively.
Year Ended December 31, 2010 Compared to Year Ended December 31, 2009
Cash and cash equivalents as of December 31, 2010 were $21,954 compared to $38,405 as of December 31, 2009. Cash is primarily used to fund our working capital requirements.
Net cash provided by operating activities was $462,199 for the year ended December 31, 2010 compared to $15,000 provided by used in operating activities for the year ended December 31, 2009. The change in cash flows from operations primarily is the result of the expiration of a financing arrangement with our outsourced manufacturer and the associated increase of amounts owed as trade payables.
Net cash used in investing activities was $31,588 for the year ended December 31, 2010 compared to $80,749 for the year ended December 31, 2009. The primary contribution to the outlay of cash in 2009 was the purchase of a robotic cutlery machine to prototype cutlery samples in our Oregon facility. The machine has not yet been placed in service.
Net cash used in financing activities was $447,062 for the year ended December 31, 2010 compared to cash provided by financing activities of $80,754 for the year ended December 31, 2009. The primary contribution for the change in financing cash flows for the year ended December 31, 2010 was the repayment of various notes, specifically to our outsourced manufacturer of $287,062 and two related parties for $ 255,000 .
We have experienced cumulative losses of approximately $3,375,605 from inception (December 2, 2006), through September 30, 2011, and have a stockholders' deficit of $329,542. Accordingly, our independent registered public accounting firm has expressed substantial doubt about our ability to continue as a going concern.
Through this offering, we will increase funds available for the development of our business plan and working capital. For the next 12 months, we expect cash needs of up to $6,500,000 finance equipment purchases and facility expenses to initiate manufacturing operations and to cover our ongoing working capital needs directly related to the commencement of manufacturing. If all of the securities offered hereunder are sold, we believe that the net proceeds from this offering will provide us with the capital needed for these plans.
In the event we raise less than $6,000,000 under this offering, we will implement a phased manufacturing strategy, purchasing intermediate goods from outsourced suppliers in both Asia and the U.S., while only performing finishing operations (thermoforming and injection molding) on a restricted platform in the Oregon facility. This phased manufacturing strategy would continue until such a time as we are able to borrow or otherwise finance full operations including compounding, extrusion, thermoforming and injection molding fully integrated for optimal performance. The primary impact on us of a reduced or partial operating platform would be lower margins and increased potential losses from the failure to realize the synergies of our vertical integration strategy. Under such circumstances, we would seek potential lease financing, and additional equity offerings to finance full production operations as quickly as we are able to given whatever market conditions we encounter.
As of January 17, 2012, we had $24,000 in cash. We intend to use the proceeds from this offering to cover the cash needs of our manufacturing growth strategy and associated expenses and we anticipate that the proceeds will be sufficient for such purposes. See “Use of Proceeds.”
Off-Balance Sheet Arrangements
We do not have any off-balance sheet arrangements that have or are reasonably likely to have a current or future effect on our financial condition, changes in financial condition, revenues or expenses, results of operations, liquidity, capital expenditures or capital resources that is material to investors.
Seasonality
We do not have a seasonal business cycle. Our revenues and operating results are generally derived evenly throughout the year.
Critical Accounting Policies
Our financial statements have been prepared in accordance with accounting principles generally accepted in the United States. To prepare these financial statements, we must make estimates and assumptions that affect the reported amounts of assets and liabilities. These estimates also affect our reported net sales and expenses. Judgments must also be made about the disclosure of contingent liabilities. Actual results could be significantly different from these estimates. We believe that the following discussion addresses the accounting policies that are necessary to understand and evaluate our reported financial results.
21
Revenue and Cost Recognition
We generate revenues principally by the sale of disposable products for the food service industry. Revenue is recognized when the products being sold have been shipped, title and risk of loss have been transferred, collectability is probable and pricing is fixed. Title and risk of loss is determined by the terms and conditions of each sale. The majority of our sales are to distributors in the United States. We deliver our products to customers through either shipments from our distribution center in Portland, Oregon or direct shipments from the vendor's manufacturing facility in China. For the years ended December 31, 2010 and 2009, approximately 90% and 100%, respectively, of our revenue was derived from shipments made from Portland, Oregon. For the years ended December 31, 2010 and 2009, approximately 10% and 0%, respectively, of our revenue was derived from direct shipments from China. Revenues for the direct shipments are recognized when the customers received shipments. There are no provisions with our distributors for returns without cause, and payment is due within 30 - 35 days within transfer of title. We have not had any material collections issues with any of its distributors.
Beginning in March 2011, an affiliate of Bunzl, our largest distributor, takes title to shipments in China. Under this arrangement, we recognize revenue when title and risk of loss are transferred and when shipments are delivered to the customer’s facility in China. Payments for these sales are due 30 - 35 days after transfer of title.
Accounts Receivable and Allowance for Doubtful Accounts
The allowance for doubtful accounts is based on our past experience and other factors which, in management's judgment, deserve current recognition in estimating bad debts. Such factors include growth and composition of accounts receivable, the relationship of the allowance for doubtful accounts to accounts receivable and current economic conditions. The determination of the collectability of amounts due from customer accounts requires us to make judgments regarding future events and trends. Allowance for doubtful accounts is determined based on assessing our portfolio on an individual customer and on an overall basis. This process consists of a review of historical collection experience, current aging status of the customer accounts, and the financial condition of our customers. Based on a review of these factors, we have establishes or adjusts the allowance for specific customers and the accounts receivable portfolio as a whole.
Inventory
Inventory is stated at the lower of cost or market. Cost is determined using the average cost method and it includes the costs from manufacturers, and in-bound freight. Appropriate consideration is given to obsolescence, excess quantities and other factors in evaluating the net realizable value. We determine reserves for inventory based on the historical usage of inventory, age of inventory on hand, assumptions about future demand and market conditions, and estimates about potential alternative uses, which are usually limited.
Stock-Based Compensation
We account for share-based awards issued to employees and non-employees in accordance with ASC 718. Employee share-based payment compensation is measured at the grant date, based on the fair value of the award, and is recognized as an expense over the requisite service period. Additionally, share-based awards to non-employees are expensed over the period in which the related services are rendered at their fair value.
Income Taxes
We use the liability method of accounting for income taxes. Under this method, we record deferred income taxes based on temporary differences between the financial reporting and tax bases of assets and liabilities and uses enacted tax rates and laws that we expect will be in effect when we recover those assets or settles those liabilities, as the case may be, to measure those taxes. We review deferred tax assets for a valuation allowance based upon whether it is more likely than not that the deferred tax asset will be fully realized.
We recognize the financial statement benefit of a tax position only after determining that the relevant tax authority would more likely than not sustain the position following an audit. For tax positions meeting the more-likely-than-not threshold, the amount recognized in the financial statements is the largest benefit that has a greater than 50 percent likelihood of being realized upon ultimate settlement with the relevant tax authority.
Our policy is to include interest and penalties related to unrecognized tax benefits within the income tax expense (benefit) line item in the statement of operations.
Recent Accounting Pronouncements
In January 2010, the Financial Accounting Standards Board (FASB) issued Accounting Standards Update (ASU) 2010-06, "Improving Disclosures About Fair Value Measurements" (ASU 2010-06), which amends the Fair Value Measurements and Disclosures Topic of the ASC (ASC Topic 820). Among other provisions, ASC Topic 820 establishes a fair value hierarchy that prioritizes the relative reliability of inputs used in fair value measurements. The hierarchy gives highest priority to Level 1 inputs that represent unadjusted quoted market prices in active markets for identical assets and liabilities that the reporting entity has the ability to access at the measurement date. Level 2 inputs are directly or indirectly observable inputs other than quoted prices included within Level 1. Level 3 inputs are unobservable inputs and have the lowest priority in the hierarchy. This amendment requires new disclosures on the value of, and the reason for, transfers in and out of Levels 1 and 2 of the fair value hierarchy and additional disclosures about purchases, sales, issuances and settlements within Level 3 fair value measurements. ASU 2010-06 also clarifies existing disclosure requirements on levels of disaggregation and about inputs and valuation techniques. ASU 2010-06 is effective for interim and annual reporting periods beginning after December 15, 2009, except for the requirement to provide additional disclosures regarding Level 3 measurements which is effective for interim and annual reporting periods beginning after December 15, 2010.
BUSINESS
Overview
We develop, market and sell bioplastics-based products for use primarily in the food service industry, including disposable deliware, cutlery, trash liners and shopping bags. Bioplastics are commonly compounds or blends of materials that incorporate renewable biomass sources (such as corn starch, soybeans, wheat chaff, rice hulls and sugar cane), as a substitute for conventional plastics which are often comprised entirely of petroleum derivatives. Using advanced technology that we have developed, we believe our bioplastics-based products can be sold on a cost neutral basis with conventional plastic products.
We were incorporated in December 2006 as an Oregon corporation, and reincorporated in August 2011 as a Nevada corporation.
Market Background
The conventional plastics industry, one of the largest industries in the United States, currently represents about $374 billion per year in gross sales, according to the Society of the Plastics Industry, Inc, an industry trade association, as currently reported on the group’s website for 2007, the most recent year information is available. Of this amount, disposable food packaging currently accounts for over $1 billion per month in U.S. sales, according to an August 2011 study by The Freedonia Group, Inc., an independent research company. A report published in 2009 by another research group, P&M Corporate Finance, LLC, estimates the total global plastics packaging market to be $38.2 billion in sales per year. By comparison, the bioplastics industry is small, but growing rapidly.
The University of Applied Sciences and Arts in Hanover, Germany has estimated that in 2010 global bioplastics capacity was an estimated 1.6 billion pounds, as quoted on the European Bioplastics website. The value of this capacity, as reported by Environmental and Energy Management News on February 3, 2011, was $2.7 billion.
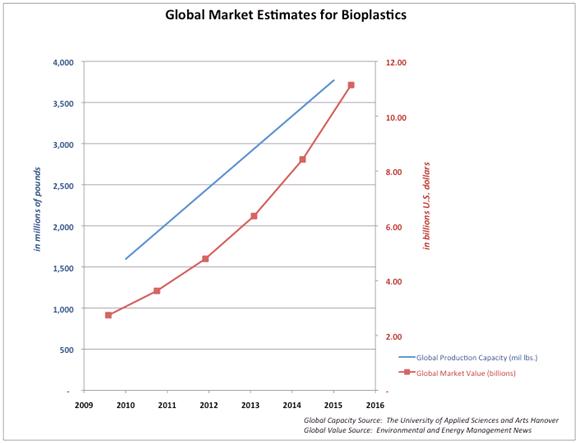
Market Trends
Rising and volatile oil prices, environmental concerns, regulatory initiatives and increasing consumer demand for products that have a smaller ecological impact are long ‐ term drivers for the adoption of bioplastics. Increased awareness about environmental hazards related to disposal and recycling of petroleum-based packaging wastes, government initiatives to minimize greenhouse gas emissions and the negative effects of events such as oil spills are driving the growth of sustainable or non petroleum-based packaging. We believe these forces are creating consumer demand for the types of products we make and sell.
23
Overview of Plastics Market
Conventional/Petroleum-Based Plastics
The production of conventional or fossil fuel-based plastics begins with crude oil and natural gas. The components of these fossil fuels are heated, resulting in their conversion into hydrocarbons such as ethylene and propylene. Further processing creates styrene, vinyl chloride, ethylene glycol, terephthalic acid and many other compounds. These molecules are then chemically bonded into chains known as polymers. The polymers and their many combinations produce the abundance of plastic forms we have today.
There are many different categories of plastics sold into the market today, but they are generally categorized into two broad groups: commodity polymers and specialty polymers. The most commonly known commodity polymers are polyethylene, polypropylene, polystyrene, polyethylene terephthalate and polyvinyl chloride.
Emerging Health Concerns Regarding Polystyrene
The U.S. Department of Health and Human Services released a report in May 2011, entitled Report on Carcinogens, Twelfth Edition , stating that: “Styrene is reasonably anticipated to be a human carcinogen based on limited evidence of carcinogenicity from studies in humans, sufficient evidence of carcinogenicity from studies in experimental animals, and supporting data on mechanisms of carcinogenesis.” The report specifically cites food containers as a source of human exposure to styrene, albeit with limited potential for exposure in common usage. The study more specifically focused on workers who are exposed to styrene in higher levels in various production environments, noting however, that both conditions pose health risks.
These concerns, coupled with concerns about polystyrene’s impact on the environment, including its inability to biodegrade and its tendency to impair marine habitats (where it is commonly ingested by wildlife including fish), is causing various municipalities to ban food containers made from the material. Seattle and Portland, Oregon are two such examples. A law that would ban expanded polystyrene for use in food containers has been proposed in the State of California.
This trend of banning toxic plastic materials in food service applications, and related market perceptions about other toxic effects of conventional plastic food containers, is fueling the movement away from petrochemicals in the food service industry for disposable containers and towards less toxic, more natural materials, such as those that we produce.
Emerging Issues Surrounding Conventional Plastics
Environmental issues around the world today are increasingly at the fore. Weather patterns and climate change are trending to extremes and more and more health-related problems are being attributed to the toxins in our atmosphere and to the products we buy and consume in our everyday lives. Across the globe, manufacturers are being subjected to negative scrutiny and pressure for contributing to the destruction of Earth’s ecology. This has resulted in additional regulation of how manufacturers produce their products. Several areas of concern relate specifically to the use of hydrocarbons and hydrocarbon-based products, including crude oil/petroleum, natural gas and products derived from these resources, including plastics.
Increased concern and public awareness on environmental issues, and the impact of petroleum-based goods on the global environment, has incentivized the business community to contemplate and develop products less dependent on hydrocarbons, or products which altogether avoid the use of hydrocarbons and similar resources in their manufacture. We believe market opportunities are created for goods perceived as environmental-friendly alternatives to some of the more conventional goods currently consumed.
Most conventional plastics used in the world today are derived from fossil feedstock, particularly petroleum and natural gas. The markets for these conventional petroleum-based plastics, chemicals and energy are among the largest in the global economy. The prolonged broad use of these petroleum-based products has raised several economic, social and environmental issues, including issues relating to plastic waste management and pollution, rising fossil fuel prices, personal health and safety, and climate change. We believe one impact of the foregoing concerns has been to engender rising levels of interest in product alternatives that are bio-based, sustainable and biodegradable.
24
Use of Bioplastics
Bioplastics are commonly compounds or blends of plastics that incorporate renewable biomass sources, such as corn starch, soybeans (hulls or oil), pea or potato starch, wheat chaff, rice hulls, sugar cane, bamboo starch, or the products of microbiological activity, such as polylactic acid. This is in contrast to traditional or conventional plastics that are commonly comprised entirely of petroleum derivatives. The bioplastics industry is a burgeoning field, and we believe the industry is steadily overcoming technological obstacles that have constrained its growth. Currently, the only biomass source we use in our products is corn starch.
Traditional plastic bags, food containers and food contact service items require large amounts of energy and raw materials (most commonly natural gas and crude oil) to produce and recycle. Oil is energy intensive to process and creates products that contribute to toxic waste problems. According to information currently posted by the U.S. Energy Information Administration on its website, in 2006, the most recent year for which data is available, 4.6% of U.S. petroleum consumption was used to make plastics.
Although fossil fuels have their origin in ancient biomass, they are not considered biomass because they contain carbon that has been “out” of the carbon cycle for a very long time. Biomass is part of the carbon cycle. Carbon from the atmosphere is converted into biological matter by photosynthesis. Using carbon created by sustainable agricultural practices has the potential to reduce the impact of the causes that are widely recognized to be accelerating global warming.
Carbon molecules in plant mass are similar to molecules in petroleum-based products. Plant mass may, therefore, be used to displace petrochemicals in the production of plastics. Specifically, polysaccharide compounds such as starches can be polymerized into plastic molecules. Products made from biomass are considered sustainable because they participate in the carbon cycle with a lower impact than conventional petroleum products which do not counterbalance the carbon they introduce into the atmosphere with offsetting biological processes, such as plant growth (which can convert carbon dioxide to oxygen, reducing the amount of carbon in the atmosphere).
Incorporating biomass into plastics can greatly reduce the petrochemicals used in their production, while shifting demand to the use of sustainable or agricultural carbon sources that are lower cost, creating an eventual cost advantage for bioplastics compared to conventional plastics.
Bioplastics can be used in the food service industry for disposable service items such as cutlery, to-go containers and sheeting used for wrapping, bagging and packaging. These products comprise the core of our Trellis Earth® product line. Today, these products sell at a premium to conventional plastics. However, with the implementation of our U.S. manufacturing strategy, we believe that we can usher in a new era in bioplastics where the products are sold on a cost-neutral basis with conventional plastic products. We call this proposition for customers, “Go Green for Free.” sm
Bioplastics Adoption Issues
The processes necessary to produce bioplastics have been widely understood and refined during the 20th century. However, so long as oil and its derivative products, including plastics, were low cost by comparison, due to the low price of crude oil historically before the 21st century, there were few commercial incentives to use bioplastics or to develop large scale manufacturing techniques and capacity needed to lower their costs through economies of scale.
In 2004, as oil prices began a climb that would see them climb from approximately $30 per barrel to over $70 per barrel in 2009, the market demand for bioplastics began to change. This trend was accelerated by the increasing awareness that global warming is a consequence of fossil fuel emissions, and that fossil fuels cannot service the planet’s energy needs indefinitely, particularly as demand across the globe increases while the population of the planet continues to climb and adopt common Western consumption patterns (i.e., automobile ownership and pre-packaged food consumption).
In addition to these issues, the bioplastics market is driven partly by laws, regulations and policies designed to encourage or mandate the increased use of sustainable alternatives to petroleum-based plastics. Numerous countries, states and localities have enacted such laws and regulations, including bans and taxes on the use of single-use plastic and non-compostable plastic bags, due to ecological and waste management concerns. For example, the cities of San Francisco, Manhattan Beach, Malibu and Palo Alto in California, all have imposed bans on single-use non-compostable plastic bags. Similar laws have been proposed or enacted in parts of Europe, China, Taiwan and India.
Providing consumers sustainable choices for reduced petroleum and petroleum-free alternatives to plastic in the food service and consumer goods packaging industry is the objective of our business plan. Driving costs down to cost parity with conventional plastics is the objective of our manufacturing strategy.
25
Growth Strategy
Our goal is to be a dominant supplier of bioplastics products to the increasing number of retailers and consumers demanding petroleum-free and compostable plastic products. We believe that with our U.S. manufacturing strategy, we can produce our bioplastics products on a cost-neutral basis as compared with conventional petroleum-based plastics products. The key elements of our growth strategy include the following:
|
•
|
Expand our manufacturing capacity . We plan to initiate operations in Oregon during the second quarter of 2012 with an extruder capable of 350 metric tons per month in output, and to build processing capacity for that amount of material to create finished goods in deliware and cutlery at full utilization by the end of the third quarter of 2012. In the first quarter of 2012, we plan to add a second extruder in Oregon for an additional 400 tons per month in capacity, and expand our manufacturing capacity for finished goods processing to accommodate that additional capacity in Oregon. In 2013, subject to obtaining additional funding of approximately $8 million, we expect to begin operation of an additional two extruders in Illinois to complement the Oregon capacity, along with the necessary equipment to process that additional 750 metric tons per month of capacity into finished goods for sale to markets on the East Coast and in the Midwest.
|
|
•
|
Increase the number of products we sell via distribution channel partners across North America . We plan to expand our deliware line into cold cups, hot cups and wrapped cups, as well as expand the materials we use to make plates, bowls, trays and clamshells to include both compostable and starch-based material alternatives using our new resins that we create with our own processing equipment in house. We also plan to increase the number of retail packaging alternatives we sell via distribution channel partners to extend our reach into more retail consumer environments, including grocery stores, office supply stores, and other mass merchandise sales outlets.
|
|
•
|
Grow our customer base and recurring business with major national brands . We presently serve about 120 stores of The Kroger Co. grocery store network with our cutlery. Their network includes over 2,400 stores. Having successfully serviced Kroger for over three years, we are well poised to increase our sales to them. Similarly, we are in the Costco Wholesale Corporation network only in California, and only in their Business Delivery subsidiary. However, after three years of successfully selling through a limited number of stores and via their website, we plan to increase our sales to them as we bring capacity on-line in the U.S. We are similarly poised with other nationally known resellers of our products who comprise a readily available path for growth of our product lines.
|
|
•
|
Develop new wholesale product lines for core food service clients . We have recently increased the number of products we sell via Bunzl to include new 100% compostable cutlery in various styles. We plan to increase the number of 100% compostable products we sell via Bunzl, and other distributors that cater to the food service industry, with new cups, plates, trays and similar products. These initiatives are integral to driving the rapid growth of the volume of our sales nationally and to extending the Trellis Earth® brand in the food service industry.
|
|
•
|
Acquire target companies that serve our vertical markets within the bioplastics industry . Many companies import and rebrand sustainable and biodegradable products from Asia which they sell regionally and into various vertical U.S. market segments. Some of these companies are being adversely impacted by increased competition, rising costs in Asia, the falling value of the U.S. dollar in China, and other market trends. We expect to acquire companies that are unable to launch their own U.S. manufacturing strategies and convert their customers to using the Trellis Earth® brand and to service them increasingly with our own U.S. manufactured products. Currently, we have no agreements or commitments for any acquisitions.
|
|
•
|
Expand into conventional (non-food) product packaging . We plan to use some of our capacity to expand into product packaging that is unrelated to our core market in the food services industry. We plan to make sustainable and compostable inserts for consumer products to help retailers and those that package their products for retail distribution reduce the environment impact of their packaging. We believe this will help us diversify our revenue streams and manage customer and distributor concentration risk.
|
We have the option of creating capacity to sell resins to other companies that injection mold or thermoform finished products. We have not developed these plans, but we are planning to dedicate our capacity of resin production to make finished goods in house. This is because demand for low cost finished bioplastics goods greatly exceeds supply in the marketplace. Therefore, we are focused on making the combined margins of resin production and final product production, selling products under our own brand rather than helping others produce bioplastics products under their brands. However, this option also remains a potential avenue for growth.
26
Product Line
Deliware
Deliware items designed and sold by us include plates, clamshells, cups, trays and other similar types of food containers. The deliware items typically comprise a bioplastics blend made of approximately 70% plasticized corn starch compounded with various base polymers and ingredients that make food containers resistant to heat and water, sanitary, capable of a long shelf life, and partially biodegradable. The bioplastic material used to create these products can be processed in modern, automated forming equipment, which is integral to the low cost characteristics of the products.
We also sell deliware under our Trellis Earth® brand that is formed from third party bioresins that are comprised of 99+% biomass, such as PLA (polylactic acid), as well as fiber-based products that contain zero petroleum. These formulations, made by third parties, generally are considered to have limited performance features. For example, PLA is heat tolerant to only about 120 ° Fahrenheit. Fiber biomass products are not waterproof. Nevertheless, we offer these products in order to cater to the needs of customers for “one stop shopping” as these products are required in some markets (e.g., Seattle) where various food service items must be certified as compostable.
We have invented a new blend of bioresin that combines the best features of our starch-based, pure biomass and fiber-based products into a new type of bioplastic resin. We have filed a provisional patent for this new blend. This innovative blend creates a new type of deliware that performs like plastic (is waterproof and food-contact safe, for instance) and has the manufacturing economies of scale of plastic, yet is entirely petroleum-free and compostable. This material could be significantly lower priced than petroleum-based plastics.
Cutlery
Trellis Earth® cutlery is made with the same blends as our deliware, but is injection molded instead of thermoformed. The cutlery bioplastic blends range from 55% biomass to 99+% biomass, depending on specific characteristics sought by customers. For example, 99% biomass cutlery is compostable using commercial composting processes available in various locations (namely, Seattle and San Francisco). Cutlery that is 55% biomass is more heat resistant and partially biodegradable, yet is lower priced than fully compostable cutlery. We sell over 30 part numbers (SKUs) of cutlery covering a range of premium, lightweight, bagged, colored and specialty cutlery items.
Film Products
We sell a wide range of shopping bags, produce bags, trash liners and similar such bioplastics “film” items, all of which are made with a blend that is part plant starch, part polymer and part bonding compounds needed to incorporate biomass into their matrix.
These bags are more easily degraded by natural processes than conventional plastic bags because the biomass in the bags breaks down through microbial action. This characteristic overcomes the objections many have with conventional plastic bags. We have custom manufactured bags for customers to resell under their own trademark, such as the BioBuilt® brand sold by Biobuilt USA, Inc. Bags currently account for less than 20% of our annual revenue and we do not plan to make these products in the U.S. We expect the percentage of our sales to reflect a diminishing importance of plastic film items, a market that is subject to wide scale competition and increasing regulation at the city-wide and state-wide levels.
Customers, Marketing and Distribution
We have multiple marketing and distribution channels. We sell through distributors, such as Bunzl Distribution USA Inc., which in turn sell directly to their customers or to other distributors, such as Sysco Corporation, which has authorized our products for national distribution. Additional distributors carrying our products include Food Services of America (FSA), West Coast Paper Company and Walter E. Nelson Co. Grocery stores and resellers that purchase our products include Costco Wholesale Corporation, Smart & Final Inc., The Kroger Co., The Trader Joe’s Company, Wegmans Food Markets, Inc., Smart Foodservice, Cash & Carry and Restaurant Depot LLC. Hospitality companies that use Trellis Earth products include Marriott International Inc., Canyon Ranch, Shilo Inns and, more recently, Westin Hotels.
In addition, more than 200 restaurants, health food stores, farm stores, food co-ops, farmer’s markets and Internet-based resellers purchase our products directly from us. We have generally sold regionally on the West Coast and through the Internet, although we have recently expanded our sales reach geographically, resulting in increased sales volume on the East Coast and in the Midwest.
We have explored new vertical market sales opportunities in customized biodegradable product packaging for certain current and potential new customers that have indicated to us their willingness to incorporate our materials in their consumer goods packaging. For example, we successfully developed a test package for one maker of nationally branded merchandise, and have had ongoing discussions with other potential new customers about expanding the use of our materials to include their product packaging. In addition, we have created sample test food containers for use by a national quick service restaurant chain and found that we can compete in the quick service restaurant industry on the basis of price, while maintaining strong margins, once our U.S. manufacturing platform is fully operational.
27
We currently have two vice presidents of sales, with three additional sales people working for them. We maintain on-going relationships with various industry brokers and from time to time have agreed to pay commissions to them for various account opportunities. We routinely ship directly from our contract manufacturing facility in China directly to customers on FOB China terms, and FOB U.S. terms, typically on either net 30 terms, for customers who are credit qualified, or with deposits and COD terms for customers who are not. In the last two years, we have experienced very few quality control problems, very few returns and a large amount of our business is in the form of repeat orders.
Bunzl Distribution and other Customers
Our largest customer is Bunzl Distribution USA, Inc. (Bunzl), one of the largest distributors of paper and plastic food service items in the United States, and its affiliates. Since mid-2007, we have sold our products to Bunzl pursuant to purchase orders; we do not have a long-term contract or any oral contract with Bunzl. Our relationship with Bunzl provides various advantages including reducing the amount of inventory we must finance and store in our facilities, providing us reach to new customers via Bunzl’s sales force, and handling logistics in delivering our products to markets. We routinely meet with Bunzl’s regional managers, as well as its U.S. corporate executives, at its U.S. headquarters in St. Louis, to discuss new market opportunities, new sales tactics and new promotional programs. We are considered a “preferred vendor” by Bunzl.
Approximately 59%, 64% and 71% of our revenues for the nine months ended September 30, 2011 and the years ended December 31, 2010 and 2009, respectively, resulted from sales through Bunzl and its affiliates to their customers and other distributors. Although we do not have a long-term written contract or any oral contract with Bunzl, we believe our relationship with Bunzl is strong. Given the competitive nature of paper and plastics distribution and the large number of customers (such as grocery store chains) that purchase directly from manufacturing companies, we believe that we would be able to reach many of our end-customers without Bunzl, should the need arise, but this could increase our costs. Revenue from Bunzl is expected to continue to decline as a percentage of our total revenues as we expand our marketing and distribution efforts.
We sell to Bunzl through both its redistribution division (known as Reliable Redistribution Resource, or R3), its importing division in China, via its U.S. headquarters, and various regional offices and buyers of Bunzl’s that we service directly. We receive purchase orders from Bunzl for goods that we manufacture to order or that we sell to it from our own inventory at our Oregon headquarters. Bunzl in turn sells our products to other distributors (such as Sysco Corporation) or directly to end-users (such as The Kroger Co.). We expect to increase our sales on an absolute dollar basis through Bunzl as we initiate U.S. manufacturing, but we expect on a percentage basis that Bunzl will be responsible for a lower portion of our total sales given strong demand and higher margins from other customers that wish to purchase directly from us and to whom we plan to allocate U.S. manufacturing capacity.
In August 2011, we became authorized by Unified Grocers, a collective of grocery stores comprised of 3,000 store locations, primarily in the western United States, to have our products sold by them. This relationship, and similar relationships with other distributors, will give us increased access to multiple channels to market our products, potentially lessening our dependence on Bunzl.
Approximately 19% and 10% of our revenues for the nine months ended September 30, 2011 and the year ended December 31, 2010, respectively, resulted from sales through United Management Group (UMG). Located in Denver, UMG distributes our products to school districts and public organizations across the country. UMG has been our distributor to the Denver Public School District and several smaller school districts across the West Coast.
Except for Bunzl and United Management, no other single entity has accounted for more than 10% of our sales during the nine months ended September 30, 2011 and the years ended December 31, 2010 and 2009 .
Current Production
We currently outsource the production of substantially all of our products to Zhejiang Wafa Ecosystem Science & Technology Co. Ltd. (known as Zwest) in the People’s Republic of China. Zwest’s factory uses multiple formulations and resins to produce the Trellis Earth® products using techniques and processes that we have refined over the last five years. Approximately 99% of our total purchases of manufactured products and supplies, or $1,159,897, $1,554,389 and $1,371,356 for the nine months ended September 30, 2011 and the years ended December 31, 2010 and 2009, respectively, were from Zwest.
Zwest does not have any ownership interest in our products. The formulations in use by Zwest are either based on technology and resins provided by third-party sources (i.e., makers of PLA, a compostable resin that Zwest purchases from PLA factories for forming into finished goods bearing the Trellis Earth trademark), or are techniques that were developed initially by publicly-funded efforts of the Chinese government. These efforts resulted in processes and techniques that are in the public domain, used in multiple factories in China. We provide product specifications.
We have purchased our products from Zwest since 2007. We do not have a written or oral contract with Zwest.
28
Regardless of our U.S. manufacturing plans, we expect that business with Zwest will continue to grow. We are aware of five other factories in Asia that are currently capable of producing substantially the same products as those produced for us by Zwest, so that, if our business with Zwest does not continue to grow as anticipated, we could potentially seek to have our products produced by these other factories. However, there is no assurance we could have our products produced at these factories, and having to do so, without reasonable lead time, could interrupt supplies and lead to increased costs and competitive disadvantages.
We have granted Zwest a license to produce the products bearing our trademarks. The Zwest factory is not permitted to use the molds or trademarked items for sale to any other customers.
Intellectual Property and Proprietary Technology
We have developed two new methods for production of formulations featuring our proprietary bioplastics technology, building on our understanding of what customer features are desirable, the chemistry to realize those objectives in new materials, and our ability to harness new equipment that is highly automated. This equipment will be built under contract specifically for us to implement our proprietary blending formulations and unique manufacturing processes.
One of these new formulations is a process to make a blend that is similar to that in use by Zwest in China, which is re-conceptualized for adoption to a new method of production with an improved combination of ingredients. This new method improves the qualities of the “hybrid” resin that is currently made by Zwest, modifying the formulation to lower costs and improve the performance of final products made with this material. We have submitted a process patent application for this improved method of bioplastics production (U.S. Patent Application No. 13/179,049, filed July 8, 2011). This patent application, for the production of “High Biomass Content Thermoplastic Matrix for Food Contact Service Items,” details the new method and the new ingredients to be used in the bioplastics composition. This patent application is currently pending approval, as to which there can be no assurance.
The primary characteristics of this resin formulation are as follows:
|
·
|
70% biomass/starch base
|
|
·
|
waterproof surface
|
|
·
|
rigid structure
|
|
·
|
able to withstand over 240 degrees Fahrenheit usage
|
|
·
|
microwave safe
|
|
·
|
extrudable into rollstock
|
|
·
|
able to be thermoformed on high speed equipment
|
|
·
|
injection moldable
|
|
·
|
long term shelf life
|
|
·
|
imperviousness to mold
|
|
·
|
food contact safe
|
|
·
|
opaque beige or black formulations
|
|
·
|
formable by high speed compounding equipment
|
This patent-pending process will cover the method used for a majority of the output of our U.S. operations in 2012 until we introduce our “next generation” technology, which is designed to complement this invention.
We have filed a provisional patent application for the U.S. implementation of our “next generation” technology (U.S. Patent Application No. 61/505,786, filed July 8, 2011). This patent covers a method for the production of “Ultra High Biomass Content Thermoplastic Matrix for Food Contact Service Items.” This method is designed for high volume production in our planned U.S. facilities in 2012. This method is focused on the deliware segment of our product line, as well as applications in conventional product (non-food contact) packaging. This patent application is currently pending approval, as to which there can be no assurance. The uniqueness of this second patent application is the removal of all petrochemicals from the blending and composition of the bioplastics resin. Whereas bioplastics are commonly a “hybrid” blend of conventional polymers and biomass, along with the agents necessary to cross link them and give them various qualities, this material accomplishes the same result without any petrochemicals or petroleum-based carbon sources, a feature we believe is different than other bioplastics found in today’s market.
Specifically, this new material is focused on re-purposing agricultural by-products, such as corn stover, wheat chaff, soybean hulls, rice hulls and similar low-cost ingredients otherwise used as livestock feed, and building those materials into a bioplastic matrix that is extrudable into rollstock, formable by high-speed thermoforming equipment, compostable, food contact safe, waterproof, mold resistant, heat tolerant and significantly lower cost than conventional plastic or other compostable plastics in the marketplace today.
This “next generation” material is currently in the development phase, although we expect to perfect our provisional patent application by the end of 2011, and to develop new patents around this type of material and new methods for producing it commercially in high volume.
We have negotiated with an equipment manufacturing company to build the equipment that will be required by us to produce this material in high volume. We expect to bring this resin to market in production levels in the third quarter of 2012.
29
We intend to build a patent portfolio of at least two additional patent applications per year as we develop new materials and processes for manufacturing bioplastics. We plan to use our patents to create barriers to entry to competitors. We plan to seek design patents in the future for our finished, trademarked product designs, along with any accompanying trade and service marks used to brand the products and materials in the marketplace.
We obtained the registered trademark “Trellis Earth” for the product categories of disposable food service items, disposable cutlery, and various films and bags. We have filed with the USPTO for the service marks “Go Green for Free” and “Go Green for Less” for the product categories of disposable food service items, disposable cutlery, and various film or bags categories. We rely on a combination of patents, trademark laws, trade secret laws of general applicability, employee confidentiality and invention assignment provisions and other contractual provisions to protect our proprietary rights. However, these measures afford only limited protection. For example, as discussed above, we currently have two patent applications pending with the U.S. Patent and Trademark Office, and if these applications are not approved, or if we otherwise fail to adequately protect our proprietary rights, our competitive prospects will be adversely affected. Despite our efforts to protect our proprietary rights, unauthorized parties may attempt to copy aspects of our products or obtain and use trade secrets or other information that we regard as proprietary. There can be no assurance that our technology will remain proprietary.
Competitive Advantages
We believe that, with the initiation of our U.S. manufacturing facility in Oregon, we will be able to promote a pricing strategy called “Go Green for Free.” This strategy means that commercial users of conventional plastic packaging can convert to Trellis Earth® products and pay no more than they currently pay, being charged no premium for bioplastics.
This strategy is built upon two principles: that bioplastics resins can be produced by us to create a net savings when compared to the costs of alternative pure-petrochemical plastic feedstocks, used by our competition, and that we can produce finished goods cost effectively in a highly automated production environment.
Raw Materials Advantage
We compete in the market against many types of food service items made from many types of materials. One of the most common pure-petroleum derived materials we compete against is polypropylene. It is possible to illustrate the advantage we create by blending biomass materials into bioplastics compounds by comparing our production cost structure to an analogous cost structure if we were to make our materials from pure polypropylene resin.
For the basis of comparison, the following costs are assumed (costs can vary widely in the market based on supplier, term of contract, market conditions and other variables, so this illustration is to show a relative cost advantage based on a hypothetical approximation of current material costs, which we believe are reasonable):
|
Polypropylene
|
Trellis Earth Bioplastic
|
|||||||
|
Cost of Raw Materials
|
||||||||
|
(per metric ton)
|
$
|
2,000 1
|
$
|
1,199 2
|
||||
|
Cost of Producing Intermediate Materials
|
$
|
0 3
|
$
|
427 4
|
||||
|
(per metric ton)
|
||||||||
|
Total Intermediate Material Cost
|
$
|
2,000
|
$
|
1,626
|
||||
|
Percentage Cost Advantage of Trellis Bioplastic over Polypropylene
|
19
|
%
|
||||||
1) Polypropylene prices are for contract volume purchases as quoted on ThePlasticsExchange.com for an approximate average cost per metric ton during August and September 2011.
2) Cost per metric ton of landed material prices based on supplier quotations during August and September 2011.
3) Polypropylene comes in a ready-to-use state and requires no additional cost of production.
4) Production costs for producing biopolastics to create an equivalent intermediate material ready for finishing operations.
Finishing Costs
As a manufacturing company, we will perform two primary finishing operations: thermoforming and injection molding. For purposes of illustration, the chart below shows a comparison of costs and markups for finishing costs (assuming thermoforming and injection-molding costs are comparable) for us, and a hypothetical polypropylene-based competitor with an identical finishing operations cost structure, each making a 30% gross margin.
|
All dollar figures per metric ton
|
Polypropylene
|
Trellis Earth Bioplastic
|
||||||
|
Cost of Materials
|
$
|
2,000
|
$
|
1,626
|
||||
|
Cost of Production—Finished Goods
|
$
|
279 1
|
$
|
279 1
|
||||
|
(labor, depreciation, packaging, overhead, etc. )
|
||||||||
|
Total Product Cost per Ton
|
$
|
2,279
|
$
|
1,905
|
||||
|
30% Margin
|
$
|
977
|
$
|
816
|
||||
|
Total Selling Price
|
$
|
3,256
|
$
|
2,721
|
||||
|
Additional Margin Available to Us if Sold at Same Price as Polypropylene Products
|
$
|
534
|
||||||
|
Our Total Gross Margin if Sold Same Price as Polypropylene
|
$
|
1,351
|
||||||
|
Our Gross Margin Percentage if Sold Same Price as Polypropylene
|
41
|
%
|
||||||
1) Creating finished goods from intermediate materials requires equipment, labor, operating costs and other manufacturing expenses including packaging of finished goods. These are equivalent whether one is processing polypropylene or our bioplastic material. The amounts shown are common industry estimates for high volume thermoforming and injection molding operations such as those planned for our manufacturing operations.
30
These potential advantages, if realized in our actual production and market pricing conditions, upon completion of our U.S. manufacturing platform, form the basis for our planned advertising slogan, “Go Green for Free” SM . Actual results will depend on future prices, our ability to implement a cost structure as described above, and other conditions that will affect results as described in "Risk Factors" above.
Manufacturing Strategy
We are in the process of building our own factory in Oregon for operation in mid-2012, and, subject to obtaining additional funding of approximately $8 million, we plan to add a second factory in Illinois in 2013. In Oregon, we have identified a location near our current headquarters owned by our current landlord and are in negotiations with the landlord with respect to a lease. In Illinois, we have identified potential locations but have not begun negotiations with any owners with respect to any leases. We have not yet entered into any leases or other agreements for such facilities in Oregon or Illinois.
Initiating U.S. production in Oregon will require approximately $5.0 million in capital expenditures for manufacturing equipment.
The capital expenditures per facility break down as follows:
|
$2.5 million
|
|
|
Thermoforming Machines Per Facility
|
$1.1 million
|
|
Injection Molding Machines Per Facility
|
$0.9 million
|
|
Miscellaneous (packaging, etc) Equipment Per Facility
|
$0. 5 million
|
|
Total
|
$ 5. 0 million
|
The resulting capacity by type of equipment is estimated to be as follows:
|
Compounding and Extrusion Capacity Per Facility
|
360 metric tons per month
|
|
|
Thermoforming Capacity Per Facility
|
12 million units per month
|
|
|
Injection Molding Capacity Per Facility
|
21 million units per month
|
The facilities necessary to house this equipment are estimated to require approximately 100,000 square feet for each facility. We plan to lease additional space to complement our existing Oregon facility and to lease a comparable facility in Illinois. Each facility will require an estimated $300,000 to install subsystems needed for utility services including compressed air, chilled water and electricity.
We plan to order equipment for installation in the third quarter of 2012 in Oregon.
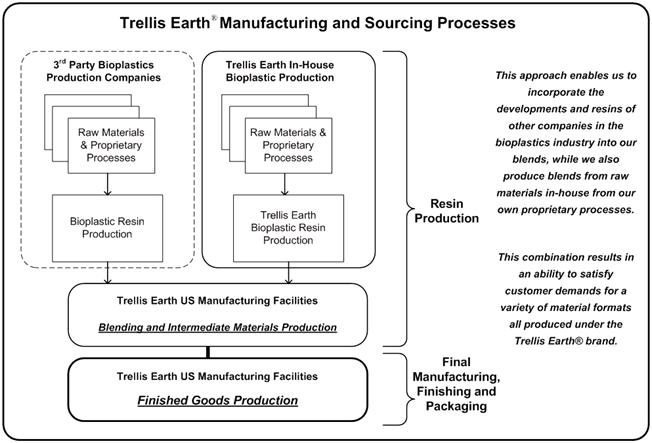
31
Third-Party Resins
As illustrated above, we will produce our own patent-pending bioplastics resins, but will also source third-party bioplastics resins that we will blend and process into finished goods under our own brand name. For example, we expect to purchase PLA (polylactic acid), a bioplastics resin, and use that resin to create cutlery in the United States, similar to the PLA cutlery we outsource under contract today. Similarly, we expect to source PBS (polybutylenes succinate) resin, and to blend it with PLA resin and other ingredients to create heat tolerant, fully compostable versions of our cutlery and deliware products for those customers seeking a premium product at a premium price. PBS and PLA resins are readily available for purchase by us.
The ability to harness advances made by other bioplastics innovators helps ensure that our product line will continue to be able to cater to the widest range of buyers in the commercial food service industry, and provide “one stop shopping” for buyers faced with the requirement in some U.S. markets (for example, Seattle and San Francisco) where certain food service or disposable plastic items are mandated by law to be certified as compostable.
Research and Product Development
During the nine months ended September 30, 2011, we spent approximately $45,600 on research and development activities. During the years ended December 31, 2010 and 2009, we spent approximately $42,300 and $38,500, respectively, on research and development activities.
As of January 17, 2012 , our R&D department consists of one employee, Dr. Yang Hu, and one assistant for him who is a contractor. Our Vice President of Manufacturing, Craig Mittelstaed, is also experienced in research and development and is expected to play an increasingly important role in collaborating on our R&D efforts.
We are in the process of equipping an R&D laboratory with various test and development equipment at our headquarters in Oregon. Over the last four years, we worked with various outside contractors and outside universities and specialists on an ad-hoc basis to conduct tests, experiment with new materials and become educated about various trends and developments in the industry. This was done primarily by our Chief Executive Officer, William Collins, as a function of his responsibilities both during his tenure as Chief Technology Officer in 2009, and during his time as Chief Executive Officer before and after that time. We tested various materials and processing combinations in various contract factories, test facilities, universities and other organizations that made their capabilities and non-secret information available to us as industry professionals on a work-for-hire or experimental basis. As we continue to develop our own R&D capabilities in-house, we expect to minimize our use of outside contract partners for the testing and development of our advances in bioplastics.
Government Regulation
We are subject to the regulations of the U.S. Food and Drug Administration, or FDA, as well as the Federal Trade Commission, or FTC.
FDA regulations cover the composition of our materials that come in contact with food. The products we sell use only materials that are explicitly allowed by the FDA or deemed by the FDA to be food contact safe. In addition, the products we sell are produced in accordance with FDA standards for cleanliness, isolation of potential contaminants, and similar conditions.
The FTC regulates product marketing claims, and has shown an increasing interest in regulating “green” claims. We comply with all FTC guidelines for the use of the term “compostable,” only using the term where we have adequate scientific supporting test data to show conformance with the ASTM D-6400 standard, a standard recognized throughout the packaging industry as the defining standard for “compostable plastics.” We further comply with all other FTC guidelines for disclosures regarding our product features, as described by the FTC’s “Guides for the Use of Environmental Marketing Claims,” published on October 4, 2010.
We typically promote the products we sell as “sustainable” because our products replace petrochemicals, which are in limited supply, and which rely on carbon created from ancient photosynthesis processes, with newly grown biomass/carbon sources, which are in nearly unlimited supply. The FTC does not presently regulate the use of the term “sustainable.”
We comply with all known state regulations regarding the use of the terms “biodegradable” and “compostable,” including California state law which is generally considered the most stringent.
We could be subject to increasing regulation of our marketing claims, or to regulation by the FDA of bioplastics. However bioplastics are generally compromised of inert food and food by-products, substances that are inherently less toxic than petrochemicals. Petrochemicals commonly contain carcinogens, heavy metals, and other toxins. Biomass and food byproducts (for example, corn stover, sugar cane bagasse, wheat chaff, dried distillers grains and solids) are suitable for animal consumption and are conducive to life sustaining processes, unlike crude oil, from which plastics are commonly derived, which cannot normally be ingested or consumed by plants or animals without harmful effects. Therefore, bioplastics are generally a healthier alternative material for food contact materials compared to conventional petrochemical materials (such as polystyrene), and less likely to be regulated for toxicity.
Tariffs
Bioplastics are subject to tariffs covering the importation of plastic food service and film items. As a result, we pay a duty on all items that we import. This duty currently represents about a 5% mark-up to factory invoice. There has been no indication that the tariffs for imported plastics items are under review or likely to change. As we create capacity for U.S. manufacturing, we expect a reduction of costs associated with avoiding tariffs, as well as customs inspection fees, oceanic freight costs and similar importing expenses.
32
Competition
Upon the implementation of our planned U.S. manufacturing strategy, we will be a full bioplastics company and a producer of finished food service disposable products. As such, we will compete with three primary types of competitors:
Importers and Rebranders of Original Equipment Manufacturer Bioplastic Products
Today Eco-Products, Inc. is a company that resells biodegradable, sustainable and compostable deliware, cutlery and bags, similar to those sold by us. Their products are distributed by Bunzl USA and Sysco, similar to us, yet they command a larger share of the market. According to Inc.com rankings and statistics, they had 2010 revenue of about $62 million, and have grown 532% over the last three years. Similarly, Excellent Packaging and Supply, Inc. is a provider of products similar to us, competing with us in various markets, including San Francisco, where we also compete with another company, World Centric, Inc.
To the best of our knowledge, these companies import most of their products from Asia and rebrand these products under their own trademarks and sell both via distributors and directly to end users, as we do.
We plan to compete against this type of competitor primarily by leveraging the benefits of our U.S. manufacturing strategy, our intellectual property, including our pending patents, and our marketing. We believe that as a vertically integrated company we can compete on price, quality, product features and values associated with branding our goods “Made In USA,” while we simultaneously insulate ourselves from the risks associated with importing, primarily from Asia, including a falling dollar, surging importing costs, duties, quality control and labor shortages.
Bioplastics Resin Companies
Small public companies, such as Cereplast, Inc. and Cardia Bioplastics Limited, which specialize in producing bioplastics compounds, sell their resins to companies that make products that compete with ours. For example, Cereplast sells their resin to Genpak LLC, which makes a line of deliware products under the Harvest® Starch trademark that compete with our products. Similarly, E. I. du Pont de Nemours and Company, NatureWorks LLC and BASF SE and other chemical companies make biopolymers that are used by others to make products that compete with us.
We are able to compete against these bioplastics and chemical companies because we make finished goods, not just intermediate resins that are purchased by other manufacturing companies. This lowers the cost basis of our products, and gives us a consolidated supply chain, while it also provides us multiple gross margin streams. One such gross margin stream is from the production of our bioplastics feedstocks in-house, and the other is from our finishing and forming operations. Our strategy is to blend the gross margins from these two areas of expertise to create final, finished goods at a price that eliminates the cost premium for bioplastics in finished goods, a pricing strategy that we believe is unique in the industry and a competitive advantage that we will be able to sustain into the foreseeable future.
Conventional Packaging Companies
We compete with large paper and plastic products companies, such as Berry Plastics Corporation, Solo Cup Company and Packaging Corporation of America.
These established plastics packaging companies are generally reliant on petroleum feedstocks, which directly correlate to the price of crude oil and natural gas. Some of these types of companies derive over 90% of their product revenue from materials that are based on petrochemicals that are subject to increasing scarcity, increased regulation and taxation, and increased sensitivity from consumers about their environmental impact.
The incumbent companies, in order to sell bioplastics, have an inherent conflict, namely, that as they promote bioplastics as an ecological alternative to conventional plastics products, they are by definition selling against their primary product lines and revenue sources.
To overcome this conflict, large plastic packaging companies have positioned bioplastics as a more costly alternative to conventional packaging. We believe they commonly pass on the cost increases of their petroleum feedstocks in the form of price increases, much the same way gasoline companies pass along price increases in oil as increases in gas prices at the pump. This has led to considerable inflation in plastic product packaging costs, which creates increasing incentives for the use of bioplastics, a condition that directly benefits us.
We do not have the conflict of trying to maintain market share of pure petroleum-based plastics and can freely sell against products made of polystyrene, polypropylene and similar plastics, without “cannibalizing” or selling against our own products.
Furthermore, given that the majority of our ingredients are derived from sustainable agriculture, which creates products that are under fewer regulatory, environmental and scarcity pressures, we are able to sell against petroleum-based competitors relatively immune from environmental and regulatory considerations, and the negative publicity surrounding the environmental impacts of petroleum and plastics companies in general.
Employees
As of January 17, 2012, we had 16 employees, of whom 3 were in engineering, 6 in sales and marketing, 2 in customer support and logistics, and 5 in general and administrative. Of these employees, 14 persons are full time, and we rely on 10 subcontractors for additional services. We consider our employee relations to be good. None of our employees is covered by a collective bargaining agreement.
Legal Proceedings
We are not a party to any pending or threatened legal proceedings.
Facilities
Our principal executive offices and headquarters are located at 9125 S.W. Ridder Road, Suite D, Wilsonville, Oregon, where we lease approximately 18,003 square feet of office and warehouse space. We pay monthly base rent of $7,616 (which amount will increase over the term of the lease to $8,572), and estimated monthly operating expenses of $2,970, under a 52-month lease which expires in September 2015 (with an option to extend for an additional period of four years, and to increase the leased space to 33,000 square feet on a right of first refusal basis).
33
MANAGEMENT
Officers and Directors
Our executive officers and directors, and their ages, positions and offices with us, are as follows:
|
Name
|
Age
|
Title
|
||
|
William Collins
|
50
|
Chairman of the Board, Chief Executive Officer and President
|
||
|
Michael Senzaki
|
33
|
Chief Operating Officer, Chief Financial Officer and Director
|
||
|
John P. Metcalf
|
61
|
Director and Chairman of the Audit, Compensation and Nominating Committees
|
||
|
Neil J. Nelson
|
53
|
Director
|
||
|
Timothy Hawkins
|
45
|
Director
|
William Collins has served as our Chairman, President and Chief Executive Officer since July 2010, and also served as our Chairman, President and Chief Executive Officer from December 2006 to October 2009. From October 2009 to July 2010, Mr. Collins served as our Chief Technology Officer and Chairman. Mr. Collins received a B.S. degree from the University of Minnesota. Mr. Collins’ experience as our founder and officer qualifies him to serve as our director.
Michael Senzaki has served as our Chief Operating Officer and Chief Financial Officer since March 2011, and has also served as a director since April 2011. Prior to joining our company, from April 2010 to March 2011, Mr. Senzaki was the Managing Partner-Asia Pacific of Albeck Financial Services, a financial consulting firm specializing in U.S. GAAP and SEC reporting for smaller public companies. From September 2005 to April 2010, Mr. Senzaki was the Managing Partner of MJS Consulting Group, a financial consulting firm specializing in SEC reporting, U.S. GAAP compliance and Sarbanes-Oxley Act preparation. Mr. Senzaki began his career in public accounting with Arthur Andersen (September 2000 to June 2002) and Ernst & Young (June 2002 to September 2006). Mr. Senzaki received a B.S. degree from the University of Redlands. Mr. Senzaki’s accounting and financial knowledge and experience qualify him to serve as our director.
John P. Metcalf has served as a director and as our Chairman of the Audit Committee, the Compensation Committee, and the Nominating Committee since August 2011. Since December 2010, Mr. Metcalf has been Chief Operating Officer and Board Advisor for GlanceID, a start-up company developing a new mobile smart phone application for business professionals. From November 2002 until July 2010, Mr. Metcalf was a CFO Partner with Tatum LLC, the largest executive services and consulting firm in the United States. Mr. Metcalf also served on the board of directors and was Chairman of the Audit Committee for Energy Connect Group, Inc., a demand response services company for the electric power industry, from July 2007 until the company was acquired by Johnson Controls, Inc. in July 2011. Mr. Metcalf has 18 years experience as a Chief Financial Officer for both public and privately held companies, most recently at Electro Scientific Industries (ESI) (from 2006 to 2007). Prior to working at ESI, Mr. Metcalf served as Chief Financial Officer for Siltronic, a supplier in the wafer industry (from 2004 to 2006), WaferTech, a semiconductor integrated circuit foundry company (from 1997 to 2000), Siltec Corporation, a silicon manufacturer (from 1992 to 1997) and OKI Semiconductor (from 1987 to 1991). Mr. Metcalf began his career at Advanced Micro Devices where he held a number of increasingly responsible financial management positions, from 1976 to 1987, including Director & Controller of North American Operations. Mr. Metcalf also currently serves on the Board of Directors and is Chairman of the Audit Committee for ParkerVision, an RF (radio frequency) solutions provider to the semiconductor industry. Mr. Metcalf received a B.S. degree in Business/Marketing and an M.B.A. in Finance from the University of California at Berkeley. Mr. Metcalf’s in-depth understanding of generally accepted accounting principles, financial statements and SEC reporting requirements qualify him to serve as our director.
Neil J. Nelson has served as a director since August 2011. Since July 2003, Mr. Nelson has been the President and Chief Executive Officer of Siltronic Corp. He previously served as Vice President of Operations of Siltronic from 2000 to 2003. From 1987 to 2000, he served in various positions with Mitsubishi Silicon America. He serves on the boards of directors for Siltronic Corp., Oregon Business Council and Associated Oregon Industries, as well as Portland General Electric, where he is a member of the Audit Committee and the Compensation and Human Resources Committee. Mr. Nelson received a B.S. degree in Chemical Engineering from Brigham Young University. Mr. Nelson’s qualifications to serve on our board include his experience in overseeing company-wide and divisional operations for Siltronic Corp. and divisional operations for Mitsubishi Silicon America, his experience in overseeing manufacturing operations at the department, division and company-wide levels, his experience in risk oversight and environmental issues, and his experience in developing and overseeing compensation programs for Siltronic Corp. and Mitsubishi Silicon America.
Timothy Hawkins has served as a director since October 2011. Mr. Hawkins has been President and Chief Executive Officer of Ivey Performance Marketing in Milwaukie, Oregon, a marketing services company, since September 2008. From July 2007 to September 2008, Mr. Hawkins was self-employed as an independent marketing consultant. From January 2004 to July 2007, Mr. Hawkins was President and Chief Marketing Officer of Nautilus Fitness in Vancouver, Washington, where he assisted in leading the turnaround of the largest branded organization in the fitness industry. Prior to joining Nautilus, from January 2002 to January 2004, Mr. Hawkins was Vice President of Sales for Levi Strauss and Company in San Francisco, where he was responsible for developing and implementing rigorous selling and planning processes. From June 1997 to December 2001, Mr. Hawkins held multiple sales and marketing positions at The Coca-Cola Company in Atlanta. From May 1994 to January 1997, Mr. Hawkins was Vice President of Advertising and Promotion for Famous Footwear. Mr. Hawkins began his career in multiple sales and marketing roles with Rayovac Corp., a battery and flashlight manufacturer, from 1990 to April 1994. Mr. Hawkins received a B.A. degree from the University of Wisconsin – Whitewater. Mr. Hawkins’ extensive marketing and executive experience qualify him to serve as our director.
34
Our directors are elected at our annual meeting of stockholders and serve for one year or until successors are elected and qualify. Our board of directors elects our officers, and their terms of office are at the discretion of the board. There are no family relationships among our directors and officers. We are in the process of identifying additional executive officers and directors.
Committees of the Board of Directors
Our board of directors has an audit committee, a compensation committee and a nominating committee, each of which has the composition and responsibilities described below.
Audit Committee. Our audit committee is comprised of John P. Metcalf, as Chairman, Neil J. Nelson and Timothy Hawkins. Mr. Metcalf qualifies as an audit committee financial expert. All of the members of the audit committee qualify as independent under Nasdaq Marketplace Rules. Our audit committee is authorized to:
|
·
|
appoint, compensate, and oversee the work of any registered public accounting firm employed by us;
|
|
·
|
resolve any disagreements between management and the auditor regarding financial reporting;
|
|
·
|
pre-approve all auditing and non-audit services;
|
|
·
|
retain independent counsel, accountants, or others to advise the audit committee or assist in the conduct of an investigation;
|
|
·
|
seek any information it requires from employees—all of whom are directed to cooperate with the audit committee’s requests—or external parties;
|
|
·
|
meet with our officers, external auditors, or outside counsel, as necessary; and
|
|
·
|
oversee that management has established and maintained processes to assure our compliance with all applicable laws, regulations and corporate policy.
|
Compensation Committee. Our compensation committee is comprised of John P. Metcalf, as Chairman, and Neil J. Nelson and is authorized to:
|
·
|
discharge the responsibilities of the board of directors relating to compensation of the our directors, executive officers and key employees;
|
|
·
|
assist the board of directors in establishing appropriate incentive compensation and equity-based plans and to administer such plans;
|
|
·
|
oversee the annual process of evaluation of the performance of our management; and
|
|
·
|
perform such other duties and responsibilities as enumerated in and consistent with compensation committee’s charter.
|
Nominating Committee. Our nominating committee is comprised of John P. Metcalf, as Chairman, and Neil J. Nelson and is authorized to:
|
•
|
assist the board of directors by identifying qualified candidates for director nominees, and to recommend to the board of directors the director nominees for the next annual meeting of shareholders;
|
|
•
|
lead the board of directors in its annual review of its performance;
|
|
•
|
recommend to the board director nominees for each committee of the board of directors; and
|
|
•
|
develop and recommend to the board of directors corporate governance guidelines applicable to us.
|
Code of Conduct and Ethics
Our board of directors has adopted a Code of Conduct and Ethics. The Code of Conduct and Ethics applies to all of our employees, officers (including our principal executive officer, principal financial officer, principal accounting officer or controller, or persons performing similar functions), agents and representatives, including directors and consultants. Upon the completion of this offering, the full text of our Code of Conduct and Ethics will be posted on our website at www.trellisearth.com. We intend to disclose future amendments to certain provisions of our Code of Conduct and Ethics, or waivers of such provisions, applicable to any principal executive officer, principal financial officer, principal accounting officer or controller, or persons performing similar functions or our directors on our website identified above. The inclusion of our website address in this prospectus does not include or incorporate by reference the information on our website into this prospectus.
Board Leadership Structure and Role in Risk Oversight
We have not adopted a formal policy on whether the chairman and chief executive officer positions should be separate or combined. Due to the small size and early stage of our company, we believe it is currently most effective to have the chairman and chief executive officer positions combined.
Our audit committee is primarily responsible for overseeing our risk management processes. The audit committee receives and reviews periodic reports from management, auditors, legal counsel, and others, as considered appropriate regarding our assessment of risks. In addition, the audit committee reports regularly to the full board of directors, which also considers our risk profile. The audit committee and the full board of directors focus on the most significant risks facing us and our general risk management strategy, and also ensure that risks undertaken by us are consistent with the board’s appetite for risk. While the audit committee and the full board oversee our risk management, management is responsible for day-to-day risk management processes. We believe this division of responsibilities is the most effective approach for addressing the risks facing our company and that our board leadership structure supports this approach.
Director Independence
John P. Metcalf, Neil J. Nelson and Timothy Hawkins are considered independent, as that term is defined under Nasdaq Marketplace Rules.
Summary Compensation Table
The following table sets forth information regarding compensation paid to our principal executive officer and principal financial officer for the years ended December 31, 2011 and 2010. No other executive officer had total compensation for the years ended December 31, 2011 and December 31, 2010 that exceeded $100,000
|
Name
|
Year
|
Salary
|
Bonus
|
Stock
Awards ($)
|
Option
Awards ($)
|
Other
|
Total
|
|||||||||||||||||||
|
William Collins
|
2011
|
$
|
115,385
|
-
|
-
|
$41,122 (2)
|
-
|
$
|
156,507
|
|||||||||||||||||
|
President and CEO
|
2010
|
$98,000
|
-
|
-
|
-
|
-
|
$
|
98,000
|
||||||||||||||||||
|
Michael Senzaki
|
2011
|
$113,506
|
$200,000 (1)
|
$41,122 (2)
|
$
|
354,628
|
||||||||||||||||||||
|
Chief Financial Officer
|
2010
|
n/a
|
n/a
|
|||||||||||||||||||||||
(1) Represents award of 100,000 shares of common stock in September 2011.
(2) Represents vested portion (20,833 options) of grant of 250,000 options in September 2011.
Employment Agreements
We entered into an employment agreement with William Collins, dated as of September 1, 2011, which was amended and restated on January 10, 2012. Pursuant to the employment agreement (as amended and restated), effective upon completion of this offering or the raising of $3 million, whichever comes first, Mr. Collins will continue to serve as our President and Chief Executive Officer, for a term of three years (subject to earlier termination as provided therein), which term shall automatically renew for successive two year terms unless either party give written notice of intent not to renew not less than 120 or more than 365 days prior to such renewal. We pay Mr. Collins a base salary of $200,000, subject to annual increases in the discretion of our board of directors. We will pay Mr. Collins a $75,000 bonus upon our receipt of $3 million in this offering, and an additional $75,000 for $6 million total received in this offering. We will pay Mr. Collins an Annual Management by Objective Bonus of up to 50% of Mr. Collins’ base salary for the following calendar year, to be determined by December 15 of each year, on terms to be determined by the Compensation Committee and approved by the board of directors, except in 2012. In 2012 this bonus shall be determined once we have become a public reporting company. In the sole discretion of our board of directors, we may pay Mr. Collins additional bonuses from time to time. We issued Mr. Collins incentive stock options to purchase 250,000 shares of common stock at an exercise price of $2.00 per share. The options will vest quarterly over a three-year period, and will be exercisable until the earlier of three years after vesting or 365 days after termination of Mr. Collins’ employment with us. We may terminate Mr. Collins’ employment for “cause,” in which event we will pay Mr. Collins severance of three months’ base salary, all accrued but unpaid base salary, and accrued vacation to the date of termination. We may terminate Mr. Collins’ employment without “cause,” in which event we will pay Mr. Collins severance of two years’ base salary, all accrued but unpaid base salary and accrued vacation to the date of termination. If Mr. Collins resigns during the term of the employment agreement, we will pay Mr. Collins three months’ base salary. Mr. Collins also agreed not to (i) engage in activities competitive with us during the term of the agreement and for a two-year period thereafter, (ii) disclose any of our proprietary information, during the term of the employment agreement and for a two-year period thereafter, or (iii) solicit or encourage any agent, independent contractor, supplier, customer, or any other person or company to terminate or alter a relationship with us, during the term of the agreement and for a two-year period thereafter.
Outstanding Equity Awards at 2011 Fiscal Year-End
The following table sets forth outstanding equity awards to our named executive officers as of December 31, 2011:
|
OPTION AWARDS
|
STOCK AWARDS
|
|||||||||||||||||||||||||||||||||||
|
Name
(a)
|
Number of Securities Underlying Unexercised Options
(#)
Exercisable
(b)
|
Number of
Securities Underlying Unexercised
Options
(#) Unexercisable
(c)
|
Equity Incentive Plan Awards: Number of Securities Underlying Unexercised Unearned Options
(#)
(d)
|
Option Exercise Price
($)
(e)
|
Option Expiration Date
(f)
|
Number of Shares or Units of Stock That Have Not Vested
(#)
(g)
|
Market Value of Shares or Units of Stock That Have Not Vested
($)
(h)
|
Equity Incentive Plan Awards: Number of Unearned Shares, Units or Other Rights That Have Not Vested
(#)
(i)
|
Equity Incentive Plan Awards: Market or Payout Value of Unearned Shares, Units or Other Rights That Have Not Vested
(#)
(j)
|
|||||||||||||||||||||||||||
|
William Collins
|
20,833
|
229,167
|
-
|
$
|
2.00
|
9/16/2021
|
-
|
-
|
-
|
-
|
||||||||||||||||||||||||||
|
Michael Senzaki
|
20,833
|
229,167
|
-
|
$
|
2.00
|
9/16/2021
|
-
|
-
|
-
|
-
|
||||||||||||||||||||||||||
Director Compensation
The following table sets forth director compensation for the year ended December 31, 2011 (excluding compensation to our executive officers set forth in the summary compensation table above).
|
Name
(a)
|
Fees
Earned or
Paid in
Cash
($)
(b)
|
Stock
Awards
($)
(c)
|
Option
Awards
($)
(d)
|
Non-Equity
Incentive
Plan
Compensation
($)
(e)
|
Change in
Pension
Value and
Nonqualified
Deferred
Compensation
Earnings
($)
(f)
|
All
Other
Compensation
($)
(g)
|
Total
($)
(h)
|
|||||||||||||||||||||
|
William Collins
|
0 | 0 | 0 | 0 | 0 | 0 | 0 | |||||||||||||||||||||
|
Michael Senzaki
|
0 | 0 | 0 | 0 | 0 | 0 | 0 | |||||||||||||||||||||
|
|
||||||||||||||||||||||||||||
|
John P. Metcalf
|
$ | 20,830 | $ | 5,500 | $ | 42,297 | - | - | - | $ | 68,627 | |||||||||||||||||
|
Neil J. Nelson
|
$ | 11,672 | $ | 5,200 | $ | 16,918 | - | - | - | $ | 33,791 | |||||||||||||||||
|
Timothy Hawkins
|
$ | 6,252 | $ | 4,400 | $ | 16,918 | - | - | - | $ | 27,570 | |||||||||||||||||
37
Our non-employee directors receive annual compensation of $20,000 in cash for serving on the board of directors and an additional $5,000 annually for each committee a director serves on (for total annual cash compensation of $35,000 for a director who serves on all three committees, including $20,000 for serving on the board). In addition, non-employee directors are issued 10,000 stock options vesting upon agreement to serve, 1,000 restricted shares of common stock granted quarterly under the 2011 Equity Incentive Plan, and an additional 100 restricted shares of common stock granted quarterly for each committee a director serves on (for total of 1,300 quarterly stock grants for a director who serves on all three committees, including 1,000 shares for serving on the board of directors).
The chairman of our audit committee, compensation committee, and nominating committee, John P. Metcalf, receives additional compensation of $10,000 annually for each committee for which he serves as chairman (for total annual cash compensation of $50,000, including $20,000 for serving on the board of directors), 5,000 options vesting upon agreement to serve for each committee for which he services he serves as chairman (for a total of 25,000 option grants, including 10,000 option grants for serving on the board of directors), and 125 shares of common stock granted quarterly for each committee for which he serves as chairman (for a total of 1,375 quarterly stock grants, including 1,000 quarterly stock grants for serving on the board of directors).
Stock Option and Other Long-term Incentive Plan
On September 15, 2011, our Board of Directors adopted the 2011 Equity Incentive Plan (the “2011 Plan”). Under the 2011 Plan, options may be granted which are intended to qualify as Incentive Stock Options under Section 422 of the Internal Revenue Code of 1986 (the "Code") or which are not intended to qualify as Incentive Stock Options thereunder. In addition, direct grants of stock or restricted stock may be awarded. The 2011 Plan has reserved 1,250,000 shares of common stock for issuance. The terms and provisions of the 2011 Plan are described below.
The primary purpose of the 2011 Plan is to attract and retain the best available personnel in order to promote the success of our business and to facilitate the ownership of our stock by employees and others who provide services to us. The 2011 Plan will be administered by our Board of Directors until such time as such authority has been delegated to a committee of the board of directors. Under the 2011 Plan, options may be granted to employees, officers, directors or consultants of ours. The term of each option granted under the 2011 Plan will be contained in a stock option agreement between the optionee and us and such terms shall be determined by the board of directors consistent with the provisions of the 2011 Plan, including the following:
|
·
|
The purchase price of the common stock subject to each incentive stock option will not be less than the fair market value (as set forth in the 2011 Plan), or in the case of the grant of an incentive stock option to a principal stockholder, not less than 110% of fair market value of such common stock at the time such option is granted.
|
|
·
|
The dates on which each option (or portion thereof) will be exercisable and the conditions precedent to such exercise, if any, shall be fixed by the board of directors, in its discretion, at the time such option is granted. Unless otherwise provided in the grant agreement, in the event of a change of control (as set forth in the Incentive Stock Plan ) all unvested shares shall immediately become vested;
|
|
·
|
Any option granted to an employee of ours will become exercisable over a period of no longer than five years. No option will in any event be exercisable after ten years from, and no Incentive Stock Option granted to a ten percent stockholder will become exercisable after the expiration of five years from, the date of the option;
|
|
·
|
No option will be transferable, except by will or the laws of descent and distribution, and any option may be exercised during the lifetime of the optionee only by such optionee. No option granted under the 2011 Plan will be subject to execution, attachment or other process;
|
|
·
|
In the event of any change in our outstanding common stock by reason of a stock split, stock dividend, combination or reclassification of shares, recapitalization, merger, or similar event, the board of directors or the committee delegated by the board may adjust proportionally (a) the number of shares of common stock (i) reserved under the 2011 Plan, (ii) available for Incentive Stock Options and Non-statutory Options and (iii) covered by outstanding stock awards or restricted stock purchase offers; (b) the exercise prices related to outstanding grants; and (c) the appropriate fair market value and other price determinations for such grants. In the event of a corporate merger, consolidation, acquisition of property or stock, separation, reorganization or liquidation, the board of directors or the committee delegated by the board of directors will be authorized to issue or assume stock options, whether or not in a transaction to which Section 424(a) of the Internal Revenue Code of 1986, as amended, applies, and other grants by means of substitution of new grant agreements for previously issued grants or an assumption of previously issued grants.
|
The board of directors may, insofar as permitted by law, from time to time, suspend or terminate the 2011 Plan or revise or amend it in any respect whatsoever, except that without the approval of our stockholders, no such revision or amendment will (i) increase the number of shares subject to the 2011 Plan, (ii) decrease the price at which grants may be granted, (iii) materially increase the benefits to participants, or (iv) change the class of persons eligible to receive grants under the 2011 Plan; provided, however, no such action will alter or impair the rights and obligations under any option, or stock award, or restricted stock purchase offer outstanding as of the date thereof without the written consent of the participant thereunder.
As of January 17, 2012, 1,005,000 options have been issued under the 2011 Plan, including 250,000 options issued to each of William Collins and Michael Senzaki which will vest on a quarterly basis over a three year term, 25,000 options issued to John P. Metcalf, 10,000 options issued to Neil J. Nelson, and 10,000 options issued to Timothy Hawkins, which vested upon agreement to serve. The options have an exercise price of $2.00 per share. All option granted have an expiration term of 10 years. The total value of options granted was $2,131,541 at the grant date. We measure the value of option using the Black Scholes option model using the following assumptions: an expected dividend yield of 0%, estimated volatility of 59.65% and a risk free interest rate of 0.31% commensurate with term.
Equity Compensation Plan Information as of December 31, 2011
|
Equity Compensation Plan Information
|
|||
|
Plan category
|
Number of securities to be issued upon exercise of outstanding options, warrants and rights
(a)
|
Weighted-average exercise price of outstanding options, warrants and rights
(b)
|
Number of securities remaining available for future issuance under equity compensation plans (excluding securities reflected in column (a))
(c)
|
|
Equity compensation plans approved by security holders
|
1,005,000
|
$2.00
|
245,000
|
|
Equity compensation plans not approved by security holders
|
--
|
--
|
--
|
|
Total
|
1,005,000
|
$2.00
|
245,000
|
Risk Management
We do not believe risks arising from our compensation policies and practices for our employees are reasonably likely to have a material adverse effect on us.
38
CERTAIN RELATIONSHIPS AND RELATED TRANSACTIONS
William Collins, our Chairman, President and Chief Executive Officer, has from time to time made demand loans to us bearing interest at 12% per year. As of September 30, 2011, we owe Mr. Collins $145,679 in principal and $59,096 in accrued interest on these loans, which are due on demand. We intend to repay these loans with a portion of the net proceeds of this offering. See “Use of Proceeds.”
On September 12, 2011, we sold 25,000 shares of common stock to Neil Nelson, a director of ours, for a purchase price of $50,000.
In connection with this offering, our board of directors has adopted a policy whereby any future transactions between us and any of our subsidiaries, affiliates, officers, directors, principal stockholders and any affiliates of the foregoing will be on terms no less favorable to us than could reasonably be obtained in “arm’s length” transactions with independent third parties, and that any such transactions also be approved by a majority of our disinterested outside directors.
PRINCIPAL STOCKHOLDERS
The following table sets forth certain information regarding the beneficial ownership of our common stock as of January 17, 2012 as adjusted to reflect the sale of our common stock offered by this prospectus by:
|
•
|
each of our current directors and directors upon completion of this offering;
|
|
•
|
all of our directors and executive officers as a group; and
|
|
•
|
each stockholder known by us to own beneficially more than 5% of our common stock.
|
Beneficial ownership is determined in accordance with the rules of the SEC and includes voting or investment power with respect to the securities. Shares of common stock that may be acquired by an individual or group within 60 days after January 17, 2012 , pursuant to the exercise of stock options or warrants, are deemed to be outstanding for the purpose of computing the percentage ownership of such individual or group, but are not deemed to be outstanding for the purpose of computing the percentage ownership of any other person shown in the table.
Percentage ownership calculations for beneficial ownership before this offering are based on 5,543,870 shares of common stock outstanding as of January 17, 2012. Percentage ownership calculations for beneficial ownership after this offering also include the _______ shares we are offering under this prospectus, but excludes shares underlying the warrants offered under this prospectus.
Except as indicated in footnotes to this table, the stockholders named in this table have sole voting and investment power with respect to all shares of common stock shown to be beneficially owned by them, based on information provided to us by such stockholders. Unless otherwise indicated, the address for each director and executive officer listed is: c/o Trellis Earth Products, Inc., 9125 S.W. Ridder Road, Suite D, Wilsonville, Oregon 97070.
| 3 |
Percentage of
Common Stock
Beneficially Owned
|
|||||||||||
|
Stockholders
|
Shares
Beneficially
Owned
|
Before
Offering
|
After
Offering
|
|||||||||
|
William Collins
|
2,805,667
|
(1) |
50.1
|
%
|
___
|
%
|
||||||
|
Michael Senzaki
|
141,667
|
(1) |
2.5
|
%
|
__
|
%
|
||||||
|
John Metcalf
|
27,750
|
(2)
|
*
|
*
|
||||||||
|
Neil J. Nelson
|
37,600
|
(3)
|
*
|
*
|
||||||||
|
Timothy Hawkins
|
11,200
|
(3)
|
*
|
*
|
||||||||
|
All executive officers and directors as a group (5 persons)
|
3,023,884
|
57.3
|
%
|
___
|
%
|
|||||||
* Less than 1%.
(1) Includes 41,667 shares underlying options exercisable within 60 days within an exercise price of $2.00 per share.
(2) Includes 25,000 shares underlying vested options with an exercise price of $2.00 per share.
(3) Includes 10,000 shares underlying vested options with an exercise price of $2.00 per share.
40
DESCRIPTION OF CAPITAL STOCK
Our total authorized capital stock is 120,000,000 shares, of which 100,000,000 shares are common stock, par value $0.001 per share, and 20,000,000 shares are preferred stock, par value $0.001 per share. As of the date of this prospectus, there are 5,543,870 shares of common stock, held of record by 142 shareholders, and no shares of preferred stock, issued and outstanding.
The following description of our capital stock and provisions of our articles of incorporation and bylaws are summaries and are qualified by reference to the articles of incorporation and bylaws filed with the U.S. Securities and Exchange Commission as exhibits to our registration statement, of which this prospectus forms a part.
Common Stock
The holders of our common stock are entitled to one vote per share on all matters to be voted on by our stockholders, including the election of directors. Our stockholders are not entitled to cumulative voting rights and, accordingly, the holders of a majority of the shares voting for the election of directors can elect the entire board of directors if they choose to do so and, in that event, the holders of the remaining shares will not be able to elect any person to our board of directors.
The holders of our common stock are entitled to receive ratably such dividends, if any, as may be declared from time to time by the board of directors, in its discretion, from funds legally available therefor and subject to prior dividend rights of holders of any shares of our preferred stock which may be outstanding. Upon our liquidation, dissolution or winding up, subject to prior liquidation rights of the holders of our preferred stock, if any, the holders of our common stock are entitled to receive on a pro rata basis our remaining assets available for distribution. Holders of our common stock have no preemptive or other subscription rights, and there are no conversion rights or redemption or sinking fund provisions with respect to such shares. All outstanding shares of our common stock are, and all shares being offered by this prospectus will be, fully paid and not liable to further calls or assessment by us.
Preferred Stock
As noted above, our authorized preferred stock consists of 20,000,000 shares of preferred stock. As of the date of this prospectus, no shares of preferred stock are issued and outstanding. Our articles of incorporation authorize the issuance of shares of preferred stock in one or more series. Our board of directors has the authority, without any vote or action by the shareholders, to create one or more series of preferred stock up to the limit of our authorized but unissued shares of preferred stock and to fix the number of shares constituting such series and the designation of such series, the voting powers (if any) of the shares of such series and the relative, participating, optional or other special rights (if any), and any qualifications, preferences, limitations or restrictions pertaining to such series which may be fixed by the board of directors pursuant to a resolution or resolutions providing for the issuance of such series adopted by the board of directors.
Warrants
In connection with this offering, we will issue warrants to purchase up to _________ shares of common stock. Each warrant entitles the holder to purchase one share of common stock at an exercise price of $ per share for a period of ____ years. After the expiration of the exercise period, warrant holders will have no further rights to exercise such warrants.
The warrants may be exercised only for full shares of common stock, and may be exercised on a “cashless” basis if the registration statement covering the shares issuable upon exercise of the warrants is no longer effective. We will not issue fractional shares of common stock or cash in lieu of fractional shares of common stock. Warrant holders do not have any voting or other rights as a stockholder of our company. The exercise price and the number of shares of common stock purchasable upon the exercise of each warrant are subject to adjustment upon the happening of certain events, such as stock dividends, distributions, and splits.
Placement Agent’s Warrants
We have agreed to issue to Tripoint Global Equities, LLC, warrants to purchase up to 10% of the shares of common stock sold in the offering at $_____ per share (the price of the shares sold in this offering). The shares of common stock issuable upon exercise of these warrants are identical to those offered by this prospectus.
Transfer Agent and Registrar
The transfer agent and registrar for our common stock is Island Stock Transfer, St. Petersburg, Florida.
Over-the-Counter Bulletin Board Quotation
There is currently no trading market for our common stock. A market maker has submitted an application for our common stock to be approved for quotation on the Over-The-Counter Bulletin Board upon the effectiveness of this prospectus. There is no assurance the application will be approved.
Certain Anti-Takeover Provisions
The provisions of Nevada law and our bylaws may have the effect of delaying, deferring or preventing another party from acquiring control of our Company. These provisions, summarized below, may discourage and prevent coercive takeover practices and inadequate takeover bids.
Nevada Law
Nevada law contains a provision governing “acquisition of controlling interest.” This law provides generally that any person or entity that acquires 20% or more of the outstanding voting shares of a publicly-held Nevada corporation in the secondary public or private market may be denied voting rights with respect to the acquired shares, unless a majority of the disinterested shareholders of the corporation elects to restore such voting rights in whole or in part. The control share acquisition act provides that a person or entity acquires “control shares” whenever it acquires shares that, but for the operation of the control share acquisition act, would bring its voting power within any of the following three ranges: 20 to 33-1/3%; 33-1/3 to 50%; or more than 50%.
A “control share acquisition” is generally defined as the direct or indirect acquisition of either ownership or voting power associated with issued and outstanding control shares. The shareholders or board of directors of a corporation may elect to exempt the stock of the corporation from the provisions of the control share acquisition act through adoption of a provision to that effect in the articles of incorporation or bylaws of the corporation. Our articles of incorporation and bylaws do not exempt our common stock from the control share acquisition act.
The control share acquisition act is applicable only to shares of “Issuing Corporations” as defined by the Nevada law. An Issuing Corporation is a Nevada corporation which (i) has 200 or more shareholders, with at least 100 of such shareholders being both shareholders of record and residents of Nevada, and (ii) does business in Nevada directly or through an affiliated corporation.
At this time, we do not have 100 shareholders of record resident of Nevada and we do not conduct business in Nevada directly. Therefore, the provisions of the control share acquisition act do not apply to acquisitions of our shares and will not until such time as these requirements have been met. At such time as they may apply, the provisions of the control share acquisition act may discourage companies or persons interested in acquiring a significant interest in or control of us, regardless of whether such acquisition may be in the interest of our shareholders.
The Nevada “Combination with Interested Stockholders Statute” may also have an effect of delaying or making it more difficult to effect a change in control of us. This statute prevents an “interested stockholder” and a resident domestic Nevada corporation from entering into a “combination,” unless certain conditions are met. The statute defines “combination” to include any merger or consolidation with an “interested stockholder,” or any sale, lease, exchange, mortgage, pledge, transfer or other disposition, in one transaction or a series of transactions with an “interested stockholder” having (i) an aggregate market value equal to 5% or more of the aggregate market value of the assets of the corporation, (ii) an aggregate market value equal to 5% or more of the aggregate market value of all outstanding shares of the corporation, or (iii) representing 10% or more of the earning power or net income of the corporation.
An “interested stockholder” means the beneficial owner of 10% or more of the voting shares of a resident domestic corporation, or an affiliate or associate thereof. A corporation affected by the statute may not engage in a “combination” within three years after the interested stockholder acquires its shares unless the combination or purchase is approved by the board of directors before the interested stockholder acquired such shares. If approval is not obtained, then after the expiration of the three-year period, the business combination may be consummated with the approval of the board of directors or a majority of the voting power held by disinterested stockholders, or if the consideration to be paid by the interested stockholder is at least equal to the highest of (i) the highest price per share paid by the interested stockholder within the three years immediately preceding the date of the announcement of the combination or in the transaction in which he became an interested stockholder, whichever is higher, (ii) the market value per common share on the date of announcement of the combination or the date the interested stockholder acquired the shares, whichever is higher, or (iii) if higher for the holders of preferred stock, the highest liquidation value of the preferred stock.
Articles of Incorporation and Bylaws
Our articles of incorporation are silent as to cumulative voting rights in the election of our directors. Nevada law requires the existence of cumulative voting rights to be provided for by a corporation’s articles of incorporation. As such, the combination of the present ownership by a few stockholders of a significant portion of our issued and outstanding common stock and lack of cumulative voting makes it more difficult for other stockholders to replace our board of directors or for a third party to obtain control of us by replacing our board of directors. Our articles of incorporation and bylaws do not contain any explicit provisions that would have an effect of delaying, deferring or preventing a change in control of us.
42
SHARES ELIGIBLE FOR FUTURE SALE
Before this offering, no public market existed for our common stock. Market sales of shares of our common stock after this offering and from time to time, and the availability of shares for future sale, may reduce the market price of our common stock. Sales of substantial amounts of our common stock, or the perception that these sales could occur, could adversely affect prevailing market prices for our common stock and could impair our future ability to obtain capital, especially through an offering of equity securities.
Based on the number of shares of common stock outstanding as of the date of this prospectus, and assuming the sale of all shares offered, upon completion of this offering, _______ shares of common stock and ________ warrants will be outstanding. All of the securities sold in this offering will be freely tradable without restrictions or further registration under the Securities Act of 1933, as amended, unless held by our “affiliates,” as that term is defined under Rule 144 under the Securities Act.
The remaining _________ shares of common stock outstanding upon the closing of this offering are restricted securities, as defined under Rule 144 of the Securities Act. Restricted securities may be sold in the U.S. public market only if registered or if they qualify for an exemption from registration, including by reason of Rule 144 or 701 under the Securities Act, which rules are summarized below. These remaining shares will generally become available for sale in the public market as follows:
|
•
|
_____ restricted shares will be eligible for sale in the public market upon completion of this offering under Rule 144;
|
|
•
|
_____ restricted shares will be eligible for sale in the public market 90 days after the date of this prospectus, subject to the volume, manner of sale and other limitations under Rule 144 and Rule 701; and
|
|
•
|
_____ restricted shares will be eligible for sale in the public market upon expiration of lock-up agreements 180 days after the date of this prospectus, which date may be extended in specified circumstances, subject in certain circumstances to the volume, manner of sale and other limitations under Rule 144 and Rule 701.
|
Rule 144
In general, under Rule 144 under the Securities Act, as in effect on the date of this prospectus, beginning 90 days after the date of this prospectus, a person who is not one of our affiliates at any time during the three months preceding a sale, and who has beneficially owned shares of our common stock to be sold for at least six months, would be entitled to sell an unlimited number of shares of our common stock, provided current public information about us is available. In addition, under Rule 144, a person who is not one of our affiliates at any time during the three months preceding a sale, and who has beneficially owned the shares of our common stock to be sold for at least one year, would be entitled to sell an unlimited number of shares immediately upon the closing of this offering without regard to whether current public information about us is available. Beginning 90 days after the date of this prospectus, our affiliates who have beneficially owned shares of our common stock for at least six months are entitled to sell within any three-month period a number of shares that does not exceed the greater of:
|
•
|
1% of the number of shares of our common stock then outstanding, which will equal approximately _____ shares immediately after this offering; and
|
|
•
|
the average weekly trading volume of our common stock on the Nasdaq Capital Market during the four calendar weeks preceding the filing of a notice on Form 144 with respect to the sale, or if no such notice is required, the date of receipt of the order to execute the sale.
|
Sales of restricted shares under Rule 144 by our affiliates are also subject to requirements regarding the manner of sale, notice and the availability of current public information about us. Rule 144 also provides that affiliates relying on Rule 144 to sell shares of our common stock that are not restricted shares must nonetheless comply with the same restrictions applicable to restricted shares, other than the holding period requirement.
Notwithstanding the availability of Rule 144, holders of 4,935,634 of our restricted shares will enter into lock-up agreements as described below under “Plan of Distribution” and their restricted shares will become eligible for sale at the expiration of the restrictions set forth in those agreements, subject to any exceptions set forth therein.
Rule 701
Rule 701 under the Securities Act, as in effect on the date of this prospectus, permits resales of shares in reliance upon Rule 144 but without compliance with some of the restrictions of Rule 144, including the holding period requirement. All holders of Rule 701 shares are required to wait until 90 days after the date of this prospectus before selling their shares under Rule 701. However, all of the Rule 701 shares are subject to lock-up agreements with a term of one year and will become eligible for sale at the expiration of the restrictions set forth in those agreements.
43
PLAN OF DISTRIBUTION
We are offering up to _______ shares of our common stock and warrants to purchase up to ___ shares of common stock at a public offering price of $___ per share and warrant. Each purchaser will receive one warrant to purchase one share of common stock for each share of common stock purchased. We have engaged Tripoint Global Equities, LLC as our placement agent for this offering. Tripoint Global Equities, LLC is not purchasing or selling any securities, nor are they required to arrange for the purchase and sale of any specific number or dollar amount of shares of common stock or warrants, but will use their reasonable “best efforts” to sell all of the shares of common stock and warrants being offered. Because there is no minimum offering amount required as a condition to closing this offering, the actual public offering amount, placement agent fees, and proceeds to us, if any, are not presently determinable and may be substantially less than the total maximum offering amounts set forth herein.
Upon the closing of the offering, we will pay the placement agent a cash fee equal to 10% of the gross proceeds to us from the sale of the securities in the offering. Subject to compliance with FINRA Rule 5110(f)(2)(D), we have also agreed to pay the placement agent a non-accountable expense allowance equal to 1.5% of the gross proceeds raised in the offering, but in no event more than $120,000 (exclusive of the fees of the placement agent’s counsel, which will not exceed $75,000) without our consent. In the event the offering is terminated, the placement agent will be reimbursed only for its actual accountable out-of-pocket expenses. In addition, we agreed to grant the placement agent a warrant to purchase a number of shares of our common stock equal to 10% of the aggregate number of shares of common stock and shares of common stock issuable upon exercise of the warrants sold in the offering. The placement agent warrants will have the same terms as the warrants issued to the public in the offering except that it will have an exercise price equal to 100% of the public offering price per share and warrant, an expiration date that is _____ years from the earlier of the effective date this registration statement and will be subject to FINRA Rule 5110(g)(1) in that for a period of six months after the issuance date of the placement agent warrants, neither the placement agent warrants nor any warrant shares issued upon exercise of the placement agent warrants shall be (A) sold, transferred, assigned, pledged, or hypothecated, or (B) the subject of any hedging, short sale, derivative, put, or call transaction that would result in the effective economic disposition of the securities by any person for a period of 180 days immediately following the date of effectiveness or commencement of sales of the offering pursuant to which the compensation warrants are being issued, except the transfer of any security as permitted by FINRA rules.
The placement agent may be deemed to be an underwriter within the meaning of Section 2(a)(11) of the Securities Act and any commissions received by it and any profit realized on the sale of the securities by them while acting as principal might be deemed to be underwriting discounts or commissions under the Securities Act. The placement agent would be required to comply with the requirements of the Securities Act of 1933, as amended, or the Securities Act, and the Securities Exchange Act of 1934, as amended, or the Exchange Act, including, without limitation, Rule 10b-5 and Regulation M under the Exchange Act. These rules and regulations may limit the timing of purchases and sales of shares of common stock and warrants to purchase shares of common stock by the placement agent. Under these rules and regulations, the placement agent may not (i) engage in any stabilization activity in connection with our securities; and (ii) bid for or purchase any of our securities or attempt to induce any person to purchase any of our securities, other than as permitted under the Exchange Act, until they have completed their participation in the distribution.
We will indemnify the placement agent against specified liabilities, including liabilities under the Securities Act. We have been advised that, in the opinion of the Securities and Exchange Commission, indemnification for liabilities under the Securities Act is against public policy as expressed in the Securities Act and is therefore unenforceable.
Our obligations to issue and sell the securities offered hereby to the purchasers is subject to the conditions set forth in a securities purchase agreement, which may be waived by us at our discretion. A purchaser’s obligation to purchase the securities is subject to the conditions set forth in a securities purchase agreement as well, which may also be waived by the purchaser.
In order to comply with certain state securities laws, if applicable, the securities will be sold in such jurisdictions only through registered or licensed brokers or dealers. We are seeking a limited offering qualification of our shares and warrants in California. If the offering is approved in California on the basis of such limited offering qualification, in the absence of any other exemptions, offers and sales of our securities can only be made to proposed California purchasers based on their meeting certain suitability standards. California investors must meet at least one of the following criteria:
|
·
|
any bank as defined in section 3(a)(2) of the Securities Act, or any savings and loan association or other institution as defined in section 3(a)(5)(A) of the Securities Act whether acting in its individual or fiduciary capacity; any broker or dealer registered pursuant to section 15 of the Securities Exchange Act of 1934; any insurance company as defined in section 2(a)(13) of the Securities Act; any investment company registered under the Investment Company Act of 1940 or a business development company as defined in section 2(a)(48) of that Act; any Small Business Investment Company licensed by the U.S. Small Business Administration under section 301(c) or (d) of the Small Business Investment Act of 1958; any plan established and maintained by a state, its political subdivisions, or any agency or instrumentality of a state or its political subdivisions, for the benefit of its employees, if such plan has total assets in excess of $5,000,000; any employee benefit plan within the meaning of the Employee Retirement Income Security Act of 1974 if the investment decision is made by a plan fiduciary, as defined in section 3(21) of such act, which is either a bank, savings and loan association, insurance company, or registered investment adviser, or if the employee benefit plan has total assets in excess of $5,000,000 or, if a self-directed plan, with investment decisions made solely by persons that are accredited investors;
|
|
·
|
any private business development company as defined in section 202(a)(22) of the Investment Advisers Act of 1940;
|
|
·
|
any organization described in section 501(c)(3) of the Internal Revenue Code, corporation, Massachusetts or similar business trust, or partnership, not formed for the specific purpose of acquiring the securities offered, with total assets in excess of $5,000,000;
|
|
·
|
any director, executive officer, or general partner of the issuer of the securities being offered or sold, or any director, executive officer, or general partner of a general partner of that issuer
|
|
·
|
any natural person whose individual net worth, or joint net worth with that person's spouse, at the time of his purchase exceeds $225,000 (exclusive of home, home furnishings and automobile);
|
|
·
|
any natural person who had an individual income in excess of $200,000 in each of the two most recent years or joint income with that person's spouse in excess of $300,000 in each of those years and has a reasonable expectation of reaching the same income level in the current year;
|
|
·
|
any trust, with total assets in excess of $5,000,000, not formed for the specific purpose of acquiring the securities offered, whose purchase is directed by a sophisticated person as described in Rule 506(b)(2)(ii) and
|
|
·
|
any entity in which all of the equity owners are accredited investors.
|
Institutional investors may generally purchase shares and warrants in the offering pursuant to exemptions provided for sales to such entities under the laws of various states. The definition of an “institutional investor” varies from state to state, but generally includes financial institutions, broker-dealers, banks, insurance companies and other qualified entities. Purchasers who are not institutional investors, may purchase shares in this offering only if they reside in the jurisdictions where there is an effective registration or exemption, and, if required, meet any requisite suitability standards.
44
EXPERTS
Our financial statements as of and for the years ended December 31, 2010 and 2009, appearing in this prospectus and registration statement have been audited by GBH CPAs, PC, independent registered public accounting firm, as set forth in their report thereon appearing elsewhere in this prospectus, and are included in reliance upon such report given upon the authority of such firm as experts in accounting and auditing.
LEGAL MATTERS
The validity of the issuance of the securities offered by us in this offering will be passed upon for us by Sichenzia Ross Friedman Ference LLP, New York, New York.
COMMISSION POSITION ON INDEMNIFICATION FOR SECURITIES ACT LIABILITIES
Neither our articles of incorporation nor bylaws prevent us from indemnifying our officers, directors and agents to the extent permitted under the Nevada Revised Statutes (“NRS”). NRS Section 78.7502 provides that a corporation shall indemnify any director, officer, employee or agent of a corporation against expenses, including attorneys’ fees, actually and reasonably incurred by him in connection with any the defense to the extent that a director, officer, employee or agent of a corporation has been successful on the merits or otherwise in defense of any action, suit or proceeding referred to in Section 78.7502(1) or 78.7502(2), or in defense of any claim, issue or matter therein.
NRS 78.7502(1) provides that a corporation may indemnify any person who was or is a party or is threatened to be made a party to any threatened, pending or completed action, suit or proceeding, whether civil, criminal, administrative or investigative, except an action by or in the right of the corporation, by reason of the fact that he is or was a director, officer, employee or agent of the corporation, or is or was serving at the request of the corporation as a director, officer, employee or agent of another corporation, partnership, joint venture, trust or other enterprise, against expenses, including attorneys’ fees, judgments, fines and amounts paid in settlement actually and reasonably incurred by him in connection with the action, suit or proceeding if he: (a) is not liable pursuant to NRS 78.138; or (b) acted in good faith and in a manner which he reasonably believed to be in or not opposed to the best interests of the corporation, and, with respect to any criminal action or proceeding, had no reasonable cause to believe his conduct was unlawful.
NRS Section 78.7502(2) provides that a corporation may indemnify any person who was or is a party or is threatened to be made a party to any threatened, pending or completed action or suit by or in the right of the corporation to procure a judgment in its favor by reason of the fact that he is or was a director, officer, employee or agent of the corporation, or is or was serving at the request of the corporation as a director, officer, employee or agent of another corporation, partnership, joint venture, trust or other enterprise against expenses, including amounts paid in settlement and attorneys’ fees actually and reasonably incurred by him in connection with the defense or settlement of the action or suit if he: (a) is not liable pursuant to NRS 78.138; or (b) acted in good faith and in a manner which he reasonably believed to be in or not opposed to the best interests of the corporation. Indemnification may not be made for any claim, issue or matter as to which such a person has been adjudged by a court of competent jurisdiction, after exhaustion of all appeals therefrom, to be liable to the corporation or for amounts paid in settlement to the corporation, unless and only to the extent that the court in which the action or suit was brought or other court of competent jurisdiction determines upon application that in view of all the circumstances of the case, the person is fairly and reasonably entitled to indemnity for such expenses as the court deems proper.
NRS Section 78.747 provides that except as otherwise provided by specific statute, no director or officer of a corporation is individually liable for a debt or liability of the corporation, unless the director or officer acts as the alter ego of the corporation. The court as a matter of law must determine the question of whether a director or officer acts as the alter ego of a corporation.
Insofar as indemnification for liabilities arising under the Securities Act may be permitted to directors, officers or persons controlling us pursuant to the foregoing provisions, we have been informed that, in the opinion of the U.S. Securities and Exchange Commission, such indemnification is against public policy as expressed in the Securities Act and is therefore unenforceable. In the event that a claim for indemnification against such liabilities (other than the payment by the registrant of expenses incurred or paid by a director, officer or controlling person of the registrant in the successful defense of any action, suit or proceeding) is asserted by such director, officer or controlling person in connection with the securities being registered, we will, unless in the opinion of our counsel the matter has been settled by controlling precedent, submit to a court of appropriate jurisdiction the question whether such indemnification by us is against public policy as expressed hereby in the Securities Act and we will be governed by the final adjudication of such issue.
WHERE YOU CAN FIND MORE INFORMATION
We have filed a registration statement on Form S-1 under the Securities Act of 1933, as amended, relating to the shares of common stock being offered by this prospectus, and reference is made to such registration statement. This prospectus constitutes the prospectus of Trellis Earth Products, Inc., filed as part of the registration statement, and it does not contain all information in the registration statement, as certain portions have been omitted in accordance with the rules and regulations of the SEC.
In addition, after the effective date of this prospectus, we will be required to file annual, quarterly and current reports, or other information with the SEC as provided by the Securities Exchange Act of 1934, as amended. You may read and copy any reports, statements or other information we file at the SEC's public reference facility maintained by the SEC at 100 F Street, N.E., Washington, D.C. 20549. You can request copies of these documents, upon payment of a duplicating fee, by writing to the SEC. Please call the SEC at 1-800-SEC-0330 for further information on the operation of the public reference room. Our SEC filings are also available to the public through the SEC's Internet website at http://www.sec.gov .
TRELLIS EARTH PRODUCTS, INC.
INDEX TO FINANCIAL STATEMENTS
|
REPORT OF INDEPENDENT REGISTERED
|
|
|
PUBLIC ACCOUNTING FIRM
|
F-2
|
|
BALANCE SHEETS
|
F-3
|
|
As of December 31, 2010 and 2009
|
|
|
STATEMENTS OF OPERATIONS
|
F-4
|
|
For the Years Ended December 31, 2010 and 2009
|
|
|
STATEMENT OF CHANGES IN STOCKHOLDERS’ DEFICIT
|
F-5
|
|
For the Years Ended December 31, 2010 and 2009
|
|
|
STATEMENTS OF CASH FLOWS
|
F-6
|
|
For the Years Ended December 31, 2010 and 2009
|
|
|
NOTES TO FINANCIAL STATEMENTS
|
F-7
|
|
For the Years Ended December 31, 2010 and 2009
|
|
|
BALANCE SHEETS (unaudited)
|
F-19
|
|
As of September 30, 2011 and December 31, 2010
|
|
|
STATEMENTS OF OPERATIONS (unaudited)
|
F-20
|
|
For the Nine Months Ended September 30, 2011 and 2010
|
|
|
STATEMENTS OF CASH FLOWS (unaudited)
|
F-21
|
|
For the Nine Months Ended September 30, 2011 and 2010
|
|
|
NOTES TO FINANCIAL STATEMENTS (unaudited)
|
F-22
|
|
For the Nine Months ended September 30, 2011
|
F-1
Report of Independent Registered Public Accounting Firm
To the Board of Directors of
Trellis Earth Products, Inc.
Wilsonville, Oregon
We have audited the balance sheets of Trellis Earth Products, Inc. (the “Company”) as of December 31, 2010 and 2009, and the related statements of operations, changes in stockholders' deficit, and cash flows for the years then ended. These financial statements are the responsibility of the Company’s management. Our responsibility is to express an opinion on these financial statements based on our audits.
We conducted our audits in accordance with the standards of the Public Company Accounting Oversight Board (United States). Those standards require that we plan and perform each audit to obtain reasonable assurance about whether the financial statements are free of material misstatement. The Company is not required to have, nor were we engaged to perform, an audit of its internal control over financial reporting. Our audits included consideration of internal control over financial reporting as a basis for designing audit procedures that are appropriate in the circumstances, but not for the purpose of expressing an opinion on the effectiveness of the Company’s internal control over financial reporting. Accordingly, we express no such opinion. An audit also includes examining, on a test basis, evidence supporting the amounts and disclosures in the financial statements, assessing the accounting principles used and significant estimates made by management, as well as evaluating the overall financial statement presentation. We believe that our audits provide a reasonable basis for our opinion.
In our opinion, the financial statements referred to above present fairly, in all material respects, the financial position of Trellis Earth Products, Inc. as of December 31, 2010 and 2009, and the results of its operations and its cash flows for the years then ended in conformity with accounting principles generally accepted in the United States of America.
The accompanying financial statements have been prepared assuming that the Company will continue as a going concern. As discussed in Note C to the financial statements, the Company has an accumulated deficit as of December 31, 2010, limited liquidity and has not completed its efforts to establish a stable recurring source of revenues sufficient to cover operating costs for the next twelve month period, which raises substantial doubt about its ability to continue as a going concern. Management’s plans concerning these matters are also described in Note C. The financial statements do not include any adjustments that might result from the outcome of this uncertainty.
/s/ GBH CPAs, PC
GBH CPAs, PC
www.gbhcpas.com
Houston, Texas
September 21, 2011
BALANCE SHEETS
|
December 31,
|
December 31,
|
|||||||
|
2010
|
2009
|
|||||||
|
ASSETS
|
||||||||
|
CURRENT ASSETS:
|
||||||||
|
Cash and cash equivalents
|
$
|
21,954
|
$
|
38,405
|
||||
|
Accounts receivable, net
|
224,676
|
264,262
|
||||||
|
Inventory, net
|
475,786
|
468,083
|
||||||
|
Prepaid expenses and other current assets
|
8,963
|
10,662
|
||||||
|
Total current assets
|
731,379
|
781,412
|
||||||
|
PROPERTY, PLANT AND EQUIPMENT, NET
|
94,739
|
75,623
|
||||||
|
TOTAL ASSETS
|
$
|
826,118
|
$
|
857,035
|
||||
|
LIABILITIES AND STOCKHOLDERS’ DEFICIT
|
||||||||
|
CURRENT LIABILITIES:
|
||||||||
|
Accounts payable – trade
|
$
|
83,798
|
$
|
23,434
|
||||
|
Accounts payable – Zwest
|
801,531
|
193,367
|
||||||
|
Accrued liabilities
|
180,853
|
64,184
|
||||||
|
Notes payable – current portion
|
235,000
|
457,062
|
||||||
|
Notes payable – related parties
|
145,679
|
400,679
|
||||||
|
Accrued interest – related party
|
59,096
|
59,096
|
||||||
|
Total current liabilities
|
1,505,957
|
1,197,822
|
||||||
|
Note payable – long term
|
100,000
|
100,000
|
||||||
|
TOTAL LIABILITIES
|
1,605,957
|
1,297,822
|
||||||
|
Commitments and contingencies
|
-
|
-
|
||||||
|
STOCKHOLDERS’ DEFICIT:
|
||||||||
|
Preferred stock, $0.001 par value, 20,000,000 shares authorized,
|
||||||||
|
8,000,000 seed series convertible preferred stock designated,
|
||||||||
|
1,399,331 and 1,270,488 seed series shares issued and outstanding, respectively
|
||||||||
|
Respectively
|
1,399
|
1,270
|
||||||
|
Common stock, $0.001 par value, 100,000,000 shares authorized,
|
||||||||
|
4,807,750 and 4,751,750 shares issued, respectively, and
|
||||||||
|
3,807,750 and 3,751,750 shares outstanding, respectively
|
4,808
|
4,752
|
||||||
|
Additional paid - in capital
|
1,437,958
|
1,317,723
|
||||||
|
Treasury stock, at cost, 1,000,000 shares
|
(100,000
|
)
|
(100,000
|
)
|
||||
|
Accumulated deficit
|
(2,124,004
|
)
|
(1,664,532
|
)
|
||||
|
Total stockholders’ deficit
|
(779,839
|
)
|
(440,787
|
)
|
||||
|
TOTAL LIABILITIES AND STOCKHOLDERS’ DEFICIT
|
$
|
826,118
|
$
|
857,035
|
||||
The accompanying notes are an integral part of these financial statements
F-3
TRELLIS EARTH PRODUCTS, INC.
STATEMENTS OF OPERATIONS
For the Years Ended December 31, 2010 and 2009
|
December 31,
|
December 31,
|
|||||||
|
2010
|
2009
|
|||||||
|
REVENUES
|
$
|
2,686,255
|
$
|
2,178,534
|
||||
|
COST OF REVENUES
|
1,946,782
|
1,569,600
|
||||||
|
GROSS PROFIT
|
739,473
|
608,934
|
||||||
|
OPERATING EXPENSES:
|
||||||||
|
Selling, general and administrative expenses
|
879,676
|
889,895
|
||||||
|
Research and development expenses
|
42,300
|
38,500
|
||||||
|
Employee severance expense
|
160,000
|
-
|
||||||
|
Depreciation expense
|
10,899
|
8,126
|
||||||
|
LOSS FROM OPERATIONS
|
(353,402
|
)
|
(327,587
|
)
|
||||
|
OTHER INCOME (EXPENSE):
|
||||||||
|
Loss on disposition of fixed assets
|
(1,583
|
)
|
-
|
|||||
|
Interest expense
|
(104,487
|
)
|
(116,494
|
)
|
||||
|
NET LOSS
|
$
|
(459,472
|
)
|
$
|
(444,081
|
)
|
||
|
Net loss per share – basic and diluted
|
$
|
(0.12
|
)
|
$
|
(0.12
|
)
|
||
|
Weighted average common shares outstanding – basic and diluted
|
3,782,213
|
3,656,056
|
||||||
The accompanying notes are an integral part of these financial statements.
F-4
STATEMENT OF CHANGES IN STOCKHOLDERS’ DEFICIT
For the Years Ended December 31, 2010 and 2009
|
Additional
|
||||||||||||||||||||||||||||||||
|
Preferred stock
|
Common stock
|
Paid-in
|
Treasury
|
Accumulated
|
||||||||||||||||||||||||||||
|
Shares
|
Amount
|
Shares
|
Amount
|
Capital
|
Stock
|
Deficit
|
Total
|
|||||||||||||||||||||||||
|
Balances - December 31, 2008
|
996,000
|
$
|
996
|
4,462,125
|
$
|
4,462
|
891,418
|
$
|
-
|
$
|
(1,220,451
|
)
|
$
|
(323,575
|
)
|
|||||||||||||||||
|
Preferred shares issued to retire debt
|
150,000
|
150
|
74,850
|
75,000
|
||||||||||||||||||||||||||||
|
Preferred shares issued for cash
|
96,000
|
96
|
47,904
|
48,000
|
||||||||||||||||||||||||||||
|
Preferred shares issued for interest
|
28,488
|
28
|
14,216
|
14,244
|
||||||||||||||||||||||||||||
|
Common shares issued for services
|
289,625
|
290
|
289,335
|
289,625
|
||||||||||||||||||||||||||||
|
Promissory note issued to repurchase
common shares
|
(100,000
|
)
|
(100,000
|
)
|
||||||||||||||||||||||||||||
|
Net loss for the year
|
(444,081
|
)
|
(444,081
|
)
|
||||||||||||||||||||||||||||
|
Balances - December 31, 2009
|
1,270,488
|
$
|
1,270
|
4,751,750
|
$
|
4,752
|
$
|
1,317,723
|
$
|
(100,000
|
)
|
$
|
(1,664,532
|
)
|
$
|
(440,787
|
)
|
|||||||||||||||
|
Common shares issued for services
|
56,000
|
$
|
56
|
$
|
55,944
|
$
|
56,000
|
|||||||||||||||||||||||||
|
Preferred shares issued for rent
|
68,843
|
69
|
34,351
|
34,420
|
||||||||||||||||||||||||||||
|
Preferred shares issued to retire debt
|
60,000
|
60
|
29,940
|
30,000
|
||||||||||||||||||||||||||||
|
Net loss for the year
|
(459,472
|
)
|
(459,472
|
)
|
||||||||||||||||||||||||||||
|
Balances - December 31, 2010
|
1,399,331
|
$
|
1,399
|
4,807,750
|
$
|
4,808
|
$
|
1,437,958
|
$
|
(100,000
|
)
|
$
|
(2,124,004
|
)
|
$
|
(779,839
|
)
|
|||||||||||||||
The accompanying notes are an integral part of these financial statements.
F-5
STATEMENTS OF CASH FLOWS
For the Years Ended December 31, 2010 and 2009
|
December 31,
|
December 31,
|
|||||||
|
2010
|
2009
|
|||||||
|
CASH FLOWS FROM OPERATING ACTIVITIES:
|
||||||||
|
Net loss
|
$
|
(459,472
|
)
|
$
|
(444,081
|
)
|
||
|
Adjustments to reconcile net loss to net cash provided by(used in)
|
||||||||
|
operating activities:
|
||||||||
|
Bad debt expense
|
24,286
|
8,733
|
||||||
|
Depreciation expense
|
10,889
|
8,126
|
||||||
|
Loss on disposition of fixed assets
|
1,583
|
-
|
||||||
|
Common stock issued for services
|
56,000
|
289,625
|
||||||
|
Preferred stock issued for rent
|
34,420
|
-
|
||||||
|
Preferred stock issued for interest
|
-
|
14,244
|
||||||
|
Changes in operating assets and liabilities:
|
||||||||
|
Accounts receivable
|
15,300
|
(78,113
|
)
|
|||||
|
Inventory
|
(7,703
|
)
|
(202,867
|
)
|
||||
|
Prepaid expenses and other current assets
|
1,699
|
(10,662
|
)
|
|||||
|
Accounts payable – trade
|
60,364
|
(110,102
|
)
|
|||||
|
Accounts payable – Zwest
|
608,164
|
480,429
|
||||||
|
Accrued expenses
|
116,669
|
59,668
|
||||||
|
CASH PROVIDED BY OPERATING ACTIVITIES
|
462,199
|
15,000
|
||||||
|
CASH FLOWS FROM INVESTING ACTIVITIES:
|
||||||||
|
Purchases of property, plant and equipment
|
(31,588
|
)
|
(80,749
|
)
|
||||
|
CASH USED IN INVESTING ACTIVITIES
|
(31,588
|
)
|
(80,749
|
)
|
||||
|
CASH FLOWS FROM FINANCING ACTIVITIES:
|
||||||||
|
Proceeds from sales of preferred stock
|
-
|
48,000
|
||||||
|
Payments of debt – Zwest
|
(287,062
|
)
|
-
|
|||||
|
Proceeds from issuance of debt
|
220,000
|
310,000
|
||||||
|
Payments of debt
|
(125,000
|
)
|
(30,000
|
)
|
||||
|
Payments of related party debt
|
(255,000
|
)
|
(247,246
|
)
|
||||
|
CASH PROVIDED BY(USED IN) FINANCING ACTIVITIES
|
(447,062
|
)
|
80,754
|
|||||
|
NET CHANGE IN CASH
|
(16,451
|
)
|
15,005
|
|||||
|
CASH AT BEGINNING OF THE YEAR
|
38,405
|
23,400
|
||||||
|
CASH AT YEAR END
|
$
|
21,954
|
$
|
38,405
|
||||
|
Supplemental information:
|
||||||||
|
Cash paid for taxes
|
$
|
-
|
$
|
-
|
||||
|
Cash paid for interest
|
$
|
87,858
|
$
|
26,042
|
||||
|
Other non-cash investing and financing activities:
|
||||||||
|
Promissory note issued to purchase treasury stock
|
$
|
-
|
$
|
100,000
|
||||
|
Preferred shares issued to retire debt
|
$
|
30,000
|
$
|
75,000
|
||||
|
Debt issued for accounts payable
|
$
|
-
|
$
|
287,062
|
||||
The accompanying notes are an integral part of these financial statements.
F-6
TRELLIS EARTH PRODUCTS, INC.
NOTES TO FINANCIAL STATEMENTS
NOTE A – DESCRIPTION OF BUSINESS AND BASIS OF PRESENTATION
|
1.
|
Nature of operations
|
Trellis Earth Products, Inc. (the “Company”) is an Oregon corporation incorporated on December 5, 2006. The Company reincorporated in the State of Nevada on August 16, 2011. The Company engages in the distribution and sale of starch-based biodegradable disposable containers, tableware, and packaging materials. The Company offers its customers starch-based food and beverage containers and utensils made from biodegradable material, including cups, plates, and bowls; and traveling, picnic, and outdoor tableware products.
|
2.
|
Basis of presentation
|
The accompanying financial statements present the financial position, results of operations and cash flows of the Company. These financial statements are prepared in accordance with generally accepted accounting principles in the United States.
As of September 15, 2011, the Company effected a one-for-two reverse stock split of its outstanding common stock. Accordingly, all share and per share amounts for all periods presented in these financial statements and notes thereto, have been adjusted retroactively, where applicable, to reflect this reverse stock split.
|
3.
|
Use of Estimates
|
The preparation of financial statements in conformity with generally accepted accounting principles requires management to make estimates and assumptions that affect the reported amounts of assets and liabilities and the disclosure of contingent assets and liabilities at the date of the financial statements and that affect the reported amounts of revenues and expenses during the reporting period. Significant estimates include those with respect to the fair value of financial instruments, contingencies for litigation, collectability of receivables and stock-based compensation. Actual results could differ from those estimates.
NOTE B – SUMMARY OF SIGNIFICANT ACCOUNTING POLICIES
|
1.
|
Cash and Cash Equivalents
|
We consider short term, highly liquid investments that have an original maturity of three months or less to be cash equivalents.
|
2.
|
Accounts Receivable and Allowance for Doubtful Accounts
|
The allowance for doubtful accounts is based on the Company’s past experience and other factors which, in management's judgment, deserve current recognition in estimating bad debts. Such factors include growth and composition of accounts receivable, the relationship of the allowance for doubtful accounts to accounts receivable and current economic conditions. The determination of the collectability of amounts due from customer accounts requires the Company to make judgments regarding future events and trends. Allowance for doubtful accounts is determined based on assessing the Company’s portfolio on an individual customer and on an overall basis. This process consists of a review of historical collection experience, current aging status of the customer accounts, and the financial condition of Trellis’s customers. Based on a review of these factors, the Company establishes or adjusts the allowance for specific customers and the accounts receivable portfolio as a whole. At December 31, 2010 and 2009, allowance for doubtful accounts totaled $15,960 and $0, respectively.
F-7
|
3.
|
Inventory
|
Inventory is stated at the lower of cost or market. Cost is determined using the average cost method and it includes the costs from manufacturers, and in-bound freight. Appropriate consideration is given to obsolescence, excess quantities and other factors in evaluating the net realizable value. The Company determines reserves for inventory based on the historical usage of inventory, age of inventory on hand, assumptions about future demand and market conditions and estimates about potential alternative uses, which are usually limited.
|
4.
|
Property, Plant and Equipment
|
Property, plant and equipment are stated at cost. Additions of new equipment and major renewals and replacements of existing equipment are capitalized. Repairs and minor replacements are charged to operations as incurred. Cost and accumulated depreciation and amortization are removed from the accounts when assets are sold or retired, and the resulting gains or losses are included in operations.
Depreciation of property, plant and equipment is provided using the straight-line method applied to the expected useful lives of the assets:
|
Estimated useful lives (years)
|
|
|
Machinery and equipment
|
3 – 7 years
|
|
Office furniture, fixtures and fittings
|
3 – 5 years
|
|
5.
|
Fair Value of Financial Instruments
|
The Company measures fair value in accordance with ASC Topic 820, Fair Value Measurements and Disclosures (“ASC 820”) which defines fair value, establishes a framework for measuring fair value, establishes a fair value hierarchy based on the quality of inputs used to measure fair value and enhances disclosure requirements for fair value measurements. ASC 820 defines fair value as the price that would be received to sell an asset or paid to transfer a liability in an orderly transaction between market participants at the measurement date (exit price).
|
6.
|
Income Taxes
|
The Company uses the asset and liability method of accounting for income taxes. Under this method, it records deferred income taxes based on temporary differences between the financial reporting and tax bases of assets and liabilities and uses enacted tax rates and laws that the Company expects will be in effect when it recovers those assets or settles those liabilities, as the case may be, to measure those taxes. The Company reviews deferred tax assets for a valuation allowance based upon whether it is more likely than not that the deferred tax asset will be fully realized.
The Company recognizes the financial statement benefit of a tax position only after determining that the relevant tax authority would more likely than not sustain the position following an audit. For tax positions meeting the more-likely-than-not threshold, the amount recognized in the financial statements is the largest benefit that has a greater than 50 percent likelihood of being realized upon ultimate settlement with the relevant tax authority. During 2010, the Company did not identify any uncertain tax positions.
The Company’s policy is to include interest and penalties related to unrecognized tax benefits within the income tax expense (benefit) line item in the statement of operations.
|
7.
|
Revenue and Cost Recognition
|
The Company generates revenues principally by the sale of disposable products for the food service industry. Revenue is recognized when the products being sold have been shipped, title and risk of loss have been transferred, collectability is probable and pricing is fixed. Title and risk of loss is determined by the terms and conditions of each sale. The majority of the Company's sales are to distributors in the United States. The Company delivers its products to the customers through either shipments from the Company's distribution center in Portland Oregon or direct shipments from the vendor's manufacturing facility in China. For the years ended December 31, 2010 and 2009, approximately 90% and 100%, respectively, of the Company's revenue was derived from shipments made from Portland Oregon. For the years ended December 31, 2010 and 2009, approximately 10% and 0%, respectively, of the Company's revenue was derived from direct shipments from China. Revenues for the direct shipments are recognized when the customers received shipments. There are no provisions with the Company's distributors for returns without cause, and payment is due within 30 - 35 days within transfer of title. The Company has not had any material collection issues with any of its distributors.
F-8
Beginning in March of 2011, an affiliate of the Company's largest distributor Bunzl takes title to shipments in China. Under this arrangement, the Company recognizes revenue when title and risk of loss are transferred and when shipments are delivered to the customer’s facility in China. Payments for these sales are due 30 - 35 days from the date of transfer of title.
The Company’s cost of revenues includes cost of products purchased for distribution, inbound freight charges, purchasing and receiving costs, the cost of internal inspection and quality control, depreciation of manufacturing assets and all direct costs related to distribution of the Company’s products.
The Company’s selling, general and administrative expenses include payroll and associated costs, advertising, professional fees and other corporate administrative costs. Selling, general and administrative expenses also include depreciation and amortization expense for assets.
|
8.
|
Advertising Costs
|
The Company expenses advertising costs as incurred. For the years ended December 31, 2010 and 2009, advertising expense recorded by the Company was $10,494 and $17,809, respectively.
|
9.
|
Earnings (loss) per Share of Common Stock
|
Basic and diluted net income per share calculations are calculated on the basis of the weighted average number of shares of the Company's common stock outstanding during the year. Purchases of treasury stock reduce the outstanding shares commencing on the date that the stock is purchased. Common stock equivalents are excluded from the calculation when a loss is incurred as their effect would be anti-dilutive.
As of December 31, 2010 and 2009, the Company has no options or warrants outstanding.
As of December 31, 2010 and 2009, the Company has Convertible Preferred Stock of 1,399,331 shares and 1,270,488 shares, respectively, which can be converted to Common Stock on a 2 to 1 basis. As of December 31, 2010, the Company has convertible debt that can be converted to 400,000 shares of Convertible Preferred Stock. As the effect of these common stock equivalents would have been anti-dilutive, we have excluded all of these dilutive securities in our calculation of diluted earnings per share for the years ending December 31, 2010 and 2009.
|
10.
|
Stock-Based Compensation
|
The Company accounts for share-based awards issued to employees and non-employees in accordance with ASC 718. Accordingly, employee share-based payment compensation is measured at the grant date, based on the fair value of the award, and is recognized as an expense over the requisite service period. Additionally, share-based awards to non-employees are expensed over the period in which the related services are rendered at their fair value.
|
11.
|
Research and Development Expenses
|
Research and development expenses are costs associated with developing the Company’s intellectual property. Research and development costs are expensed as incurred. Research and development expenses for the years ended December 31, 2010 and 2009 were $42,300 and $38,500, respectively.
|
12.
|
Concentrations
|
Trade accounts receivables are typically generated from companies with distribution operations, which would be impacted by conditions relative to the U.S. economy in general. In 2010, 74% of revenues were attributable to two customers and their affiliates. In 2009, 71% of revenues were attributable to one customer and its affiliates. The Company performs ongoing credit evaluations of its customers and, generally, requires no collateral. The Company is not aware of any significant credit risk relating to these customers and has not experienced any credit loss associated with such receivables.
F-9
|
13.
|
Recent Accounting Pronouncements Adopted
|
In January 2010, the Financial Accounting Standards Board (FASB) issued Accounting Standards Update (ASU) 2010-06, "Improving Disclosures About Fair Value Measurements" (ASU 2010-06), which amends the Fair Value Measurements and Disclosures Topic of the ASC (ASC Topic 820). Among other provisions, ASC Topic 820 establishes a fair value hierarchy that prioritizes the relative reliability of inputs used in fair value measurements. The hierarchy gives highest priority to Level 1 inputs that represent unadjusted quoted market prices in active markets for identical assets and liabilities that the reporting entity has the ability to access at the measurement date. Level 2 inputs are directly or indirectly observable inputs other than quoted prices included within Level 1. Level 3 inputs are unobservable inputs and have the lowest priority in the hierarchy. This amendment requires new disclosures on the value of, and the reason for, transfers in and out of Levels 1 and 2 of the fair value hierarchy and additional disclosures about purchases, sales, issuances and settlements within Level 3 fair value measurements. ASU 2010-06 also clarifies existing disclosure requirements on levels of disaggregation and about inputs and valuation techniques. ASU 2010-06 is effective for interim and annual reporting periods beginning after December 15, 2009, except for the requirement to provide additional disclosures regarding Level 3 measurements which is effective for interim and annual reporting periods beginning after December 15, 2010.
|
14.
|
Subsequent Events
|
The Company evaluated all transactions from December 31, 2010 through September 21, 2011, the financial statement issuance date for subsequent event disclosure.
NOTE C – GOING CONCERN
As reflected in the accompanying financial statements, the Company has a working capital deficit of $774,578, an accumulated deficit of $2,124,004 as of December 31, 2010, and net losses for the years ended December 31, 2010 and 2009 of $459,472 and $444,081, respectively. The Company is currently seeking additional funding to expand its business model and support its operations. These issues raise substantial doubt about the Company’s ability to continue as a going concern. The Company’s ability to continue as a going concern is dependent on its ability to raise additional capital and implement its business plan. These financial statements do not include any adjustments to the recoverability and classification of recorded asset amounts and classification of liabilities that might be necessary should the Company be unable to continue as a going concern.
Management believes that actions presently being taken to obtain additional funding and implement its strategic plans provide the opportunity for the Company to continue as a going concern.
NOTE D – ACCOUNTS RECEIVABLE, NET
At December 31, 2010 and 2009, accounts receivable consisted of the following:
|
12/31/10
|
12/31/09
|
|||||||
|
Accounts receivable
|
$ | 240,636 | $ | 264,262 | ||||
|
Less: allowance for bad debts
|
(15,960 | ) | - | |||||
|
Accounts receivable, net
|
$ | 224,676 | $ | 264,262 | ||||
For the years ended December 31, 2010 and 2009, the Company recognized bad debt expense in the amount of $24,286 and $8,733, respectively.
F-10
NOTE E – INVENTORY
At December 31, 2010 and 2009, inventory consisted solely of finished goods as follows:
|
12/31/10
|
12/31/09
|
|||||||
|
Finished goods
|
$ | 475,786 | $ | 468,083 | ||||
The Company evaluates its inventory for excess and obsolescence on each balance sheet date. At December 31, 2010 and 2009, the Company did not identify any issues of excess and obsolete inventory.
NOTE F – PROPERTY, PLANT AND EQUIPMENT, NET
At December 31, 2010 and 2009, property, plant, and equipment consisted of the following:
|
12/31/10
|
12/31/09
|
|||||||
|
Furniture and fixtures
|
$ | 40,803 | $ | 28,955 | ||||
|
Assets not placed in service
|
70,000 | 56,250 | ||||||
|
Less: accumulated depreciation
|
(16,064 | ) | (9,582 | ) | ||||
|
Property, plant and equipment, net
|
$ | 94,739 | $ | 75,623 | ||||
Assets not placed in service include amounts paid for machinery and equipment that were not installed as of December 31, 2010 and 2009. These assets are composed of machinery for installation in a production line. These assets will be placed in service after the Company's ancillary production equipment has been installed in order to facilitate the operation. The Company expects to have these assets installed during the first quarter of fiscal 2012.
For the years ended December 31, 2010 and 2009, total depreciation expense was $10,899 and $8,126, respectively.
NOTE G – ACCRUED LIABILITIES
At December 31, 2010 and 2009, accrued liabilities consisted of the following:
|
12/31/10
|
12/31/09
|
|||||||
|
Accrued salaries and other compensation
|
$ | - | $ | 14,645 | ||||
|
Accrued interest and other
|
20,853 | 49,539 | ||||||
|
Severance liability
|
160,000 | - | ||||||
|
Total accrued liabilities
|
$ | 180,853 | $ | 64,184 | ||||
NOTE H – NOTES PAYABLE
The carrying value of notes payable at December 31, 2010 and 2009 consisted of the following:
|
12/31/10
|
12/31/09
|
|||||||
|
Tiegs, interest rate 12%~14%
|
$ | - | $ | 60,000 | ||||
|
Whitefield/McChesney, interest rate 30%
|
- | 45,000 | ||||||
|
Jenquin, interest rate 30%
|
- | 50,000 | ||||||
|
Wan-Yu, interest rate 12% ~14%
|
20,000 | 15,000 | ||||||
|
Hsiang, interest rate 14%
|
15,000 | - | ||||||
|
Yip, interest rate 18%
|
200,000 | - | ||||||
|
Zwest, interest rate 12%
|
- | 287,062 | ||||||
|
Notes payable – current portion
|
$ | 235,000 | $ | 457,062 | ||||
|
12/31/10
|
12/31/09
|
|||||||
|
Bootsma note, interest rate 5%
|
$ | 100,000 | $ | 100,000 | ||||
|
Note payable – long-term
|
$ | 100,000 | $ | 100,000 | ||||
F-11
On April 17, 2008 and June 6, 2008, the Company entered into two Promissory Notes for $30,000 and $30,000, respectively, with Tiegs, an individual, with an interest rates ranging from 12% to 14% per annum. The interest on the notes was payable in cash on a monthly basis. The principal on the notes were secured by the Company’s inventory and due on demand. As of December 31, 2009, the principal balance due to Tiegs was $60,000. The Company retired the notes with Tiegs by paying $30,000 and issuing 60,000 preferred shares in September 2010 valued at the grant date fair value of $0.50 per share.
On July 10, 2008, the Company entered into a Promissory Note for $50,000 with Whitefield/McChesney, individuals, with an interest rate of 30% per annum. Of the interest, 15% shall be paid in cash and 15% shall be paid with preferred stock at $0.50 per share for the period from January 1, 2009 to January 31, 2010. In 2008, the Company repaid $5,000 by issuing 10,000 preferred shares at the grant date fair value of $0.50 per share. This note was secured by the Company’s inventory and due in May 2010. As of December 31, 2009, the principal balance due to Whitefield/McChesney was $45,000. The Company fully repaid and retired the note with Whitefield/McChesney in July 2010.
On November 25, 2008, the Company entered into a Promissory Note for $50,000 with Jenquin, an individual, with an interest rate of 30% per annum. For the period between January 1, 2009 and January 31, 2010, 15% of the interest was paid in cash and 15% was paid with preferred stock at $0.50 per share. This note was secured by the Company’s inventory and due on demand. As of December 31, 2009, the principal balance due to Jenquin was $50,000. This note was fully repaid and retired in July 2010.
On July 15, 2009, the Company entered into a Promissory Note for $15,000 with Wan-Yu, an individual, with an interest rate of 12% per annum for the first month and an interest rate of 14% after the first month. The interest on the note is payable in cash on a monthly basis. This note is secured by the Company’s inventory and due on demand. As of December 31, 2010 and 2009, the principal balance due to Wan-Yu was $20,000 and $15,000, respectively. On August 1, 2011, the Company issued 10,000 shares of common stock to retire the $20,000 note with Wan-Yu.
On October 1, 2010, the Company entered into a Promissory Note for $15,000 with Hsiang, an individual, with an interest rate of 14% per annum. The interest on the note is payable in cash on a monthly basis. The maturity date of this note was April 1, 2011. As of December 31, 2010, the principal balance due to Hsiang was $15,000. On August 20, 2011, the Company issued 7,500 shares of common stock to retire the $15,000 note with Hsiang.
On December 15, 2010, the Company entered into a $200,000 Convertible Promissory Note with Yip, an individual, with an interest rate of 18% per annum. Of the interest, 14% shall was in cash and 4% was paid in the Company’s preferred shares at $0.50 per share. The convertible promissory note is convertible in whole or in part at the lender’s option into shares of the Company’s preferred stock at $0.50 per share. We evaluated the conversion feature of the note, and have deemed the conversion feature is not considered a derivative. The number of shares of Preferred Stock issuable upon conversion shall be determined by dividing the sum of the outstanding principal of this note being converted by $0.50 per preferred share. The maturity date of this note was June 30, 2011. On June 30, 2011, the $200,000 Yip note was converted into shares of the Company’s Preferred Stock at a price per share of $0.50 for an aggregate number of 400,000 shares as full and final repayment of the note.
On January 1, 2009, the Company entered into a Promissory Note in the principal amount of $100,000 with Bootsma, an individual, with an interest rate of 5% per annum to repurchase 1,000,000 shares of the Company’s Common Stock. The principal is due upon maturity of the note and interest is accrued monthly. The maturity date of this note is the earlier of the following:
|
a)
|
The date that is five years after the date of the agreement (January 1, 2014);
|
|
b)
|
The sale, conveyance or disposal of all or substantially all of the Company's property or business, or the Company's merger with or into or consolidation with any other corporation, or if the Company effects any other transaction or series of related transactions in which more than 50 percent of the voting stock of the Company is transferred, sold, or disposed of and the Company is not the survivor in such transaction or series of transactions;
|
|
c)
|
The liquidation, dissolution or indefinite cessation of the business operations of the Company;
|
|
d)
|
The execution by the Company of a general assignment for the benefit of creditors or the appointment of a receiver or trustee to take possession of the property or assets of the Company; or
|
|
e)
|
A firm commitment for an underwritten public offering by the Company of shares of its Common Stock.
|
F-12
On March 31, 2009, the Company entered into a Promissory Note with Zwest, the Company’s vendor in China, for $287,062, with an interest rate of 12% per annum. The maturity date of this note was December 31, 2009. As of December 31, 2009, the Company was in default. In 2010, the Company paid off the $287,062 Promissory Note and Zwest agreed to provide the Company with a new payment arrangement for the remaining accounts payable outstanding with an interest rate of 12% per annum. The terms of the payment arrangement are as follows.
For goods shipped before June 30, 2010:
(a) All payable amounts from 0 - 45 days of shipping are considered regular trade payables and are not subject to the 12% interest;
(b) Payable amounts greater than 45 days are subject to the payment arrangement and are assessed a 12% interest rate.
For goods shipped after June 30, 2010:
(a) All payable amounts from 0 -75 days of shipping are considered regular trade payables and are not subject to the 12% interest;
(b) Payable amounts greater than 75 days are subject to the payment arrangement and are assessed a 12% interest rate.
On June 30, 2011, the Company entered into a Promissory Note with Zwest whereby Zwest agreed to convert $450,000 of the inventory payable balance to a long-term note with interest payable monthly at 18% per annum with the principal due in full on September 30, 2012.
As of December 31, 2010 and 2009, the balances due Zwest are as follows:
|
12/31/10
|
12/31/09
|
|||||||
|
Accounts payable – Zwest
|
$ | 801,531 | $ | 110,388 | ||||
|
Promissory note
|
- | 287,062 | ||||||
|
Total amounts due to Zwest
|
$ | 801,531 | $ | 397,450 | ||||
NOTE I – RELATED-PARTY TRANSACTIONS
|
12/31/10
|
12/31/09
|
|||||||
|
Notes payable- Huang, interest rate 14%
|
$ | - | $ | 160,000 | ||||
|
Notes payable- Collins, interest rate 12%
|
145,679 | 240,679 | ||||||
|
Accrued interest, Collins
|
59,096 | 59,096 | ||||||
|
Amount due to related parties
|
$ | 204,775 | $ | 459,775 | ||||
F-13
On October 1, 2010, the Company entered into two Promissory Notes for $110,000 and $50,000 with Huang, an employee of the Company, with an interest rate of 14% per annum for the cash advances received in 2009. The interest on these notes was paid in cash on a monthly basis. These notes were due on demand. As of December 31, 2009, the principal balance due to Huang was $160,000. These notes were fully repaid and retired at December 31, 2010.
On August 15, 2008, the Company entered into a Promissory Note for $431,925 with William Collins, the Company’s CEO, with an interest rate of 12% per annum. The interest on the note is payable in cash on a monthly basis. This note is unsecured, and due on demand. As of December 31, 2010 and 2009, the balance due to Collins was $204,775 and $299,775, respectively, of which $59,096 is accrued interest for both periods.
NOTE J – INCOME TAXES
No provision for federal income taxes has been recognized for the years ended December 31, 2010 and 2009 as the Company incurred a net operating loss for income tax purposes in each year and has no carry-back potential.
Deferred income taxes reflect the net tax effects of temporary differences between the carrying amounts of assets and liabilities for financial reporting purposes and the amounts used for income tax purposes. The Company assesses whether it is more likely than not that it will generate sufficient taxable income to realize its deferred income tax assets in a reasonable period of time. In making this determination, it considers all available positive and negative evidence and makes certain assumptions, including, among other things, the deferred tax liabilities; the overall business environment; the historical earnings and losses; and its outlook for future years. At December 31, 2010 and 2009, the deferred tax assets consisted mainly of the net operating losses carried over from the prior years and the Company provided a full valuation allowance for its deferred tax assets, as it is more likely than not that these assets will not be realized in a reasonable period of time.
Reconciliation between actual tax expense (benefit) and income taxes computed by applying the U.S. federal income tax rate and state income tax rate to income from continuing operations before income taxes are as follows:
|
12/31/10
|
12/31/09
|
|||||||
|
Computed at U.S. and State statutory rates (34%)
|
$ | (147,844 | ) | $ | (78,608 | ) | ||
|
Stock-based compensation
|
10,662 | 26,093 | ||||||
|
Other differences
|
(527 | ) | (967 | ) | ||||
|
Change in valuation allowance
|
137,709 | 53,482 | ||||||
|
Total
|
$ | - | $ | - | ||||
Tax effects of temporary differences that give rise to significant portions of the deferred tax assets and deferred liabilities are presented below:
|
12/31/10
|
12/31/09
|
|||||||
|
Deferred tax assets
|
$ | 461,526 | $ | 323,817 | ||||
|
Less valuation allowance
|
(461,526 | ) | (323,817 | ) | ||||
|
Net deferred tax assets
|
$ | - | $ | - | ||||
At December 31, 2010, the Company had net operating loss carry-forwards for federal and state income tax purposes of approximately $1,357,000 which will begin to expire, if unused, in 2026. The valuation allowance increased $137,709 and $53,482 for the years ended December 31, 2010 and 2009, respectively.
The above estimates are based upon management's decisions concerning certain elections which could change the relationship between net income and taxable income. Management decisions are made annually and could cause the estimates to vary significantly.
F-14
NOTE K – COMMITMENTS AND CONTINGENCIES
Lease Commitments
The Company leases certain buildings, equipment and vehicles under non-cancelable operating leases. Total rent expense related for the years ended December 31, 2010 and 2009 are $58,658 and $89,859, respectively.
Minimum future lease payments under non-cancelable lease agreements at December 31, 2010 are as follows:
|
2011
|
$ | 18,360 | ||
|
Total
|
$ | 18,360 |
In April 2011, the Company entered non-cancelable warehouse leases. Minimum future lease payments under non-cancelable lease agreements totaled $485,212.
|
2011
|
$ | 60,928 | ||
|
2012
|
93,220 | |||
|
2013
|
96,016 | |||
|
2014
|
98,897 | |||
|
2015 and thereafter
|
136,151 | |||
|
Total
|
$ | 485,212 |
Litigation
The Company was involved in two cases, which have been consolidated in Multnomah County Circuit Court for the State of Oregon: (1) Trellis Earth Products, Inc. v. Randall R. Reed and Jon Holt, Multnomah County Circuit Court Case No. 1007-11053 (the “Trellis Earth Litigation”); and (2) Randall Reed v. Trellis Earth Products, Inc., Multnomah County Circuit Court Case No. 1008-11577 (the “Reed Litigation”).
Two former employees of the Company, Randall Reed and John Holt, were seeking to recover from the Company alleged wages and other purported employment benefits that were due upon their termination.
In June 2011, the Company reached a settlement with Randall R. Reed and Jon Holt, former employees of the Company, to resolve all matters related to the lawsuit against the Company. Under the terms of the settlement, without admitting fault or liability of any kind, the Company has agreed to pay in installments a total of $159,416 to Randall R. Reed and Jon Holt and their attorneys. These individuals have agreed to dismiss the lawsuits with no ability to reassert its claims against the Company. Additionally, Randall R. Reed, Jon Holt and the Company have agreed to release each other from all claims arising out of or related to the lawsuit. An estimate of $160,000 for the settlement was accrued by the Company at December 31, 2010.
The following table is the payment schedule related to the settlement:
|
2011
|
$ | 99,416 | ||
|
2012
|
60,000 | |||
|
Total
|
$ | 159,416 |
F-15
NOTE K – CONCENTRATION RISKS
The Company primarily engages in the distribution of bio-plastic products in the United States from a supplier in China. The Company’s products are mainly sold to domestic distributors. The following tables depict revenues and expenditures to major customers and suppliers with greater than 10% of their respective totals.
a. Major Customers
The following table summarizes sales to major customers (each 10% or more of revenues):
|
Revenue from
|
Receivable as
|
Percentage of
|
||||||||||
|
Year ended December 31, 2010
|
the customer
|
of 12/31/10
|
total sales
|
|||||||||
|
Bunzl and its affiliates
|
$ | 1,719,813 | $ | 191,702 | 64 | % | ||||||
|
Unified Management
|
260,701 | 435 | 10 | % | ||||||||
|
Revenue from
|
Receivable as
|
Percentage of
|
||||||||||
|
Year ended December 31, 2009
|
the customer
|
of 12/31/09
|
total sales
|
|||||||||
|
Bunzl and its affiliates
|
$ | 1,549,187 | $ | 190,083 | 71 | % | ||||||
Over 50% of our revenue is derived from Bunzl Distribution USA, Inc. (Bunzl) and its affiliates. If Bunzl were to terminate or materially reduce, for any reason, its business relationship with us, our operating results would be materially harmed.
b. Major Suppliers
The table following summarizes purchases from major suppliers (each 10% or more of purchases):
|
Purchases from
|
Payable as
|
Percentage of
|
||||||||||
|
Year ended December 31, 2010
|
the vendor
|
of 12/31/10
|
total purchases
|
|||||||||
|
Zwest
|
$ | 1,554,389 | $ | 801,531 | 99 | % | ||||||
|
Purchases from
|
Payable as
|
Percentage of
|
||||||||||
|
Year ended December 31, 2009
|
the vendor
|
of 12/31/09
|
total purchases
|
|||||||||
|
Zwest
|
$ | 1,371,356 | $ | 397,450 | 99 | % | ||||||
The Company is dependent upon a single manufacturer, located in the People’s Republic of China (the "PRC"), for over 90% of the products the Company sells. Each shipment of the products could be delayed, waylaid, rerouted, stolen, lost or damaged, each of which could affect the performance and profitability of the Company. The Company may also face increased pressure for the supply of finished products that are produced by the manufacturer, as a result of increased demand and competitors seeking to displace the Company. The Company may also face pressure by the manufacturer to pay the outstanding amounts due before any shipments of products are made to the Company. This would substantially inhibit our ability to deliver product to our customers.
F-16
NOTE L – STOCKHOLDERS' EQUITY
Stock Split
In August 2011, the Company reincorporated under the laws of the State of Nevada. In connection with the reincorporation, the Company became authorized to issue 120,000,000 shares, of which 100,000,000 shares are designated as common stock, $0.001 par value, and 20,000,000 shares are designated as preferred stock, $0.001 par value. As of September 15, 2011, the Company effected a one-for-two reverse stock split of its outstanding common stock. All share and per share amounts for all periods presented in these financial statements and notes thereto, have been adjusted retroactively, where applicable, to reflect the reverse stock split.
Common Stock
The Company has 100,000,000 shares of Common Stock authorized. Each share of Common Stock has a par value of $0.001.
From time to time, we issue Common Stock as compensation to employees and outside consultants for their services provided to the Company.
During the year ended December 31, 2009, the Company granted 222,500 fully vested shares of Common Stock to key employees as compensation with an aggregate fair value of $222,500 which was expensed in the period they were granted.
During the years ended December 31, 2010 and 2009, the Company granted 56,000 shares and 67,125 shares of Common Stock to non-employees for services with an aggregate fair value of $56,000 and $67,125, respectively.
Preferred Stock:
The Company has 20,000,000 shares of Preferred Stock authorized. Each share of the Preferred Stock has a par value of $0.001. Prior to the Company’s reincorporation under the laws of the State of Nevada in August 2011, 8,000,000 of these preferred shares were designated as Seed Series Preferred Stock and were convertible into the Company’s common shares at the option of the holder at an initial conversion price of $1.00 per share (effective as of the Company’s reincorporation under the laws of the State of Nevada, no shares of Preferred Stock have been designated). The conversion price was subject to adjustment if the Company issues any additional preferred shares for less than $1.00 per share. The holders of Seed Series Preferred Stock were entitled to receive dividends at a rate of $0.06 per share per annum on each outstanding share of Seed Series Preferred Stock, payable quarterly when, as and if declared by the Board of Directors. Such dividends were to be cumulative. The Company evaluated the conversion feature of Seed Series Preferred Stock under ASU 815-15 and concluded the conversion feature qualifies for derivative accounting. For the period these Seed Series Preferred Stock are outstanding, we concluded the mark to market adjustment to be insignificant to our financial statements. On August 3, 2011, all preferred stock were converted to 906,609 shares of common stock at $1.00 per share.
During the year ended December 31, 2009, 178,488 shares of Convertible Preferred Stock were issued at their grant date fair value of $0.50 per share to repay an outstanding loan in the amount of $75,000 and accrued interest of $14,244.
In 2010, the Company issued 128,843 shares of Convertible Preferred Stock at their grant date fair value of $0.50 per share to repay an outstanding loan in the amount of $30,000 and its outstanding rent in the amount of $34,420.
Treasury Stock:
On January 1, 2009, the Company entered into a Promissory Note for $100,000 with Ernie Bootsma, an individual, with an interest rate of 5% per annum to acquire 1,000,000 shares of the Company’s Common Stock. These shares are held in treasury by the Company at December 31, 2010 and 2009.
F-17
NOTE M – SUBSEQUENT EVENTS
Effective June 30, 2011, the $200,000 Yip note was converted into shares of the Company’s Seed Series Preferred Stock at the grant date fair value of $0.50 per share for an aggregate number of 400,000 shares as the full and final repayment of the note.
On August 3, 2011, the Company converted all of its outstanding Convertible Preferred Stock into 906,609 shares of the Company’s Common Stock.
Subsequent to December 31, 2010, through September 21, 2011, the Company issued 537,786 common shares and received gross proceeds of $1,075,572. Of these 537,786 shares, 25,000 shares were sold to Neil Nelson, a director of the Company, for a purchase price of $50,000. The remaining 512,786 shares were sold to unrelated third parties.
On June 30, 2011, the Company entered into a Promissory Note with Zwest whereby Zwest agreed to convert $450,000 of the inventory payable balance to a long term note with an interest rate of 18% and a maturity date of September 30, 2012.
On August 1, 2011, the Company issued 10,000 shares of common stock to retire the $20,000 note issued to Wan-Yu.
On August 20, 2011, the Company issued 7,500 shares of common stock to retire the $15,000 note issued to Hsiang.
On September 15, 2011 the Company granted Michael Senzaki the Company's Chief Financial Officer and Chief Operating Officer 100,000 shares of Common Stock as compensation valued at $200,000 on the date of grant.
On September 15, 2011, the Company adopted and the stockholders approved the Company’s 2011 Employee Stock Option Plan. Under the Plan, options may be granted which are intended to qualify as Incentive Stock Options under Section 422 of the Internal Revenue Code of 1986 or which are not intended to qualify as Incentive Stock Options thereunder. The maximum number of options made available for issuance under the Plan are one million two hundred and fifty thousand (1,250,000) options. The options may be granted to officers, directors, employees or consultants of the Company and its subsidiaries at not less than 100% of the fair market value on the date on which the options are granted. The term of each Option granted under the Plan shall be contained in a stock option agreement between the Optionee and the Company. The Board of Directors or a committee thereof, administers all of the equity incentive plans and determines the terms of options granted, including the exercise price, the number of shares subject to individual option awards and the vesting period of options, within the limits set forth in the Plan. Options have a maximum term of 10 years and vest as determined by the Board of Directors.
On September 16, 2011 the board approved the issuance of 995,000 options of the Company’s common stock to various employees , officers and directors of the company at an exercise price of $2.00. Options issued to outside directors vested upon their agreement to serve, options granted to employee and officers vest over three years, all options granted have an expiration term of 10 years. The total value of options granted was $2,110,332 at the grant date. The Company measured the value of options using the Black Scholes option model using the following assumptions; an expected dividend yield of 0%, estimated volatility of 59.65% and a risk free interest rate of 0.31% commensurate with the term.
F-18
TRELLIS EARTH PRODUCTS, INC.
BALANCE SHEETS
(Unaudited)
|
September 30,
|
December 31,
|
|||||||
|
ASSETS
|
2011
|
2010
|
||||||
|
CURRENT ASSETS:
|
||||||||
|
Cash and cash equivalents
|
$ |
88,825
|
$ |
21,954
|
||||
|
Accounts receivable, net
|
323,508
|
224,676
|
||||||
|
Inventory, net
|
436,912
|
475,786
|
||||||
|
Prepaid expenses and other current assets
|
9,063
|
8,963
|
||||||
|
Total current assets
|
858,308
|
731,379
|
||||||
|
PROPERTY, PLANT AND EQUIPMENT, NET
|
101,904
|
94,739
|
||||||
|
TOTAL ASSETS
|
$
|
960,212
|
$
|
826,118
|
||||
|
LIABILITIES AND STOCKHOLDERS’ DEFICIT
|
||||||||
|
CURRENT LIABILITIES:
|
||||||||
|
Accounts payable – trade
|
$
|
41,428
|
$
|
83,798
|
||||
|
Accounts payable – Zwest
|
309,803
|
801,531
|
||||||
|
Accrued liabilities
|
183,748
|
180,853
|
||||||
|
Notes payable – current portion
|
450,000
|
235,000
|
||||||
|
Note payable – related party
|
145,679
|
145,679
|
||||||
|
Accrued interest – related party
|
59,096
|
59,096
|
||||||
|
Total current liabilities
|
1,189,754
|
1,505,957
|
||||||
|
Notes payable – long term
|
100,000
|
100,000
|
||||||
|
TOTAL LIABILITIES
|
1,289,754
|
1,605,957
|
||||||
|
Commitments and contingencies
|
-
|
-
|
||||||
|
STOCKHOLDERS’ DEFICIT:
|
||||||||
|
Preferred stock, $0.001 par value, 20,000,000 shares authorized,
|
||||||||
|
8,000,000 seed series convertible preferred stock designated,
|
||||||||
|
0 and 1,399,331 seed series shares issued and outstanding,
|
||||||||
|
respectively
|
-
|
1,399
|
||||||
|
Common stock, $0.001 par value, 100,000,000 shares authorized
|
||||||||
|
6,493,345 and 4,807,750 shares issued, respectively and
|
||||||||
|
5,493,345 and 3,807,750 shares outstanding, respectively
|
6,493
|
4,808
|
||||||
|
Additional paid-in capital
|
3,139,570
|
1,437,958
|
||||||
|
Treasury stock, at cost, 1,000,000 shares
|
(100,000
|
)
|
(100,000
|
)
|
||||
|
Accumulated deficit
|
(3,375,605)
|
(2,124,004
|
)
|
|||||
|
Total stockholders’ deficit
|
(329,542
|
)
|
(779,839
|
)
|
||||
|
TOTAL LIABILITIES AND STOCKHOLDERS’ DEFICIT
|
$
|
960,212
|
$
|
826,118
|
||||
The accompanying notes are an integral part of these financial statements.
F-19
TRELLIS EARTH PRODUCTS, INC.
STATEMENTS OF OPERATIONS
For the Nine Months Ended September 30, 2011 and 2010
(Unaudited)
|
September 30,
|
September 30,
|
|||||||
|
2011
|
2010
|
|||||||
|
REVENUES
|
$
|
2,151,837
|
$
|
1,987,085
|
||||
|
COST OF REVENUES
|
1,517,792
|
1,345,832
|
||||||
|
634,045
|
641,253
|
|||||||
|
GROSS PROFIT
|
||||||||
|
OPERATING EXPENSES:
|
||||||||
|
Selling, general and administrative expenses
|
1,753,310
|
623,608
|
||||||
|
Research and development expenses
|
45,600
|
31,000
|
||||||
|
Depreciation expense
|
9,422
|
6,492
|
||||||
|
LOSS FROM OPERATIONS
|
(1,174,287)
|
(19,847
|
)
|
|||||
|
OTHER EXPENSE:
|
||||||||
|
Interest expense
|
(77,314)
|
(52,607
|
)
|
|||||
|
NET LOSS
|
$
|
(1,251,601)
|
$
|
(72,454)
|
||||
|
Net loss per share – basic and diluted
|
$
|
(0.30)
|
$
|
(0.02)
|
||||
|
Weighted average common shares outstanding – basic and diluted
|
4,227,783
|
4,773,812
|
||||||
The accompanying notes are an integral part of these financial statements.
F-20
TRELLIS EARTH PRODUCTS, INC.
STATEMENTS OF CASH FLOWS
For the Nine Months Ended September 30, 2011 and 2010
(Unaudited)
|
September 30,
|
September 30,
|
|||||||
|
2011
|
2010
|
|||||||
|
CASH FLOWS FROM OPERATING ACTIVITIES:
|
||||||||
|
Net loss
|
$
|
(1,251,601)
|
$
|
(72,454
|
)
|
|||
|
Adjustments to reconcile net loss to net cash provided by(used in)
|
||||||||
|
operating activities:
|
||||||||
|
Depreciation expense
|
9,422
|
6,492
|
||||||
|
Stock-based compensation
|
473,529
|
56,000
|
||||||
|
Preferred stock issued for rent
|
- |
34,420
|
||||||
|
Changes in operating assets and liabilities:
|
||||||||
|
Accounts receivable
|
(98,832
|
)
|
(194,177)
|
|||||
|
Inventory
|
38,874
|
119,387
|
||||||
|
Prepaid expenses and other current assets
|
(100)
|
430
|
||||||
|
Accounts payable – trade
|
(42,369)
|
734,192
|
||||||
|
Accounts payable – Zwest
|
(41,728)
|
(193,367)
|
||||||
|
Accrued liabilities
|
9,838
|
(64,184)
|
||||||
|
CASH PROVIDED BY (USED IN) OPERATING ACTIVITIES
|
(902,967)
|
426,739
|
||||||
|
CASH FLOWS FROM INVESTING ACTIVITIES:
|
||||||||
|
Purchases of property, plant and equipment
|
(16,587)
|
(16,667
|
)
|
|||||
|
CASH USED IN INVESTING ACTIVITIES
|
(16,587)
|
(16,667
|
)
|
|||||
|
CASH FLOWS FROM FINANCING ACTIVITIES:
|
||||||||
|
Proceeds from sales of common stock, net of offering costs
|
986,425
|
-
|
||||||
|
Payments of notes payable
|
-
|
(412,062
|
)
|
|||||
|
Payments of related party debt
|
-
|
(15,000
|
)
|
|||||
|
Borrowing on related party debt
|
-
|
3,000
|
||||||
|
CASH PROVIDED BY(USED IN) FINANCING ACTIVITIES
|
986,425
|
(424,062
|
)
|
|||||
|
NET CHANGE IN CASH
|
66,871
|
(13,990
|
) | |||||
|
CASH AT BEGINNING OF THE PERIOD
|
21,954
|
38,405
|
||||||
|
CASH AT PERIOD END
|
$
|
88,825
|
$
|
24,415
|
||||
|
Supplemental information:
|
||||||||
|
Cash paid for taxes
|
$
|
-
|
$
|
-
|
||||
|
Cash paid for interest
|
- |
54,806
|
||||||
|
None cash investing and financing activities:
|
||||||||
|
Conversion of accounts payable to note payable
|
$
|
450,000
|
$
|
-
|
||||
|
Issuance of common stock to retire notes payable
|
35,000
|
- | ||||||
|
Conversion of note payable and accrued interest to preferred stock
|
206,943
|
30,000
|
||||||
The accompanying notes are an integral part of these financial statements.
F-21
TRELLIS EARTH PRODUCTS, INC.
NOTES TO FINANCIAL STATEMENTS
(Unaudited)
NOTE A – DESCRIPTION OF BUSINESS AND BASIS OF PRESENTATION
|
1.
|
Nature of operations
|
Trellis Earth Products, Inc. (the “Company”) is an Oregon corporation incorporated on December 5, 2006. The Company reincorporated in the State of Nevada on August 8, 2011. The Company engages in the distribution and sale of starch-based biodegradable disposable containers, tableware, and packaging materials. The Company offers its customers starch-based food and beverage containers and utensils made from biodegradable material, including cups, plates, and bowls; and traveling, picnic, and outdoor tableware products.
|
2.
|
Basis of presentation
|
The accompanying unaudited interim financial statements as of September 30, 2011 and December 31, 2010 and for the nine months ended September 30, 2011 and 2010 have been prepared in accordance with accounting principles generally accepted in the United States of America ("US GAAP") for interim financial information, and pursuant to the instructions to Form 10-Q and Article 8 of Regulation S-X of the Securities and Exchange Commission ("SEC") an on the same basis as the annual audited financial statements. The financial statements as of and for the nine months ended September 30, 2011 and 2010 are unaudited. In the opinion of the management, these financial statements included all adjustments, which, unless otherwise disclosed, are of a normal recurring nature, necessary for a fair presentation of the financial position, results of operations, and cash flows for the period presented.
The results for interim periods are not necessary indicative of results for the entire year. The balance sheet at December 31, 2010 has been derived from audited financial statements; however, the notes to the financial statements do not include all of the information and notes required by accounting principles generally accepted in the United States of America for complete financial statements. The accompanying unaudited interim financial statements should be read in conjunction with the financial statements and noted thereto included in the audited financial statements presented elsewhere herein.
As of September 15, 2011, the Company effected a one-for-two reverse stock split of its outstanding common stock. Accordingly, all share and per share amounts for all periods presented in these financial statements and notes thereto, have been adjusted retroactively, where applicable, to reflect this reverse stock split.
|
3.
|
Use of Estimates
|
The preparation of financial statements in conformity with generally accepted accounting principles requires management to make estimates and assumptions that affect the reported amounts of assets and liabilities and the disclosure of contingent assets and liabilities at the date of the financial statements and that affect the reported amounts of revenues and expenses during the reporting period. Significant estimates include those with respect to the fair value of financial instruments, contingencies for litigation, collectability of receivables and stock-based compensation. Actual results could differ from those estimates.
NOTE B – SUMMARY OF SIGNIFICANT ACCOUNTING POLICIES
|
1.
|
Cash and Cash Equivalents
|
We consider short term, highly liquid investments that have an original maturity of three months or less to be cash equivalents.
|
2.
|
Accounts Receivable and Allowance for Doubtful Accounts
|
The allowance for doubtful accounts is based on the Company’s past experience and other factors which, in management's judgment, deserve current recognition in estimating bad debts. Such factors include growth and composition of accounts receivable, the relationship of the allowance for doubtful accounts to accounts receivable and current economic conditions. The determination of the collectability of amounts due from customer accounts requires the Company to make judgments regarding future events and trends. Allowance for doubtful accounts is determined based on assessing the Company’s portfolio on an individual customer and on an overall basis. This process consists of a review of historical collection experience, current aging status of the customer accounts, and the financial condition of Trellis’s customers. Based on a review of these factors, the Company establishes or adjusts the allowance for specific customers and the accounts receivable portfolio as a whole. At September 30, 2011 and December 31, 2010, allowance for doubtful accounts totaled $15,960 for both periods.
|
3.
|
Inventory
|
Inventory is stated at the lower of cost or market. Cost is determined using the average cost method and it includes the costs from manufacturers, and inbound freight. Appropriate consideration is given to obsolescence, excess quantities and other factors in evaluating the net realizable value. The Company determines reserves for inventory based on the historical usage of inventory, age of inventory on hand, assumptions about future demand and market conditions, and estimates about potential alternative uses, which are usually limited.
|
4.
|
Property, Plant and Equipment
|
Property, plant and equipment are stated at cost. Additions of new equipment and major renewals and replacements of existing equipment are capitalized. Repairs and minor replacements are charged to operations as incurred. Cost and accumulated depreciation and amortization are removed from the accounts when assets are sold or retired, and the resulting gains or losses are included in operations.
F-22
Depreciation of property, plant and equipment is provided using the straight-line method applied to the expected useful lives of the assets:
|
Estimated useful lives (years)
|
|
|
Machinery and equipment
|
3 – 7 years
|
|
Office furniture, fixtures and fittings
|
3 – 5 years
|
|
5.
|
Fair Value of Financial Instruments
|
The Company measures fair value in accordance with ASC Topic 820, Fair Value Measurements and Disclosures (ASC 820”) which defines fair value, establishes a framework for measuring fair value, establishes a fair value hierarchy based on the quality of inputs used to measure fair value and enhances disclosure requirements for fair value measurements. ASC 820 defines fair value as the price that would be received to sell an asset or paid to transfer a liability in an orderly transaction between market participants at the measurement date (exit price).
|
6.
|
Income Taxes
|
The Company uses the asset and liability method of accounting for income taxes. Under this method, it records deferred income taxes based on temporary differences between the financial reporting and tax bases of assets and liabilities and uses enacted tax rates and laws that the Company expects will be in effect when it recovers those assets or settles those liabilities, as the case may be, to measure those taxes. The Company reviews deferred tax assets for a valuation allowance based upon whether it is more likely than not that the deferred tax asset will be fully realized.
The Company recognizes the financial statement benefit of a tax position only after determining that the relevant tax authority would more likely than not sustain the position following an audit. For tax positions meeting the more-likely-than-not threshold, the amount recognized in the financial statements is the largest benefit that has a greater than 50 percent likelihood of being realized upon ultimate settlement with the relevant tax authority. As of September 30, 2011, the Company did not identify any uncertain tax positions.
The Company’s policy is to include interest and penalties related to unrecognized tax benefits within the income tax expense (benefit) line item in the statement of operations.
|
7.
|
Revenue and Cost Recognition
|
The Company generates revenues principally by the sale of disposable products for the food service industry. Revenue is recognized when the products being sold have been shipped, title and risk of loss have been transferred, collectability is probable and pricing is fixed. Title and risk of loss is determined by the terms and conditions of each sale. The majority of the Company's sales are to distributors in the United States. The Company delivers its products to the customers through either shipments from the Company's distribution center in Portland, Oregon or direct shipments from the vendor's manufacturing facility in China. For the nine months ended September 30, 2011 and 2010, approximately 55% and 81%, respectively, of the Company's revenue was derived from shipments made from Portland Oregon. For the nine months ended September 30, 2011 and 2010, approximately 45% and 19%, respectively, of the Company's revenue was derived from direct shipments from China. Revenues for the direct shipments are recognized when the customers received shipments. There are no provisions with the Company's distributors for returns without cause, and payment is due within 30 - 35 days from the date of transfer of title. The Company has not had any material collections issues with any of its distributors.
Beginning in March 2011, an affiliate of the Company's largest distributor, Bunzl, takes title to shipments in China. Under this arrangement, the Company recognizes revenue when title and risk of loss are transferred and when shipments are delivered to the customer’s facility in China. Payments for these sales are due 30 - 35 days from the date of transfer of title.
The Company’s cost of revenues includes cost of products purchased for distribution, inbound freight charges, purchasing and receiving costs, and the cost of internal inspection and quality control, depreciation of manufacturing assets and all direct costs related to related to distribution of the Company’s products.
The Company’s selling, general and administrative expenses include payroll and associated costs, advertising, professional fees and other corporate administrative costs. Selling, general and administrative expenses also include depreciation and amortization expense for assets.
|
8.
|
Advertising Costs
|
The Company expenses advertising costs as incurred. For the nine months ended September 30, 2011 and 2010, advertising expense was $17,661 and $6,873, respectively.
|
9.
|
Earnings (loss) per Share of Common Stock
|
Basic and diluted net income per share calculations are calculated on the basis of the weighted average number of shares of the Company's common stock outstanding during the year. Purchases of treasury stock reduce the outstanding shares commencing on the date that the stock is purchased. Common stock equivalents are excluded from the calculation when a loss is incurred as their effect would be anti-dilutive. As of September 30, 2011, the Company has 995,000 options outstanding, and as of December 31, 2010, no options or warrants were outstanding. The options outstanding as of September 30, 2011 are excluded from the calculation of diluted earnings per share because their inclusion would be anti-dilutive.
F-23
As of December 31, 2010, the Company had 1,399,331 shares of Convertible Preferred Stock outstanding, which could be converted to Common Stock on a 2 to 1 basis. As of September 30, 2011, all Convertible Preferred Stock has been converted to Common Stock. As of December 31, 2010, the Company had convertible debt that can be converted 400,000 shares of Convertible Preferred Stock. As the effect of these common stock equivalents would have been anti-dilutive, we have excluded all of these dilutive securities in our calculation of diluted earnings per share for the years ending September 30, 2011 and December 31, 2010.
|
10.
|
Stock-based Compensation
|
The Company accounts for share-based awards issued to employees and non-employees in accordance with FASB ASC 718. Accordingly, employee share-based payment compensation is measured at the grant date, based on the fair value of the award, and is recognized as an expense over the requisite service period. Additionally, share-based awards to non-employees are expensed over the period in which the related services are rendered at their fair value.
|
11.
|
Research and Development Expenses
|
Research and development expenses are costs associated with developing the Company’s intellectual property. Research and development costs are expensed as incurred. Research and development expenses for the nine months ended September 30, 2011 and 2010 were $45,600 and $31,000, respectively.
|
12.
|
Concentrations
|
Trade accounts receivables are typically generated from companies with distribution operations, which would be impacted by conditions relative to the U.S. economy in general. During the nine months ended September 30, 2011, 59% and 19% of revenues were attributable to two customers, respectively, and in the same period as of September 30, 2010, 66% of revenues were attributable to one customer. The Company performs ongoing credit evaluations of its customers and, generally, requires no collateral. The Company is not aware of any significant credit risk relating to these customers and has not experienced any credit loss associated with such receivables.
|
13.
|
Recent Accounting Pronouncements Adopted
|
In January 2010, the Financial Accounting Standards Board (FASB) issued Accounting Standards Update (ASU) 2010-06, “Improving Disclosures About Fair Value Measurements” (ASU 2010-06), which amends the Fair Value Measurements and Disclosures Topic of the ASC (ASC Topic 820). Among other provisions, ASC Topic 820 establishes a fair value hierarchy that prioritizes the relative reliability of inputs used in fair value measurements. The hierarchy gives highest priority to Level 1 inputs that represent unadjusted quoted market prices in active markets for identical assets and liabilities that the reporting entity has the ability to access at the measurement date. Level 2 inputs are directly or indirectly observable inputs other than quoted prices included within Level 1. Level 3 inputs are unobservable inputs and have the lowest priority in the hierarchy. This amendment requires new disclosures on the value of, and the reason for, transfers in and out of Levels 1 and 2 of the fair value hierarchy and additional disclosures about purchases, sales, issuances and settlements within Level 3 fair value measurements. ASU 2010-06 also clarifies existing disclosure requirements on levels of disaggregation and about inputs and valuation techniques. ASU 2010-06 is effective for interim and annual reporting periods beginning after December 15, 2009, except for the requirement to provide additional disclosures regarding Level 3 measurements which is effective for interim and annual reporting periods beginning after December 15, 2010.
|
14.
|
Subsequent Events
|
The Company evaluated all transactions from September 30, 2011 through January 18, 2012, the financial statement issuance date for subsequent event disclosure.
F-24
NOTE C – GOING CONCERN
As reflected in the accompanying financial statements, the Company has a working capital deficit of $331,446, an accumulated deficit of $3,375,605as of September 30, 2011, and net losses for the nine months ended September 30, 2011 and 2010 of $1,251,601 and $72,454, respectively. The Company is currently seeking additional funding to expand its business model and support its operations. These issues raise substantial doubt about the Company’s ability to continue as a going concern. The Company’s ability to continue as a going concern is dependent on its ability to raise additional capital and implement its business plan. These financial statements do not include any adjustments to the recoverability and classification of recorded asset amounts and classification of liabilities that might be necessary should the Company be unable to continue as a going concern.
Management believes that actions presently being taken to obtain additional funding and implement its strategic plans provide the opportunity for the Company to continue as a going concern.
F-25
NOTE D – ACCOUNTS RECEIVABLE, NET
At September 30, 2011 and December 31, 2010, accounts receivable consisted of the following:
|
9/30/11
|
12/31/10
|
|||||||
|
Accounts receivable
|
$
|
339,468
|
$
|
240,636
|
||||
|
Less: allowance for bad debts
|
(15,960
|
)
|
(15,960
|
)
|
||||
|
Accounts receivable, net
|
$
|
323,508
|
$
|
224,676
|
||||
For the nine months ended September 30, 2011 and 2010, the Company did not incur any bad debt expense.
NOTE E – INVENTORY, NET
At September 30, 2011 and December 31, 2010, inventory consisted solely of finished goods as follows:
|
9/30/11
|
12/31/10
|
|||||||
|
Finished goods
|
$
|
446,687
|
$
|
475,786
|
||||
|
Less: allowance for inventory obsolescence
|
(9,775)
|
-
|
||||||
|
Inventory, net
|
$
|
436,912
|
$
|
475,786
|
||||
The Company evaluates its inventory for excess and obsolescence on each balance sheet date and identified $9,775 of slow moving inventory to be reserved at September 30, 2011. At December 31, 2010, the Company did not identify any issues of excess and obsolete inventory.
NOTE F – PROPERTY, PLANT AND EQUIPMENT, NET
At September 30, 2011 and December 31, 2010, property, plant, and equipment consisted of the following:
|
9/30/11
|
12/31/10
|
|||||||
|
Furniture and fixtures
|
$
|
57,390
|
$
|
40,803
|
||||
|
Assets not placed in service
|
70,000
|
70,000
|
||||||
|
Less: accumulated depreciation
|
(25,486
|
)
|
(16,064
|
)
|
||||
|
Property, plant and equipment, net
|
$
|
101,904
|
$
|
94,739
|
||||
Assets not placed in service include amounts paid for machinery and equipment that were not installed as of September 30, 2011 and December 31, 2010. The assets are comprised of machinery for installation in a production line. These assets will be placed in service after the Company's ancillary production equipment has been installed in order to facilitate the operation. The Company expects to have these assets installed during the first quarter of fiscal 2012.
For the nine months ended September 30, 2011 and 2010, total depreciation expense was $9,422 and $6,492, respectively.
F-26
NOTE G – ACCRUED LIABILITIES
At September 30, 2011 and December 31, 2010, accrued liabilities consisted of the following:
|
9/30/11
|
12/31/10
|
|||||||
|
Accrued professional fees
|
$
|
26,500
|
$
|
-
|
||||
|
Accrued interest and other
|
36,087
|
20,853
|
||||||
|
Severance liability
|
101,833
|
160,000
|
||||||
|
Accrued rent
|
19,328
|
-
|
||||||
|
Total accrued liabilities
|
$
|
183,748
|
$
|
180,853
|
||||
NOTE H – NOTES PAYABLE
The carrying value of notes payable at September 30, 2011 and December 31, 2010 consisted of the following:
|
9/30/11
|
12/31/10
|
|||||||
|
Wan-Yu, interest rate 12% ~14%
|
$
|
- |
$
|
20,000
|
||||
|
Hsiang, interest rate 14%
|
- |
15,000
|
||||||
|
Zwest note, interest rate 18%
|
450,000
|
- | ||||||
|
Yip, interest rate 18%
|
- |
200,000
|
||||||
|
Notes payable – current portion
|
$
|
450,000
|
$
|
235,000
|
||||
|
9/30/11
|
12/31/10
|
|||||||
|
Bootsma note, interest rate 5%
|
$
|
100,000
|
$
|
100,000
|
||||
|
Notes payable – long-term
|
$
|
100,000
|
$
|
100,000
|
||||
On July 15, 2009, the Company entered into a Promissory Note in the principal amount of $20,000 with Wan-Yu, an individual, with an interest rate of 12% per annum for the first month and an interest rate of 14% after the first month. The interest on the note is payable in cash on a monthly basis. This note is secured by the Company’s inventory and due on demand. On December 31, 2010, the principal balance due to Wan-Yu was $20,000. On August 1, 2011, the Company issued 10,000 shares of common stock to retire the $20,000 note with Wan-Yu.
On October 1, 2010, the Company entered into a $15,000 Promissory Note with Hsiang, an individual, with an interest rate of 14% per annum. The interest on the note is payable in cash on a monthly basis. The maturity date of this note was April 1, 2011. On December 31, 2010, the principal balance due to Hsiang was $15,000 . On August 20, 2011, the Company issued 7,500 shares of common stock to retire the $15,000 note with Hsiang.
On December 15, 2010, the Company entered into a $200,000 Convertible Promissory Note with Yip, an individual, with an interest rate of 18% per annum. Of the interest, 14% was paid in cash and 4% was paid in the Company’s Preferred Stock at $0.50 per share. The convertible promissory note is convertible in whole or in part at the lender’s option into shares of the Company’s Preferred Stock at $0.50 per share. The Company evaluated the conversion feature of this note, and has deemed the conversion feature is not considered a derivative. The number of shares of Preferred Stock issuable upon conversion shall be determined by dividing the sum of the outstanding principal of this note being converted by $0.50 per share of Preferred Stock. The maturity date of this note was June 30, 2011. On June 30, 2011, the $200,000 Yip note was converted into shares of the Company’s Preferred Stock at a price per share of $0.50 for an aggregate number of 400,000 shares and subsequently converted to common stock in July 2011. The Company issued 400,000 Preferred shares on June 30, 2011 as full and final payment of the note.
F-27
On January 1, 2009, the Company entered into a Promissory Note of $100,000 with Bootsma, an individual, with an interest rate of 5% per annum to redeem 1,000,000 shares of his common stock. The maturity date of this note is the earlier of the following:
(a) The date that is five years after the date of the agreement (January 1, 2014);
(b) The sale, conveyance or disposal of all or substantially all of the Company's property or business, or the Company's merger with or into or consolidation with any other corporation, or if the Company effects any other transaction or series of related transactions in which more than 50 percent of the voting stock of the Company is transferred, sold, or disposed of and the Company is not the survivor in such transaction or series of transactions;
(c) The liquidation, dissolution or indefinite cessation of the business operations of the Company;
(d) The execution by the Company of a general assignment for the benefit of creditors or the appointment of a receiver or trustee to take possession of the property or assets of the Company; or
(e) A firm commitment for an underwritten public offering by the Company of shares of its Common Stock.
On March 31, 2009, the Company entered into a Promissory Note with Zwest, the Company’s vendor in China, for $287,062, with an interest rate of 12% per annum. The maturity date of this note was December 31, 2009. As of December 31, 2009, the Company was in default. In 2010, the Company paid off the $287,062 Promissory Note and Zwest agreed to provide the Company with a new payment arrangement for the remaining accounts payable outstanding with an interest rate of 12% per annum. The terms of the payment arrangement are as follows.
For goods shipped before June 30, 2010:
(a) All payable amounts from 0 -4 5 days of shipping are considered regular trade payables and are not subject to the 12% interest;
(b) Payable amounts greater than 45 days are subject to the payment arrangement and are assessed a 12% interest rate.
For goods shipped after June 30, 2010:
(a) All payable amounts from 0 -75 days of shipping are considered regular trade payables and are not subject to the 12% interest; and
(b) Payable amounts greater than 75 days are subject to the payment arrangement and are assessed a 12% interest rate.
On June 30, 2011, the Company entered into a Promissory Note with Zwest whereby Zwest has agreed to convert $450,000 of the inventory payable balance to a long-term note with interest payable monthly at 18% per annum with the principal due in full on September 30, 2012.
As of September 30, 2011 and December 31, 2010, the balances due Zwest are as follows:
|
9/30/11
|
12/31/10
|
|||||||
|
Accounts payable – Zwest
|
$
|
309,803
|
$
|
801,531
|
||||
|
Promissory note – long-term
|
450,000
|
-
|
||||||
|
Total amounts due to Zwest
|
$
|
759.803
|
$
|
801,531
|
||||
F-28
NOTE I – RELATED-PARTY TRANSACTION
|
9/30/11
|
12/31/10
|
|||||||
|
Note Payable- Collins, interest rate 12%
|
$
|
145,679
|
$
|
145,679
|
||||
|
Accrued interest, Collins
|
59,096
|
59,096
|
||||||
|
Amount due to related party
|
$
|
204,775
|
$
|
204,775
|
||||
On August 15, 2008, the Company entered into a Promissory Note in the principal amount of $431,925 with William Collins, the Company’s CEO, with an interest rate of 12% per annum. The interest on the note is payable in cash on a monthly basis. This note is unsecured and due on demand. As of September 30, 2011 and December 31, 2010, the balance due to Collins was $204,775, of which $59,096 is accrued interest for both periods.
NOTE J – INCOME TAXES
No provision for federal income taxes has been recognized for the nine months ended September 30, 2011 and 2010 as the Company incurred a net operating loss for income tax purposes in each period and has no carry-back potential.
Deferred income taxes reflect the net tax effects of temporary differences between the carrying amounts of assets and liabilities for financial reporting purposes and the amounts used for income tax purposes. The Company assesses whether it is more likely than not that it will generate sufficient taxable income to realize its deferred income tax assets in a reasonable period of time. In making this determination, it considers all available positive and negative evidence and makes certain assumptions, including, among other things, the deferred tax liabilities; the overall business environment; the historical earnings and losses; and its outlook for future years. At September 30, 2011 and December 31, 2010, the deferred tax assets consisted of mainly the net operating losses carried over from the prior years and Company provided a full valuation allowance for its deferred tax assets, as it is more likely than not that these assets will not be realized in a reasonable period of time.
Reconciliation between actual tax expense (benefit) and income taxes computed by applying the U.S. federal income tax rate and state income tax rate to income from continuing operations before income taxes for the nine months ended September 30, 2011 and 2010 are as follows:
|
9/30/11
|
09/30/10
|
|||||||
|
Computed at U.S. and State statutory rates (34%)
|
$
|
(425,544
|
)
|
$
|
(24,634
|
)
|
||
|
Stock-based compensation
|
161,000
|
19,040
|
||||||
|
Change in valuation allowance
|
264,544
|
5,594
|
||||||
|
Total
|
$
|
-
|
$
|
-
|
||||
Tax effects of temporary differences that give rise to significant portions of the deferred tax assets and deferred liabilities at September 30, 2011 and December 31, 2010 are presented below:
|
9/30/11
|
12/31/10
|
|||||||
|
Deferred tax assets
|
$
|
726,070
|
$
|
461,526
|
||||
|
Less valuation allowance
|
(726,070)
|
(461,526
|
)
|
|||||
|
Net deferred tax assets
|
$
|
-
|
$
|
-
|
||||
At September 30, 2011, the Company had net operating loss carry-forwards for federal and state income tax purposes of approximately $2,346,120 which will begin to expire, if unused, in 2026. The valuation allowance increased approximately $264,544 and $137,709 for the nine months ended September 30, 2011 and the year ended December 31, 2010, respectively.
The above estimates are based upon management's decisions concerning certain elections which could change the relationship between net income and taxable income. Management decisions are made annually and could cause the estimates to vary significantly.
F-29
NOTE K – COMMITMENTS AND CONTINGENCIES
Lease Commitments
In April 2011, the Company entered into two non-cancelable warehouse leases. Minimum future lease payments under non-cancelable lease agreements as of September 30, 2011, are $378,558.
|
2011
|
$
|
22,848
|
||
|
2012
|
93,220
|
|||
|
2013
|
96,016
|
|||
|
2014
|
98,897
|
|||
|
2015 and thereafter
|
67,577
|
|||
|
Total
|
$
|
378,558
|
Litigation
The Company was involved in two cases, which have been consolidated in Multnomah County Circuit Court for the State of Oregon: (1) Trellis Earth Products, Inc. v. Randall R. Reed and Jon Holt, Multnomah County Circuit Court Case No. 1007-11053 (the “Trellis Earth Litigation”); and (2) Randall Reed v. Trellis Earth Products, Inc., Multnomah County Circuit Court Case No. 1008-11577 (the “Reed Litigation”).
Two former employees of the Company, Randall Reed and John Holt, were seeking to recover from the Company alleged wages and other purported employment benefits that were due upon their termination.
In September 2011, the Company reached a settlement with Randall R. Reed and Jon Holt, former employees of the Company, to resolve all matters related to the lawsuit against the Company. Under the terms of the settlement, without admitting fault or liability of any kind, the Company has agreed to pay in installments a total of $159,416 to Randall R. Reed and Jon Holt and their attorneys. These individuals have agreed to dismiss the lawsuits with no ability to reassert its claims against the Company. Additionally, Randall R. Reed, Jon Holt and the Company have agreed to release each other from all claims arising out of or related to the lawsuit. An accrual of $160,000 for the settlement has been accrued by the Company at December 31, 2010.
The following table is the payment schedule related to the settlement:
|
2011
|
$
|
41,249
|
||
|
2012
|
60,000
|
|||
|
Total
|
$
|
101,249
|
NOTE L – CONCENTRATION RISKS
The Company primarily engages in the distribution of bio-plastic products in the United States from a supplier in China. The Company’s products are mainly sold to domestic distributors. The following tables depict revenues and expenditures to major customers and major suppliers with greater than 10% of their respective totals.
F-30
a. Major Customers
The following table summarizes sales to major customers (each 10% or more of revenues):
|
Sales to
|
Receivable as
|
Percentage of
|
||||||||||
|
Nine months ended September 30, 2011
|
the customer
|
of September 30, 2011
|
total revenue
|
|||||||||
|
Bunzl and its affiliates
|
$
|
1,332,674
|
$
|
178,936
|
59
|
%
|
||||||
|
Unified Management
|
429,888
|
102,260
|
19
|
%
|
||||||||
|
Sales to
|
Receivable as
|
Percentage of
|
||||||||||
|
Nine months ended September 30, 2010
|
the customer
|
September 30, 2010
|
total revenue
|
|||||||||
|
Bunzl and its affiliates
|
$
|
1,362,342
|
$
|
306,159
|
66
|
%
|
||||||
Over 50% of our revenue is derived from Bunzl Distribution USA, Inc. (Bunzl) and its affiliates. If Bunzl were to terminate or materially reduce, for any reason, its business relationship with us, our operating results would be materially harmed.
b. Major Suppliers
The table following summarizes purchases from major suppliers (each 10% or more of purchases):
|
Purchases from
|
Payable as
|
Percentage of
|
||||||||||
|
Nine months ended September 30, 2011
|
the supplier
|
of September 30, 2011
|
total purchases
|
|||||||||
|
Zwest
|
$
|
1,159,897
|
$
|
309,803
|
99
|
%
|
||||||
|
Purchases from
|
Payable as
|
Percentage of
|
||||||||||
|
Nine months ended September 30, 2010
|
the supplier
|
September 30, 2010
|
total purchases
|
|||||||||
|
Zwest
|
$
|
966,202
|
$
|
728,263
|
99
|
%
|
||||||
The Company is dependent upon a single manufacturer for over 90% of the products we sell, which manufacturer is located in the People’s Republic of China (the "PRC"). Each shipment of the products could be delayed, waylaid, rerouted, stolen, lost or damaged, each of which could affect the performance and profitability of the Company. The Company may also face increased pressure for the supply of finished products that are produced by the manufacturer, as a result of increased demand and competitors seeking to displace the Company.
NOTE L – STOCKHOLDERS' EQUITY
Stock Split
In August 2011, the Company reincorporated under the laws of the State of Nevada. In connection with the reincorporation, the Company became authorized to issue 120,000,000 shares, of which 100,000,000 shares are designated as common stock, $0.001 par value, and 20,000,000 shares are designated as preferred stock, $0.001 par value. All share and per share amounts for all periods presented in these financial statements and notes thereto, have been adjusted retroactively, where applicable, to reflect the reverse stock split.
Common Stock:
During the nine months ended September 30, 2011 and 2010, the Company granted 112,500 shares and 56,000 shares, respectively, of its Common Stock to non-employees for their services. These shares were recorded at their fair value of $225,000 and $56,000 respectively.
During the nine months ended September 30, 2011, the Company issued 548,986 common shares and received gross proceeds of $1,097,972. The Company incurred total offering costs of $111,547.
On September 15, 2011 the Company granted Michael Senzaki the Company's Chief Financial Officer and Chief Operating Officer 100,000 shares of Common Stock as compensation valued at $200,000 on the date of grant.
Preferred Stock:
On July 5, 2011, the Company issued 13,886 Convertible Preferred shares to Yip as payment of interest on the $200,000 note that was converted as of June 30, 2011. These shares were converted into 6,943 shares of Common Stock in August with other outstanding Convertible Preferred Stock.
In August 2011, the Company converted all of its outstanding Convertible Preferred Stock into 906,609 shares of the Company’s Common Stock.
Stock Option:
On September 15, 2011, the Company adopted and the stockholders approved the Company’s 2011 Employee Stock Option Plan. Under the Plan, options may be granted which are intended to qualify as Incentive Stock Options under Section 422 of the Internal Revenue Code of 1986 or which are not intended to qualify as Incentive Stock Options thereunder. The maximum number of options made available for issuance under the Plan are one million two hundred and fifty thousand (1,250,000) options. The options may be granted to officers, directors, employees or consultants of the Company and its subsidiaries at not less than 100% of the fair market value on the date on which the options are granted. The term of each Option granted under the Plan shall be contained in a stock option agreement between the Optionee and the Company. The Board of Directors or a committee thereof, administers all of the equity incentive plans and determines the terms of options granted, including the exercise price, the number of shares subject to individual option awards and the vesting period of options, within the limits set forth in the Plan. Options have a maximum term of 10 years and vest as determined by the Board of Directors.
F-31
Options granted to Employees:
A summary of activity in employee options and related information is presented below:
|
Weighted
|
||||||||||||||||
|
Average
|
Remaining
|
|||||||||||||||
|
Exercise
|
Contractual
|
Intrinsic
|
||||||||||||||
|
Shares
|
Price
|
Term (years)
|
Value
|
|||||||||||||
|
Outstanding balance, 12/31/10
|
- | - | - | - | ||||||||||||
|
Granted
|
965,000 | 2.00 | 9.96 | - | ||||||||||||
|
Expired
|
- | - | - | - | ||||||||||||
|
Forfeited
|
- | - | - | - | ||||||||||||
|
Outstanding balance, 9/30/11
|
965,000 | $ | 2.00 | 9.96 | - | |||||||||||
|
(Fully vested and exercisable)
|
||||||||||||||||
On September 16, 2011, options to purchase 965,000 shares were granted to employees at exercise prices of $2.00 per share. These options have terms of three years and vest immediately. Fair value of $1,632,682 was recorded using the Black-Scholes option-pricing model. Variables used in the Black-Scholes option-pricing model include (1) discount rate ranging from .42% (2) warrant life of three years, (3) expected volatility 164.2% and (4) zero expected dividends.
Options granted to Non-Employees:
A summary of activity in options and related information for those options issued to non-employees is as follows:
|
Weighted
|
||||||||||||||||
|
Average
|
Remaining
|
|||||||||||||||
|
Exercise
|
Contractual
|
Intrinsic
|
||||||||||||||
|
Shares
|
Price
|
Term (years)
|
Value
|
|||||||||||||
|
Outstanding balance, 12/31/10
|
- | - | - | - | ||||||||||||
|
Granted
|
30,000 | 2.00 | 9.96 | - | ||||||||||||
|
Expired
|
- | - | - | - | ||||||||||||
|
Outstanding balance, 9/30/2011
|
30,000 | $ | 2.00 | 9.96 | - | |||||||||||
|
(Fully vested and exercisable)
|
||||||||||||||||
On September 16, 2011, options to purchase 30,000 shares were granted to two directors of the company at exercise prices of $2.00. These options have terms of three years and vest immediately. Fair value of $50,756 was recorded using the Black-Scholes option-pricing model. Variables used in the Black-Scholes option-pricing model include (1) discount rate ranging from .42% (2) warrant life of three years, (3) expected volatility 164.2% and (4) zero expected dividends.
F-32
NOTE M – SUBSEQUENT EVENTS
Subsequent to September 30, 2011, the Company issued 46,750 common shares and received gross proceeds of $93,500. All of the shares were sold to unrelated parties.
The Company also issued 3,375 common shares for services. These shares were valued at their fair value of $7,550.
F-33

Trellis Earth Products, Inc.
Up to $8,000,000 of Common Stock and
Warrants to purchase up to _____ shares of Common Stock
|
PROSPECTUS
|
, 201 2
INFORMATION NOT REQUIRED IN PROSPECTUS
|
Item 13. Other Expenses of Issuance and Distribution
|
The following table sets forth the costs and expenses (other than placement agent fees), payable by us in connection with the sale of securities being registered. All amounts shown are estimates, except the SEC registration fee.
|
SEC registration fee
|
$
|
3,378.51
|
||
|
Legal fees and expenses
|
$
|
150,000.00
|
||
|
Accounting fees and expenses
|
$
|
125,000.00
|
||
|
Printing expenses
|
$
|
10,000.00
|
||
|
Miscellaneous
|
$
|
10,000.00
|
||
|
Total
|
$
|
298,378.51
|
|
Item 14. Indemnification of Directors and Officers
|
Neither our articles of incorporation nor bylaws prevent us from indemnifying our officers, directors and agents to the extent permitted under the Nevada Revised Statute (“NRS”). NRS Section 78.7502, provides that a corporation shall indemnify any director, officer, employee or agent of a corporation against expenses, including attorneys’ fees, actually and reasonably incurred by him in connection with any the defense to the extent that a director, officer, employee or agent of a corporation has been successful on the merits or otherwise in defense of any action, suit or proceeding referred to Section 78.7502(1) or 78.7502(2), or in defense of any claim, issue or matter therein.
NRS 78.7502(1) provides that a corporation may indemnify any person who was or is a party or is threatened to be made a party to any threatened, pending or completed action, suit or proceeding, whether civil, criminal, administrative or investigative, except an action by or in the right of the corporation, by reason of the fact that he is or was a director, officer, employee or agent of the corporation, or is or was serving at the request of the corporation as a director, officer, employee or agent of another corporation, partnership, joint venture, trust or other enterprise, against expenses, including attorneys’ fees, judgments, fines and amounts paid in settlement actually and reasonably incurred by him in connection with the action, suit or proceeding if he: (a) is not liable pursuant to NRS 78.138; or (b) acted in good faith and in a manner which he reasonably believed to be in or not opposed to the best interests of the corporation, and, with respect to any criminal action or proceeding, had no reasonable cause to believe his conduct was unlawful.
NRS Section 78.7502(2) provides that a corporation may indemnify any person who was or is a party or is threatened to be made a party to any threatened, pending or completed action or suit by or in the right of the corporation to procure a judgment in its favor by reason of the fact that he is or was a director, officer, employee or agent of the corporation, or is or was serving at the request of the corporation as a director, officer, employee or agent of another corporation, partnership, joint venture, trust or other enterprise against expenses, including amounts paid in settlement and attorneys’ fees actually and reasonably incurred by him in connection with the defense or settlement of the action or suit if he: (a) is not liable pursuant to NRS 78.138; or (b) acted in good faith and in a manner which he reasonably believed to be in or not opposed to the best interests of the corporation. Indemnification may not be made for any claim, issue or matter as to which such a person has been adjudged by a court of competent jurisdiction, after exhaustion of all appeals there from, to be liable to the corporation or for amounts paid in settlement to the corporation, unless and only to the extent that the court in which the action or suit was brought or other court of competent jurisdiction determines upon application that in view of all the circumstances of the case, the person is fairly and reasonably entitled to indemnity for such expenses as the court deems proper.
NRS Section 78.747 provides that except as otherwise provided by specific statute, no director or officer of a corporation is individually liable for a debt or liability of the corporation, unless the director or officer acts as the alter ego of the corporation. The court as a matter of law must determine the question of whether a director or officer acts as the alter ego of a corporation.
Insofar as indemnification for liabilities arising under the Securities Act may be permitted to directors, officers or persons controlling us pursuant to the foregoing provisions, we have been informed that, in the opinion of the Securities and Exchange Commission, such indemnification is against public policy as expressed in the Securities Act and is therefore unenforceable. In the event that a claim for indemnification against such liabilities (other than the payment by the registrant of expenses incurred or paid by a director, officer or controlling person of the registrant in the successful defense of any action, suit or proceeding) is asserted by such director, officer or controlling person in connection with the securities being registered, we will, unless in the opinion of our counsel the matter has been settled by controlling precedent, submit to a court of appropriate jurisdiction the question whether such indemnification by us is against public policy as expressed hereby in the Securities Act and we will be governed by the final adjudication of such issue.
II-1
|
Item 15. Recent Sales of Unregistered Securities
|
We have not sold unregistered securities in the last three years, except as follows:
Subsequent to September 30, 2011, the Company issued 46,750 common shares and received gross proceeds of $93,500. In connection with the foregoing, the Company relied upon the exemption from securities registration afforded by Rule 506 of Regulation D as promulgated by the United States Securities and Exchange Commission under the Securities Act of 1933, as amended (the “Securities Act”) and/or Section 4(2) of the Securities Act. No advertising or general solicitation was employed in offering the securities. The offerings and sales were made to a limited number of persons, all of whom were accredited investors, and transfer was restricted by the Company in accordance with the requirements of the Securities Act.
Subsequent to September 30, 2011, the Company issued 3,375 shares of common stock to directors for services. The Company relied on the exemption from registration provided by Section 4(2) of the Securities Act for transactions not involving a public offering.
On July 5, 2011, the Company issued 13,886 shares of Seed Series Preferred Stock to Wen-Hsin Yip as payment of interest on a $200,000 promissory note. In connection with the foregoing, the Company relied on the exemption from registration provided by Section 4(2) of the Securities Act, for transactions not involving a public offering.
On August 1, 2011, the Company issued 10,000 shares of common stock to Wan-Yu to retire a $20,000 promissory note. In connection with the foregoing, the Company relied on the exemption from registration provided by Section 4(2) of the Securities Act, for transactions not involving a public offering.
On September 15, 2011 the Company issued to Michael Senzaki, the Company's Chief Financial Officer and Chief Operating Officer, 100,000 shares of common stock, for services. In connection with the foregoing, the Company relied on the exemption from registration provided by Section 4(2) of the Securities Act, for transactions not involving a public offering.
On September 16, 2011, the Company issued options to purchase 995,000 shares of the Company’s common stock to various employees, officers and directors of the Company at an exercise price of $2.00. In connection with the foregoing, the Company relied on the exemption from registration provided by Section 4(2) of the Securities Act for transactions not involving a public offering.
On October 22, 2011, the Company issued options to purchase 10,000 shares of the Company’s common stock to Timothy Hawkins, a director of the Company, at an exercise price of $2.00. In connection with the foregoing, the Company relied on the exemption from registration provided by Section 4(2) of the Securities Act for transactions not involving a public offering.
On August 3, 2011, the Company issued 906,609 shares of common stock upon the automatic conversion of 1,813,217 shares of Seed Series Preferred Stock, which automatic conversion was triggered by the consent of the holders of the majority of the outstanding shares of Seed Series Preferred Stock. The Seed Series Preferred Stock was issued at various times since inception. In connection with the foregoing, the Company relied on the exemption from registration provided by Section 4(2) of the Securities Act of 1933, as amended (the “Securities Act”), for transactions not involving a public offering, and Section 3(a)(9) of the Securities Act for securities exchanged by the issuer with existing security holders exclusively where no commission or other remuneration is paid.
During the nine months ended September 30, 2011 and 2010, the Company granted 132,450 shares and 20,086 shares of its Common Stock to non-employees for their services. These shares were recorded at their then fair value of $264,900 and $40,172, respectively. On December 15, 2010, the Company issued a promissory note to an investor in the principal amount of $200,000, convertible into common stock at a conversion price of $1.00 per share. In connection with the foregoing, the Company relied on the exemption from registration provided by Section 4(2) of the Securities Act of 1933, as amended, for transactions not involving a public offering.
From February 22, 2011 to September 30, 2011, the Company issued 531,780 shares of common stock to accredited investors at a purchase price of $2.00 per share. In connection with the foregoing, the Company relied upon the exemption from securities registration afforded by Rule 506 of Regulation D as promulgated by the United States Securities and Exchange Commission under the Securities Act of 1933, as amended (the “Securities Act”) and/or Section 4(2) of the Securities Act. No advertising or general solicitation was employed in offering the securities. The offerings and sales were made to a limited number of persons, all of whom were accredited investors, and transfer was restricted by the Company in accordance with the requirements of the Securities Act of 1933.
In 2010, the Company issued 128,843 shares of Convertible Preferred shares to pay off any outstanding loan in the amount of $30,000 and its outstanding rent in the amount of $34,422.During the year ended December 31, 2009, 178,488 shares of Convertible Preferred Stock were issued to pay off an outstanding loan in the amount of $75,000 and accrued interest of $14,244.
During the year ended December 31, 2009, the Company granted 222,500 fully vested shares of Common Stock to key employees as compensation with an aggregate fair value of $231,250.
During the years ended December 31, 2010 and 2009, the Company granted 56,000 shares and 67,125 shares of Common Stock to non-employees for services with an aggregate fair value of $56,000 and $98,762, respectively.
In connection with the foregoing, the Company relied on the exemption from registration provided by Section 4(2) of the Securities Act, for transactions not involving a public offering.
II-2
|
Item 16.
|
Exhibits
|
|
Exhibit Number
|
Description of Document
|
|
|
3.1
|
Articles of Incorporation of Trellis Earth Products, Inc.
|
|
|
3.2
|
Certificate of Amendment to Articles of Incorporation of Trellis Earth Products, Inc.
|
|
|
3.3
|
Bylaws of Trellis Earth Products, Inc.
|
|
|
4.1* *
|
Form of Common Stock Purchase Warrant to be issued to the Purchasers.
|
|
|
4.2 * *
|
Form of Placement Agent’s Warrant.
|
|
|
5.1**
|
Opinion of Sichenzia Ross Friedman Ference LLP.
|
|
|
10.1
|
Trellis Earth Products, Inc. 2011 Equity Incentive Plan.
|
|
|
10.2
|
Form of Second Amended and Restated Investors’ Rights Agreement among Trellis Earth Products, Inc. and the investors signatory thereto.
|
|
|
10.3
|
Promissory Note, dated August 15, 2008, issued to William Collins.
|
|
|
10.4
|
Promissory Note, dated January 1, 2009 to June 30, 2010, issued to William Collins.
|
|
|
10.5
|
Promissory Note, dated October 15, 2009, issued to William Collins.
|
|
|
10.6
|
Form of Common Stock Purchase Agreement among Trellis Earth Products, Inc. and the investors signatories thereto.
|
|
|
10.7
|
Stock Redemption Agreement and Mutual Release, dated January 1, 2009, between Trellis Earth Products, Inc. and Ernest G. Bootsma.
|
|
|
10.8
|
Industrial Lease, dated April 20, 2011, between Trellis Earth Products, Inc. and CP Wilsonville LLC.
|
|
|
10.9
|
Form of Seed Series Preferred Stock Purchase Agreement among Trellis Earth Products, Inc. and the investors signatories thereto.
|
|
|
10.10
|
Form of Exchange Agreement among Trellis Earth Products, Inc. and the equity holders signatories thereto.
|
|
|
10.11
|
Convertible Note Agreement, dated December 15, 2010, between Trellis Earth Products, Inc. and Wen-Hsin Yip.
|
|
|
10.12
|
Promissory Note, dated January 1, 2009, issued to Ernest G. Bootsma.
|
|
|
10.13
|
Promissory Note, dated January 1, 2009 to February 1, 2010, issued to William Collins.
|
|
|
10.14*
|
Employment Agreement, dated January 10, 2012, between Trellis Earth Products, Inc. and William Collins .
|
|
|
10.15
|
Promissory Note, dated June 30, 2011, issued to Zwest.
|
|
|
10.16**
|
Form of Securities Purchase Agreement
|
|
|
14.1
|
Code of Ethics.
|
|
|
23.1*
|
Consent of GBH CPAs, PC, Independent Public Accounting Firm.
|
|
|
23.2**
|
Consent of Sichenzia Ross Friedman Ference LLP (included in Exhibit 5.1).
|
Unless otherwise indicated, all exhibits were previously filed.
* Filed herewith.
** To be filed by amendment
II-3
|
Item 17.
|
Undertakings
|
The undersigned registrant hereby undertakes that:
(1) For purposes of determining any liability under the Securities Act of 1933, the information omitted from the form of prospectus filed as part of this registration statement in reliance upon Rule 430A and contained in a form of prospectus filed by the registrant pursuant to Rule 424(b)(1) or (4) or 497(h) under the Securities Act shall be deemed to be part of this registration statement as of the time it was declared effective.
(2) For the purpose of determining any liability under the Securities Act of 1933, each post-effective amendment that contains a form of prospectus shall be deemed to be a new registration statement relating to the securities offered therein, and the offering of such securities at that time shall be deemed to be the initial bona fide offering thereof.
(3) Insofar as indemnification for liabilities arising under the Securities Act may be permitted to directors, officers and controlling persons of the registrant pursuant to the foregoing provisions, or otherwise, the registrant has been advised that in the opinion of the Securities and Exchange Commission such indemnification is against public policy as expressed in the Securities Act and is, therefore, unenforceable. In the event that a claim for indemnification against such liabilities (other than the payment by the registrant of expenses incurred or paid by a director, officer or controlling person of the registrant in the successful defense of any action, suit or proceeding) is asserted by such director, officer or controlling person in connection with the securities being registered, the registrant will, unless in the opinion of its counsel the matter has been settled by controlling precedent, submit to a court of appropriate jurisdiction the question whether such indemnification by it is against public policy as expressed in the Securities Act and will be governed by the final adjudication of such issue.
II-4
SIGNATURES
Pursuant to the requirements of the Securities Act of 1933, the registrant has duly caused this registration statement to be signed on its behalf by the undersigned, thereunto duly authorized in the City of Wilsonville, State of Oregon, on January 18, 2012.
|
TRELLIS EARTH PRODUCTS, INC.
|
|||
|
By:
|
/s/ William Collins
|
||
|
William Collins
|
|||
|
Its:
|
Chairman, President and Chief Executive Officer
|
||
|
(Principal Executive Officer)
|
|||
|
By:
|
/s/ Michael Senzaki
|
||
|
Michael Senzaki
|
|||
|
Its:
|
Chief Operating Officer, Chief Financial Officer and Director
|
||
|
(Principal Financial and Accounting Officer)
|
|||
Pursuant to the requirements of the Securities Act of 1933, this registration statement has been signed below by the following persons in the capacities and on the dates indicated.
|
/s/ William Collins
|
||||
|
William Collins
|
January 18, 2012
|
|||
|
Chairman, President and Chief Executive Officer
(Principal Executive Officer)
|
||||
|
/s/ Michael Senzaki
|
||||
|
Michael Senzaki
|
January 18, 2012
|
|||
|
Chief Operating Officer, Chief Financial Officer and Director (Principal Financial and Accounting Officer)
|
||||
|
/s/ John Metcalf
|
||||
|
John Metcalf
|
January 18, 2012
|
|||
|
Director
|
||||
|
/s/ Neil J. Nelson
|
||||
|
Neil J. Nelson
|
January 18, 2012
|
|||
|
Director
|
||||
|
/s/ Timothy Hawkins
|
||||
|
Timothy Hawkins
|
January 18, 2012
|
|||
|
Director
|
II-5