Attached files
| file | filename |
|---|---|
| 8-K - 8-K - PACWEST BANCORP | a12-2984_18k.htm |
Exhibit 99.1
PRESS RELEASE
PacWest Bancorp
(NASDAQ: PACW)
|
Contact: |
|
Matthew P. Wagner |
|
Victor R. Santoro |
|
|
|
Chief Executive Officer |
|
Executive Vice President and CFO |
|
|
|
10250 Constellation Boulevard |
|
10250 Constellation Boulevard |
|
|
|
Suite 1640 |
|
Suite 1640 |
|
|
|
Los Angeles, CA 90067 |
|
Los Angeles, CA 90067 |
|
|
|
|
|
|
|
Phone: |
|
310-728-1020 |
|
310-728-1021 |
|
Fax: |
|
310-201-0498 |
|
310-201-0498 |
|
FOR IMMEDIATE RELEASE |
January 18, 2012 |
PACWEST BANCORP ANNOUNCES RESULTS FOR THE FOURTH QUARTER AND FISCAL 2011
Fourth Quarter of 2011 Highlights
· Net Earnings of $13.9 Million or $0.38 Per Diluted Share
· Net Interest Margin of 5.00%
· Return on Average Assets and Equity of 1.00% and 10.22%
· Tangible Book Value Per Share Increases to $13.14
· Credit Loss Reserve at 3.34% of Net Non-Covered Loans and 161% of Non-Covered Nonaccrual Loans
· Noninterest-Bearing Deposits at 37% and Core at 79% of Total Deposits
Fiscal 2011 Highlights
· Net Earnings of $50.7 Million or $1.37 Per Diluted Share
· Return on Average Assets and Equity of 0.92% and 9.92%
· Core Deposit Growth of $191.7 Million
Los Angeles, California . . . PacWest Bancorp (Nasdaq: PACW) today announced net earnings for the fourth quarter of 2011 of $13.9 million, or $0.38 per diluted share, compared to net earnings for the third quarter of 2011 of $13.3 million, or $0.36 per diluted share, and net earnings of $50.7 million for fiscal 2011, or $1.37 per diluted share, compared to a $62.0 million net loss, or $1.77 per diluted share, for fiscal 2010.
This press release contains certain non-GAAP financial disclosures for tangible common equity, pre-credit, pre-tax earnings, and credit cost adjusted efficiency ratios. The Company uses certain non-GAAP financial measures to provide meaningful supplemental information regarding the Company’s operational performance and to enhance investors’ overall understanding of such financial performance. Given the use of tangible common equity amounts and ratios is prevalent among banking regulators, investors and analysts, we disclose our tangible common equity ratios in addition to equity-to-assets ratios. Also, as analysts and investors view pre-credit, pre-tax earnings as an indicator of the Company’s ability to absorb credit losses, we disclose this amount in addition to net earnings. We disclose the credit cost adjusted efficiency ratio as it eliminates the volatility of FDIC loss sharing income and OREO expenses from the base efficiency ratio and shows the trend in overhead-related noninterest expense relative to net revenues.
Please refer to the tables at the end of this release for a presentation of performance ratios in accordance with GAAP and a reconciliation of the non-GAAP financial measures to the GAAP financial measures.
FOURTH QUARTER RESULTS
|
|
|
Three Months Ended |
| ||||
|
|
|
December 31, |
|
September 30, |
| ||
|
|
|
2011 |
|
2011 |
| ||
|
|
|
(Dollars in thousands, except per share data) |
| ||||
|
Financial Highlights: |
|
|
|
|
| ||
|
Net earnings |
|
$ |
13,883 |
|
$ |
13,304 |
|
|
Diluted earnings per share |
|
$ |
0.38 |
|
$ |
0.36 |
|
|
Annualized return on average assets |
|
1.00 |
% |
0.97 |
% | ||
|
Annualized return on average equity |
|
10.22 |
% |
10.11 |
% | ||
|
Net interest margin |
|
5.00 |
% |
5.15 |
% | ||
|
Efficiency ratio |
|
60.4 |
% |
67.9 |
% | ||
|
|
|
|
|
|
| ||
|
At Quarter End: |
|
|
|
|
| ||
|
Allowance for credit losses to non-covered loans, net of unearned income (1) |
|
3.34 |
% |
3.34 |
% | ||
|
Allowance for credit losses to non-covered nonaccrual loans (1) |
|
161.0 |
% |
161.0 |
% | ||
|
Equity to assets ratios: |
|
|
|
|
| ||
|
PacWest Bancorp Consolidated |
|
9.88 |
% |
9.82 |
% | ||
|
Pacific Western Bank |
|
11.35 |
% |
11.59 |
% | ||
|
Tangible common equity ratios: |
|
|
|
|
| ||
|
PacWest Bancorp Consolidated |
|
8.95 |
% |
8.85 |
% | ||
|
Pacific Western Bank |
|
10.43 |
% |
10.64 |
% | ||
(1) Non-covered loans exclude loans covered by loss sharing agreements with the FDIC.
The $579,000 increase in net earnings for the linked quarters was due to lower covered OREO costs of $4.6 million ($2.7 million after tax) and higher FDIC loss sharing income of $1.7 million ($1.0 million after tax), offset by a higher provision for credit losses on covered loans of $3.8 million ($2.2 million after tax) and lower net interest income of $668,000 ($387,000 after tax).
Covered OREO costs declined due to lower write-downs in the current quarter. FDIC loss sharing income grew due to the higher provision for credit losses on covered loans. Net interest income declined due to lower average loans and lower accelerated accretion of discounts on covered loan payoffs, offset by lower interest expense on deposits.
Net credit costs on a pre-tax basis are shown in the following table:
|
|
|
Three Months Ended |
| ||||
|
|
|
December 31, |
|
September 30, |
| ||
|
|
|
2011 |
|
2011 |
| ||
|
|
|
(In thousands) |
| ||||
|
Provision for credit losses on non-covered loans |
|
$ |
— |
|
$ |
— |
|
|
Non-covered OREO expense, net |
|
1,714 |
|
2,293 |
| ||
|
Total non-covered credit costs |
|
1,714 |
|
2,293 |
| ||
|
|
|
|
|
|
| ||
|
Provision for credit losses on covered loans |
|
4,122 |
|
348 |
| ||
|
Covered OREO expense, net |
|
226 |
|
4,813 |
| ||
|
Total covered net credit costs |
|
4,348 |
|
5,161 |
| ||
|
Less: FDIC loss sharing income, net |
|
2,667 |
|
963 |
| ||
|
Adjusted covered net credit costs |
|
1,681 |
|
4,198 |
| ||
|
|
|
|
|
|
| ||
|
Total net credit costs |
|
$ |
3,395 |
|
$ |
6,491 |
|
The provision for credit losses for the fourth quarter had two components: no provision for non-covered loans and $4.1 million for covered loans. The lack of a fourth quarter non-covered credit loss provision was based on our allowance methodology which reflected (a) non-covered loan net charge-offs of $2.8 million, (b) the levels and trends of nonaccrual and classified loans, (c) the migration of loans into various risk classifications, and (d) a decline in outstanding non-covered loans. During the fourth quarter, nonaccrual loans declined by $1.7 million to $58.3 million, classified loans increased by $7.8 million to $185.6 million, and gross non-covered loans declined $85.7 million to $2.8 billion.
The covered loan credit loss provision was driven by decreases in expected cash flows on covered loan pools compared to those previously estimated. The covered loan credit loss provision and covered OREO expense are offset by an increase in FDIC loss sharing income, which represents the FDIC’s share of these net costs. FDIC loss sharing income also includes reductions of the FDIC loss sharing asset when expected cash flows on covered loan pools improve.
Matt Wagner, Chief Executive Officer, commented, “We are pleased to post another profitable quarter, with net earnings reaching $13.9 million for the fourth quarter and $50.7 million for the year. Credit quality ratios remained stable as our legacy credit loss reserve represented 3.34% of legacy loans and 161% of legacy nonaccruals at the end of December. Although loan portfolio growth remains tepid, we continue to retain many maturing lending relationships that contribute positively to our profitability and net interest margin.”
Mr. Wagner continued, “We continue to generate significant core earnings, which strengthens our balance sheet, gives us operating flexibility, and enables us to take advantage of opportunities when they arise. Our earnings and capital levels enabled us to pay an $0.18 per share dividend last quarter and gives us dividend flexibility going forward. Our strong balance sheet enabled our acquisition of Marquette Equipment Finance, a leasing operation with $166 million in earning assets, which we closed on January 3rd. This acquisition diversifies our loan portfolio, expands our product line, and provides growth opportunities. It also importantly deployed our excess liquidity into higher-yielding assets.”
Vic Santoro, Executive Vice President and Chief Financial Officer, stated, “The fourth quarter repeated the solid performance of our third quarter, with a strong net interest margin, lower overhead, stable credit metrics, core deposit generation and a strong capital base. Our fourth quarter net interest margin of 5.00% is one of the highest in the nation as our loan yield held steady at 6.87% and all-in deposit cost dropped 8 basis points to 0.36%. Operating costs continue to be controlled, demonstrated by a $1.4 million decline in noninterest expense when OREO costs, severance costs and acquisition costs are excluded. Core deposits were up $89 million, including a $57 million increase in non-interest bearing demand deposits. The Company’s and the Bank’s capital positions remain well in excess of the well-capitalized regulatory minimums, and the Company’s tangible capital increased to $13.14 per share at December 31 compared to $12.91 at the end of September.”
YEAR TO DATE RESULTS
|
|
|
Year Ended |
| ||||
|
|
|
2011 |
|
2010 |
| ||
|
|
|
(Dollars in thousands, except per share data) |
| ||||
|
Financial Highlights: |
|
|
|
|
| ||
|
Net earnings (loss) |
|
$ |
50,704 |
|
$ |
(62,016 |
) |
|
Diluted earnings (loss) per share |
|
$ |
1.37 |
|
$ |
(1.77 |
) |
|
Annualized return on average assets |
|
0.92 |
% |
(1.14 |
)% | ||
|
Annualized return on average equity |
|
9.92 |
% |
(12.56 |
)% | ||
|
Net interest margin |
|
5.26 |
% |
5.02 |
% | ||
|
Efficiency ratio |
|
61.2 |
% |
64.5 |
% | ||
The increase in net earnings for 2011 over 2010 was due mostly to a lower provision for credit losses. The provision for 2010 included $85.7 million related to the sales of $398.5 million of non-covered classified loans; there were no similar sales of classified loans in the current year. When compared to 2010, 2011 shows higher net interest income of $13.3 million ($7.7 million after tax), lower provision for credit losses of $185.9 million ($107.8 million after tax), lower FDIC loss sharing income of $15.0 million ($8.7 million after tax), and lower noninterest expense of $8.8 million ($5.1 million after tax). The increase in net interest income was due to higher interest income on investment securities from purchases during 2011 and lower interest expense on deposits from reduced interest rates, offset by lower interest income on loans due mostly to a lower average balance. The decline in FDIC loss sharing income is directly related to lower net credit costs on covered loans and OREO. The decline in noninterest expense reflects lower non-covered OREO costs, insurance and assessment costs, and other expense, offset partially by higher covered OREO costs and other professional services expense.
The comparability of financial information is affected by our acquisitions. Operating results include the operations of Los Padres Bank, which was acquired in August 2010 and added $824 million in assets and nine branch offices.
BALANCE SHEET CHANGES
Asset growth of $34.3 million during the fourth quarter was due to higher balances in interest-earning deposits in financial institutions and investment securities, offset by lower loan balances. During the fourth quarter, interest-earning deposits in financial institutions increased $130.1 million from positive cash flows and investment securities available-for-sale increased $64.6 million from purchases. The loan portfolio continues to decline generally due to repayments and resolution activities, as the Bank continues to selectively generate loans and renew maturing loans consistent with our portfolio goals and credit quality and pricing standards. The non-covered loan portfolio declined $85.7 million on a gross basis, attributable to decreases of $39.4 million and $49.4 million in construction and real estate mortgage loans. The reduction in construction loans is due mostly to the payoff of one loan for $30 million. The covered loan portfolio declined $58.0 million. At December 31, 2011, non-covered loans, net of unearned income, totaled $2.8 billion and the covered loan portfolio was $703.0 million.
Total deposits grew $23.1 million during the fourth quarter to $4.6 billion at December 31, 2011. Time deposits decreased $66.4 million during the fourth quarter to $967.9 million at December 31, 2011. Core deposits, which include noninterest-bearing demand, interest checking, money market, and savings accounts, grew $89.5 million during the fourth quarter with increases of $57.5 million, $30.4 million, and $3.1 million in noninterest-bearing, money market deposits, and interest checking deposits, respectively. At December 31, 2011, core deposits totaled $3.6 billion, or 79% of total deposits at that date. Noninterest-bearing demand deposits were $1.7 billion at December 31, 2011 and represented 37% of total deposits at that date.
COVERED ASSETS
As part of the Los Padres and Affinity acquisitions we entered into loss sharing agreements with the FDIC that cover a substantial portion of losses incurred after the acquisition dates on covered loans and other real estate owned, and in the case of the Affinity acquisition, certain investment securities.
A summary of covered assets is shown in the following table as of the dates indicated:
|
|
|
December 31, |
|
September 30, |
|
December 31, |
| |||
|
Covered Assets |
|
2011 |
|
2011 |
|
2010 |
| |||
|
|
|
(In thousands) |
| |||||||
|
Loans, net |
|
$ |
703,023 |
|
$ |
761,059 |
|
$ |
908,576 |
|
|
Investment securities |
|
45,149 |
|
47,213 |
|
50,437 |
| |||
|
Other real estate owned, net |
|
33,506 |
|
32,301 |
|
55,816 |
| |||
|
Total covered assets |
|
$ |
781,678 |
|
$ |
840,573 |
|
$ |
1,014,829 |
|
NET INTEREST INCOME
Net interest income was $63.8 million for the fourth quarter of 2011 compared to $64.4 million for the third quarter of 2011. The $668,000 decline was due to a $1.7 million decrease in loan interest income from lower average loans. Offsetting the decline in interest income was a reduction in interest expense of $937,000 due to lower rates on all interest-bearing deposits and a decline in average time deposits.
Net interest income grew $13.3 million to $262.6 million during 2011. This change was due to a $5.0 million increase in interest income and an $8.3 million decrease in interest expense. The increase in interest income was due mainly to purchases of investment securities, offset by lower average loans. The decrease in interest expense was due to a lower average rate on money market deposits, lower average time deposits and lower average borrowings as $260 million of FHLB advances were repaid in the first half of 2010 and another $50 million were repaid in December 2010.
NET INTEREST MARGIN
Our net interest margin for the fourth quarter of 2011 was 5.00%, a decrease of 15 basis points from the 5.15% reported for the third quarter of 2011. The decrease reflected a shift in the mix of average interest-earning assets to lower yielding investment securities from higher yielding loans and lower accelerated accretion of discounts on covered loan payoffs. Average interest-earning assets increased $91.1 million for the linked quarters including a $141.1 million increase in average investment securities.
The net interest margin has been impacted by the accelerated accretion of discounts on covered loan payoffs and loans being placed on or removed from nonaccrual status. The effects of such items on the net interest margin are shown in the following table:
|
|
|
Three Months Ended |
|
Year |
| ||
|
|
|
December 31, |
|
September 30, |
|
December 31, |
|
|
|
|
2011 |
|
2011 |
|
2011 |
|
|
Net interest margin as reported |
|
5.00 |
% |
5.15 |
% |
5.26 |
% |
|
Less: |
|
|
|
|
|
|
|
|
Accelerated accretion of purchase discounts on covered loan payoffs |
|
0.02 |
% |
0.10 |
% |
0.18 |
% |
|
Nonaccrual loan interest |
|
0.01 |
% |
0.03 |
% |
0.01 |
% |
|
Net interest margin as adjusted |
|
4.97 |
% |
5.02 |
% |
5.07 |
% |
The yield on average loans was 6.87% for the fourth and third quarters of 2011. The combination of accelerated accretion of discounts on covered loan payoffs and nonaccrual loan interest positively impacted the loan yield for the fourth quarter by 4 basis points and the third quarter by 17 basis points. The cost of interest-bearing deposits declined 12 basis points to 0.57% due to lower rates on interest-bearing deposits and lower average time deposits, and all-in deposit cost declined 8 basis points to 0.36%.
The net interest margin for the year ended December 31, 2011 was 5.26% compared to 5.02% for the same period last year. The increase was due to a higher yield on loans, lower costs for money market deposits and subordinated debentures, and a lower average balance of FHLB advances. This was offset partially by a shift in the mix of average interest-earning assets to lower yielding investment securities from higher yielding loans. Average interest-earning assets increased $21.8 million due mostly to a $424.9 million increase in average investment securities while average loans decreased $313.3 million.
NONINTEREST INCOME
Noninterest income for the fourth quarter of 2011 totaled $8.3 million compared to $7.1 million for the third quarter of 2011. The $1.1 million increase was due to higher FDIC loss sharing income of $1.7 million stemming from a higher provision for credit losses on covered loans. FDIC loss sharing income also includes reductions of the FDIC loss sharing asset when the estimated amount of losses collectible from the FDIC decreases; this occurs when expected cash flows on covered loan pools improve during a reporting period causing the carrying value of the FDIC loss sharing asset to be reduced.
Noninterest income declined by $11.8 million to $31.4 million during the year ended December 31, 2011 compared to the same period last year. This reduction was attributable to a decrease in FDIC loss sharing income.
NONINTEREST EXPENSE
Noninterest expense decreased $5.1 million to $43.5 million during the fourth quarter of 2011 compared to $48.6 million for the third quarter of 2011. This change was due mostly to lower covered OREO costs. Covered OREO costs decreased by $4.6 million due to lower write-downs of $7.7 million and lower gains on sales of $3.1 million. The fourth quarter included an $885,000 charge to compensation related to a staff reduction, which is expected to result in annual savings of approximately $2.4 million, and $600,000 in acquisition costs related to the Marquette Equipment Finance transaction; there were no similar items in the prior quarter. The decline of $293,000 in other professional services was due mostly to internal audit transition costs recognized in the third quarter and a recovery of $368,000 in legal costs from an insurance claim in the fourth quarter. The decline of $286,000 in occupancy costs was due mostly to third quarter leasing commissions and a lease buyout.
Noninterest expense includes amortization of time-based restricted stock, which is included in compensation, and intangible asset amortization. Amortization of restricted stock totaled $1.4 million and $2.1 million for the fourth and third quarters of 2011, respectively. Intangible asset amortization totaled $1.8 million and $2.0 million for the fourth and third quarters of 2011, respectively.
Noninterest expense declined by $8.8 million to $180.0 million during 2011. This reduction was attributable to decreases in non-covered net OREO costs, insurance and assessments expense, and other expense, offset partially by increases in covered OREO costs and other professional services. Non-covered OREO costs declined $5.3 million due to lower write-downs of $7.2 million, offset by lower gains on sales of $1.8 million. Covered OREO costs increased by $1.2 million due to higher write-downs, which were offset by higher gains on sales. The increase in other professional services was due to higher legal costs for ongoing credit work-outs.
Amortization of restricted stock totaled $7.6 million and $8.5 million for the year ended December 31, 2011 and 2010, respectively. Intangible asset amortization totaled $8.4 million for the year ended December 31, 2011 compared to $9.6 million for the same period last year.
CREDIT QUALITY
|
|
|
December 31, |
|
September 30, |
|
December 31, |
| |||
|
|
|
2011 |
|
2011 |
|
2010 |
| |||
|
|
|
(Dollars in thousands) |
| |||||||
|
Non-Covered Credit Quality Metrics: |
|
|
|
|
|
|
| |||
|
Allowance for credit losses to loans, net of unearned income |
|
3.34 |
% |
3.34 |
% |
3.30 |
% | |||
|
Allowance for credit losses to nonaccrual loans |
|
161.0 |
% |
161.0 |
% |
110.8 |
% | |||
|
Nonperforming assets to loans, net of unearned income, and other real estate owned |
|
3.73 |
% |
3.68 |
% |
3.76 |
% | |||
|
Nonaccrual loans |
|
$ |
58,260 |
|
$ |
59,968 |
|
$ |
94,183 |
|
|
Classified loans (1) |
|
$ |
185,560 |
|
$ |
177,745 |
|
$ |
214,009 |
|
(1) Classified loans are those with a credit risk rating of substandard or doutbtful.
Credit Loss Provisions
The provision for credit losses for the fourth and third quarters totaled $4.1 million and $348,000, respectively; such provisions related only to the covered loan portfolio. The provision level on the non-covered portfolio is generated by our allowance methodology and reflects net charge-offs, the levels of nonaccrual and classified loans, and the migration of loans into various risk classifications. The provision for credit losses on the covered loans increases the covered loan allowance for credit losses and results from decreases in expected cash flows on covered loans compared to those previously estimated.
Fourth quarter of 2011 net charge-offs on non-covered loans totaled $2.8 million compared to third quarter net charge-offs of $6.0 million. The allowance for credit losses on the non-covered portfolio totaled $93.8 million and $96.5 million at December 31, 2011 and September 30, 2011, respectively, and represented 3.34% of the non-covered loan balances at both those dates. The allowance for credit losses as a percent of nonaccrual loans was 161% at December 31, 2011 and September 30, 2011.
Non-covered Nonaccrual Loans and Other Real Estate Owned
Non-covered nonperforming assets include non-covered nonaccrual loans and non-covered OREO and totaled $106.7 million at December 31, 2011 compared to $108.2 million at September 30, 2011. The $1.5 million decline in non-covered nonperforming assets was due to reductions of $1.7 million in nonaccrual loans and an increase of $152,000 in OREO. The ratio of non-covered nonperforming assets to non-covered loans and non-covered OREO increased to 3.73% at December 31, 2011 from 3.68% at September 30, 2011 due to a decline in outstanding non-covered loans.
The amount of new nonaccrual loans has slowed significantly in 2011 as shown in the following chart:
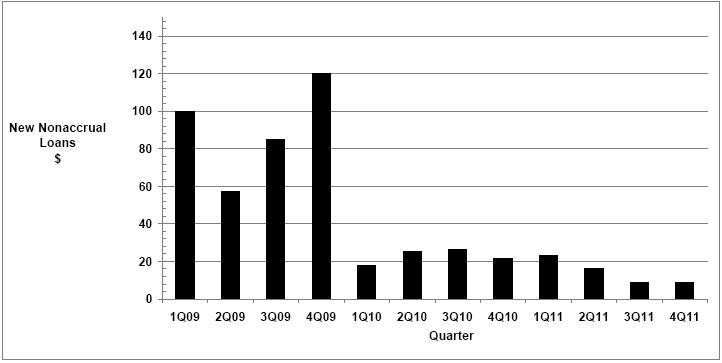
|
|
|
Volume of New |
| |
|
|
|
(In millions) |
| |
|
|
|
|
|
|
|
1Q09 |
|
$ |
99.8 |
|
|
2Q09 |
|
$ |
57.5 |
|
|
3Q09 |
|
$ |
85.0 |
|
|
4Q09 |
|
$ |
120.4 |
|
|
1Q10 |
|
$ |
18.1 |
|
|
2Q10 |
|
$ |
25.2 |
|
|
3Q10 |
|
$ |
26.5 |
|
|
4Q10 |
|
$ |
21.4 |
|
|
1Q11 |
|
$ |
23.2 |
|
|
2Q11 |
|
$ |
16.2 |
|
|
3Q11 |
|
$ |
8.8 |
|
|
4Q11 |
|
$ |
8.7 |
|
The following table presents our non-covered nonaccrual loans and accruing loans past due between 30 and 89 days by portfolio segment and class as of the dates indicated:
|
|
|
Nonaccrual Loans (1) |
|
Accruing and |
| ||||||||||||
|
|
|
December 31, 2011 |
|
September 30, 2011 |
|
30 - 89 Days Past Due (1) |
| ||||||||||
|
|
|
|
|
% of |
|
|
|
% of |
|
December 31, |
|
September 30, |
| ||||
|
|
|
|
|
Loan |
|
|
|
Loan |
|
2011 |
|
2011 |
| ||||
|
|
|
Balance |
|
Category |
|
Balance |
|
Category |
|
Balance |
|
Balance |
| ||||
|
|
|
(Dollars in thousands) |
| ||||||||||||||
|
Real estate mortgage: |
|
|
|
|
|
|
|
|
|
|
|
|
| ||||
|
Hospitality |
|
$ |
7,251 |
|
5.0 |
% |
$ |
7,336 |
|
5.0 |
% |
$ |
— |
|
$ |
— |
|
|
SBA 504 |
|
2,800 |
|
4.8 |
% |
2,895 |
|
4.9 |
% |
— |
|
3,168 |
| ||||
|
Other commercial |
|
19,060 |
|
1.2 |
% |
19,378 |
|
1.2 |
% |
13,055 |
|
14,664 |
| ||||
|
Residential |
|
2,226 |
|
1.2 |
% |
2,315 |
|
1.3 |
% |
182 |
|
400 |
| ||||
|
Total real estate mortgage |
|
31,337 |
|
1.6 |
% |
31,924 |
|
1.6 |
% |
13,237 |
|
18,232 |
| ||||
|
Real estate construction and land: |
|
|
|
|
|
|
|
|
|
|
|
|
| ||||
|
Residential |
|
1,086 |
|
6.1 |
% |
1,091 |
|
5.4 |
% |
— |
|
— |
| ||||
|
Commercial |
|
6,194 |
|
6.5 |
% |
9,399 |
|
7.1 |
% |
2,290 |
|
— |
| ||||
|
Total real estate construction |
|
7,280 |
|
6.4 |
% |
10,490 |
|
6.9 |
% |
2,290 |
|
— |
| ||||
|
Commercial: |
|
|
|
|
|
|
|
|
|
|
|
|
| ||||
|
Collateralized |
|
8,186 |
|
2.0 |
% |
4,769 |
|
1.2 |
% |
593 |
|
396 |
| ||||
|
Unsecured |
|
3,057 |
|
3.9 |
% |
4,887 |
|
6.9 |
% |
4 |
|
73 |
| ||||
|
Asset-based |
|
14 |
|
0.0 |
% |
15 |
|
0.0 |
% |
— |
|
— |
| ||||
|
SBA 7(a) |
|
7,801 |
|
26.9 |
% |
7,318 |
|
24.4 |
% |
434 |
|
828 |
| ||||
|
Total commercial |
|
19,058 |
|
2.8 |
% |
16,989 |
|
2.5 |
% |
1,031 |
|
1,297 |
| ||||
|
Consumer |
|
585 |
|
2.5 |
% |
565 |
|
2.7 |
% |
31 |
|
53 |
| ||||
|
Total non-covered loans |
|
$ |
58,260 |
|
2.1 |
% |
$ |
59,968 |
|
2.1 |
% |
$ |
16,589 |
|
$ |
19,582 |
|
(1) Excludes covered loans.
The $1.7 million decline in non-covered nonaccrual loans during the fourth quarter was attributable to (a) foreclosures of $1.3 million, (b) other reductions, payoffs and returns to accrual status of $5.3 million, (c) charge-offs of $3.8 million, and (d) additions of $8.7 million.
Below is a summary of the ten largest lending relationships on nonaccrual status, excluding SBA-related loans, at December 31, 2011:
|
Nonaccrual |
|
| |
|
Amount |
|
Description | |
|
(In thousands) |
|
| |
|
|
|
| |
|
$ |
10,226 |
|
This loan is secured by three airplane hangar structures and two office buildings in Los Angeles County, California. (1) |
|
|
|
| |
|
7,251 |
|
This loan is secured by two hotels in San Diego County, California. The borrower is paying according to the restructured terms of the loan. (1) | |
|
|
|
| |
|
3,813 |
|
This loan is secured by four industrial warehouse buildings in Riverside County, California. The borrower is paying according to the restructured terms of the loan. (1) | |
|
|
|
| |
|
3,585 |
|
This loan is unsecured. The borrower is paying according to the restructured terms of the loan. | |
|
|
|
| |
|
2,520 |
|
This loan is secured by a strip retail center in Riverside County, California. The borrower is paying according to the restructured terms of the loan. (1) | |
|
|
|
| |
|
2,306 |
|
This loan is unsecured and has a specific reserve for 95% of the balance. The borrower is paying according to the restructured terms of the loan. (1) | |
|
|
|
| |
|
1,963 |
|
This loan is secured by a multi-tenant industrial building in Riverside County, California. The borrower is paying according to the restructured terms of the loan. | |
|
|
|
| |
|
1,701 |
|
Two unsecured loans that are fully reserved for. (1) | |
|
|
|
| |
|
1,553 |
|
Loan secured by unimproved land in Imperial County, California. (1) | |
|
|
|
| |
|
1,492 |
|
This loan is secured by a medical-related office building in Los Angeles County, California. The borrower is paying according to the restructured terms of the loan. (1) | |
|
|
|
| |
|
$ |
36,410 |
|
Total |
(1) On nonaccrual status at September 30, 2011
The following table presents the details of non-covered and covered OREO as of the dates indicated:
|
|
|
December 31, 2011 |
|
September 30, 2011 |
| ||||||||
|
|
|
Non-Covered |
|
Covered |
|
Non-Covered |
|
Covered |
| ||||
|
Property Type |
|
OREO |
|
OREO |
|
OREO |
|
OREO |
| ||||
|
|
|
(In thousands) |
| ||||||||||
|
Commercial real estate |
|
$ |
23,003 |
|
$ |
15,053 |
|
$ |
21,431 |
|
$ |
14,151 |
|
|
Construction and land development |
|
24,788 |
|
15,461 |
|
26,093 |
|
14,676 |
| ||||
|
Multi-family |
|
— |
|
— |
|
— |
|
1,656 |
| ||||
|
Single family residences |
|
621 |
|
2,992 |
|
736 |
|
1,818 |
| ||||
|
Total OREO |
|
$ |
48,412 |
|
$ |
33,506 |
|
$ |
48,260 |
|
$ |
32,301 |
|
While the overall OREO values changed little quarter-to-quarter, there continues to be ongoing foreclosure and sales activity with offsetting effects on the total carrying value. The fourth quarter included 11 foreclosures totaling $11.7 million, 10 sales removing $8.3 million in OREO, and $2.0 million in valuation adjustments. The majority of foreclosure activity relates to covered OREO, with the largest foreclosure totaling $2.8 million on a self-storage facility. The sales velocity remained relatively consistent during the quarter with the 10 sales, and there are two legacy OREO sales expected to close in January 2012 which will reduce legacy OREO by $3.0 million. The non-covered construction and land development category above includes foreclosed undeveloped land located in Ventura County having a carrying value of $22 million.
The following table presents non-covered and covered OREO activity for the fourth quarter:
|
|
|
Three Months Ended |
| |||||||
|
|
|
December 31, 2011 |
| |||||||
|
|
|
Non-Covered |
|
Covered |
|
Total |
| |||
|
|
|
OREO |
|
OREO |
|
OREO |
| |||
|
|
|
(In thousands) |
| |||||||
|
Beginning of period |
|
$ |
48,260 |
|
$ |
32,301 |
|
$ |
80,561 |
|
|
Foreclosures |
|
1,296 |
|
10,120 |
|
11,416 |
| |||
|
Payments to third parties (1) |
|
238 |
|
10 |
|
248 |
| |||
|
Provision for losses |
|
(1,071 |
) |
(912 |
) |
(1,983 |
) | |||
|
Reductions related to sales |
|
(311 |
) |
(8,013 |
) |
(8,324 |
) | |||
|
End of period |
|
$ |
48,412 |
|
$ |
33,506 |
|
$ |
81,918 |
|
|
|
|
|
|
|
|
|
| |||
|
Net gain on sale |
|
$ |
22 |
|
$ |
784 |
|
$ |
806 |
|
(1) Represent amounts due to participants and for guarantees, property taxes or any other prior lien positions.
REGULATORY CAPITAL MEASURES ARE ABOVE THE WELL-CAPITALIZED MINIMUMS
PacWest and its wholly-owned banking subsidiary, Pacific Western Bank, each remained well capitalized at December 31, 2011 as shown in the following table:
|
|
|
December 31, 2011 |
| ||||
|
|
|
Well |
|
Pacific |
|
PacWest |
|
|
|
|
Capitalized |
|
Western |
|
Bancorp |
|
|
|
|
Requirement |
|
Bank |
|
Consolidated |
|
|
Tier 1 leverage capital ratio |
|
5.00 |
% |
9.73 |
% |
10.42 |
% |
|
Tier 1 risk-based capital ratio |
|
6.00 |
% |
14.95 |
% |
15.94 |
% |
|
Total risk-based capital ratio |
|
10.00 |
% |
16.22 |
% |
17.22 |
% |
|
Tangible common equity ratio |
|
N/A |
|
10.43 |
% |
8.95 |
% |
MARQUETTE EQUIPMENT FINANCE ACQUISITION
On January 3, 2012, Pacific Western Bank completed the acquisition of Marquette Equipment Finance, or MEF, a specialty equipment leasing company located in Midvale, Utah. MEF focuses on business-essential equipment leases throughout the United States with transactions primarily in the mid-ticket segment.
Pacific Western Bank acquired all of the capital stock of MEF from Meridian Bank, N.A. for $35 million in cash. MEF’s tangible net assets after our fair value adjustments were $18 million at December 31, 2011.
At December 31, 2011, MEF had approximately $166 million in gross leases outstanding, with no leases on nonaccrual status. MEF’s leases are spread across 18 industries, with the top three being financial services/insurance, manufacturing, and health care and representing 68% of the lease portfolio balance. The weighted average yield on the lease portfolio at year end 2011 was approximately 9% and its weighted average remaining maturity was 34 months. In addition, Pacific Western Bank assumed $154 million in outstanding debt and other liabilities, which included $129 million payable to MEF’s former parent. Pacific Western Bank repaid this amount on the closing date from its excess liquidity on deposit at the Federal Reserve Bank. This resulted in MEF’s interest-earning assets being funded with our low-cost deposit base.
MEF will continue operating under the name Marquette Equipment Finance as a subsidiary of Pacific Western Bank on a temporary basis. Pacific Western Bank has committed to changing MEF’s name within one year and Pacific Western Bank is in the process of integrating MEF into the Bank, after which MEF will operate as a division of the Bank instead of a standalone subsidiary The integration of MEF into the Bank is expected to occur during the first quarter of 2012.
ABOUT PACWEST BANCORP
PacWest Bancorp (“PacWest”) is a bank holding company with $5.5 billion in assets as of December 31, 2011, with one wholly-owned banking subsidiary, Pacific Western Bank (“Pacific Western”). Through 76 full-service community banking branches, Pacific Western provides commercial banking services, including real estate, construction and commercial loans, to small and medium-sized businesses. Pacific Western’s branches are located throughout California in Los Angeles, Orange, Riverside, San Bernardino, Santa Barbara, San Diego, San Francisco, San Luis Obispo, San Mateo and Ventura Counties. Through its subsidiaries, BFI Business Finance and Marquette Equipment Finance, and its division First Community Financial, Pacific Western also provides working capital financing and equipment leasing to growing companies located throughout the United States, with a focus on the Southwestern U.S., primarily in Arizona, California, Utah and Texas. Additional information regarding PacWest Bancorp is available on the Internet at www.pacwestbancorp.com. Information regarding Pacific Western Bank is also available on the Internet at www.pacificwesternbank.com.
FORWARD-LOOKING STATEMENTS
This press release contains certain forward-looking information about PacWest that is intended to be covered by the safe harbor for “forward-looking statements” provided by the Private Securities Litigation Reform Act of 1995. All statements other than statements of historical fact are forward-looking statements. Such statements involve inherent risks and uncertainties, many of which are difficult to predict and are generally beyond the control of the Company. We caution readers that a number of important factors could cause actual results to differ materially from those expressed in, implied or projected by, such forward-looking statements. Risks and uncertainties include, but are not limited to: lower than expected revenues; credit quality deterioration or a reduction in real estate values could cause an increase in the allowance for credit losses and a reduction in net earnings; increased competitive pressure among depository institutions; the Company’s ability to complete future acquisitions, successfully integrate such acquired entities, or achieve expected beneficial synergies and/or operating efficiencies within expected time-frames or at all; settlements with the FDIC related to our loss-sharing arrangement and other adjustments related to the Los Padres Bank and Affinity Bank acquisitions; the possibility that personnel changes will not proceed as planned; the cost of additional capital is more than expected; a change in the interest rate environment reduces net interest margins; asset/liability repricing risks and liquidity risks; pending legal matters may take longer or cost more to resolve or may be resolved adversely to the Company; general economic conditions, either nationally or in the market areas in which the Company does or anticipates doing business, are less favorable than expected; environmental conditions, including natural disasters, may disrupt our business, impede our operations, negatively impact the values of collateral securing the Company’s loans or impair the ability of our borrowers to support their debt obligations; the economic and regulatory effects of the continuing war on terrorism and other events of war, including the conflicts in the Middle East; legislative or regulatory requirements or changes adversely affecting the Company’s business; changes in the securities markets; regulatory approvals for any capital activities cannot be obtained on the terms expected or on the anticipated schedule; and, other risks that are described in PacWest’s public filings with the U.S. Securities and Exchange Commission (the “SEC”). If any of these risks or uncertainties materializes or if any of the assumptions underlying such forward-looking statements proves to be incorrect, PacWest’s results could differ materially from those expressed in, implied or projected by such forward-looking statements. PacWest assumes no obligation to update such forward-looking statements.
For a more complete discussion of risks and uncertainties, investors and security holders are urged to read PacWest Bancorp’s annual report on Form 10-K, quarterly reports on Form 10-Q and other reports filed by PacWest with the SEC. The documents filed by PacWest with the SEC may be obtained at PacWest Bancorp’s website at www.pacwestbancorp.com or at the SEC’s website at www.sec.gov. These documents may also be obtained free of charge from PacWest by directing a request to: PacWest Bancorp c/o Pacific Western Bank, 275 North Brea Boulevard, Brea, CA 92821. Attention: Investor Relations. Telephone 714-671-6800.
PACWEST BANCORP AND SUBSIDIARIES
CONDENSED CONSOLIDATED BALANCE SHEETS
(Unaudited)
|
|
|
December 31, |
|
September 30, |
|
December 31, |
| |||
|
|
|
2011 |
|
2011 |
|
2010 |
| |||
|
|
|
(In thousands, except per share and share data) |
| |||||||
|
ASSETS |
|
|
|
|
|
|
| |||
|
Cash and due from banks |
|
$ |
92,342 |
|
$ |
94,112 |
|
$ |
82,170 |
|
|
Interest-earning deposits in financial institutions |
|
203,275 |
|
73,209 |
|
26,382 |
| |||
|
Total cash and cash equivalents |
|
295,617 |
|
167,321 |
|
108,552 |
| |||
|
|
|
|
|
|
|
|
| |||
|
Non-covered securities available-for-sale |
|
1,281,209 |
|
1,214,563 |
|
823,579 |
| |||
|
Covered securities available-for-sale |
|
45,149 |
|
47,213 |
|
50,437 |
| |||
|
Total securities available-for-sale, at estimated fair value |
|
1,326,358 |
|
1,261,776 |
|
874,016 |
| |||
|
Federal Home Loan Bank stock, at cost |
|
46,106 |
|
48,342 |
|
55,040 |
| |||
|
Total investment securities |
|
1,372,464 |
|
1,310,118 |
|
929,056 |
| |||
|
|
|
|
|
|
|
|
| |||
|
Non-covered loans, net of unearned income |
|
2,807,713 |
|
2,893,637 |
|
3,161,055 |
| |||
|
Allowance for loan losses |
|
(85,313 |
) |
(90,110 |
) |
(98,653 |
) | |||
|
Total non-covered loans, net |
|
2,722,400 |
|
2,803,527 |
|
3,062,402 |
| |||
|
Covered loans, net |
|
703,023 |
|
761,059 |
|
908,576 |
| |||
|
Total loans |
|
3,425,423 |
|
3,564,586 |
|
3,970,978 |
| |||
|
|
|
|
|
|
|
|
| |||
|
Non-covered other real estate owned, net |
|
48,412 |
|
48,260 |
|
25,598 |
| |||
|
Covered other real estate owned, net |
|
33,506 |
|
32,301 |
|
55,816 |
| |||
|
Total other real estate owned |
|
81,918 |
|
80,561 |
|
81,414 |
| |||
|
|
|
|
|
|
|
|
| |||
|
Premises and equipment, net |
|
23,068 |
|
22,919 |
|
22,578 |
| |||
|
Goodwill |
|
39,141 |
|
39,141 |
|
47,301 |
| |||
|
Core deposit and customer relationship intangibles |
|
17,415 |
|
19,251 |
|
25,843 |
| |||
|
Cash surrender value of life insurance |
|
67,469 |
|
67,004 |
|
66,182 |
| |||
|
FDIC loss sharing asset |
|
95,187 |
|
89,197 |
|
116,352 |
| |||
|
Other assets |
|
110,535 |
|
133,793 |
|
160,765 |
| |||
|
Total assets |
|
$ |
5,528,237 |
|
$ |
5,493,891 |
|
$ |
5,529,021 |
|
|
|
|
|
|
|
|
|
| |||
|
LIABILITIES |
|
|
|
|
|
|
| |||
|
Noninterest-bearing demand deposits |
|
$ |
1,685,799 |
|
$ |
1,628,253 |
|
$ |
1,465,562 |
|
|
Interest-bearing deposits |
|
2,891,654 |
|
2,926,143 |
|
3,184,136 |
| |||
|
Total deposits |
|
4,577,453 |
|
4,554,396 |
|
4,649,698 |
| |||
|
Borrowings |
|
225,000 |
|
225,000 |
|
225,000 |
| |||
|
Subordinated debentures |
|
129,271 |
|
129,347 |
|
129,572 |
| |||
|
Accrued interest payable and other liabilities |
|
50,310 |
|
45,680 |
|
45,954 |
| |||
|
Total liabilities |
|
4,982,034 |
|
4,954,423 |
|
5,050,224 |
| |||
|
STOCKHOLDERS’ EQUITY (1) |
|
546,203 |
|
539,468 |
|
478,797 |
| |||
|
Total liabilities and stockholders’ equity |
|
$ |
5,528,237 |
|
$ |
5,493,891 |
|
$ |
5,529,021 |
|
|
(1) Includes net unrealized gain on securities available-for-sale, net |
|
$ |
22,803 |
|
$ |
23,324 |
|
$ |
3,969 |
|
|
|
|
|
|
|
|
|
| |||
|
Tangible book value per share |
|
$ |
13.14 |
|
$ |
12.91 |
|
$ |
11.06 |
|
|
Book value per share |
|
$ |
14.66 |
|
$ |
14.48 |
|
$ |
13.06 |
|
|
|
|
|
|
|
|
|
| |||
|
Shares outstanding (includes unvested restricted shares of 1,675,730 at December 31, 2011; 1,762,870 at September 30, 2011; and 1,230,582 at December 31, 2010) |
|
37,254,318 |
|
37,258,832 |
|
36,672,429 |
| |||
PACWEST BANCORP AND SUBSIDIARIES
CONDENSED CONSOLIDATED STATEMENTS OF EARNINGS (LOSS)
(Unaudited)
|
|
|
Three Months Ended |
|
Year Ended |
| |||||||||||
|
|
|
December 31, |
|
September 30, |
|
December 31, |
|
December 31, |
| |||||||
|
|
|
2011 |
|
2011 |
|
2010 |
|
2011 |
|
2010 |
| |||||
|
|
|
(In thousands, except per share data) |
| |||||||||||||
|
Interest income: |
|
|
|
|
|
|
|
|
|
|
| |||||
|
Loans |
|
$ |
61,684 |
|
$ |
63,347 |
|
$ |
70,597 |
|
$ |
260,143 |
|
$ |
265,136 |
|
|
Investment securities |
|
9,107 |
|
9,077 |
|
7,222 |
|
34,785 |
|
24,564 |
| |||||
|
Deposits in financial institutions |
|
122 |
|
94 |
|
79 |
|
356 |
|
584 |
| |||||
|
Total interest income |
|
70,913 |
|
72,518 |
|
77,898 |
|
295,284 |
|
290,284 |
| |||||
|
|
|
|
|
|
|
|
|
|
|
|
| |||||
|
Interest expense: |
|
|
|
|
|
|
|
|
|
|
| |||||
|
Deposits |
|
4,103 |
|
5,072 |
|
6,028 |
|
20,649 |
|
26,237 |
| |||||
|
Borrowings |
|
1,782 |
|
1,782 |
|
2,113 |
|
7,071 |
|
9,126 |
| |||||
|
Subordinated debentures |
|
1,255 |
|
1,223 |
|
1,237 |
|
4,923 |
|
5,594 |
| |||||
|
Total interest expense |
|
7,140 |
|
8,077 |
|
9,378 |
|
32,643 |
|
40,957 |
| |||||
|
|
|
|
|
|
|
|
|
|
|
|
| |||||
|
Net interest income |
|
63,773 |
|
64,441 |
|
68,520 |
|
262,641 |
|
249,327 |
| |||||
|
|
|
|
|
|
|
|
|
|
|
|
| |||||
|
Provision for credit losses: |
|
|
|
|
|
|
|
|
|
|
| |||||
|
Non-covered loans |
|
— |
|
— |
|
35,315 |
|
13,300 |
|
178,992 |
| |||||
|
Covered loans |
|
4,122 |
|
348 |
|
(1,100 |
) |
13,270 |
|
33,500 |
| |||||
|
Total provision for credit losses |
|
4,122 |
|
348 |
|
34,215 |
|
26,570 |
|
212,492 |
| |||||
|
|
|
|
|
|
|
|
|
|
|
|
| |||||
|
Net interest income after provision for credit losses |
|
59,651 |
|
64,093 |
|
34,305 |
|
236,071 |
|
36,835 |
| |||||
|
|
|
|
|
|
|
|
|
|
|
|
| |||||
|
Noninterest income: |
|
|
|
|
|
|
|
|
|
|
| |||||
|
Service charges on deposit accounts |
|
3,326 |
|
3,545 |
|
3,305 |
|
13,829 |
|
11,561 |
| |||||
|
Other commissions and fees |
|
1,864 |
|
2,052 |
|
1,896 |
|
7,616 |
|
7,291 |
| |||||
|
Other-than-temporary impairment loss on securities |
|
— |
|
— |
|
— |
|
— |
|
(874 |
) | |||||
|
Increase in cash surrender value of life insurance |
|
337 |
|
359 |
|
320 |
|
1,443 |
|
1,440 |
| |||||
|
FDIC loss sharing income (expense), net |
|
2,667 |
|
963 |
|
(4,473 |
) |
7,776 |
|
22,784 |
| |||||
|
Other income |
|
60 |
|
224 |
|
404 |
|
762 |
|
1,036 |
| |||||
|
Total noninterest income |
|
8,254 |
|
7,143 |
|
1,452 |
|
31,426 |
|
43,238 |
| |||||
|
|
|
|
|
|
|
|
|
|
|
|
| |||||
|
Noninterest expense: |
|
|
|
|
|
|
|
|
|
|
| |||||
|
Compensation |
|
21,597 |
|
21,557 |
|
23,944 |
|
86,800 |
|
87,483 |
| |||||
|
Occupancy |
|
7,137 |
|
7,423 |
|
7,233 |
|
28,685 |
|
27,639 |
| |||||
|
Data processing |
|
2,132 |
|
2,228 |
|
2,556 |
|
8,964 |
|
8,538 |
| |||||
|
Other professional services |
|
1,946 |
|
2,239 |
|
1,560 |
|
8,986 |
|
7,835 |
| |||||
|
Business development |
|
609 |
|
548 |
|
570 |
|
2,321 |
|
2,463 |
| |||||
|
Communications |
|
640 |
|
678 |
|
919 |
|
3,011 |
|
3,329 |
| |||||
|
Insurance and assessments |
|
1,590 |
|
1,641 |
|
2,369 |
|
7,171 |
|
9,685 |
| |||||
|
Non-covered other real estate owned, net |
|
1,714 |
|
2,293 |
|
1,093 |
|
7,010 |
|
12,310 |
| |||||
|
Covered other real estate owned, net |
|
226 |
|
4,813 |
|
699 |
|
3,666 |
|
2,460 |
| |||||
|
Intangible asset amortization |
|
1,836 |
|
1,977 |
|
2,360 |
|
8,428 |
|
9,642 |
| |||||
|
Acquisition costs |
|
600 |
|
— |
|
273 |
|
600 |
|
732 |
| |||||
|
Other expense |
|
3,442 |
|
3,190 |
|
5,710 |
|
14,351 |
|
16,687 |
| |||||
|
Total noninterest expense |
|
43,469 |
|
48,587 |
|
49,286 |
|
179,993 |
|
188,803 |
| |||||
|
|
|
|
|
|
|
|
|
|
|
|
| |||||
|
Earnings (loss) before income taxes |
|
24,436 |
|
22,649 |
|
(13,529 |
) |
87,504 |
|
(108,730 |
) | |||||
|
Income tax (expense) benefit |
|
(10,553 |
) |
(9,345 |
) |
5,841 |
|
(36,800 |
) |
46,714 |
| |||||
|
Net earnings (loss) |
|
$ |
13,883 |
|
$ |
13,304 |
|
$ |
(7,688 |
) |
$ |
50,704 |
|
$ |
(62,016 |
) |
|
|
|
|
|
|
|
|
|
|
|
|
| |||||
|
Earnings per share information: |
|
|
|
|
|
|
|
|
|
|
| |||||
|
Basic earnings (loss) per share |
|
$ |
0.38 |
|
$ |
0.36 |
|
$ |
(0.22 |
) |
$ |
1.37 |
|
$ |
(1.77 |
) |
|
Diluted earnings (loss) per share |
|
$ |
0.38 |
|
$ |
0.36 |
|
$ |
(0.22 |
) |
$ |
1.37 |
|
$ |
(1.77 |
) |
|
Basic weighted average shares |
|
35,548.0 |
|
35,488.5 |
|
35,406.5 |
|
$ |
35,490.8 |
|
$ |
35,108.1 |
| |||
|
Diluted weighted average shares |
|
35,548.0 |
|
35,488.5 |
|
35,406.5 |
|
$ |
35,490.8 |
|
$ |
35,108.1 |
| |||
PACWEST BANCORP AND SUBSIDIARIES
AVERAGE BALANCE SHEETS AND YIELD ANALYSIS
(Unaudited)
|
|
|
Three Months Ended |
|
Year Ended |
| |||||||||||
|
|
|
December 31, |
|
September 30, |
|
December 31, |
|
December 31, |
| |||||||
|
|
|
2011 |
|
2011 |
|
2010 |
|
2011 |
|
2010 |
| |||||
|
|
|
(Dollars in Thousands) |
| |||||||||||||
|
Average Assets: |
|
|
|
|
|
|
|
|
|
|
| |||||
|
Loans, net of unearned income |
|
$ |
3,562,766 |
|
$ |
3,656,184 |
|
$ |
4,216,088 |
|
$ |
3,755,190 |
|
$ |
4,068,450 |
|
|
Investment securities |
|
1,309,931 |
|
1,168,822 |
|
886,392 |
|
1,100,869 |
|
675,979 |
| |||||
|
Interest-earning deposits in financial institutions |
|
186,147 |
|
142,691 |
|
116,721 |
|
136,447 |
|
226,276 |
| |||||
|
Average interest-earning assets |
|
5,058,844 |
|
4,967,697 |
|
5,219,201 |
|
4,992,506 |
|
4,970,705 |
| |||||
|
Other assets |
|
463,328 |
|
486,276 |
|
531,829 |
|
492,577 |
|
455,005 |
| |||||
|
Average total assets |
|
$ |
5,522,172 |
|
$ |
5,453,973 |
|
$ |
5,751,030 |
|
$ |
5,485,083 |
|
$ |
5,425,710 |
|
|
|
|
|
|
|
|
|
|
|
|
|
| |||||
|
Average liabilities: |
|
|
|
|
|
|
|
|
|
|
| |||||
|
Interest checking deposits |
|
$ |
488,783 |
|
$ |
489,988 |
|
$ |
494,313 |
|
$ |
491,145 |
|
$ |
458,703 |
|
|
Money market deposits |
|
1,229,387 |
|
1,222,787 |
|
1,305,199 |
|
1,227,482 |
|
1,230,924 |
| |||||
|
Savings deposits |
|
157,617 |
|
154,922 |
|
139,228 |
|
150,837 |
|
121,793 |
| |||||
|
Time deposits |
|
1,003,939 |
|
1,049,805 |
|
1,327,869 |
|
1,077,930 |
|
1,181,735 |
| |||||
|
Average interest-bearing deposits |
|
2,879,726 |
|
2,917,502 |
|
3,266,609 |
|
2,947,394 |
|
2,993,155 |
| |||||
|
Borrowings |
|
225,011 |
|
225,022 |
|
272,848 |
|
225,542 |
|
324,150 |
| |||||
|
Subordinated debentures |
|
129,319 |
|
129,395 |
|
129,621 |
|
129,432 |
|
129,703 |
| |||||
|
Average interest-bearing liabilities |
|
3,234,056 |
|
3,271,919 |
|
3,669,078 |
|
3,302,368 |
|
3,447,008 |
| |||||
|
Noninterest-bearing demand deposits |
|
1,702,543 |
|
1,616,012 |
|
1,538,748 |
|
1,627,729 |
|
1,437,493 |
| |||||
|
Other liabilities |
|
46,777 |
|
43,983 |
|
47,002 |
|
43,996 |
|
47,586 |
| |||||
|
Average total liabilities |
|
4,983,376 |
|
4,931,914 |
|
5,254,828 |
|
4,974,093 |
|
4,932,087 |
| |||||
|
Average stockholders’ equity |
|
538,796 |
|
522,059 |
|
496,202 |
|
510,990 |
|
493,623 |
| |||||
|
Average liabilities and stockholders’ equity |
|
$ |
5,522,172 |
|
$ |
5,453,973 |
|
$ |
5,751,030 |
|
$ |
5,485,083 |
|
$ |
5,425,710 |
|
|
|
|
|
|
|
|
|
|
|
|
|
| |||||
|
Average deposits |
|
$ |
4,582,269 |
|
$ |
4,533,514 |
|
$ |
4,805,357 |
|
$ |
4,575,123 |
|
$ |
4,430,648 |
|
|
|
|
|
|
|
|
|
|
|
|
|
| |||||
|
Yield on: |
|
|
|
|
|
|
|
|
|
|
| |||||
|
Average loans |
|
6.87 |
% |
6.87 |
% |
6.64 |
% |
6.93 |
% |
6.52 |
% | |||||
|
Average investment securities |
|
2.76 |
% |
3.08 |
% |
3.23 |
% |
3.16 |
% |
3.63 |
% | |||||
|
Average interest-earning deposits |
|
0.26 |
% |
0.26 |
% |
0.27 |
% |
0.26 |
% |
0.26 |
% | |||||
|
Average interest-earning assets |
|
5.56 |
% |
5.79 |
% |
5.92 |
% |
5.91 |
% |
5.84 |
% | |||||
|
|
|
|
|
|
|
|
|
|
|
|
| |||||
|
Cost of: |
|
|
|
|
|
|
|
|
|
|
| |||||
|
Average interest-bearing deposits |
|
0.57 |
% |
0.69 |
% |
0.73 |
% |
0.70 |
% |
0.88 |
% | |||||
|
Average borrowings |
|
3.14 |
% |
3.14 |
% |
3.07 |
% |
3.14 |
% |
2.82 |
% | |||||
|
Average subordinated debentures |
|
3.85 |
% |
3.75 |
% |
3.79 |
% |
3.80 |
% |
4.31 |
% | |||||
|
Average interest-bearing liabilities |
|
0.88 |
% |
0.98 |
% |
1.01 |
% |
0.99 |
% |
1.19 |
% | |||||
|
|
|
|
|
|
|
|
|
|
|
|
| |||||
|
Interest rate spread (1) |
|
4.68 |
% |
4.81 |
% |
4.91 |
% |
4.92 |
% |
4.65 |
% | |||||
|
Net interest margin (2) |
|
5.00 |
% |
5.15 |
% |
5.21 |
% |
5.26 |
% |
5.02 |
% | |||||
|
|
|
|
|
|
|
|
|
|
|
|
| |||||
|
Cost of average deposits/all-in deposit cost (3) |
|
0.36 |
% |
0.44 |
% |
0.50 |
% |
0.45 |
% |
0.59 |
% | |||||
(1) Interest rate spread is calculated as the yield on average interest-earning assets less the cost of average interest-bearing liabilities.
(2) Net interest margin is calculated as annualized net interest income divided by average interest-earning assets.
(3) Cost of average deposits/all-in deposit cost is calculated as annualized interest expense on deposits divided by average deposits.
PACWEST BANCORP AND SUBSIDIARIES
NON-COVERED LOAN CONCENTRATION
(Unaudited)
|
|
|
December 31, |
|
September 30, |
|
June 30, |
|
March 31, |
|
December 31, |
| |||||
|
Loan Segment |
|
2011 |
|
2011 |
|
2011 |
|
2011 |
|
2010 |
| |||||
|
|
|
(In thousands) |
| |||||||||||||
|
Real estate mortgage |
|
$ |
1,982,464 |
|
$ |
2,031,893 |
|
$ |
2,073,868 |
|
$ |
2,172,923 |
|
$ |
2,274,733 |
|
|
Commercial |
|
671,939 |
|
671,963 |
|
640,805 |
|
667,401 |
|
663,557 |
| |||||
|
Real estate construction |
|
113,059 |
|
152,411 |
|
160,254 |
|
176,758 |
|
179,479 |
| |||||
|
Consumer |
|
23,711 |
|
20,621 |
|
22,248 |
|
21,815 |
|
25,058 |
| |||||
|
Foreign: |
|
|
|
|
|
|
|
|
|
|
| |||||
|
Commercial |
|
19,531 |
|
19,532 |
|
18,633 |
|
21,808 |
|
21,057 |
| |||||
|
Other, including real estate |
|
1,401 |
|
1,400 |
|
1,442 |
|
1,488 |
|
1,551 |
| |||||
|
Total gross non-covered loans |
|
$ |
2,812,105 |
|
$ |
2,897,820 |
|
$ |
2,917,250 |
|
$ |
3,062,193 |
|
$ |
3,165,435 |
|
PACWEST BANCORP AND SUBSIDIARIES
COVERED LOAN CONCENTRATION
(Unaudited)
|
|
|
December 31, |
|
September 30, |
|
December 31, |
| |||
|
Loan Category |
|
2011 |
|
2011 |
|
2010 |
| |||
|
|
|
(In thousands) |
| |||||||
|
Multi-family |
|
$ |
258,470 |
|
$ |
267,892 |
|
$ |
321,650 |
|
|
Commercial real estate |
|
349,039 |
|
386,326 |
|
444,244 |
| |||
|
Single family |
|
124,546 |
|
129,692 |
|
157,424 |
| |||
|
Construction and land |
|
49,047 |
|
57,601 |
|
87,301 |
| |||
|
Commercial and industrial |
|
21,776 |
|
22,869 |
|
34,828 |
| |||
|
Home equity lines of credit |
|
6,161 |
|
6,287 |
|
5,916 |
| |||
|
Consumer |
|
582 |
|
603 |
|
1,378 |
| |||
|
Total gross covered loans |
|
809,621 |
|
871,270 |
|
1,052,741 |
| |||
|
Less: discount |
|
(75,323 |
) |
(80,920 |
) |
(110,901 |
) | |||
|
Covered loans, net of discount |
|
734,298 |
|
790,350 |
|
941,840 |
| |||
|
Less: allowance for loan losses |
|
(31,275 |
) |
(29,291 |
) |
(33,264 |
) | |||
|
Covered loans, net |
|
$ |
703,023 |
|
$ |
761,059 |
|
$ |
908,576 |
|
PACWEST BANCORP AND SUBSIDIARIES
NON-COVERED LOAN CONCENTRATION
REAL ESTATE MORTGAGE LOANS
(Unaudited)
|
|
|
December 31, 2011 |
|
September 30, 2011 |
|
December 31, 2010 |
| |||||||||
|
|
|
|
|
% of |
|
|
|
% of |
|
|
|
% of |
| |||
|
Loan Category |
|
Balance |
|
Total |
|
Balance |
|
Total |
|
Balance |
|
Total |
| |||
|
|
|
(Dollars in thousands) |
| |||||||||||||
|
Commercial real estate mortgage: |
|
|
|
|
|
|
|
|
|
|
|
|
| |||
|
Industrial/warehouse |
|
$ |
367,494 |
|
18.5 |
% |
$ |
362,049 |
|
17.8 |
% |
$ |
432,263 |
|
19.0 |
% |
|
Retail |
|
286,691 |
|
14.5 |
% |
299,100 |
|
14.7 |
% |
374,027 |
|
16.4 |
% | |||
|
Office buildings |
|
290,074 |
|
14.6 |
% |
314,352 |
|
15.5 |
% |
350,192 |
|
15.4 |
% | |||
|
Owner-occupied |
|
226,307 |
|
11.4 |
% |
250,772 |
|
12.3 |
% |
263,603 |
|
11.6 |
% | |||
|
Hotel |
|
144,402 |
|
7.3 |
% |
145,783 |
|
7.2 |
% |
156,614 |
|
6.9 |
% | |||
|
Healthcare |
|
131,625 |
|
6.6 |
% |
114,277 |
|
5.6 |
% |
102,227 |
|
4.5 |
% | |||
|
Mixed use |
|
53,855 |
|
2.7 |
% |
56,507 |
|
2.8 |
% |
57,230 |
|
2.5 |
% | |||
|
Gas station |
|
33,715 |
|
1.7 |
% |
35,743 |
|
1.8 |
% |
38,502 |
|
1.7 |
% | |||
|
Self storage |
|
23,148 |
|
1.2 |
% |
23,260 |
|
1.1 |
% |
26,432 |
|
1.2 |
% | |||
|
Restaurant |
|
22,549 |
|
1.1 |
% |
23,585 |
|
1.2 |
% |
26,463 |
|
1.2 |
% | |||
|
Land acquisition/development |
|
14,015 |
|
0.7 |
% |
9,514 |
|
0.5 |
% |
9,649 |
|
0.4 |
% | |||
|
Unimproved land |
|
1,369 |
|
0.1 |
% |
1,415 |
|
0.1 |
% |
1,494 |
|
0.1 |
% | |||
|
Other |
|
206,504 |
|
10.4 |
% |
216,206 |
|
10.6 |
% |
250,068 |
|
11.0 |
% | |||
|
Total commercial real estate mortgage |
|
1,801,748 |
|
90.9 |
% |
1,852,563 |
|
91.2 |
% |
2,088,764 |
|
91.8 |
% | |||
|
|
|
|
|
|
|
|
|
|
|
|
|
|
| |||
|
Residential real estate mortgage: |
|
|
|
|
|
|
|
|
|
|
|
|
| |||
|
Multi-family |
|
93,866 |
|
4.7 |
% |
91,588 |
|
4.5 |
% |
81,880 |
|
3.6 |
% | |||
|
Single family owner-occupied |
|
32,209 |
|
1.6 |
% |
31,439 |
|
1.5 |
% |
38,025 |
|
1.7 |
% | |||
|
Single family nonowner-occupied |
|
19,341 |
|
1.0 |
% |
20,059 |
|
1.0 |
% |
26,618 |
|
1.2 |
% | |||
|
HELOCs |
|
35,300 |
|
1.8 |
% |
36,244 |
|
1.8 |
% |
38,823 |
|
1.7 |
% | |||
|
Unimproved land |
|
— |
|
0.0 |
% |
— |
|
0.0 |
% |
623 |
|
0.0 |
% | |||
|
Total residential real estate mortgage |
|
180,716 |
|
9.1 |
% |
179,330 |
|
8.8 |
% |
185,969 |
|
8.2 |
% | |||
|
|
|
|
|
|
|
|
|
|
|
|
|
|
| |||
|
Total gross non-covered real estate mortgage loans |
|
$ |
1,982,464 |
|
100.0 |
% |
$ |
2,031,893 |
|
100.0 |
% |
$ |
2,274,733 |
|
100.0 |
% |
PACWEST BANCORP AND SUBSIDIARIES
NON-COVERED LOAN CONCENTRATION
REAL ESTATE CONSTRUCTION LOANS
(Unaudited)
|
|
|
December 31, 2011 |
|
September 30, 2011 |
|
December 31, 2010 |
| |||||||||
|
|
|
|
|
% of |
|
|
|
% of |
|
|
|
% of |
| |||
|
Loan Category |
|
Balance |
|
Total |
|
Balance |
|
Total |
|
Balance |
|
Total |
| |||
|
|
|
(Dollars in thousands) |
| |||||||||||||
|
Commercial real estate construction: |
|
|
|
|
|
|
|
|
|
|
|
|
| |||
|
Retail |
|
$ |
19,468 |
|
17.2 |
% |
$ |
18,678 |
|
12.3 |
% |
$ |
20,378 |
|
11.4 |
% |
|
Industrial/warehouse |
|
18,786 |
|
16.6 |
% |
16,020 |
|
10.5 |
% |
11,329 |
|
6.3 |
% | |||
|
Office buildings |
|
5,223 |
|
4.6 |
% |
6,313 |
|
4.1 |
% |
3,805 |
|
2.1 |
% | |||
|
Owner-occupied |
|
476 |
|
0.4 |
% |
2,227 |
|
1.5 |
% |
2,000 |
|
1.1 |
% | |||
|
Healthcare |
|
— |
|
0.0 |
% |
— |
|
0.0 |
% |
4,305 |
|
2.4 |
% | |||
|
Self storage |
|
13,037 |
|
11.5 |
% |
19,148 |
|
12.6 |
% |
13,191 |
|
7.3 |
% | |||
|
Land acquisition/development |
|
3,211 |
|
2.8 |
% |
35,323 |
|
23.2 |
% |
16,983 |
|
9.5 |
% | |||
|
Unimproved land |
|
27,434 |
|
24.3 |
% |
27,857 |
|
18.3 |
% |
26,032 |
|
14.5 |
% | |||
|
Other |
|
7,755 |
|
6.9 |
% |
6,539 |
|
4.3 |
% |
9,062 |
|
5.0 |
% | |||
|
Total commercial real estate construction |
|
95,390 |
|
84.4 |
% |
132,105 |
|
86.7 |
% |
107,085 |
|
59.7 |
% | |||
|
|
|
|
|
|
|
|
|
|
|
|
|
|
| |||
|
Residential real estate construction: |
|
|
|
|
|
|
|
|
|
|
|
|
| |||
|
Multi-family |
|
2,993 |
|
2.6 |
% |
4,475 |
|
2.9 |
% |
26,474 |
|
14.8 |
% | |||
|
Single family owner-occupied |
|
427 |
|
0.4 |
% |
90 |
|
0.1 |
% |
— |
|
0.0 |
% | |||
|
Single family nonowner-occupied |
|
890 |
|
0.8 |
% |
1,165 |
|
0.8 |
% |
1,026 |
|
0.6 |
% | |||
|
Land acquisition/development |
|
2,262 |
|
2.0 |
% |
3,275 |
|
2.1 |
% |
1,482 |
|
0.8 |
% | |||
|
Unimproved land |
|
11,097 |
|
9.8 |
% |
11,301 |
|
7.4 |
% |
43,412 |
|
24.2 |
% | |||
|
Total residential real estate construction |
|
17,669 |
|
15.6 |
% |
20,306 |
|
13.3 |
% |
72,394 |
|
40.3 |
% | |||
|
|
|
|
|
|
|
|
|
|
|
|
|
|
| |||
|
Total gross non-covered real estate construction loans |
|
$ |
113,059 |
|
100.0 |
% |
$ |
152,411 |
|
100.0 |
% |
$ |
179,479 |
|
100.0 |
% |
PACWEST BANCORP AND SUBSIDIARIES
NON-COVERED NONCLASSIFIED AND CLASSIFIED LOANS
(Unaudited)
|
|
|
December 31, 2011 |
| |||||||
|
|
|
Nonclassified |
|
Classified |
|
Total |
| |||
|
|
|
(In thousands) |
| |||||||
|
Real estate mortgage: |
|
|
|
|
|
|
| |||
|
Hospitality |
|
$ |
123,071 |
|
$ |
21,331 |
|
$ |
144,402 |
|
|
SBA 504 |
|
51,522 |
|
6,855 |
|
58,377 |
| |||
|
Other |
|
1,690,830 |
|
88,855 |
|
1,779,685 |
| |||
|
Total real estate mortgage |
|
1,865,423 |
|
117,041 |
|
1,982,464 |
| |||
|
Real estate construction: |
|
|
|
|
|
|
| |||
|
Residential |
|
14,743 |
|
2,926 |
|
17,669 |
| |||
|
Commercial |
|
64,667 |
|
30,723 |
|
95,390 |
| |||
|
Total real estate construction |
|
79,410 |
|
33,649 |
|
113,059 |
| |||
|
Commercial: |
|
|
|
|
|
|
| |||
|
Collateralized |
|
395,041 |
|
18,979 |
|
414,020 |
| |||
|
Unsecured |
|
75,017 |
|
3,920 |
|
78,937 |
| |||
|
Asset-based |
|
149,947 |
|
40 |
|
149,987 |
| |||
|
SBA 7(a) |
|
18,045 |
|
10,950 |
|
28,995 |
| |||
|
Total commercial |
|
638,050 |
|
33,889 |
|
671,939 |
| |||
|
Consumer |
|
22,730 |
|
981 |
|
23,711 |
| |||
|
Foreign |
|
20,932 |
|
— |
|
20,932 |
| |||
|
Total non-covered loans |
|
$ |
2,626,545 |
|
$ |
185,560 |
|
$ |
2,812,105 |
|
|
|
|
September 30, 2011 |
| |||||||
|
|
|
Nonclassified |
|
Classified |
|
Total |
| |||
|
|
|
(In thousands) |
| |||||||
|
Real estate mortgage: |
|
|
|
|
|
|
| |||
|
Hospitality |
|
$ |
124,346 |
|
$ |
21,437 |
|
$ |
145,783 |
|
|
SBA 504 |
|
51,838 |
|
7,386 |
|
59,224 |
| |||
|
Other |
|
1,749,840 |
|
77,046 |
|
1,826,886 |
| |||
|
Total real estate mortgage |
|
1,926,024 |
|
105,869 |
|
2,031,893 |
| |||
|
Real estate construction: |
|
|
|
|
|
|
| |||
|
Residential |
|
16,908 |
|
3,398 |
|
20,306 |
| |||
|
Commercial |
|
98,819 |
|
33,286 |
|
132,105 |
| |||
|
Total real estate construction |
|
115,727 |
|
36,684 |
|
152,411 |
| |||
|
Commercial: |
|
|
|
|
|
|
| |||
|
Collateralized |
|
396,393 |
|
17,133 |
|
413,526 |
| |||
|
Unsecured |
|
65,214 |
|
5,967 |
|
71,181 |
| |||
|
Asset-based |
|
157,270 |
|
48 |
|
157,318 |
| |||
|
SBA 7(a) |
|
18,716 |
|
11,222 |
|
29,938 |
| |||
|
Total commercial |
|
637,593 |
|
34,370 |
|
671,963 |
| |||
|
Consumer |
|
19,799 |
|
822 |
|
20,621 |
| |||
|
Foreign |
|
20,932 |
|
— |
|
20,932 |
| |||
|
Total non-covered loans |
|
$ |
2,720,075 |
|
$ |
177,745 |
|
$ |
2,897,820 |
|
Note: Nonclassified loans are those with a credit risk rating of either pass or special mention, while classified loans are those with a credit risk rating of either substandard or doubtful.
PACWEST BANCORP AND SUBSIDIARIES
ALLOWANCE FOR CREDIT LOSSES ROLLFORWARD
AND NET CHARGE-OFF RATIOS FOR
NON-COVERED LOANS (1)
(Unaudited)
|
|
|
Three Months Ended |
|
Year Ended |
| |||||||||||
|
|
|
December 31, |
|
September 30, |
|
December 31, |
|
December 31, |
| |||||||
|
|
|
2011 |
|
2011 |
|
2010 |
|
2011 |
|
2010 |
| |||||
|
|
|
(Dollars in thousands) |
| |||||||||||||
|
Allowance for credit losses, beginning of period |
|
$ |
96,535 |
|
$ |
102,552 |
|
$ |
101,244 |
|
$ |
104,328 |
|
$ |
124,278 |
|
|
Loans charged-off: |
|
|
|
|
|
|
|
|
|
|
| |||||
|
Real estate mortgage |
|
(321 |
) |
(4,293 |
) |
(22,591 |
) |
(10,180 |
) |
(117,029 |
) | |||||
|
Real estate construction |
|
(1,048 |
) |
— |
|
(1,476 |
) |
(6,886 |
) |
(63,590 |
) | |||||
|
Commercial |
|
(2,105 |
) |
(2,237 |
) |
(7,311 |
) |
(10,072 |
) |
(18,548 |
) | |||||
|
Consumer |
|
(43 |
) |
(54 |
) |
(1,469 |
) |
(1,422 |
) |
(3,749 |
) | |||||
|
Foreign |
|
— |
|
— |
|
(193 |
) |
— |
|
(306 |
) | |||||
|
Total loans charged off |
|
(3,517 |
) |
(6,584 |
) |
(33,040 |
) |
(28,560 |
) |
(203,222 |
) | |||||
|
Recoveries on loans charged-off: |
|
|
|
|
|
|
|
|
|
|
| |||||
|
Real estate mortgage |
|
164 |
|
225 |
|
25 |
|
513 |
|
1,222 |
| |||||
|
Real estate construction |
|
4 |
|
33 |
|
— |
|
1,025 |
|
708 |
| |||||
|
Commercial |
|
508 |
|
235 |
|
591 |
|
1,668 |
|
1,652 |
| |||||
|
Consumer |
|
19 |
|
74 |
|
193 |
|
1,394 |
|
565 |
| |||||
|
Foreign |
|
70 |
|
— |
|
— |
|
115 |
|
133 |
| |||||
|
Total recoveries on loans charged off |
|
765 |
|
567 |
|
809 |
|
4,715 |
|
4,280 |
| |||||
|
Net charge-offs |
|
(2,752 |
) |
(6,017 |
) |
(32,231 |
) |
(23,845 |
) |
(198,942 |
) | |||||
|
Provision for credit losses |
|
— |
|
— |
|
35,315 |
|
13,300 |
|
178,992 |
| |||||
|
Allowance for credit losses, end of period |
|
$ |
93,783 |
|
$ |
96,535 |
|
$ |
104,328 |
|
$ |
93,783 |
|
$ |
104,328 |
|
|
|
|
|
|
|
|
|
|
|
|
|
| |||||
|
Charge-offs on loans sold included in “Loans charged-off” section of table above |
|
$ |
— |
|
$ |
— |
|
$ |
20,942 |
|
$ |
— |
|
$ |
144,647 |
|
|
|
|
|
|
|
|
|
|
|
|
|
| |||||
|
Annualized net charge-off ratios: |
|
|
|
|
|
|
|
|
|
|
| |||||
|
Net charge-offs to average loans |
|
0.39 |
% |
0.83 |
% |
3.90 |
% |
0.81 |
% |
5.94 |
% | |||||
|
Net charge-offs, excluding charge-offs on loans sold, to average loans |
|
0.39 |
% |
0.83 |
% |
1.37 |
% |
0.81 |
% |
1.62 |
% | |||||
(1) Applies only to non-covered loans.
PACWEST BANCORP AND SUBSIDIARIES
ALLOWANCE FOR CREDIT LOSSES, NONPERFORMING
ASSETS AND CREDIT QUALITY RATIOS FOR
NON-COVERED LOANS
(Unaudited)
|
|
|
December 31, |
|
September 30, |
|
December 31, |
| |||
|
|
|
2011 |
|
2011 |
|
2010 |
| |||
|
|
|
(Dollars in thousands) |
| |||||||
|
Allowance for loan losses (1) |
|
$ |
85,313 |
|
$ |
90,110 |
|
$ |
98,653 |
|
|
Reserve for unfunded loan commitments (1) |
|
8,470 |
|
6,425 |
|
5,675 |
| |||
|
Total allowance for credit losses |
|
$ |
93,783 |
|
$ |
96,535 |
|
$ |
104,328 |
|
|
|
|
|
|
|
|
|
| |||
|
Nonaccrual loans (2) |
|
$ |
58,260 |
|
$ |
59,968 |
|
$ |
94,183 |
|
|
Other real estate owned (2) |
|
48,412 |
|
48,260 |
|
25,598 |
| |||
|
Total nonperforming assets |
|
$ |
106,672 |
|
$ |
108,228 |
|
$ |
119,781 |
|
|
|
|
|
|
|
|
|
| |||
|
Performing restructured loans (1) |
|
$ |
116,791 |
|
$ |
86,406 |
|
$ |
89,272 |
|
|
|
|
|
|
|
|
|
| |||
|
Allowance for credit losses to loans, net of unearned income |
|
3.34 |
% |
3.34 |
% |
3.30 |
% | |||
|
Allowance for credit losses to nonaccrual loans |
|
161.0 |
% |
161.0 |
% |
110.8 |
% | |||
|
Nonperforming assets to loans, net of unearned income, and other real estate owned |
|
3.73 |
% |
3.68 |
% |
3.76 |
% | |||
|
Nonaccrual loans to loans, net of unearned income |
|
2.07 |
% |
2.07 |
% |
2.98 |
% | |||
(1) Applies to non-covered loans.
(2) Excludes covered nonperforming assets.
PACWEST BANCORP AND SUBSIDIARIES
DEPOSITS
(Unaudited)
|
|
|
December 31, |
|
September 30, |
|
December 31, |
| |||
|
Deposit Category |
|
2011 |
|
2011 |
|
2010 |
| |||
|
|
|
(Dollars in thousands) |
| |||||||
|
Noninterest-bearing demand deposits |
|
$ |
1,685,799 |
|
$ |
1,628,253 |
|
$ |
1,465,562 |
|
|
Interest checking deposits |
|
500,998 |
|
497,987 |
|
494,617 |
| |||
|
Money market deposits |
|
1,265,282 |
|
1,234,900 |
|
1,321,780 |
| |||
|
Savings deposits |
|
157,480 |
|
158,921 |
|
135,876 |
| |||
|
Total core deposits |
|
3,609,559 |
|
3,520,061 |
|
3,417,835 |
| |||
|
Time deposits under $100,000 |
|
324,521 |
|
345,380 |
|
436,838 |
| |||
|
Time deposits $100,000 and over |
|
643,373 |
|
688,955 |
|
795,025 |
| |||
|
Total time deposits |
|
967,894 |
|
1,034,335 |
|
1,231,863 |
| |||
|
Total deposits |
|
$ |
4,577,453 |
|
$ |
4,554,396 |
|
$ |
4,649,698 |
|
|
|
|
|
|
|
|
|
| |||
|
Noninterest-bearing demand deposits as a percentage of total deposits |
|
37 |
% |
36 |
% |
32 |
% | |||
|
Core deposits as a percentage of total deposits |
|
79 |
% |
77 |
% |
74 |
% | |||
PACWEST BANCORP AND SUBSIDIARIES
GAAP TO NON-GAAP RECONCILIATIONS
(Unaudited)
|
|
|
Three Months Ended |
|
Year Ended |
| |||||||||||
|
|
|
December 31, |
|
September 30, |
|
December 31, |
|
December 31, |
| |||||||
|
Pre-Credit, Pre-Tax Earnings |
|
2011 |
|
2011 |
|
2010 |
|
2011 |
|
2010 |
| |||||
|
|
|
(In thousands) |
| |||||||||||||
|
Net earnings (loss) |
|
$ |
13,883 |
|
$ |
13,304 |
|
$ |
(7,688 |
) |
$ |
50,704 |
|
$ |
(62,016 |
) |
|
Plus: Total provision for credit losses |
|
4,122 |
|
348 |
|
34,215 |
|
26,570 |
|
212,492 |
| |||||
|
Other real estate owned expense, net |
|
|
|
|
|
|
|
|
|
|
| |||||
|
Non-covered |
|
1,714 |
|
2,293 |
|
1,093 |
|
7,010 |
|
12,310 |
| |||||
|
Covered |
|
226 |
|
4,813 |
|
699 |
|
3,666 |
|
2,460 |
| |||||
|
Income tax expense (benefit) |
|
10,553 |
|
9,345 |
|
(5,841 |
) |
36,800 |
|
(46,714 |
) | |||||
|
Less: FDIC loss sharing income, net |
|
2,667 |
|
963 |
|
(4,473 |
) |
7,776 |
|
22,784 |
| |||||
|
Pre-credit, pre-tax earnings |
|
$ |
27,831 |
|
$ |
29,140 |
|
$ |
26,951 |
|
$ |
116,974 |
|
$ |
95,748 |
|
|
|
|
Three Months Ended |
|
Year Ended |
| |||||||||||
|
|
|
December 31, |
|
September 30, |
|
December 31, |
|
December 31, |
| |||||||
|
Credit Cost Adjusted Efficiency Ratio |
|
2011 |
|
2011 |
|
2010 |
|
2011 |
|
2010 |
| |||||
|
|
|
(Dollars in thousands) |
| |||||||||||||
|
Noninterest expense |
|
$ |
43,469 |
|
$ |
48,587 |
|
$ |
49,286 |
|
$ |
179,993 |
|
$ |
188,803 |
|
|
Less: Non-covered OREO expense |
|
1,714 |
|
2,293 |
|
1,093 |
|
7,010 |
|
12,310 |
| |||||
|
Covered OREO expense |
|
226 |
|
4,813 |
|
699 |
|
3,666 |
|
2,460 |
| |||||
|
Credit adjusted noninterest expense |
|
$ |
41,529 |
|
$ |
41,481 |
|
$ |
47,494 |
|
$ |
169,317 |
|
$ |
174,033 |
|
|
|
|
|
|
|
|
|
|
|
|
|
| |||||
|
Net interest income |
|
$ |
63,773 |
|
$ |
64,441 |
|
$ |
68,520 |
|
$ |
262,641 |
|
$ |
249,327 |
|
|
Noninterest income |
|
8,254 |
|
7,143 |
|
1,452 |
|
31,426 |
|
43,238 |
| |||||
|
Net revenues |
|
72,027 |
|
71,584 |
|
69,972 |
|
294,067 |
|
292,565 |
| |||||
|
Less: FDIC loss sharing income (expense), net |
|
2,667 |
|
963 |
|
(4,473 |
) |
7,776 |
|
22,784 |
| |||||
|
Credit adjusted net revenues |
|
$ |
69,360 |
|
$ |
70,621 |
|
$ |
74,445 |
|
$ |
286,291 |
|
$ |
269,781 |
|
|
|
|
|
|
|
|
|
|
|
|
|
| |||||
|
Base efficiency ratio (1) |
|
60.4 |
% |
67.9 |
% |
70.4 |
% |
61.2 |
% |
64.5 |
% | |||||
|
Credit cost adjusted efficiency ratio (2) |
|
59.9 |
% |
58.7 |
% |
63.8 |
% |
59.1 |
% |
64.5 |
% | |||||
(1) Noninterest expense divided by net revenues.
(2) Credit adjusted noninterest expense divided by credit adjusted net revenues.
PACWEST BANCORP AND SUBSIDIARIES
GAAP TO NON-GAAP RECONCILIATIONS
(Unaudited)
|
|
|
December 31, |
|
September 30, |
|
December 31, |
| |||
|
Tangible Common Equity |
|
2011 |
|
2011 |
|
2010 |
| |||
|
|
|
(Dollars in thousands) |
| |||||||
|
PacWest Bancorp Consolidated: |
|
|
|
|
|
|
| |||
|
Stockholders’ equity |
|
$ |
546,203 |
|
$ |
539,468 |
|
$ |
478,797 |
|
|
Less: Intangible assets |
|
56,556 |
|
58,392 |
|
73,144 |
| |||
|
Tangible common equity |
|
$ |
489,647 |
|
$ |
481,076 |
|
$ |
405,653 |
|
|
|
|
|
|
|
|
|
| |||
|
Total assets |
|
$ |
5,528,237 |
|
$ |
5,493,891 |
|
$ |
5,529,021 |
|
|
Less: Intangible assets |
|
56,556 |
|
58,392 |
|
73,144 |
| |||
|
Tangible assets |
|
$ |
5,471,681 |
|
$ |
5,435,499 |
|
$ |
5,455,877 |
|
|
|
|
|
|
|
|
|
| |||
|
Equity to assets ratio |
|
9.88 |
% |
9.82 |
% |
8.66 |
% | |||
|
Tangible common equity ratio (1) |
|
8.95 |
% |
8.85 |
% |
7.44 |
% | |||
|
|
|
|
|
|
|
|
| |||
|
Pacific Western Bank: |
|
|
|
|
|
|
| |||
|
Stockholders’ equity |
|
$ |
625,494 |
|
$ |
635,026 |
|
$ |
570,118 |
|
|
Less: Intangible assets |
|
56,556 |
|
58,392 |
|
73,144 |
| |||
|
Tangible common equity |
|
$ |
568,938 |
|
$ |
576,634 |
|
$ |
496,974 |
|
|
|
|
|
|
|
|
|
| |||
|
Total assets |
|
$ |
5,512,025 |
|
$ |
5,479,173 |
|
$ |
5,513,601 |
|
|
Less: Intangible assets |
|
56,556 |
|
58,392 |
|
73,144 |
| |||
|
Tangible assets |
|
$ |
5,455,469 |
|
$ |
5,420,781 |
|
$ |
5,440,457 |
|
|
|
|
|
|
|
|
|
| |||
|
Equity to assets ratio |
|
11.35 |
% |
11.59 |
% |
10.34 |
% | |||
|
Tangible common equity ratio (1) |
|
10.43 |
% |
10.64 |
% |
9.13 |
% | |||
(1) Calculated as tangible common equity divided by tangible assets.
PACWEST BANCORP AND SUBSIDIARIES
EARNINGS PER SHARE CALCULATIONS
(Unaudited)
|
|
|
Three Months Ended |
|
Year Ended |
| |||||||||||
|
|
|
December 31, |
|
September 30, |
|
December 31, |
|
December 31, |
| |||||||
|
|
|
2011 |
|
2011 |
|
2010 |
|
2011 |
|
2010 |
| |||||
|
|
|
(In thousands, except per share data) |
| |||||||||||||
|
Basic Earnings (Loss) Per Share: |
|
|
|
|
|
|
|
|
|
|
| |||||
|
Net earnings (loss) |
|
$ |
13,883 |
|
$ |
13,304 |
|
$ |
(7,688 |
) |
$ |
50,704 |
|
$ |
(62,016 |
) |
|
Less: earnings allocated to unvested restricted stock (1) |
|
(470 |
) |
(622 |
) |
(7 |
) |
(2,072 |
) |
(31 |
) | |||||
|
Net earnings (loss) allocated to common shares |
|
$ |
13,413 |
|
$ |
12,682 |
|
$ |
(7,695 |
) |
$ |
48,632 |
|
$ |
(62,047 |
) |
|
|
|
|
|
|
|
|
|
|
|
|
| |||||
|
Weighted-average basic shares and unvested restricted stock outstanding |
|
37,260.8 |
|
37,257.4 |
|
36,686.7 |
|
37,141.5 |
|
36,438.7 |
| |||||
|
Less: weighted-average unvested restricted stock outstanding |
|
(1,712.8 |
) |
(1,768.9 |
) |
(1,280.2 |
) |
(1,650.7 |
) |
(1,330.6 |
) | |||||
|
Weighted-average basic shares outstanding |
|
35,548.0 |
|
35,488.5 |
|
35,406.5 |
|
35,490.8 |
|
35,108.1 |
| |||||
|
|
|
|
|
|
|
|
|
|
|
|
| |||||
|
Basic earnings (loss) per share |
|
$ |
0.38 |
|
$ |
0.36 |
|
$ |
(0.22 |
) |
$ |
1.37 |
|
$ |
(1.77 |
) |
|
|
|
|
|
|
|
|
|
|
|
|
| |||||
|
Diluted Earnings (Loss) Per Share: |
|
|
|
|
|
|
|
|
|
|
| |||||
|
Net earnings (loss) allocated to common shares |
|
$ |
13,413 |
|
$ |
12,682 |
|
$ |
(7,695 |
) |
$ |
48,632 |
|
$ |
(62,047 |
) |
|
|
|
|
|
|
|
|
|
|
|
|
| |||||
|
Weighted-average basic shares outstanding |
|
35,548.0 |
|
35,488.5 |
|
35,406.5 |
|
35,490.8 |
|
35,108.1 |
| |||||
|
Add: warrants outstanding |
|
— |
|
— |
|
— |
|
— |
|
— |
| |||||
|
Weighted-average diluted shares outstanding |
|
35,548.0 |
|
35,488.5 |
|
35,406.5 |
|
35,490.8 |
|
35,108.1 |
| |||||
|
|
|
|
|
|
|
|
|
|
|
|
| |||||
|
Diluted earnings (loss) per share |
|
$ |
0.38 |
|
$ |
0.36 |
|
$ |
(0.22 |
) |
$ |
1.37 |
|
$ |
(1.77 |
) |
(1) Represents cash dividends paid to holders of unvested restricted stock, net of estimated forfeitures, plus undistributed earnings amounts available to holders of unvested restricted stock, if any.
Contact information:
Matt Wagner, Chief Executive Officer, (310) 728-1020
Vic Santoro, Executive Vice President and CFO, (310) 728-1021