Attached files
| file | filename |
|---|---|
| 8-K - CURRENT REPORT ON FORM 8-K - WELLS FARGO & COMPANY/MN | d280076d8k.htm |
| EX-99.1 - PRESS RELEASE - WELLS FARGO & COMPANY/MN | d280076dex991.htm |
 4Q11 Quarterly Supplement
January 17, 2012
Exhibit 99.2 |
 Wells Fargo
4Q11 Supplement 1
Appendix
Pages 22-44
-
Recent loan portfolio acquisitions
23
-
Non-strategic/liquidating loan portfolio risk reduction
24
-
Purchased credit-impaired (PCI) portfolios
25
-
PCI nonaccretable difference
26
-
PCI accretable yield
27
-
Commercial PCI accretable yield
28
-
Pick-a-Pay PCI accretable yield
29
-
4Q11 Credit quality highlights
30
-
Commercial nonaccrual loans
31
-
Consumer real estate nonaccrual loans
32
-
Commercial real estate (CRE) loan portfolio
33
-
Pick-a-Pay mortgage portfolio
34
-
Pick-a-Pay credit highlights
35
-
Pick-a-Pay nonaccrual loan composition
36
-
Real estate 1-4 family first mortgage portfolio
37
-
Home equity portfolio
38-39
-
Credit card portfolio
40
-
Auto portfolio
41
Forward-looking statements and
additional information
42
Tier 1 common equity under Basel I
43
Tier 1 common equity under Basel III
(Estimated)
44
Table of contents
4Q11 Results
-
4Q11 Results
Page 2
-
Continued strong diversification
3
-
Balance Sheet overview
4
-
Income Statement overview
5
-
Loans
6
-
Deposits
7
-
Net interest income
8
-
Noninterest income
9
-
Noninterest expense
10
-
Noninterest expense
11
-
Noninterest expense target
12
-
Community Banking
13
-
Wholesale Banking
14
-
Wealth, Brokerage and Retirement
15
-
Credit quality
16-17
-
Mortgage servicing
18-19
-
Capital
20
-
Summary
21 |
 Wells Fargo
4Q11 Supplement 2
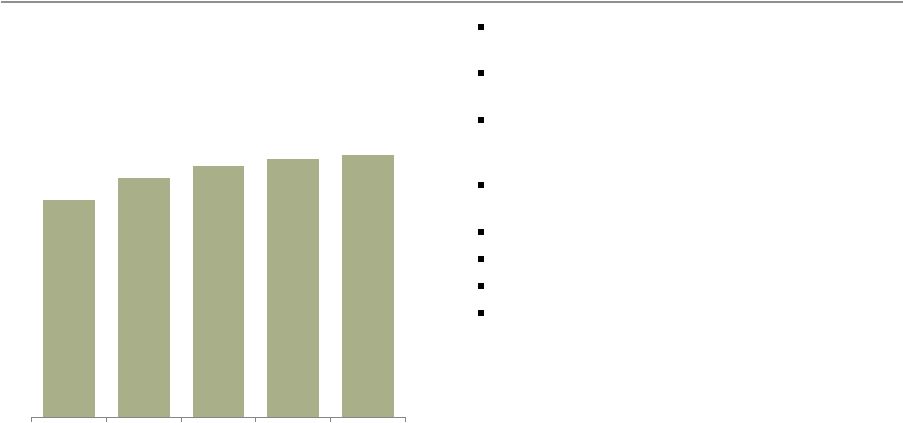
Record earnings of $4.1 billion, up 1% linked
quarter (LQ) and 20% year-over-year (YoY)
$0.73 diluted earnings per share, up 1% LQ and
20% YoY
Total revenue of $20.6 billion, up $977 million LQ
on both higher net interest income and
noninterest income
Pre-tax pre-provision profit
(1)
of $8.1 billion, up
$146 million LQ
Strong credit quality
ROA = 1.25%, up 16 bps YoY
ROE = 11.97%, up 102 bps YoY
Capital levels continued to grow
-
9.46% Tier 1 common equity ratio under Basel
I and estimated Tier 1 common equity ratio
under Basel III of 7.49%
(2)
4Q11 Results
Wells Fargo Net Income
($ in millions)
(1) Pre-tax pre-provision profit (PTPP) is total revenue less noninterest
expense. Management believes PTPP is a useful financial measure because it enables investors and others to assess
the Company’s ability to generate capital to cover credit losses through a credit cycle.
(2) Pro
forma
Basel
III
calculation
based
on
Tier
1
common
equity,
as
adjusted
to
reflect
management’s
interpretation
of
current
Basel
III
capital
proposals.
This
pro forma
calculation
is
subject
to
change
depending
on
final
promulgation
of
Basel
III
capital
rulemaking
and
interpretations
by
regulatory
authorities.
See
pages
43-44
for
additional information
regarding Tier 1 common equity ratios.
3,414
3,759
3,948
4,055
4,107
4Q10
1Q11
2Q11
3Q11
4Q11 |
 Wells Fargo
4Q11 Supplement 3
47%
53%
Balanced Spread and
Fee Income
Diversified Fee
Generation
11%
11%
17%
7%
11%
5%
19%
5%
14%
Service Charges
11%
Card Fees
7%
Other Banking Fees
11%
Mortgage Servicing, net
5%
Insurance
5%
Other Noninterest
Income
(1)
14%
Noninterest Income
47%
Net Interest Income
53%
Diversified Loan
Portfolio
Commercial Loans
40%
Consumer Loans
55%
Continued strong diversification
55%
40%
5%
Foreign Loans
5%
Mortgage Orig./Sales, net
19%
Trust, Investment & IRA fees 11%
Commissions & all other fees 17%
All data is for 4Q11.
(1)
Other noninterest income includes net gains (losses) on debt securities available for sale,
net gains from equity investments, net gains (losses) from trading activities, operating
leases and all other noninterest income. |
 Wells Fargo
4Q11 Supplement 4
Balance Sheet overview
Loans
Total period-end loans up $9.5 billion; core loans grew $13.7 billion; the
non-strategic/liquidating portfolio decreased $4.2 billion
(1)
Acquired
$2.1
billion
of
commercial
real
estate
loans
and
consolidated
$5.6
billion
of
reverse
mortgage
loans
(2)
previously sold
Organic loan growth of $6.0 billion
Securities available for
sale (AFS)
Balances
up
$15.4
billion,
as
we
continued
to
deploy
cash,
and
investments
were partially offset by runoff in 4Q11
Trading Assets
Balances up $20.0 billion reflecting conforming agency mortgages
pooled
into securities and held on balance sheet through year-end
VaR
(3)
relatively stable with an average daily VaR of $32 million in the
quarter
Deposits
Balances up $24.6 billion on increased balances from existing customers
and new account growth
Long-term debt
Balances down $7.9 billion on trust preferred securities (TRUPs)
redemptions and continued maturities
$9.0
billion
of
LTD
maturities
with
$2.5
billion
of
issuances
in
4Q11
Common stock
repurchases
Purchased 26.6 million common shares and entered into a 4Q11 forward
repurchase transaction that will settle in 1Q12 for an additional estimated
5.6 million shares |
 Wells Fargo
4Q11 Supplement 5
Income Statement overview
Net interest income
Up $350 million as growth in loans, securities and the mortgage
warehouse was partially offset by balance sheet repricing
Net interest margin (NIM) up 5 bps to 3.89%
Noninterest income
Mortgage banking up $531 million on higher origination volumes
Card fees down $333 million on lower debit card fees as a $365 million
decline
in
debit
interchange
fees
was
partially
offset
by
higher
credit
card fees
Market sensitive revenues
(1)
up $337 million
-
Trading includes $275 million higher deferred compensation plan
investments (offset in expense)
Other income included $153 million gain on sale of H.D. Vest
Noninterest expense
Deferred compensation up $266 million (offset in trading)
Mortgage and capital markets personnel expense up approximately
$300 million on higher revenues
Seasonally higher equipment and foreclosed asset expenses of
approximately $200 million
Approximately $100 million in higher costs related to the mortgage
servicing regulatory consent orders
All result comparisons are 4Q11 compared to 3Q11.
(1)
Includes
net
gains
(losses)
from
trading
activities,
net
gains
(losses)
on
debt
securities
available
for
sale
and
net
gains
from
equity
investments. |
 Wells Fargo
4Q11 Supplement 6
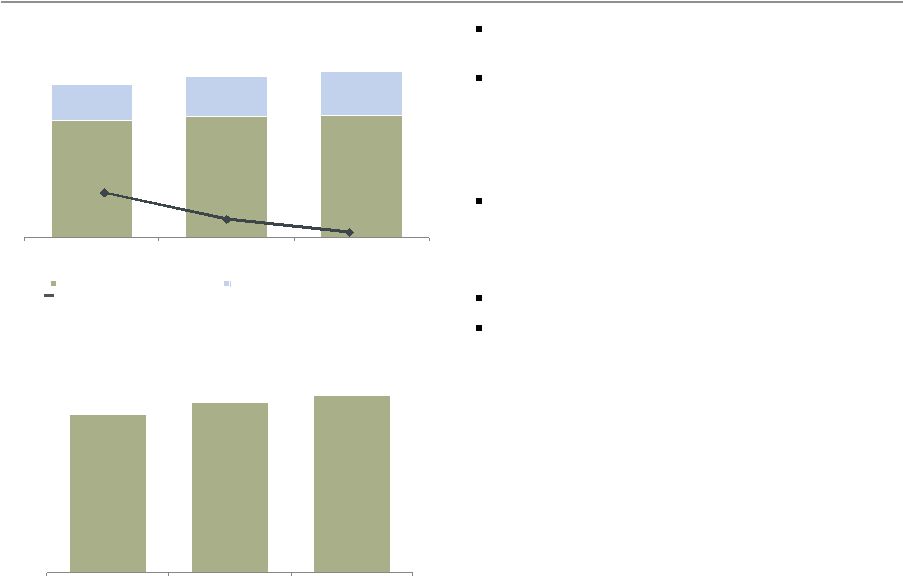
624.1
624.4
630.1
643.6
657.3
133.2
126.8
121.8
116.5
112.3
757.3
751.2
751.9
760.1
769.6
4Q10
1Q11
2Q11
3Q11
4Q11
Core loans
Non-strategic/liquidating loans
5.11%
5.03%
5.00%
4.87%
4.81%
Loans
Growth despite continued reduction in non-strategic/liquidating
portfolio Period-end loans up $9.5 billion from 3Q11
-
Commercial loans up $5.6 billion, or 2%, on
growth in C&I, CRE and foreign, driven by
portfolio acquisitions, new loans and new
customer activity
•
Included $2.1 billion of U.S.-based CRE loans
purchased
-
Consumer loans up $3.9 billion on the
consolidation of $5.6 billion of reverse mortgage
loans
(2)
and growth in credit card and core auto
more than offset non-strategic/liquidating
consumer loan runoff of $3.6 billion
Non-strategic/liquidating loans
(1)
down $4.2
billion from 3Q11
Core loans grew $13.7 billion, or 2%, from 3Q11
including organic loan growth of $6.0 billion
Total average loan yield of 4.81% down 6 bps LQ
and 30 bps YoY due to runoff of higher-yielding
loans including the non-strategic/liquidating
portfolio and addition of lower-yielding reverse
mortgages
-
Weighted average yield of the non-strategic
portfolio was 5.29%
in 4Q11
Period-end balances.
(1) See page 24 for additional information regarding the
non-strategic/liquidating portfolio, which comprises the Pick-a-Pay, liquidating home equity, legacy WFF indirect auto,
legacy
WFF
debt
consolidation,
Education
Finance-government
guaranteed
and
legacy
Wachovia
Commercial, Commercial
Real
Estate
and
other
PCI
loan
portfolios.
(2) Based on clarifying guidance from the SEC in 4Q11, sales of $5.6 billion of
reverse mortgages to a GNMA securitization program were reversed. The economics of these assets remain
with the third party investors in the securitizations and Wells Fargo earns a servicing
fee. Period–end Loans Outstanding
($ in billions)
(1)
Total average loan yield |
 Wells Fargo
4Q11 Supplement 7
640.1
661.4
665.4
197.9
221.2
246.7
838.0
882.6
912.1
4Q10
3Q11
4Q11
Interest-bearing deposits
Noninterest-bearing deposits
0.31%
0.25%
0.22%
Deposits
Strong growth and reduced average cost
Average deposits up $29.5 billion LQ to $912.1
billion
Average core deposits of $864.9 billion up $28.1
billion from 3Q11 and up $70.1 billion, or 9%, YoY
-
113% of average loans
-
Average retail core deposits up 5%
annualized LQ
Average core checking and savings up $30.9
billion, or 4% from 3Q11, and up $84.4 billion, or
12%, YoY
-
93% of average core deposits
Consumer checking accounts up a net 3.2% YoY
Average deposit cost of 22 bps down 3 bps from
3Q11 and 9 bps YoY
Average Deposits and Rates
($ in billions)
Average deposit cost
Average Core Checking and Savings
($ in billions)
715.7
769.2
800.1
4Q10
3Q11
4Q11 |
 Wells Fargo
4Q11 Supplement 8
Net interest income
Net Interest Income (TE)
(1)
($ in millions)
Tax-equivalent
net
interest
income
(1)
increased
$369 million from 3Q11; NIM up 5 bps
Average earning assets up $24.3 billion,
driven by:
-
$14.0 billion increase in loans
-
$23.5 billion increase in AFS securities
-
$16.7 billion supported increased mortgage
refinance activity ($10.2 billion in mortgages
held for sale and $6.5 billion in trading)
-
Growth in assets partially funded by draw
down of fed funds and short-term investments
of $30.9 billion
Increased balance sheet efficiency and pricing
discipline offset the impact of balance sheet
repricing and resulted in a margin increase
of 5 bps
-
Interest bearing deposit costs down 4 bps in
the quarter
-
Noninterest bearing deposits grew $25.5
billion
-
Long-term debt expense declined on the
maturity of debt and the redemption of $5.8
billion of TRUPs
-
Income from variable sources, including loan
prepayments and resolutions, up modestly
from 3Q11
11,224
10,812
10,851
10,714
11,083
4Q10
1Q11
2Q11
3Q11
4Q11
4.16%
4.05%
4.01%
3.84%
3.89%
Net Interest Margin (NIM)
(1)
Tax
equivalent
net
interest
income
is
based
on
the
federal
statutory
rate
of
35%
for
the
periods
presented.
Net
interest
income
was
$11,063
million,
$10,651
million,
$10,678
million,
$10,542 million and $10,892 million for 4Q10, 1Q11, 2Q11, 3Q11 and 4Q11, respectively.
|
 Wells Fargo
4Q11 Supplement 9
Noninterest income
Service charges on deposit account fees down 1% LQ
Trust and investment fees down 5% LQ as lower
retail brokerage asset-based fees and transaction
activity offset stronger investment banking
originations
Card fees down $333 million LQ as lower debit card
interchange income was partially offset by growth in
credit card fees
Mortgage banking up $531 million, or 29%, LQ on a
35% increase in originations
Insurance up 10% LQ on seasonally higher
underwriting gains
Trading gains up $872 million from a 3Q11 that
included the loss on resolving one legacy Wachovia
position, and included $275 million higher deferred
compensation plan investment results (P&L neutral),
and stronger core customer accommodation trading
Equity gains down $283 million LQ and included $85
million higher other-than-temporary impairment
Operating lease income down $224 million LQ on
lower lease settlement income
Other income up $402 million LQ on a $153 million
gain on the sale of H.D. Vest and a $102 million LQ
increase in reinsurance income (revenue neutral -
offset in trading)
10,431
9,678
9,708
9,086
9,713
4Q10
1Q11
2Q11
3Q11
4Q11
vs
vs
($ in millions)
4Q11
3Q11
4Q10
Noninterest income
Service charges on deposit accounts
$
1,091
(1)
%
5
Trust and investment fees
2,658
(5)
(10)
Card fees
680
(33)
(28)
Other fees
1,096
1
3
Mortgage banking
2,364
29
(14)
Insurance
466
10
(17)
Net gains (losses) from trading activities
430
nm
(19)
48
(84)
nm
Net gains from equity investments
61
(82)
(81)
Operating leases
60
(79)
(24)
Other
759
nm
68
Total nonterest income
$
9,713
7
%
(7)
Net gains (losses) on debt securities
available for sale |
 Wells Fargo
4Q11 Supplement 10
Noninterest expense
Noninterest expense up $831 million from 3Q11
driven by higher employee benefits expense,
incentive compensation, and seasonally higher
costs; down $832 million from 4Q10
-
Commission and incentive compensation
increased $163 million, or 8%, on higher
revenue-based compensation in mortgage
and capital markets
-
Employee benefits expense up $232 million
reflecting the $266 million increase in deferred
compensation expense
-
Equipment expense up $91 million on seasonally
higher software and system maintenance
-
Other expenses up $366 million and included:
•
$173 million increase in outside professional
services including ~$100 million in costs
related to the mortgage servicing regulatory
consent orders
•
$99 million increase in foreclosed assets
expense driven by seasonality
Additional 4Q11 expenses
-
Salaries expense included $133 million in
expense initiative severance expense vs. $111
million in 3Q11
-
$374 million of Wachovia integration costs in
4Q11 vs. $376 million in 3Q11
•
63% of merger integration costs in the quarter
were from outside professional services, contract
services and advertising
13,340
12,733
12,475
11,677
12,508
4Q10
1Q11
2Q11
3Q11
4Q11
vs
vs
($ in millions)
4Q11
3Q11
4Q10
Noninterest expense
Salaries
$
3,706
-
%
5
Commission and incentive compensation
2,251
8
3
Employee benefits
1,012
30
(15)
Equipment
607
18
(25)
Net occupancy
759
1
1
Core deposit and other intangibles
467
-
(15)
FDIC and other deposit assessments
314
(5)
4
Other
3,392
12
(16)
Total noninterest expense
12,508
7
(6)
|
 Wells Fargo
4Q11 Supplement 11
$11,677
$12,508
$266
$300
$200
$100
Deferred
Compensation
Mortgage
servicing
regulatory
consent
orders
expense
Seasonally
higher
equipment
and foreclosed
asset expense
Mortgage and
capital markets
personnel
costs, largely
incentive
compensation
3Q11
Noninterest
Expense
4Q11
Noninterest
Expense
Noninterest expense
4Q11 Increases from 3Q11
~
~
~
($ in millions) |
  Wells Fargo 4Q11
Supplement 12
Noninterest expense target
(1)
Reflects
management’s
current
targeted
noninterest
expense
in
4Q12,
which
is
subject
to
change
and
may
be
affected
by
a
variety
of
factors,
including
business and economic
cyclicality, seasonality, changes in our business composition and operating environment, growth
in our business and/or acquisitions, and unexpected expenses relating to, among other
things, litigation and regulatory matters.
Currently expect 1Q12 expenses to remain elevated driven by seasonally higher personnel
expenses and final quarter of integration expenses partially offset by continued gains
from efficiency and cost save initiatives Noninterest expense targeted to decline to $11
billion in 4Q12 -
2Q12 expense currently expected to decline by $500-700 million from reductions in 1Q12
personnel and merger costs
-
Full year 2012 expenses to benefit from ongoing expense efficiency and cost save
initiatives -
Savings drivers expected to include:
•
Consolidation of consumer lending businesses
•
Streamlined staff functions and combined technology efforts
•
Moderation in cyclically-high mortgage costs, including loss remediation
•
Streamlined customer experiences in key businesses
Quarterly expense trends may vary
($ in millions)
Actual
4Q11
Merger integration expense
$
374
-
Staff/technology
functions 2,343
2,050-2,150
Loss mitigation and foreclosed asset expense
718
600-650
Business optimization
8,910
8,100-8,450
Operating losses
163
not targeted
Total NIE
$
12,508
10,750-11,250
Targeted 4Q12
(1) |
 Wells Fargo
4Q11 Supplement 13
Community Banking
Higher segment earnings reflects stronger
mortgage banking revenues
Average loans increased 1% reflecting the move of
reserve mortgage loans on to the balance sheet as
well as growth in core auto, credit card and SBA
lending
Regional Banking
Solid combined net checking gains
-
Consumer checking up a net 3.2% from 4Q10
-
Business checking up a net 3.7% from 4Q10
Combined retail bank cross-sell of 5.92 products
per household up from 5.70
in 4Q10
-
West cross-sell = 6.29
-
East cross-sell = 5.43
Wells Fargo Home Mortgage
Mortgage originations up $31 billion from 3Q11
while application volumes were down 7%
Managed residential mortgage servicing of $1.8
trillion up 1% YoY
(1) Checking account growth is period-ending, 12-month rolling.
vs
vs
($ in millions)
4Q11
3Q11
4Q10
Net interest income
$
7,414
2
%
(4)
Noninterest income
5,590
7
(2)
Provision for credit losses
2,031
3
(27)
Noninterest expense
7,310
6
(7)
Income tax expense
1,082
(11)
29
Segment earnings
$
2,503
8
%
30
($ in billions)
Avg loans, net
493.9
1
(4)
Avg core deposits
$
568.3
2
4
4Q11
3Q11
4Q10
Regional Banking
Consumer checking account growth
(1)
3.2
%
5.6
7.5
Business checking account growth
(1)
3.7
3.8
4.8
Retail Bank cross-sell
5.92
5.91
5.70
vs
vs
($ in billions)
4Q11
3Q11
4Q10
Wells Fargo Home Mortgage
Applications
$
157
(7)
%
(1)
Application pipeline
72
(14)
(1)
Originations
120
35
(6)
Managed residential
mortgage servicing
($ in trillions)
$
1.8
-
1 |
 Wells Fargo
4Q11 Supplement 14
Wholesale Banking
Net interest income up 6% LQ on strong earning
assets and deposit growth
-
Average loans up $11.4 billion, or 4%, driven by
new loans from existing customers, new
customer growth and portfolio acquisitions
Noninterest income up 5% LQ primarily from
capital markets and investment banking results
Provision expense up $210 million LQ on $200
million lower reserve release
Expenses up 9% LQ driven by higher revenue-
based incentive compensation, as well as higher
operating losses, professional services, foreclosed
asset and travel expenses
Treasury Management
Commercial card spend volume of $3.44 billion
up 4% LQ and 25% YoY
Investment Banking
2011 U.S. investment banking market share
(2)
of
5.1% up from 4.2% in 2010
Asset Management
Total AUM down 7% and mutual funds AUM down
9% YoY
(1) Approved and initiated.
(2) Source: Dealogic U.S. investment banking fee market share.
vs
vs
($ in millions)
4Q11
3Q11
4Q10
Net interest income
$
3,081
6
%
4
Noninterest income
2,344
5
(18)
Provision for credit losses
32
nm
(84)
Noninterest expense
2,939
9
(2)
Income tax expense
815
(1)
(15)
Segment earnings
$
1,641
(9)
%
(3)
($ in billions)
Avg loans, net
$
264.8
4
15
Avg core deposits
223.2
7
21
vs
vs
($ in billions)
4Q11
3Q11
4Q10
Key Metrics:
Commercial card spend
volume
$
3.44
4
%
25
CEO Mobile Wire volume
(1)
2.2
(11)
nm
2011 U.S. investment
banking market share %
(2)
5.1
Total AUM
$
453
1
(7)
Advantage Funds AUM
214
1
(9)
|
 Wells Fargo
4Q11 Supplement 15
Wealth, Brokerage and Retirement
Net interest income up 6% LQ
-
Average loans relatively stable LQ and YoY
-
Average core deposits up 2% LQ and up 12% YoY
Noninterest income up 6% LQ on gains on deferred
compensation plan investments and the sale of
H.D. Vest
Total revenue increased 6%; excluding the $153
million H.D. Vest gain and $59 million of deferred
compensation plan investment gains vs. $128
million in losses in 3Q11, revenue was down 5% on
lower asset-based fees, retail brokerage
transaction revenue and securities gains
-
Brokerage managed account asset fees priced at
beginning of quarter, reflecting 9/30/2011 market
valuations
Expenses up 6% LQ primarily due to higher
deferred compensation expense; excluding $52
million deferred compensation expense vs. $125
million in 3Q11, expenses declined 1% on lower
revenue-based compensation expense
Retail Brokerage
Managed account assets up 7% LQ and 8% YoY
driven by strong net flows
Wealth Management
Wealth Management client assets
down 2% YoY
Retirement
IRA assets down 4% YoY
Institutional Retirement plan assets up 2% YoY
(1) Includes deposits.
(2) Data as of November 2011.
vs
vs
($ in millions)
4Q11
3Q11
4Q10
Net interest income
$
754
6
%
12
Noninterest income
2,311
6
(2)
Provision for credit losses
20
(58)
(82)
Noninterest expense
2,521
6
(3)
Income tax expense
199
12
64
Segment earnings
$
325
12
%
65
($ in billions)
Avg loans, net
42.7
(1)
(1)
Avg core deposits
$
136.6
2
12
vs
vs
($ in billions, except where noted)
4Q11
3Q11
4Q10
Key Metrics:
WBR Clients Assets
(1)
($ in trillions)$
1.3
3
%
(3)
Cross-sell
(2)
10.05
1
bps
25
Retail Brokerage
Financial Advisors
15,263
-
%
-
Managed account assets
$
254
7
8
Client assets
(1)
($ in trillions)
1.1
3
(3)
Wealth Management
Client assets
(1)
198
4
(2)
Retirement
IRA Assets
268
3
(4)
Institutional Retirement
Plan Assets
236
3
2 |
 Wells Fargo
4Q11 Supplement 16
Credit quality
Strong performance with stable net charge-offs
$2.6 billion net charge-offs, up $29 million LQ
though down 51% from 4Q09 peak
Provision expense of $2.0 billion, up $229
million from 3Q11, includes a $600 million
reserve release
(1)
in 4Q11 vs. $800 million in
3Q11
Allowance for credit losses = $19.7 billion
Remaining PCI nonaccretable = 27.5% of
remaining UPB
(2)
Credit metrics showed continued improvement
-
$879 million LQ decline in NPAs reflects $596
million decline in nonaccrual loans driven by
lower commercial real estate nonaccruals and
a $283 million decrease in foreclosed assets
-
Retail 30+ delinquency balances stable while
rates up modestly on lower loan balances
5.41
5.33
4.49
4.10
3.84
3.21
2.84
2.61
2.64
0.50
4Q09
1Q10
2Q10
3Q10
4Q10
1Q11
2Q11
3Q11
4Q11
Net Charge-offs
Credit Reserve Build
(0.50)
(0.65)
(0.85)
Reserve Release
3.99
3.45
2.99
5.33
5.91
(1) Reserve release represents the amount by which net charge-offs exceed the
provision for credit losses. (2) Unpaid principal balance for PCI loans that have
not had a UPB charge-off. Provision Expense
($ in billions)
2.21
(1.0)
1.84
(1.0)
1.81
(0.8)
2.04
(0.6) |
 Wells Fargo
4Q11 Supplement 17
2.0
1.7
1.5
1.5
1.5
0.6
0.7
0.3
0.4
0.5
2.6
2.4
1.8
1.9
2.0
4Q10
1Q11
2Q11
3Q11
4Q11
Consumer
Commercial
Credit quality
Nonperforming Assets
($ in billions)
$10
$15
$20
$25
4Q10
1Q11
2Q11
3Q11
4Q11
Loans 30+ DPD -
Retail Businesses
(1)
(Balances and rates)
Nonaccrual Loan Flows
Loans 90+ DPD and Still Accruing
(1) (2)
($ in billions)
6.85%
5.94%
5.77%
5.74%
5.81%
($ in billions)
4Q10
1Q11
2Q11
3Q11
4Q11
Commercial
Inflows
2.3
1.9
1.6
1.2
1.3
Outflows
(3.6)
(2.9)
(2.7)
(1.8)
(1.7)
Ending balance
11.3
10.3
9.2
8.6
8.2
Consumer
Inflows
4.3
4.0
3.4
3.5
3.5
Outflows
(5.1)
(4.2)
(4.3)
(4.0)
(3.7)
Ending balance
14.9
14.7
13.8
13.3
13.1
Total
$
26.2
25.0
23.0
21.9
21.3
26.2
25.0
23.0
21.9
21.3
6.1
5.5
4.9
4.9
4.7
32.3
30.5
27.9
26.8
26.0
4Q10
1Q11
2Q11
3Q11
4Q11
Nonaccrual loans
Foreclosed assets
(1)
Excludes mortgage loans insured/guaranteed by the FHA or VA and student loans whose
repayments are predominantly guaranteed by guarantee agencies on behalf of the U.S.
Department of Education under the Federal Family Education Loan Program. Also excludes the carrying value of PCI loans contractually delinquent. PCI loans 90
days or more past due were $8.7 billion in 4Q11, $8.9 billion in 3Q11, $9.8 billion in 2Q11,
$10.8 billion in 1Q11 and $11.6 billion in 4Q10. (2)
Consumer includes mortgage loans held for sale 90 days or more past due and still accruing.
|
 Wells Fargo
4Q11 Supplement 18
69%
20%
5%
6%
Mortgage servicing
Wells Fargo has a high quality servicing portfolio
Residential Mortgage Servicing Portfolio
$1.8 Trillion
(as of December 31, 2011)
Agency
Retained and acquired portfolio
Non-agency securitizations of
WFC originated loans
Non-agency acquired servicing
and private whole loan sales
69% of the portfolio is with the Agencies (FNMA,
FHLMC and GNMA)
20% are loans that we retained or acquired
-
Loss exposure handled through loan loss
reserves and PCI nonaccretable
5% are private securitizations where Wells Fargo
originated the loan and therefore has some
repurchase risk
-
79% prime at origination
-
58% from pre-2006 vintages
-
Insignificant amount of home equity and no
option ARMs
-
~50% do not have traditional reps and
warranties
6% are non-agency acquired servicing and
private whole loan sales
-
4% is acquired servicing where Wells Fargo
did not underwrite and securitize and has
repurchase recourse with the originator
-
2% are private whole loan sales
•
Less than 2% subprime at origination
•
Loans sold to others and subsequently
securitized are included in private
securitizations above |
 Wells Fargo
4Q11 Supplement 19
5.36%
5.85%
6.45%
9.53%
7.03%
7.61%
2.27%
2.52%
5.08%
4.01%
3.66%
4.14%
0%
2%
4%
6%
8%
10%
12%
14%
16%
Wells Fargo
Citi
JPM Chase
Bank of
America
Industry
Industry ex
WFC
Foreclosure Rate
Delinquency Rate
7.63%
8.37%
11.52%
13.54%
10.70%
11.75%
Mortgage servicing
Delinquency
ratios
lower
than
peers
and
total
repurchase
demands
stable
As of 3Q11, the delinquency and foreclosure ratio
of Wells Fargo’s servicing portfolio continued to
be lower than peers, per industry data
Wells Fargo’s total delinquency and foreclosure
ratio for 4Q11 was 7.96%, down from a peak of
8.96% in 4Q09
Total repurchase demands stable compared to
prior quarter and down approximately 31% from
a year ago
Agency
-
Agency repurchase demands outstanding up
modestly from 3Q11
•
Agency new demands for 2006-2008 vintages
are basically unchanged due to continued
elevated demands from FNMA; these elevated
demand levels are the primary driver of the 4Q
reserve build
•
FHLMC demands as well as newer vintage
demands continue to emerge consistent with
our estimates
-
Demands and losses continued to be concentrated
in the 2006 -
early 2008 vintages
Non-Agency
-
Non-agency repurchase demands outstanding,
which includes non-agency securities, whole loans
sold and acquired servicing, down for the fifth
consecutive quarter
(1) Inside Mortgage Finance, data as of September 30, 2011. Industry excluding WFC
performance calculated based on IMF data.
(2) Industry is all large servicers ($7.0 trillion) including WFC, C, JPM and BAC.
(3) Includes mortgage insurance rescissions.
(2)
Total
Outstanding
Repurchase
Demands
(3)
and
Agency New Demands for 2006-2008 Vintages
3Q11 Servicing Portfolio Delinquency
Performance
(1) |
 Wells Fargo
4Q11 Supplement 20
Capital
Capital remained strong and continued to grow internally
8.30%
8.93%
9.15%
9.34%
9.46%
4Q10
1Q11
2Q11
3Q11
4Q11
Tier 1 common equity ratio increased 12 bps
in 4Q11
Tier 1 common equity ratio under Basel III is
estimated to be 7.49% at 12/31/11
(1)
$5.8 billion of high-cost trust preferred securities
redeemed in 4Q11
-
Weighted average coupon of 8.42%
Purchased
26.6
million
common
shares
and
entered
into
a
4Q11
forward
repurchase
transaction
that
will
settle
in
1Q12
for
an
additional estimated 5.6 million shares
See
Appendix
page
43
for
additional
information
on
Tier
1
common
equity.
4Q11 capital ratios are preliminary estimates.
(1)
Pro
forma
Basel
III
calculation
based
on
Tier
1
common
equity,
as
adjusted
to
reflect
management’s
interpretation
of
current
Basel
III
capital
proposals.
This
pro forma calculation is
subject to change depending on final promulgation of Basel III capital rulemaking and
interpretations thereof by regulatory authorities. See page 44 for additional information.
Tier 1 Common Equity Ratio |
 Wells Fargo
4Q11 Supplement 21
Summary
Record earnings of $4.1 billion
Strong revenue growth
Robust earning asset growth on core loan growth and investment securities purchases
Expenses expected to remain elevated in 1Q12, continue to target
4Q12 expenses of $11 billion
Higher pre-tax pre-provision profit
(1)
of $8.1 billion
Strong credit quality
Solid returns
-
ROA = 1.25%
-
ROE = 11.97%
Capital levels continued to grow
(1) Pre-tax pre-provision profit (PTPP) is total revenue less noninterest
expense. Management believes that PTPP is a useful financial measure because it enables
investors and others to assess the Company’s ability to generate capital to cover credit
losses through a credit cycle. |
| Wells Fargo
4Q11 Supplement 22
Appendix
***************************************************
***************************************************
***************************************************
***************************************************
***************************************************
***************************************************
***************************************************
***************************************************
***************************************************
*************************************************** |
  Wells Fargo 4Q11
Supplement 23
Recent loan portfolio acquisitions
($ in billions)
Acquired from
2Q
3Q
4Q
Completed
Allied Irish/Bank of Ireland/Irish Bank Resolution Corp.
June - Dec
0.4
1.5
3.6
Pending
Burdale Financial Holdings Limited
Est. 1Q12
2011 Period-end balance
Date of
acquisition |
 Wells Fargo
4Q11 Supplement 24
(1) Net of purchase accounting adjustments.
-$27.6
-$8.2
-$8.2
Non-strategic/liquidating loan portfolio risk reduction
-$7.1
-$6.5
-$6.4
-$5.0
-$78.5
-$5.3
($ in billions)
4Q11
3Q11
2Q11
1Q11
4Q10
3Q10
2Q10
4Q08
Pick-a-Pay mortgage
(1)
$
65.7
67.4
69.6
71.5
74.8
77.3
80.2
82.9
85.2
95.3
Liquidating home equity
5.7
6.0
6.3
6.6
6.9
7.3
7.6
8.0
8.4
10.3
Legacy WFF indirect auto
2.5
3.1
3.9
4.9
6.0
7.1
8.3
9.7
11.3
18.2
Legacy WFF debt consolidation
16.5
17.2
17.7
18.4
19.0
19.7
20.4
21.4
22.4
25.3
Education Finance - gov't guaranteed
15.4
15.6
16.3
16.9
17.5
18.0
18.7
19.7
21.2
20.5
Legacy WB C&I, CRE and foreign PCI loans
(1)
5.7
6.3
7.0
7.5
7.9
9.2
10.3
11.8
13.0
18.7
Legacy WB other PCI loans
(1)
0.8
0.9
1.0
1.0
1.1
1.1
1.3
1.5
1.7
2.5
Total
$
112.3
116.5
121.8
126.8
133.2
139.7
146.8
155.0
163.2
190.8
4Q09
1Q10
-$4.2 |
 Wells Fargo
4Q11 Supplement 25
Purchased credit-impaired (PCI) portfolios
Legacy Wachovia continued to perform better than originally expected
(1) Includes
write-downs
taken
on
loans
where
severe
delinquency
(normally
180
days)
or
other
indications
of
severe
borrower
financial
stress
exist
that
indicate there will be a loss of
contractually due amounts upon final resolution of the loan.
(2) Reflects releases of $1.7 billion for loan resolutions and $4.2 billion from the
reclassification of nonaccretable difference to the accretable yield, which will result in increasing income
over the remaining life of the loan or pool of loans.
($ in billions)
Adjusted unpaid principal balance
(1)
December 31, 2008
$
29.2
62.5
6.5
98.2
September 30, 2011
8.3
38.1
1.9
48.3
December 31, 2011
8.5
36.9
1.8
47.2
Nonaccretable difference rollforward
12/31/08 Nonaccretable difference
$
10.4
26.5
4.0
40.9
Addition of nonaccretable difference due to acquisitions
0.2
-
-
0.2
Losses from loan resolutions and write-downs
(6.8)
(15.0)
(2.7)
(24.5)
Release of nonaccretable difference since merger
(2.9)
(2.4)
(0.6)
(5.9)
(2)
12/31/11 Remaining nonaccretable difference
0.9
9.1
0.7
10.7
Life-to-date net performance
Additional provision since 2008 merger
$
(1.7)
-
(0.1)
(1.8)
Release of nonaccretable difference since 2008 merger
2.9
2.4
0.6
5.9
(2)
Net performance
1.2
2.4
0.5
4.1
Commercial
Pick-a-Pay
Other
consumer
Total |
 Wells Fargo
4Q11 Supplement 26
(1) Release
of
the
nonaccretable
difference
for
settlement
with
borrower,
on
individually
accounted
PCI
loans,
increases
interest
income
in
the
period
of
settlement.
Pick-a-Pay and Other
consumer PCI loans do not reflect nonaccretable difference releases due to pool accounting for
those loans, which assumes that the amount received approximates the pool performance
expectations.
(2) Release
of
the
nonaccretable
difference
as
a
result
of
sales
to
third
parties
increases
noninterest
income
in
the
period
of
the
sale.
(3)
Reclassification
of
nonaccretable
difference
to
accretable
yield
for
loans
with
increased
cash
flow
estimates
will
result
in
increased
interest
income
as
a
prospective
yield adjustment over
the remaining life of the loan or pool of loans.
(4)
Write-downs to net realizable value of PCI loans are absorbed by the nonaccretable
difference when severe delinquency (normally 180 days) or other indications of severe borrower
financial stress exist that indicate there will be a loss of contractually due amounts upon
final resolution of the loan. (5) Unpaid principal balance of loans without
write-downs. $55 million nonaccretable difference released in 4Q11 into income due
to loan resolutions -
$44 million in net interest income; $11 million in noninterest income
$55 million reclassified to accretable yield in 4Q11
$10.7 billion in nonaccretable difference remains to absorb losses on PCI loans
-
Remaining
nonaccretable
=
27.5%
of
unpaid
principal
balance
(UPB)
(5)
•
Remaining
Pick-a-Pay
nonaccretable
=
28.9%
of
Pick-a-Pay
UPB
(5)
Nonaccretable difference established in purchase accounting for PCI loans absorbs losses
otherwise recorded as charge-offs
PCI nonaccretable difference
Analysis of nonaccretable difference for PCI loans
($ in millions)
Pick-a-Pay
Total
Balance at September 30, 2011
$
958
9,643
Addition of nonaccretable difference due to acquisitions
171
-
-
Release of nonaccretable difference due to:
Loans resolved by settlement with borrower
(1)
(44)
-
-
Loans resolved by sales to third parties
(2)
(11)
-
-
Reclassification to accretable yield for loans with improving credit-related cash flows
(3)
(55)
-
Use of nonaccretable difference due to:
Losses from loan resolutions and write-downs
(4)
(90)
(517)
Balance at December 31, 2011
$
929
9,126
171
-
(34)
(44)
(11)
(55)
(641)
Commercial
686
11,287
Other
consumer
652
10,707 |
 Wells Fargo
4Q11 Supplement 27
PCI accretable yield
4Q11 results included accretion of $552 million, in line with 3Q11
Balance of $16.0 billion expected to accrete to income over the remaining life of the
underlying loans Expected cash flows on all PCI portfolios are recalculated quarterly
including the adequacy of life-of-loan loss marks (nonaccretable
difference) -
4Q11
decrease
in
expected
cash
flows
of
$562
million
primarily
due
to
the
Pick-a-Pay
portfolio
•
Lifetime expected cash flows are updated quarterly and will fluctuate based on estimates and
assumptions •
Cash flow estimates are affected by changes in interest rates, liquidation timing, the pace
of the economic and housing recovery and projected lifetime performance of loan
modification activity •
The
PCI
cash
flows
remained
significantly
better
than
estimated
at
acquisition
(1) Includes accretable yield released as a result of settlements with borrowers, which
is included in interest income. (2) Includes accretable yield released as a
result of sales to third parties, which is included in noninterest income. (3)
Represents changes in cash flows expected to be collected due to changes in interest rates on variable rate PCI loans, changes in prepayment assumptions
and the impact of modifications.
Cumulative
Accretable yield rollforward
since
($ in millions)
4Q11
3Q11
merger
Total, beginning of period
$
16,896
14,871
10,447
Addition of accretable yield due to acquisitions
124
4
128
Accretion into interest income
(1)
(551)
(553)
(7,199)
Accretion into noninterest income due to sales
(2)
(1)
(3)
(237)
Reclassification from nonaccretable difference for loans with improving cash flows
55
108
4,213
Changes in expected cash flows that do not affect nonaccretable difference
(3)
(562)
2,469
8,609
Total, end of period
$
15,961
16,896
15,961 |
 Wells Fargo
4Q11 Supplement 28
$1.4 billion remains to be accreted into income over the remaining life of the portfolio
Most of portfolio tied to LIBOR
Weighted average life of the portfolio of 3.2 years has extended
over the past couple of quarters as shorter
duration portfolios have rolled off and period of future cash flow assumptions have been
extended Commercial PCI accretable yield
Includes both legacy Wachovia PCI loans as well as recently purchased PCI loans.
(1) Increase in accretion and accretable yield percentage is primarily due to
improvements in the expected cash flows. ($ in millions)
4Q11
3Q11
2Q11
PCI interest income
Accretion
(1)
$
198
220
186
Resolution income
44
65
36
Average carrying value
6,812
6,672
7,171
Accretable yield percentage
Accretion
(1)
11.62
%
13.20
10.36
Accretable yield balance
$
1,363
1,303
1,357
Weighted average life (years)
3.2
2.7
2.4
|
 Wells Fargo
4Q11 Supplement 29
$14.0 billion remains to be accreted into income over the remaining life of the
portfolio -
Based on updated cash flow valuations, there was no reclassification of nonaccretable to
accretable in 4Q11 -
Lifetime expected cash flows are updated quarterly and will fluctuate based on estimates and
assumptions •
Cash flow estimates are affected by changes in interest rates, liquidation timing, the pace
of the economic and housing recovery and projected lifetime performance of loan
modification activity Pick-a-Pay PCI accretable yield
($ in millions)
4Q11
3Q11
2Q11
PCI interest income
Accretion
$
326
310
352
Average carrying value
29,331
30,168
31,008
Accretable yield percentage
4.45
%
4.11
4.54
Accretable yield balance
$
14,018
14,989
12,884
Weighted average life (years)
11.0
11.0
10.0
|
 Wells Fargo
4Q11 Supplement 30
4Q11 Credit quality highlights
Net charge-offs of $2.6 billion up $29 million LQ
-
Commercial losses up $48 million as higher C&I
and foreign losses offset lower commercial real
estate
-
Consumer losses down $19 million as lower
consumer real estate 1-4 family junior lien and
credit card losses more than offset higher
consumer real estate 1-4 family first mortgage and
other revolving credit and installment
Total NPAs of $26.0 billion down $879 million
-
Nonaccrual loans down $596 million
-
Foreclosed assets down $283 million
•
56% of the balance are government guaranteed
loans and loans written down through purchase
accounting
$1.3 billion, or 28%, are government
guaranteed
$1.3 billion, or 28%, reflects shift from
PCI loans to REO ($465 million consumer
and $840 million C&I and CRE)
Currently expect future reserve releases absent
significant deterioration in the economy
Total
($ in millions)
Wells Fargo
Commercial loans
6,767
338,683
345,450
Consumer loans
29,952
394,229
424,181
Total period-end loans
36,719
732,912
769,631
Total nonaccrual loans
$
21,304
Total foreclosed assets
4,661
Total NPAs
$
25,965
as % of loans
3.37
%
Provision for credit losses
$
2,040
Net charge-offs
2,640
as % of avg loans
1.36
%
Commercial
0.54
Consumer
2.02
%
Allowance for credit losses
19,335 $
19,668
as % of loans
2.64
2.56
%
as % of nonaccrual loans
92
%
4Q11
PCI loans
Non PCI
loans |
 Wells Fargo
4Q11 Supplement 31
Commercial nonaccrual loans
4Q11 Total Commercial nonaccrual loans = $8,217 million
($ change in millions)
$1,890
$4,085
$47
$2,195
Commercial and Industrial & Lease
Financing:
CRE Construction:
CRE Mortgage:
Foreign
Inflows increased $0.2B
Outflows decreased<$0.1B
88% secured
40% guaranteed
78% current on interest
26% have already been written down
Inflows increased<$0.1B
Outflows decreased <$0.1B
54% guaranteed
40% current on interest
37% of NPLs have been written down
Inflows decreased <$0.1B; fifth
consecutive quarterly decline
Outflows remained relatively flat
65% guaranteed
56% current on interest
35% of NPLs have been written down
All comparisons are to 3Q11.
-
1,000
2,000
3,000
4,000
4Q10
1Q11
2Q11
3Q11
4Q11
Commercial Loans & Leases
Total Inflow
Total Outflow
NPL Balances
-
1,000
2,000
3,000
4,000
4Q10
1Q11
2Q11
3Q11
4Q11
CRE Construction
Total Inflow
Total Outflow
NPL Balances
-
1,000
2,000
3,000
4,000
5,000
6,000
4Q10
1Q11
2Q11
3Q11
4Q11
CRE Mortgage
Total Inflow
Total Outflow
NPL Balances |
 Wells Fargo
4Q11 Supplement 32
3,000
3,250
3,500
3,750
4,000
1,000
1,500
2,000
2,500
3,000
4Q10
1Q11
2Q11
3Q11
4Q11
Home Equity
Total Inflow
(Left)
Total Outflow
(Left)
RE NPL Balances
(Right)
$3,015
$2,476
$3,909
$3,488
Consumer real estate nonaccrual loans
Nonaccrual balances decreased $41mm
Inflows decreased <$0.1B
Outflows decreased <$0.2B
50% are 1-4 family first mortgage
78% is legacy WFF debt consolidation
-
Inflows were flat
-
Outflows increased 12%
-
41% written down; losses taken stable
from prior quarter
13% is WBR
Nonaccrual balances decreased slightly
41% written down; losses taken stable
from prior quarter
56% are > 180 DPD
Inflows increased <$0.1B
Outflows decreased <$0.2B
85% of NPLs held at current estimated
recoverable value
23% are TDRs for which impairment
has been recognized
See page 36 for additional information
4Q11 Total residential real estate nonaccrual loans = $12,888 million
Inflows stabilized while outflows slowed reflecting environment and seasonality
All comparisons are to 3Q11.
(1) Includes National Home Equity first and junior lines and loans.
(2) Total
inflows
and
outflows
tracked
on
left
scale
and
RE
NPL
balances
tracked
on
right
scale.
National
Home
Equity
(1)
:
Home Mortgage:
Pick-a-Pay:
Other Businesses:
($
change
in
millions)
(2)
-
1,000
2,000
3,000
4,000
5,000
-
1,000
2,000
3,000
4,000
4Q10
1Q11
2Q11
3Q11
4Q11
Home
Mortgage
Total Inflow
(Left)
Total Outflow
(Left)
RE NPL Balances
(Right)
2,000
3,000
4,000
5,000
500
1,000
1,500
2,000
2,500
4Q10
1Q11
2Q11
3Q11
4Q11
Pick-a-Pay
Total Inflow
(Left)
Total Outflow
(Left)
RE NPL Balances
(Right) |
 Wells Fargo
4Q11 Supplement 33
Commercial real estate (CRE) loan portfolio
Growth in outstandings includes the $2.1 billion
period-end balance of loans purchased in 4Q11
partially offset by paydowns
Nonaccruals down $369 million, or 34 bps
Net charge-offs down $39 million, or 13 bps, as
lower construction losses more than offset the $21
million increase in mortgage losses
29% of the portfolio is owner-occupied
($ in millions)
4Q11
3Q11
CRE outstandings
Real estate mortgage
$
105,975
104,363
Real estate construction
19,382
19,719
Total CRE outstandings
125,357
124,082
Nonaccrual loans
Real estate mortgage
4,085
4,429
Real estate construction
1,890
1,915
Total nonaccrual loans
5,975
6,344
as % of loans
4.77
%
5.11
Net charge-offs (recoveries)
Real estate mortgage
$
117
96
Real estate construction
(5)
55
Total net charge-offs
112
151
as % of avg loans
0.36
%
0.49
|
 Wells Fargo
4Q11 Supplement 34
Pick-a-Pay mortgage portfolio
Carrying value of $65.7 billion in first lien loans outstanding,
down $1.7 billion from 3Q11 and down $29.7
billion from 4Q08 on paid-in-full loans and loss mitigation efforts
-
Adjusted unpaid principal balance of $73.4 billion, down $2.2 billion from 3Q11 and down $42.3
billion from 4Q08
-
$4.0 billion in modification principal forgiveness since acquisition reflects over 99,000
completed full-term modifications; additional $516 million of conditional
forgiveness that can be earned by borrowers through performance over the next 3 years
-
Modification redefault rate has been consistently better than the industry average (as
measured by 60+ DPD after six months) as we have strived to give customers an
affordable, sustainable payment -
Pick-a-Pay loans with negative amortization potential decreased $2.2 billion from 3Q11
to 53% of loans Total portfolio deferred interest of $2.0 billion down $127 million from
3Q11 and down $2.3 billion from 4Q08; down for eleventh consecutive quarter
($ in millions)
Product type
Adjusted
unpaid
principal
% of total
Adjusted
unpaid
principal
% of total
Adjusted
unpaid
principal
% of total
Option payment loans
(1)
$
39,164
53
%
$
49,958
59
%
$
99,937
86
%
Non-option payment adjustable-rate and
fixed-rate loans
(1)
9,986
14
11,070
13
15,763
14
Full-term loan modifications
(1)
24,207
33
23,132
28
-
-
Total adjusted unpaid principal balance
(1)
$
73,357
100
%
$
84,160
100
%
$
115,700
100
%
Total carrying value
65,652
74,815
95,315
At 12/31/2011
At 12/31/2010
At 12/31/2008
(1)
Adjusted unpaid principal includes write-downs taken on loans where severe delinquency
(normally 180 days) or other indications of severe borrower financial stress exist that
indicate there will be a loss of contractually due amounts upon final resolution of the loan. |
 Wells Fargo
4Q11 Supplement 35
Pick-a-Pay credit highlights
Non-PCI portfolio
Loans down 3% driven by loans paid-in-full
84% of portfolio current
Nonaccrual loans relatively stable
-
85% of loans written down to current net
recoverable value (See page 36)
-
New inflows of $0.7 billion, flat from 3Q11
-
$211 million of nonaccrual TDRs reclassified to
accruing TDR status based on borrower payment
performance
$3.9 billion in nonaccruals includes $886 million of
nonaccruing TDRs
Net charge-offs of $196 million in 4Q11,
consistent with expectations and an annualized
loss rate of 2.11%
41% of portfolio with LTV
(2)
80%
PCI portfolio
Carrying value down 2%
67% of portfolio current, consistent with 3Q11
Life-of-loan losses continued to be lower than
originally projected at time of merger
(1)
The carrying value, which does not reflect the allowance for loan losses, includes purchase
accounting adjustments, which, for PCI loans, are the nonaccretable difference
and
the
accretable
yield,
and
for
all
other
loans,
an
adjustment
to
mark
the
loans
to
a
market
yield
at
date
of
merger
less
any
subsequent
charge-offs.
(2) The
current
loan-to-value
(LTV)
ratio
is
calculated
as
the
net
carrying
value
(defined
in
(1)
above)
divided
by
the
collateral
value.
(3) The
adjusted
unpaid
principal
balance
includes
write-downs
taken
on
loans
where
severe
delinquency
(normally
180
days)
or
other
indications
of
severe
borrower
financial
stress
exist
that
indicate there will be a loss of contractually due amounts upon final resolution of the
loan. ($ in millions)
4Q11
3Q11
Non-PCI loans
Carrying value
(1)
$
36,596
37,646
Nonaccrual loans
3,909
3,900
as a % of loans
10.68
%
10.36
Net charge-offs
$
196
220
as % of avg loans
2.11
%
2.30
90+ days past due
as % of loans
10.07
9.53
Current average LTV
(2)
86
%
85
Current average FICO
681
682
Contractual average loan size
$
210,000
211,000
Contractual average age of loans
7.79
years
7.54
% of loans in California
49
%
49
($ in millions)
3Q11
PCI loans
Adjusted unpaid principal balance
(3)
$
36,905
38,060
Carrying value
(1)
29,056
29,715
Current average LTV
(2)
91
%
89
Current average FICO
610
608
Contractual average loan size
$
311,000
311,000
Contractual average age of loans
5.75
years
5.50
% of loans in California
68
%
67
|
 Wells Fargo
4Q11 Supplement 36
Pick-a-Pay nonaccrual loan composition
85% of Pick-a-Pay nonaccruals held at estimated recoverable value vs. 84% at 3Q11,
reflecting write-downs and/or LTV
100%
Allowance
available
for
the
remaining
15%
that
have
not
yet
been
written
down
5% of the nonaccruals are performing modifications
-
Performing modifications move to accruing status after six consecutive payments are made
12/31/11 Total $3,909 million
20%
15%
23%
42%
Charge-offs to date of $681 million
(29% of original balance)
65% of loans have LTV<80%
34% of loans have LTV
80% but
<100%
1% of loans have LTV
100%
(1)
Initial charge-offs usually not taken
until 180 DPD ($44 million taken to
date)
Expected losses included in allowance
Charge-offs/principal forgiveness to
date of $226 million (20% of
original balance)
Additionally, we hold expected life-
of-loan loss reserves in allowance
LTV is considered to be over 100% if the loan balance exceeds current estimated appraised
value based on automated valuation methodology or updated appraisal where available.
Calculation excludes unpaid principal balance of related equity lines of credit that share common collateral. Does not include PCI Pick-a-Pay since they
are considered to be accruing under PCI loan accounting for accretable yield and accrual
status is not based on contractual interest payments. (1) Loans with LTV>100%
are currently in modification trial periods. 180 DPD written down to estimated
recoverable value
0-179 DPD
Loan modifications (TDRs)
180 DPD updated LTV
100% |
 Wells Fargo
4Q11 Supplement 37
Real estate 1-4 family first mortgage portfolio
First lien mortgage loans up $7.5 billion on the
consolidation of $5.6 billion of reverse mortgages;
runoff portfolios declined $2.4 billion
-
Pick-a-Pay non-PCI portfolio down 3%
-
PCI portfolio down 2%
-
Debt consolidation down 4%
-
Core first lien up 5%
Debt consolidation charge-offs increased $53
million
Core first lien mortgage nonaccruals down $90
million, or 24 bps
Core net charge-offs down $6 million
(1) Ratios on WFF debt consolidation loan portfolio only.
(2) Ratios on non runoff first lien mortgage loan portfolio only.
($ in millions)
4Q11
3Q11
Total real estate 1-4 family first mortgage
$
228,894
223,758
Less consumer non-strategic/liquidating portfolios:
Pick-a-Pay non-PCI first lien mortgage
36,596
37,646
PCI first lien mortgage
29,746
30,446
WFF debt consolidation portfolio
16,542
17,186
Core first lien mortgage
146,010
138,480
Nonaccrual loans
$
2,304
2,334
as % of loans
13.93 %
13.58
Net charge-offs
$
244
191
as % of average loans
5.78 %
4.37
Nonaccrual loans
$
4,700
4,790
as % of loans
3.22 %
3.46
Net charge-offs
$
404
410
as % of loans
1.10 %
1.17
WFF debt consolidation mortgage loan performance
(1)
Core first lien mortgage loan performance
(2) |
 Wells Fargo
4Q11 Supplement 38
Home equity portfolio
Core Portfolio
(1)
Outstandings
down 2%
-
High quality new originations with weighted
average CLTV of 61%, 778 FICO, and 32% total
debt service ratio
4Q11 losses down $35 million, or 9 bps
2+ delinquencies decreased $7 million
Delinquency rate for loans with a CLTV >100%
relatively stable
Unsecured balances
(3)
stable at 17%
Liquidating Portfolio
Outstandings down 5%
4Q11 losses down $5 million
2+ delinquencies declined $11 million
Continued decline in delinquency rate for loans
with a CLTV >100%, 4 bps improvement
Excludes purchased credit-impaired loans.
(1) Includes equity lines of credit and closed-end junior liens associated with
the Pick-a-Pay portfolio totaling $1.5 billion at December 31, 2011, and $1.5 billion at September 30, 2011.
(2) CLTV
is
calculated
based
on
outstanding
balance
plus
unused
lines
of
credit
divided
by
estimated
home
value.
Estimated
home
values
are
determined
predominantly
based on
automated valuation models updated through December 2011.
(3) Unsecured balances, representing the percentage of outstanding balances above the
most recent home value. ($ in millions)
4Q11
3Q11
Core Portfolio
(1)
Outstandings
100,882
103,100
Net charge-offs
718
753
as % of avg loans
2.79
%
2.88
2+ payments past due
3,146
3,153
as % loans
3.13
%
3.07
% CLTV > 100%
(2)
36
35
2+ payments past due
4.42
%
4.40
% Unsecured balances
(3)
17
17
% 1st lien position
20
20
Liquidating Portfolio
Outstandings
5,710
5,982
Net charge-offs
134
139
as % of avg loans
9.09
%
8.97
2+ payments past due
270
281
as % loans
4.73
%
4.69
% CLTV > 100%
(2)
74
73
2+ payments past due
5.02
%
5.06
% 1st lien position
4
4 |
 Wells Fargo
4Q11 Supplement 39
$106.6 billion home equity portfolio
-
20% in 1
st
lien position
-
40%
in
junior
lien
position
behind
WFC
owned
or
serviced
1
st
lien
-
40%
in
junior
lien
position
behind
third
party
1
lien
Excludes purchased credit-impaired loans.
(1) Delinquency represents two or more payments past due as of November 2011.
Home equity portfolio
Delinquency Status
(1)
of Junior Liens Behind a Wells Fargo 1
st
Lien
Delinquency Status
Current 1
st
lien, Current junior lien
95.6
%
Current 1
st
lien, Delinquent junior lien
1.1
Delinquent 1
st
lien, Current junior lien
1.5
Delinquent 1
st
lien, Delinquent junior lien
1.8
Outstanding Balance %
st |
 Wells Fargo
4Q11 Supplement 40
Credit card portfolio
$22.8 billion credit card outstandings up 5% from
3Q11 on new customer growth and higher
consumer spending from existing customers
-
New accounts increased 6% in the quarter with
household penetration increasing to 27.0%
(1)
•
East penetration of 16.6%
(1)
-
Purchase dollar volumes increased 6% and
transactions grew 7% from 3Q11
-
Purchase dollar volume increased 13% and
transactions grew 16% from 4Q10
Net charge-offs down $10 million LQ, or 27 bps,
reflecting continued steady improvement
(1) Household penetration as of November, 2011 and defined as the percentage of retail
banking deposit households that have a credit card with Wells Fargo. ($ in millions)
4Q11
3Q11
Credit card outstandings
$
22,836
21,650
Net charge-offs
256
266
as % of avg loans
4.63
%
4.90 |
 Wells Fargo
4Q11 Supplement 41
Auto portfolio
Core Portfolio
Total outstandings up 1% LQ and up 8% YoY
-
Originations were down 6% LQ reflecting
increased competition in the marketplace; 2011
originations increased 11% from 2010
Net charge-offs relatively stable on strong used
car values
-
December Manheim index of 125.1, up 2% LQ
and up 1% from December 2010
30+ days past due increased $59 million LQ, or
11 bps, reflecting expected seasonality and
portfolio growth
Liquidating Portfolio
(1)
Legacy Wells Fargo Financial indirect auto
outstandings down 21% LQ driven by paydowns
(1) Legacy Wells Fargo Indirect portfolio.
($ in millions)
4Q11
3Q11
Core Portfolios
Direct
Auto outstandings
$
2,529
2,636
Nonaccrual loans
67
75
as % of loans
2.66
%
2.84
Net charge-offs
$
16
11
as % of avg loans
2.43
%
1.57
30+ days past due
$
75
66
as % of loans
2.98
%
2.49
Indirect
Auto outstandings
$
39,647
39,139
Nonaccrual loans
9
12
as % of loans
0.02
%
0.03
Net charge-offs
$
68
69
as % of avg loans
0.69
%
0.71
30+ days past due
$
571
521
as % of loans
1.44
%
1.33
Auto outstandings
$
2,455
3,101
Nonaccrual loans
83
97
as % of loans
3.39
%
3.14
Net charge-offs
$
31
25
as % of avg loans
4.47
%
2.85
30+ days past due
$
230
208
as % of loans
9.35
%
6.72
Liquidating portfolio
(1) |
| Wells Fargo
4Q11 Supplement 42
Forward-looking statements and additional information
Forward-looking statements:
This Quarterly Supplement and management’s related presentation contain
forward-looking statements about our future financial performance.
These
forward-looking
statements
include
statements
using
words
such
as
“believe,”
“expect,”
“anticipate,”
“estimate,”
“target”, “should,”
“may,”
“can,”
“will,”
“outlook,”
“appears”
or similar expressions. These forward-looking statements may include,
among others, statements about: expected or estimated future losses in our loan portfolios,
including our belief that the allowance for loan losses is expected to decline;
expected or estimated loan loss reserve releases; mortgage repurchase exposure; exposure
related to mortgage practices, including foreclosures and servicing; our noninterest expense,
including our targeted noninterest expense for first quarter 2012 and fourth quarter
2012 as part of our expense management initiatives; the future economic
environment;
loan
growth;
reduction
or
mitigation
of
risk
in
our
loan
portfolios;
future
effects
of
loan
modification
programs;
life-of-
loan loss estimates; the estimated impact of regulatory reform on our financial results and
business and expectations regarding our efforts
to
mitigate
such
impact;
and
our
estimated
Tier
1
common
equity
ratio
as
of
December
31,
2011,
under
proposed
Basel
capital rules. Investors are urged to not unduly rely on forward-looking statements as
actual results could differ materially from expectations.
Forward-looking
statements
speak
only
as
of
the
date
made,
and
we
do
not
undertake
to
update
them
to
reflect
changes or events that occur after that date. For more information about factors that could
cause actual results to differ materially from expectations, refer to page 14 of Wells
Fargo’s press release announcing our fourth quarter 2011 results, as well as Wells
Fargo’s
reports
filed
with
the
Securities
and
Exchange
Commission,
including
the
discussion
under
“Risk
Factors”
in
our
Quarterly
Reports on Form 10-Q for the periods ended June 30, 2011 and September 30, 2011.
Purchased credit-impaired loan portfolio:
Loans that were acquired from Wachovia that were considered credit impaired were written down
at acquisition date in purchase accounting to an amount estimated to be collectible and
the related allowance for loan losses was not carried over to Wells Fargo’s
allowance. In addition, such purchased credit-impaired loans are not classified as
nonaccrual or nonperforming, and are not included in loans that were contractually 90+
days past due and still accruing. Any losses on such loans are charged against the nonaccretable
difference established in purchase accounting and are not reported as charge-offs (until
such difference is fully utilized). As a result of accounting for purchased loans with
evidence of credit deterioration, certain ratios of the combined company are not comparable to a
portfolio that does not include purchased credit-impaired loans.
In certain cases, the purchased credit-impaired loans may affect portfolio credit ratios
and trends. Management believes that the presentation of information adjusted to
exclude the purchased credit-impaired loans provides useful disclosure regarding the credit
quality of the non-impaired loan portfolio. Accordingly, certain of the loan balances and
credit ratios in this Quarterly Supplement have been adjusted to exclude the purchased
credit-impaired loans. References in this Quarterly Supplement to impaired loans mean
the
purchased
credit-impaired
loans.
Please
see
pages
31-33
of
the
press
release
for
additional
information
regarding
the
purchased
credit-impaired loans. |
 Wells Fargo
4Q11 Supplement 43
Tier 1 common equity under Basel I
(1)
Quarter ended
Dec. 31,
Sept. 30,
June 30,
Mar. 31,
Dec. 31,
2011
2011
2011
2011
2010
$
141.7
139.2
137.9
134.9
127.9
(1.5)
(1.5)
(1.5)
(1.5)
(1.5)
140.2
137.7
136.4
133.4
126.4
(10.6)
(10.6)
(10.6)
(10.6)
(8.1)
(34.0)
(34.4)
(34.6)
(35.1)
(35.5)
3.8
4.0
4.1
4.2
4.3
(0.8)
(0.7)
(0.9)
(0.9)
(0.9)
(3.1)
(3.7)
(5.3)
(4.9)
(4.6)
(0.4)
(0.4)
(0.3)
(0.1)
(0.3)
(A)
$
95.1
91.9
88.8
86.0
81.3
(B)
$
1,005.3
983.2
970.2
962.9
980.0
(A)/(B)
9.46
%
9.34
9.15
8.93
8.30
(1)
(2)
Total risk-weighted assets
(2)
Tier 1 common equity to total risk-weighted assets
Cumulative other comprehensive income
Under the regulatory guidelines for risk-based capital,
on-balance sheet assets and credit equivalent amounts of derivatives and off-balance sheet items are assigned to one of several broad risk
categories according to the obligor or, if relevant, the guarantor or
the nature of any collateral. The aggregate dollar amount in each risk category is then multiplied by the risk weight associated with
that category. The resulting weighted values from each of the risk
categories are aggregated for determining total risk-weighted assets. The Company's December 31, 2011, preliminary risk-weighted
assets reflect estimated on-balance sheet risk-weighted assets
of $838.7 billion and derivative and off-balance sheet risk-weighted assets of $166.6 billion.
Tier 1 common equity is a non-generally accepted accounting
principle (GAAP) financial measure that is used by investors, analysts and bank regulatory agencies to assess the capital position of financial
services companies. Management reviews Tier 1 common equity along with
other measures of capital as part of its financial analyses and has included this non-GAAP financial information, and the
corresponding reconciliation to total equity, because of current
interest in such information on the part of market participants.
Other
Tier 1 common equity
MSRs over specified limitations
Wells Fargo & Company and Subsidiaries
($ in billions)
Total equity
Noncontrolling interests
Total Wells Fargo stockholders' equity
Adjustments:
FIVE QUARTER TIER 1 COMMON EQUITY UNDER BASEL I
(1)
Preferred equity
Goodwill and intangible assets (other than MSRs)
Applicable deferred taxes |
 Wells Fargo
4Q11 Supplement 44
Tier 1 common equity under Basel III (Estimated)
(1)
Quarter ended
Dec. 31,
2011
$
95.1
3.1
Other
0.3
(C)
98.5
(D)
$
1,314.6
(C)/(D)
7.49
%
(1)
(2)
Tier
1
common
equity
is
a
non-generally
accepted
accounting
principle
(GAAP)
financial
measure
that
is
used
by
investors,
analysts
and
bank regulatory agencies to assess the capital position of financial
services companies. Management reviews Tier 1 common equity along
with other measures of capital as part of its financial analyses and has included this non-GAAP financial information, and the
corresponding
reconciliation
to
total
equity,
because
of
current
interest
in
such
information
on
the
part
of
market
participants.
Wells Fargo & Company and Subsidiaries
TIER 1 COMMON EQUITY UNDER BASEL III (ESTIMATED)
(1)
($ in billions)
Tier 1 common equity under Basel I
Adjustments from Basel I to Basel III:
Cumulative other comprehensive income
(2)
Tier 1 common equity anticipated under Basel III
Total risk-weighted assets anticipated under Basel III
(3)
Tier 1 common equity to total risk-weighted assets
anticipated under Basel III
Volatility in interest rates can have a significant impact on the
valuation of cumulative other comprehensive income and MSRs and
therefore, impact adjustments under Basel III in future reporting
periods. (3)
Under
current
Basel
proposals,
risk-weighted
assets
incorporate
different
classifications
of
assets,
with
certain
risk
weights
based
on
a
borrower's
credit
rating
or
Wells
Fargo's
own
risk
models,
along
with
adjustments
to
address
a
combination
of
credit/counterparty,
operational
and
market
risks,
and
other
Basel
III
elements.
The
amount
of
risk-weighted
assets
anticipated
under
Basel
III
is
preliminary
and subject to change depending on final promulgation of Basel III
capital rulemaking and interpretations thereof by regulatory
authorities. |