Attached files
| file | filename |
|---|---|
| EX-23.1 - CONSENT OF GRANT THORNTON LLP - U.S. SILICA HOLDINGS, INC. | d203459dex231.htm |
Table of Contents
As filed with the Securities and Exchange Commission on January 17, 2012
Registration No. 333-175636
UNITED STATES
SECURITIES AND EXCHANGE COMMISSION
Washington, D.C. 20549
AMENDMENT NO. 6 TO
FORM S-1
REGISTRATION STATEMENT
UNDER THE SECURITIES ACT OF 1933
U.S. Silica Holdings, Inc.
(Exact name of registrant as specified in its charter)
| Delaware | 1446 | 26-3718801 | ||
| (State or other jurisdiction of incorporation or organization) |
(Primary Standard Industrial Classification Code Number) |
(I.R.S. Employer Identification No.) |
8490 Progress Drive, Suite 300
Frederick, Maryland 21701
(800) 345-6170
(Address, including zip code, and telephone number, including area code, of registrant’s principal executive offices)
Bryan A. Shinn
President and Chief Executive Officer
U.S. Silica Holdings, Inc.
8490 Progress Drive, Suite 300
Frederick, Maryland 21701
(800) 345-6170
(Name, address, including zip code, and telephone number, including area code, of agent for service)
Copies of all communications, including communications sent to agent for service, should be sent to:
| Robert M. Hayward, P.C. Kirkland & Ellis LLP 300 North LaSalle Chicago, Illinois 60654 (312) 862-2000 |
Michael Kaplan Davis Polk & Wardwell LLP 450 Lexington Avenue New York, New York 10017 (212) 450-4000 |
Approximate date of commencement of proposed sale to the public: As soon as practicable after this Registration Statement becomes effective.
If any of the securities being registered on this Form are to be offered on a delayed or continuous basis pursuant to Rule 415 under the Securities Act of 1933, check the following box: ¨
If this Form is filed to register additional securities for an offering pursuant to Rule 462(b) under the Securities Act, please check the following box and list the Securities Act registration statement number of the earlier effective registration statement for the same offering. ¨
If this Form is a post-effective amendment filed pursuant to Rule 462(c) under the Securities Act, check the following box and list the Securities Act registration statement number of the earlier effective registration statement for the same offering. ¨
If this Form is a post-effective amendment filed pursuant to Rule 462(d) under the Securities Act, check the following box and list the Securities Act registration statement number of the earlier effective registration statement for the same offering. ¨
Indicate by check mark whether the registrant is a large accelerated filer, an accelerated filer, a non-accelerated filer, or a smaller reporting company. See the definitions of “large accelerated filer,” “accelerated filer” and “smaller reporting company” in Rule 12b-2 of the Exchange Act. (Check one):
| Large accelerated filer ¨ | Accelerated filer ¨ | Non-accelerated filer x | Smaller reporting company ¨ | |||
| (Do not check if a smaller reporting company) | ||||||
CALCULATION OF REGISTRATION FEE
| Title of Each Class of Securities to be Registered |
Amount to be Registered(1) |
Proposed Maximum Offering Price per Share(2) |
Proposed Maximum Aggregate Offering Price(2) |
Amount
of Registration Fee(3) |
||||||||||||
| Common Stock, $0.01 par value per share |
13,529,411 | $ | 18.00 | $ | 243,529,398 | $ | 27,909 | |||||||||
| (1) | Includes 1,764,706 shares of common stock that the underwriters may purchase from the selling stockholder pursuant to the option to purchase additional shares. |
| (2) | Estimated solely for the purpose of calculating the registration fee pursuant to Rule 457(a) under the Securities Act of 1933, as amended. |
| (3) | Calculated pursuant to Rule 457(a) based on an estimate of the proposed maximum aggregate offering price. Registration fees of $23,220 were previously paid on July 18, 2011 pursuant to Rule 457(o) based on an estimate of the proposed maximum aggregate offering price. |
The registrant hereby amends this Registration Statement on such date or dates as may be necessary to delay its effective date until the registrant shall file a further amendment which specifically states that this Registration Statement shall thereafter become effective in accordance with Section 8(a) of the Securities Act of 1933 or until this Registration Statement shall become effective on such date as the Commission, acting pursuant to said Section 8(a), may determine.
Table of Contents
The information in this prospectus is not complete and may be changed. Neither we nor the selling stockholder may sell these securities until the registration statement filed with the Securities and Exchange Commission is effective. This prospectus is not an offer to sell these securities and it is not soliciting offers to buy these securities in any state where the offer or sale is not permitted.
PROSPECTUS (Subject to Completion)
Issued January 17, 2012
11,764,705 SHARES

U.S. Silica Holdings, Inc.
COMMON STOCK
U.S. Silica Holdings, Inc. is offering 2,941,176 shares of its common stock and the selling stockholder is offering 8,823,529 shares. This is our initial public offering and no public market exists for our shares. We anticipate that the initial public offering price will be between $16.00 and $18.00 per share.
Our common stock has been approved for listing on the New York Stock Exchange under the symbol “ SLCA.”
Investing in the common stock involves risks. See “Risk Factors” beginning on page 15.
PRICE $ PER SHARE
| Price to |
Underwriting |
Proceeds to |
Proceeds to | |||||
| Per share |
$ | $ | $ | $ | ||||
| Total |
$ | $ | $ | $ | ||||
To the extent that the underwriters sell more than 11,764,705 shares of common stock, the underwriters have the option for a period of 30 days from the date of this prospectus to purchase up to an additional 1,764,706 shares from the selling stockholder at the initial public offering price less the underwriting discount.
The Securities and Exchange Commission and state securities regulators have not approved or disapproved these securities, or determined if this prospectus is truthful or complete. Any representation to the contrary is a criminal offense.
The underwriters expect to deliver the shares of common stock to purchasers on , 2012.
| MORGAN STANLEY | BofA MERRILL LYNCH | JEFFERIES |
| SIMMONS & COMPANY INTERNATIONAL | DAHLMAN ROSE & COMPANY | BB&T CAPITAL MARKETS | ||
| BNP PARIBAS | LAZARD CAPITAL MARKETS |
MOELIS & COMPANY | ||
, 2012
Table of Contents
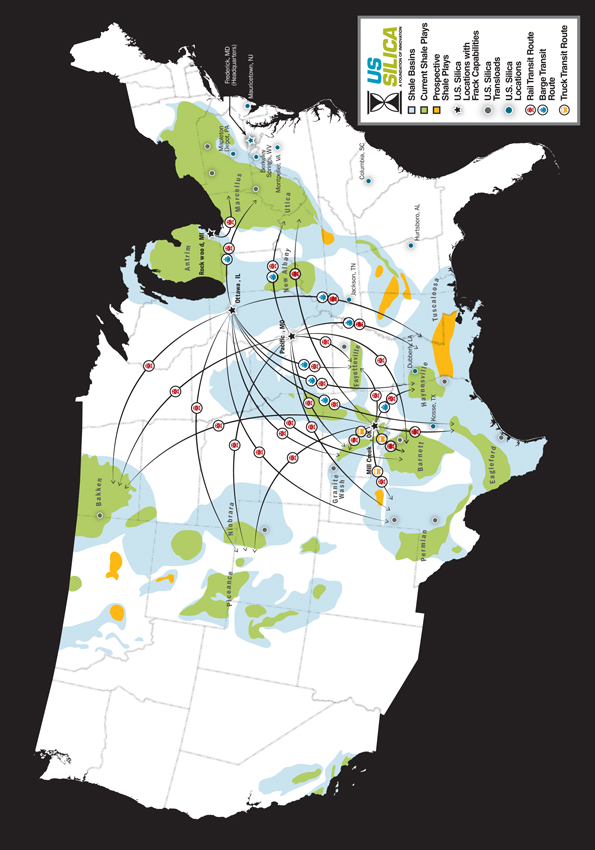
Table of Contents
We, the selling stockholder and the underwriters have not authorized anyone to provide any information other than that contained in this prospectus or in any free writing prospectus prepared by or on behalf of us or to which we have referred you. We and the selling stockholder take no responsibility for, and can provide no assurance as to the reliability of, any other information that others may give you. We and the selling stockholder are offering to sell, and seeking offers to buy, shares of our common stock only in jurisdictions where offers and sales are permitted. The information contained in this prospectus or a free writing prospectus is accurate as of the date of this prospectus or the applicable free writing prospectus, as the case may be, or as of the date or dates that are specified in those documents. Our business, financial condition, results of operations and prospects may have changed since those dates. We will update this prospectus as required by law.
Through and including , 2012 (the 25th day after the date of this prospectus), all dealers effecting transactions in these securities, whether or not participating in this offering, may be required to deliver a prospectus. This is in addition to a dealer’s obligation to deliver a prospectus when acting as an underwriter and with respect to an unsold allotment or subscription.
Table of Contents
Unless otherwise indicated, all of the financial data presented in this prospectus is presented on a combined basis for U.S. Silica Holdings, Inc. and its subsidiaries.
As a result of our acquisition by an affiliate of Harvest Partners, LLC in August 2007, by an affiliate of Harbinger Capital Partners (“Harbinger Capital”) in October 2007 and by an affiliate of Golden Gate Private Equity, Inc. (“Golden Gate Capital” and the “Golden Gate Capital Acquisition”) in November 2008, our financial data is presented on a predecessor and successor basis. We refer to USS Holdings, Inc. as it existed prior to the acquisition by Harvest Partners, LLC on August 9, 2007 as “Predecessor 3.” We refer to USS Holdings, Inc. for the period from August 9, 2007 until October 17, 2007 as “Predecessor 2.” We refer to USS Holdings, Inc. for the period from October 18, 2007 until November 24, 2008 as “Predecessor 1.” We refer to U.S. Silica Holdings, Inc. for the period from and after November 25, 2008 as the “Successor.”
The Predecessor 3 period financial data reflects the accounting basis in our assets and liabilities existing prior to August 9, 2007. The Predecessor 2 period financial data reflects the accounting basis in our assets and liabilities resulting from our purchase by an affiliate of Harvest Partners, LLC. The Predecessor 1 period combined financial data reflects the accounting basis in our assets and liabilities resulting from our purchase by an affiliate of Harbinger Capital. The Successor period combined financial data reflects the accounting basis in our assets and liabilities resulting from our purchase by an affiliate of Golden Gate Capital.
Prior to the registration statement of which this prospectus forms a part being declared effective, our sister company, GGC RCS Holdings, Inc., will be merged and consolidated into us. GGC RCS Holdings, Inc. represents the resin-coated sand business and historically did not have significant operations. For financial reporting purposes, the transaction will be reflected as a consolidation of entities under common control, with the business and entities held by GGC RCS Holdings, Inc. becoming wholly owned subsidiaries of us. Although the actual consolidation of GGC RCS Holdings, Inc. will not become effective until immediately prior to the completion of this offering, its assets, liabilities and operations have been included as part of our combined financial statements in this prospectus as though the consolidation had already taken place.
We obtained the industry, market and competitive position data throughout this prospectus from our own internal estimates and research as well as from industry and general publications and research, surveys and studies conducted by third parties. We have relied upon publications of the United States Geological Survey (the “USGS”) and The Freedonia Group, Inc. (“Freedonia”) as our primary sources for third-party market and industry data. Industry publications, surveys and studies generally state that the information contained therein has been obtained from sources believed to be reliable, although they do not guarantee the accuracy or completeness of such information. While we believe that each of these publications, surveys and studies is reliable, we have not independently verified market and industry data from third-party sources. While we believe our internal company research is reliable and the definitions of our market and industry are appropriate, neither such research nor these definitions have been verified by any independent source.
The Minerals Yearbook produced by the USGS is the only comprehensive third-party publication of which we are aware that compiles data on the U.S. commercial silica industry as a whole. The data in the Minerals Yearbook is voluntarily self-reported by U.S. silica producers and there can be no assurance that all major U.S. silica producers have reported data or that the data that has been reported is reliable. The most recent Minerals Yearbook contains historical data from 2009, and, based on our internal estimates and consultations with third parties, we believe that such data is accurate at the reasonable assurance level and we have included it throughout this prospectus. However, the USGS has provided only preliminary estimates of commercial silica demand in 2010. The USGS estimated in January 2011 that 26.5 million tons of commercial silica were consumed in 2010
ii
Table of Contents
and that the oil and natural gas industry was accountable for 25% of this total consumption. Based on our experience and results of operations in 2010, we believe that our internal estimates of market demand more accurately represent 2010 demand for commercial silica than the USGS preliminary estimates. As a result, while we have relied on data produced by the USGS for years prior to 2010, the 2010 data included in this prospectus represents our internal estimates of market demand of 39 million tons. The variation in the 2010 data results from the unprecedented demand that we saw in 2010 for our frac sand products from our customers in the oil and natural gas industry. Our estimates for 2010 are based on the demand we experienced for our own products, as well as discussions with our customers regarding their aggregate demand for frac sand. In addition, our familiarity with competitive sources of frac sand supply, as well as shipment data from major logistics providers, confirmed our estimates of the overall size and growth of the frac sand market.
This prospectus includes our trademarks such as “U.S. Silica,” which are protected under applicable intellectual property laws and are the property of us or our subsidiaries. This prospectus also contains trademarks, service marks, trade names and copyrights of other companies, which are the property of their respective owners. Solely for convenience, trademarks and trade names referred to in this prospectus may appear without the ® or TM symbols, but such references are not intended to indicate, in any way, that we will not assert, to the fullest extent under applicable law, our rights or the rights of the applicable licensor to these trademarks and trade names.
iii
Table of Contents
This summary highlights information contained elsewhere in this prospectus. This summary does not contain all of the information that you should consider before investing in our common stock. For a more complete understanding of us and this offering, you should read and carefully consider the entire prospectus, including the more detailed information set forth under “Risk Factors” and “Management’s Discussion and Analysis of Financial Condition and Results of Operations” and our combined financial statements and the related notes. Some of the statements in this prospectus are forward-looking statements. See “Forward-Looking Statements.” Unless we state otherwise or the context otherwise requires, the terms “we,” “us,” “our,” “U.S. Silica,” “our business” and “our company” refer to U.S. Silica Holdings, Inc. and its consolidated subsidiaries as a combined entity.
Our Company
We are the second largest domestic producer of commercial silica, a specialized mineral that is a critical input into a variety of attractive end markets. During our 111-year history, we have developed core competencies in mining, processing, logistics and materials science that enable us to produce and cost-effectively deliver over 200 products to customers across these end markets. In our largest end market, oil and gas proppants, our “frac sand” is used to stimulate and maintain the flow of hydrocarbons in horizontally drilled oil and natural gas wells. This segment of our business is experiencing rapid growth due to recent technological advances in the hydraulic fracturing process, which have made the extraction of large volumes of oil and natural gas from U.S. shale formations economically feasible. Our commercial silica is also used as an economically irreplaceable raw material in a wide range of industrial applications, including glassmaking and chemical manufacturing. Additionally, in recent years a number of attractive new end markets have developed for our high-margin, performance silica products, including solar panels, specialty coatings, wind turbines, polymer additives and geothermal energy systems.
We operate 13 facilities across the United States and control 283 million tons of reserves, including approximately 138 million tons of reserves that can be processed to meet American Petroleum Institute (“API”) frac sand size specifications. We produce a wide range of frac sand sizes and are one of the few commercial silica producers capable of rail delivery of large quantities of API grade frac sand to each of the major U.S. shale basins. We believe that due to a combination of these favorable attributes and robust drilling activity in the oil and natural gas industry, we have become a preferred commercial silica supplier to our customers in the oil and gas proppants end market and, consequently, are experiencing high demand for our frac sand. To meet this demand, we are investing significant resources to increase our proppant production, including expanding our frac sand capabilities by approximately 1.2 million tons, or approximately 75% above tons sold in 2010, and constructing a new facility to produce resin-coated sand, which significantly expands our addressable proppant market.
Our operations are organized into two segments based on end markets served: (1) Oil & Gas Proppants and (2) Industrial & Specialty Products. Our segments are complementary because our ability to sell to a wide range of customers across end markets allows us to maximize recovery rates in our mining operations, optimize our asset utilization and reduce the cyclicality of our earnings. In 2010, we generated approximately $245.0 million of sales, $72.2 million of Adjusted EBITDA and $11.4 million of net income. These figures represent increases of 28%, 44% and 106%, respectively, compared to 2009. In particular, the Oil & Gas Proppants segment contribution margin grew by 83% in 2010 and represented approximately 48% of total segment contribution margin, compared to 39% for the prior year.
1
Table of Contents
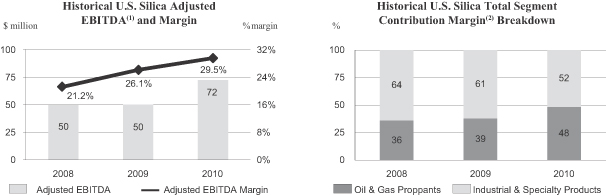
| (1) | See note 2 to “—Summary Historical Combined Financial and Operating Data” for a discussion of Adjusted EBITDA, an accompanying presentation of the most directly comparable GAAP financial measure, net income, and a reconciliation of the differences between Adjusted EBITDA and net income. |
| (2) | Total segment contribution margin is the sum of the Oil & Gas Proppants segment contribution margin and the Industrial & Specialty Products segment contribution margin. Total segment contribution margin is not a financial measure presented in accordance with GAAP. See note R to our audited combined financial statements and note I to our unaudited condensed combined financial statements included elsewhere in this prospectus for a discussion of segment contribution margin, an accompanying presentation of the most directly comparable GAAP financial measure, income (loss) before income taxes, and a reconciliation of the differences between segment contribution margin and income (loss) before income taxes. |
Our Competitive Strengths
We attribute our success to the following strengths:
| • | Large-scale producer with a diverse and high-quality reserve base. Our 13 geographically dispersed facilities control 283 million tons of reserves, including API size frac sand and large quantities of silica with distinct characteristics, giving us the ability to sell over 200 products to over 1,400 customers. Our large-scale production capabilities and long reserve life make us a preferred commercial silica supplier to our customers. A consistent, reliable supply of large quantities of silica gives our customers the security to customize their production processes around our commercial silica. Furthermore, our scale provides us earnings diversification and a larger addressable market. |
| • | Geographically advantaged footprint with intrinsic transportation advantages. The strategic location of our facilities and our logistics capabilities enable us to enjoy high customer retention and a larger addressable market. In our Oil & Gas Proppants segment, our network of frac sand producing plants with access to on-site rail and the strategic locations of our transloads serve to expand our addressable market to every major U.S. shale basin. We believe we are one of the few frac sand producers capable of delivering API grade frac sand cost-effectively to most all of the major U.S. shale basins by on-site rail. Additionally, due to the high weight-to-value ratio of many silica products in our Industrial & Specialty Products segment, the proximity of our facilities to our customers’ facilities often results in us being their sole supplier. This advantage has enabled us to enjoy strong customer retention in this segment, with our top five Industrial & Specialty Products segment customers purchasing from us for an average of over 50 years. |
2
Table of Contents
| • | Low-cost operating structure. We believe the combination of the following factors contributes to our low-cost structure and our high margins: |
| • | our ownership of the vast majority of our reserves, resulting in mineral royalty rates that were less than 0.5% of our sales in 2010; |
| • | the close proximity of our mines to their respective processing plants, which allows for a cost-efficient and highly automated production process; |
| • | our processing expertise, which enables us to create over 200 products with unique characteristics while minimizing waste material; |
| • | our integrated logistics management expertise and geographically advantaged facility network, which enables us to reliably ship products by the most cost-effective method available, whether by truck, rail, ship or barge; |
| • | our large customer base across numerous end markets, which allows us to maximize our mining recovery rate and asset utilization; and |
| • | our large overall and plant-level operating scale. |
| • | Strong reputation with our customers and the communities in which we operate. We believe that we have built a strong reputation during our 111-year operating history. Our customers know us for our dependability and our high-quality, innovative products, as we have a long track record of timely delivery of our products according to customer specifications. We also have an extensive network of technical resources, including materials science and petroleum engineering expertise, that enables us to collaborate with our customers to develop new products and improve the performance of their existing applications. We are also well known in the communities in which we operate as a preferred employer and a responsible corporate citizen, which generally serves us well in hiring new employees and securing difficult-to-obtain permits for expansions and new facilities. |
| • | Experienced management team. The members of our senior management team bring significant experience to the dynamic environment in which we operate. Their expertise covers a range of disciplines, including industry-specific operating and technical knowledge as well as experience managing high-growth businesses. We believe we have assembled a flexible, creative and responsive team with a mentality that is particularly well suited to the rapidly evolving unconventional oil and natural gas drilling landscape, which is the principal driver of our growth. |
Our Growth Strategy
The key drivers of our growth strategy include:
| • | Expand our proppant production capacity and product portfolio. We are currently executing several initiatives to increase our frac sand production capacity and augment our proppant product portfolio. At our Ottawa, Illinois facility, we recently implemented operating improvements and installed a new dryer with six mineral separators to increase our annual frac sand production capacity by 900,000 tons. At our Rockwood, Michigan facility, we recently added 250,000 tons of annual frac sand production capacity by installing an entirely new processing circuit to run on a continuous basis alongside our existing state-of-the-art low-iron silica circuit. These two projects were completed during the fourth quarter of 2011. We are also in the initial stages of building a new facility to produce resin-coated sand that will be designed to coat up to 400 million pounds annually, which is scheduled for completion and start-up in 2013. We expect to fund all of these projects through a combination of cash on our balance sheet and cash generated from our operations. |
3
Table of Contents
| • | Increase our exposure to attractive industrial and specialty products end markets. We intend to increase our exposure and market share in certain industrial and specialty products end markets that we believe are poised for growth. For example, at our Rockwood facility, we have doubled our production capacity for low-iron silica, which is used to maximize light transmission in ultra-clear architectural glass and solar panels. In addition, we recently opened a representative office in Shanghai, China to market our fine ground silica products across the Asia Pacific region for use in specialty end markets. We are also exploring opportunities to grow our presence in the specialty coatings and polymer additives end markets, where our ultra-fine ground silica is used to enhance strength, scratch resistance and stability. |
| • | Optimize product mix and further develop value-added capabilities to maximize margins. We will continue to actively manage our product mix at each of our plants to ensure we are maximizing our profit margins. This requires us to use our proprietary expertise in balancing key variables, such as mine geology, processing capacities, transportation availability, customer requirements and pricing. In 2010, while our tons sold increased by 17%, we believe this expertise helped enable us to increase our operating income by 80%. We also expect to continue investing in ways to increase the value we provide to our customers by expanding our product offerings, increasing our transportation assets, improving our supply chain management and upgrading our information technology. We hope to use these strategies to increase our operating income faster than our tons sold into the future. |
| • | Evaluate both greenfield and brownfield expansion opportunities. We will continue to leverage our reputation, processing capabilities and infrastructure to increase production, as well as explore other opportunities to expand our reserve base. We may accomplish this by developing greenfield projects, where we can capitalize on our technical knowledge of geology, mining and processing and our strong reputation within local communities. For instance, on December 30, 2011, we purchased land in Sparta, Wisconsin, for which we recently received initial permitting for a new mining and production facility that, if pursued, would be targeted toward the production of frac sand. We are also continuously exploring potential brownfield projects, such as the possibility of increasing the capacity at some subsequent date of the new resin-coating facility that we are currently constructing. Additionally, we may pursue “bolt on” and other opportunistic acquisitions, taking advantage of our asset footprint, our management’s experience with high-growth businesses and our strong customer relationships. We may also evaluate international acquisitions as unconventional oil and natural gas drilling expands globally. |
| • | Maintain financial strength and flexibility. We intend to maintain financial strength and flexibility to enable us to pursue acquisitions and new growth opportunities as they arise. As of September 30, 2011, we had $73.8 million of cash on hand and $22.5 million of available borrowings under our credit facilities. |
4
Table of Contents
Industry Trends
Demand
We believe that commercial silica consumption increased at an average annual rate of 9.9% from 2008 to 2010 and that this growth was principally driven by the acceleration in the growth of frac sand demand. This demand growth is primarily due to technological developments, such as improvements in horizontal drilling that have made the extraction of oil and natural gas increasingly cost-effective in areas that historically would have been economically impractical to develop. Frac sand is an essential component in the efficient exploitation of these reservoirs, and as more of these reservoirs have been developed, the demand for frac sand has correspondingly increased. The following chart identifies trends in the number of horizontal drill rigs from 2002 to 2011 and the compound annual growth rate (“CAGR”) over such period.
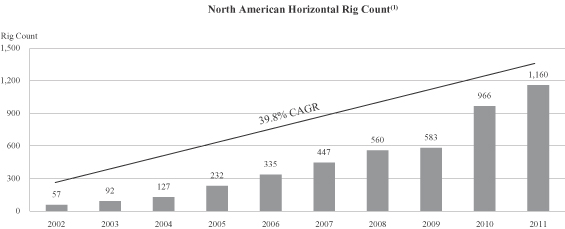
Data Source: Baker Hughes, Inc., January 2012
| (1) | Data reported as year-end rig count for each period (2002-2011). |
In addition to the increase in the number of horizontal drill rigs, the growth in demand for frac sand is also the product of an increase in the amount of frac sand used per rig, which is growing as a result of the following factors:
| • | improved drill rig productivity, resulting in more wells drilled per year per rig; |
| • | the increase in the number of fracturing sites, or “stages,” within each well where fracturing occurs and proppant is needed; |
| • | the increase in the length of the horizontal distance covered in each stage of the well due to advances in horizontal drilling technologies; and |
| • | the increase in proppant use per foot completed in each fracturing stage. |
According to a Freedonia report dated April 2011, based on the above factors, demand for all proppants is projected to increase approximately 16% per year to $5.1 billion in 2015, and, more specifically, demand for frac sand and resin-coated sand in the United States and Canada is projected to increase 15% per year to $1.9 billion in 2015.
We have also seen an increase in demand for commercial silica from our industrial and specialty products customers. From 1980 to 2008, U.S. commercial silica industry volumes generally grew in line with U.S
5
Table of Contents
industrial production, primarily influenced by the manufacture of glass, building materials, foundry moldings and chemicals. The economic downturn of 2008 and 2009 decreased demand for commercial silica products, particularly in the glassmaking, foundry, specialty coatings and building products end markets. Since 2010, as the general economy has continued to recover, demand has once again begun to grow in most of these end markets. We have also seen increased demand for commercial silica products for certain new specialty applications, such as solar panels, specialty coatings, wind turbines, polymer additives and geothermal energy systems.
Supply
Supplies of commercial silica have failed to keep pace with demand for approximately the past 18 months. During the economic downturn of 2008 and 2009, demand for commercial silica from customers in various industrial and specialty products end markets decreased. As a result, there was no significant expansion of domestic commercial silica supply. This, combined with the continued growth in demand for frac sand and the rebound in industrial and specialty products end markets in 2010, has created a supply-demand disparity. We believe that if the present level of demand growth continues for the foreseeable future, a significant expansion in the supply of commercial silica will be needed to balance the market. We, and other large producers, have implemented or announced some supply expansions, and other smaller producers have made similar announcements. However, there are several key constraints to increasing production on an industry-wide basis, including:
| • | the difficulty of finding silica reserves suitable for use as frac sand, which, according to the API, must meet stringent technical specifications, including, among others, sphericity, grain size, crush resistance, acid solubility, purity and turbidity; |
| • | the difficulty of securing contiguous reserves of silica large enough to justify the capital investment required to develop a mine and processing plant; |
| • | the lack of industry-specific geological, exploration, development and mining knowledge and experience needed to enable the identification, acquisition and development of high-quality reserves; |
| • | the difficulty of identifying reserves with the above characteristics that either are located in close proximity to oil and natural gas reservoirs or have the rail access needed for low-cost transportation to major shale basins; |
| • | the difficulty of securing mining, production, water, air, refuse and other federal, state and local operating permits from the proper authorities, a process that can require up to three years; and |
| • | the difficulty of assembling a large, diverse portfolio of customers to optimize operations. |
6
Table of Contents
Pricing
Historically, commercial silica has been characterized by regional markets created by the high weight-to-value ratio of silica. The increased demand for commercial silica from our customers in both the oil and gas proppants end market and industrial and specialty products end markets has resulted in favorable pricing trends in both of our operating segments. If demand for frac sand continues to rise, and if the general economic recovery continues to result in increased demand from our customers in industrial and specialty products end markets, we expect the prices that our products command will continue to increase. As illustrated in the chart below, between 2000 and 2009, commercial silica prices increased at an average annual rate of 9.0%.
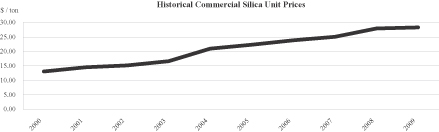
Source: USGS, October 2010
Risks Associated with Our Business
There are a number of risks related to our business, this offering and our common stock that you should consider before you decide to participate in this offering. You should carefully consider all the information presented in the section entitled “Risk Factors” in this prospectus. Some of the principal risks related to our business include the following:
| • | The demand for commercial silica fluctuates due to the cyclical nature of our customers’ businesses in both of our operating segments and the overall level of activity in the natural gas and oil industries, which could adversely affect our results of operations. |
| • | We may not be able to successfully implement our capacity expansion plans within our current timetable, the actual costs of the capacity expansion may exceed our current estimated costs and we may not be able to secure offtake agreements for the incremental production capacity. In addition, actual operating costs once we have completed the capacity expansion may be higher than anticipated. |
| • | A significant portion of our sales is produced at two of our plants. Any adverse developments at either of those plants or in the end markets those plants serve could have a material adverse effect on our financial condition and results of operations. |
| • | We may be adversely affected by decreased demand for frac sand or the development of either effective alternative proppants or new processes to replace hydraulic fracturing. |
| • | Federal, state and local legislative and regulatory initiatives relating to hydraulic fracturing and commercial silica mining and the potential for related regulatory action or litigation could result in increased costs and additional operating restrictions or delays for our customers, which could negatively impact our business, financial condition and results of operations. |
These and other risks are more fully described in the section entitled “Risk Factors” in this prospectus. If any of these risks actually occurs, our business, financial condition, results of operations, cash flows and prospects could be materially and adversely affected. As a result, you could lose all or part of your investment in our common stock.
7
Table of Contents
Our Equity Sponsor
Golden Gate Private Equity, Inc. is a San Francisco-based private equity investment firm with approximately $8 billion of capital under management. Golden Gate Capital is dedicated to partnering with world class management teams and targets investments in situations where there is a demonstrable opportunity to significantly enhance a company’s value. The principals of Golden Gate Capital have a long history of investing with management partners across a wide range of industries and transaction types, including leveraged buyouts and recapitalizations, corporate divestitures and spin-offs, build-ups and venture stage investing.
Corporate History Information
We were incorporated as a Delaware corporation in 2008 in connection with the Golden Gate Capital Acquisition. We began operations 111 years ago in Ottawa, Illinois. Since that time, we have merged with and acquired many additional commercial silica mining and production facilities. Our corporate headquarters is located at 8490 Progress Drive, Suite 300, Frederick, Maryland 21701. Our telephone number is (800) 345-6170. Our website address is http://www.ussilica.com. The information on our website is not deemed to be part of this prospectus.
8
Table of Contents
The Offering
| Common stock offered by us |
2,941,176 shares |
| Common stock offered by GGC USS Holdings, LLC, the sole selling stockholder |
8,823,529 shares |
| 10,588,235 shares if the underwriters exercise their option to purchase additional shares in full |
| Common stock to be outstanding immediately after this offering |
52,941,176 shares |
| Use of proceeds |
We estimate that the net proceeds to us from this offering, after deducting underwriting discounts and commissions and estimated offering expenses payable by us, will be approximately $42.5 million, assuming the shares are offered at $17.00 per share, the midpoint of the initial public offering price range set forth on the cover of this prospectus. |
| We intend to use the net proceeds of approximately $42.5 million from the sale of common stock by us in this offering to make an $8.0 million payment to terminate the Advisory Agreement entered into in connection with the Golden Gate Acquisition and to provide approximately $34.5 million to fund future capital expenditures for our business, including the construction of our new resin-coating facility described elsewhere in this prospectus. The other principal purposes for this offering are to create a public market for our common stock, facilitate our future access to the public equity markets, provide liquidity for our existing stockholder and increase our visibility in our markets. See “Use of Proceeds.” |
| We will not receive any proceeds from the sale of shares by the selling stockholder. |
| Dividend policy |
We currently intend to retain all available funds and any future earnings to fund the development and growth of our business and to repay indebtedness and, therefore, we do not anticipate paying any cash dividends in the foreseeable future. Our ability to pay dividends on our common stock is limited by our existing credit agreements, and may be further restricted by the terms of any of our future debt or preferred securities. See “Dividend Policy.” |
| Risk factors |
Investing in our common stock involves a high degree of risk. See “Risk Factors” elsewhere in this prospectus for a discussion of factors you should carefully consider before deciding to invest in our common stock. |
| Symbol for trading on the New York Stock Exchange |
“SLCA” |
9
Table of Contents
Unless otherwise indicated, all information in this prospectus relating to the number of shares of our common stock to be outstanding immediately after this offering:
| • | excludes 1,501,398 shares of our common stock issuable upon the exercise of options outstanding as of January 17, 2012 pursuant to the 2011 Incentive Compensation Plan (the “2011 Plan”), of which no options to purchase shares are currently exercisable; |
| • | excludes 3,349,614 shares of our common stock reserved for future grants under the 2011 Plan; |
| • | assumes (1) no exercise by the underwriters of their option to purchase up to 1,764,706 additional shares from the selling stockholder and (2) an initial public offering price of $17.00 per share, the midpoint of the initial public offering price range set forth on the cover of this prospectus; and |
| • | assumes the filing of our amended and restated certificate of incorporation, which will occur at or prior to the completion of this offering. |
10
Table of Contents
Summary Historical Combined Financial and Operating Data
The following tables summarize our historical combined financial and operating data as of the dates and for the periods indicated. We have derived the summary historical combined financial and operating data for the periods from January 1, 2008 through November 24, 2008, and from November 25, 2008 through December 31, 2008, and for the years ended December 31, 2009 and 2010 from our combined financial statements that are included elsewhere in this prospectus, which were audited by Grant Thornton LLP, an independent registered public accounting firm. We have derived the summary historical combined financial and operating data as of September 30, 2011 and for the nine months ended September 30, 2010 and 2011 from our unaudited condensed combined financial statements included elsewhere in this prospectus. Our unaudited condensed combined financial statements have been prepared on the same basis as our audited combined financial statements and, in our opinion, include all adjustments, consisting of normal and recurring adjustments, that we consider necessary for a fair presentation of our financial position and results of operations for such periods. Operating results for the quarter periods are not necessarily indicative of results for a full year or for any other period.
As a result of our acquisition by an affiliate of Harvest Partners, LLC in August 2007, by an affiliate of Harbinger Capital in October 2007 and the Golden Gate Capital Acquisition in November 2008, our financial data is presented on a predecessor and successor basis. We refer to USS Holdings, Inc. for the period from October 18, 2007 until November 24, 2008 as “Predecessor 1.” We refer to U.S. Silica Holdings, Inc. for the period from and after November 25, 2008 as the “Successor.”
The Predecessor 1 period financial data reflects the accounting basis in our assets and liabilities resulting from our purchase by an affiliate of Harbinger Capital. The Successor period combined financial data reflects the accounting basis in our assets and liabilities resulting from our purchase by an affiliate of Golden Gate Capital.
The presentation of the year ended December 31, 2008 includes the combined results of the Predecessor 1 and Successor periods. We have presented the combination of these periods because we believe it provides an easier to read discussion of the results of operations and provides the investor with information from which to analyze our financial results in a manner that is consistent with the way management reviews and analyzes our results of operations. In addition, the combined results provide investors with the most meaningful comparison between our results for prior and future periods. See note 2 to “Selected Historical Combined Financial and Operating Data” and our historical combined financial statements and the related notes for the year ended December 31, 2008 included elsewhere in this prospectus for a separate presentation of the results for the Predecessor 1 and Successor periods in accordance with U.S. generally accepted accounting principles (“GAAP”).
11
Table of Contents
The summary historical combined data presented below should be read in conjunction with “Risk Factors,” “Selected Historical Combined Financial and Operating Data,” “Management’s Discussion and Analysis of Financial Condition and Results of Operations” and our combined financial statements and the related notes and other financial data included elsewhere in this prospectus.
| Predecessor
1/ Successor Combined (Non- GAAP)(1) |
Successor | |||||||||||||||||||||
| Year Ended December 31, | Nine Months Ended September 30, | |||||||||||||||||||||
| 2008 | 2009 | 2010 | 2010 | 2011 | ||||||||||||||||||
| (amounts in thousands, excluding per ton figures) | ||||||||||||||||||||||
| Statement of Operations Data: |
||||||||||||||||||||||
| Sales |
$ | 233,583 | $ | 191,623 | $ | 244,953 | $ | 185,482 | $ | 211,965 | ||||||||||||
| Operating income |
26,573 | 25,614 | 45,991 | 36,847 | 47,755 | |||||||||||||||||
| Income before income taxes |
24,061 | 2,280 | 13,721 | 9,798 | 27,741 | |||||||||||||||||
| Net income |
17,277 | 5,539 | 11,392 | 7,620 | 20,208 | |||||||||||||||||
| Statement of Cash Flows Data: |
||||||||||||||||||||||
| Net cash provided by (used in): |
||||||||||||||||||||||
| Operating activities |
$ | 38,256 | $ | 13,863 | $ | 36,738 | $ | 24,399 | $ | 22,395 | ||||||||||||
| Investing activities |
(332,206 | ) | (13,308 | ) | (15,163 | ) | (10,279 | ) | (28,692 | ) | ||||||||||||
| Financing activities |
303,719 | (288 | ) | 28,451 | 26,593 | 15,606 | ||||||||||||||||
| Other Financial Data: |
||||||||||||||||||||||
| Adjusted EBITDA(2) |
$ | 49,560 | $ | 50,013 | $ | 72,152 | $ | 56,124 | $ | 66,354 | ||||||||||||
| Capital expenditures |
(10,042 | ) | (13,350 | ) | (15,241 | ) | (10,355 | ) | (28,753 | ) | ||||||||||||
| Operating Data: |
||||||||||||||||||||||
| Total tons sold |
6,389 | 5,089 | 5,965 | 4,508 | 4,688 | |||||||||||||||||
| Average realized price (per ton) |
$ | 36.56 | $ | 37.65 | $ | 41.07 | $ | 41.15 | $ | 45.22 | ||||||||||||
| Production costs (per ton)(3) |
26.33 | 26.76 | 26.49 | 26.36 | 27.99 | |||||||||||||||||
| Oil & Gas Proppants: |
||||||||||||||||||||||
| Sales |
$ | 37,875 | $ | 35,836 | $ | 69,556 | $ | 51,185 | $ | 69,322 | ||||||||||||
| Segment contribution margin |
23,557 | 23,515 | 43,118 | 31,896 | 43,828 | |||||||||||||||||
| Industrial & Specialty Products: |
||||||||||||||||||||||
| Sales |
$ | 195,708 | $ | 155,787 | $ | 175,397 | $ | 134,297 | $ | 142,643 | ||||||||||||
| Segment contribution margin |
41,688 | 37,419 | 46,031 | 37,018 | 38,495 | |||||||||||||||||
| As of September 30, 2011 | ||||||||||||||||||||||
| Actual | As Adjusted(4) | |||||||||||||||||||||
| (amounts in thousands) | ||||||||||||||||||||||
| Balance Sheet Data: |
||||||||||||||||||||||
| Cash and cash equivalents |
|
$ | 73,809 | $ | 108,331 | |||||||||||||||||
| Total assets |
|
543,504 | 578,026 | |||||||||||||||||||
| Long-term debt (including current portion) |
|
258,464 | 258,464 | |||||||||||||||||||
| Total liabilities |
|
425,052 | 425,052 | |||||||||||||||||||
| Total stockholders’ equity |
|
118,452 | 152,974 | |||||||||||||||||||
| (1) | The Golden Gate Capital Acquisition established a new basis of accounting that primarily affected inventory, intangible assets, goodwill, taxes, debt and equity. The combined data is not presented in accordance with GAAP and Article 11 of Regulation S-X. Except for purchase accounting adjustments primarily relating to depreciation, depletion and amortization, the results for the two combined periods are |
12
Table of Contents
| comparable. Therefore, we believe that combining the two periods into a single period for comparative purposes gives the most meaningful comparison for the users of this financial information. See note 2 to “Selected Historical Combined Financial and Operating Data” and our historical combined financial statements and the related notes for the year ended December 31, 2008 included elsewhere in this prospectus for a separate presentation of the results for the Predecessor 1 and Successor periods in accordance with GAAP. |
| (2) | Adjusted EBITDA has been presented in this prospectus and is a supplemental measure of financial performance that is not required by, or presented in accordance with, GAAP. Adjusted EBITDA is defined as net income (loss) before depreciation and amortization, interest expense (net) and amortization of debt issuance costs and discounts and provision for income taxes (“EBITDA”), adjusted to exclude the items set forth in the table below. |
Adjusted EBITDA is included in this prospectus because it is a key metric used by management to assess our operating performance and by our lenders to evaluate our covenant compliance. Our target performance goals under our incentive compensation plan are tied, in part, to our Adjusted EBITDA. See “Executive Compensation—Compensation Discussion and Analysis—Elements of Compensation—Equity and Cash Incentives—Summary of Our New Plan.” In addition, our revolving credit facility (the “ABL Facility”) contains a fixed charge coverage ratio covenant that we must meet if our excess availability (as defined in the ABL Facility) falls below $10.0 million, and our term loan facility (the “Term Loan Facility”) contains a consolidated leverage ratio covenant that we must meet at the end of each fiscal quarter, both of which are calculated based on our Adjusted EBITDA. Noncompliance with the financial ratio covenants contained in the ABL Facility and the Term Loan Facility could result in the acceleration of our obligations to repay all amounts outstanding under those agreements. Moreover, the ABL Facility and the Term Loan Facility contain covenants that restrict, subject to certain exceptions, our ability to make permitted acquisitions, incur additional indebtedness, make restricted payments (including dividends) and retain excess cash flow based, in some cases, on our ability to meet leverage ratios calculated based on our Adjusted EBITDA. See “Description of Certain Indebtedness.”
Adjusted EBITDA is not a measure of our financial performance or liquidity under GAAP and should not be considered as an alternative to net income as a measure of operating performance, cash flows from operating activities as a measure of liquidity or any other performance measure derived in accordance with GAAP. Additionally, Adjusted EBITDA is not intended to be a measure of free cash flow for management’s discretionary use, as it does not consider certain cash requirements such as interest payments, tax payments and debt service requirements. Adjusted EBITDA contains certain other limitations, including the failure to reflect our cash expenditures, cash requirements for working capital needs and cash costs to replace assets being depreciated and amortized, and excludes certain non-recurring charges that may recur in the future. Management compensates for these limitations by relying primarily on our GAAP results and by using Adjusted EBITDA only supplementally. Our measure of Adjusted EBITDA is not necessarily comparable to other similarly titled captions of other companies due to potential inconsistencies in the methods of calculation.
13
Table of Contents
The following table sets forth a reconciliation of net income, the most directly comparable GAAP financial measure, to Adjusted EBITDA.
| Predecessor 1/ Successor Combined (Non-GAAP) |
|
Successor | ||||||||||||||||||||
| Year Ended December 31, | Nine Months Ended September 30, | |||||||||||||||||||||
| 2008 | 2009 | 2010 | 2010 | 2011 | ||||||||||||||||||
| (amount in thousands) | ||||||||||||||||||||||
| Net income |
$ | 17,277 | $ | 5,539 | $ | 11,392 | $ | 7,620 | $ | 20,208 | ||||||||||||
| Total interest expense, net of interest income |
3,628 | 28,153 | 22,989 | 17,683 | 14,481 | |||||||||||||||||
| Provisions for taxes (benefit) |
6,784 | (3,259 | ) | 2,329 | 2,178 | 7,533 | ||||||||||||||||
| Total depreciation, depletion and amortization expenses |
17,067 | 17,887 | 19,305 | 14,265 | 15,636 | |||||||||||||||||
|
|
|
|
|
|
|
|
|
|
|
|||||||||||||
| EBITDA |
44,756 | 48,320 | 56,015 | 41,746 | 57,858 | |||||||||||||||||
| Non-cash deductions, losses and charges(a) |
(765 | ) | (3,337 | ) | 1,364 | 602 | — | |||||||||||||||
| Non-recurring expenses (income)(b) |
2,587 | (3,837 | ) | — | — | (1,295 | ) | |||||||||||||||
| Transaction expenses(c) |
2,122 | 4,263 | 10,669 | 10,669 | 6,043 | |||||||||||||||||
| Permitted management fees and expenses(d) |
100 | 1,250 | 1,250 | 938 | 938 | |||||||||||||||||
| Non-cash incentive compensation(e) |
949 | 383 | 287 | 682 | ||||||||||||||||||
| Post-employment expenses (excluding service costs)(f) |
350 | 2,224 | 2,113 | 1,563 | 1,267 | |||||||||||||||||
| Other adjustments allowable under our existing credit agreements(g) |
410 | 181 | 358 | 319 | 862 | |||||||||||||||||
|
|
|
|
|
|
|
|
|
|
|
|||||||||||||
| Adjusted EBITDA |
$ | 49,560 | $ | 50,013 | $ | 72,152 | $ | 56,124 | $ | 66,354 | ||||||||||||
|
|
|
|
|
|
|
|
|
|
|
|||||||||||||
| (a) | Includes non-cash deductions, losses and charges arising from adjustments to estimates of a future litigation liability and the decision by our hourly workforce at our Rockwood facility to withdraw from a pension plan administered by a third party. |
| (b) | Includes non-recurring expenses related to a former insurer’s liquidation, the efforts of Predecessor 1 to monetize its investment in us and a one-time advertising and customer relations initiative relating to a prior owner. |
| (c) | Includes natural gas hedging losses, purchase accounting adjustments, management bonuses and other expenses related to the Golden Gate Capital Acquisition, as well as unamortized transaction fees and expenses arising from the refinancing of our Term Loan Facility. |
| (d) | Includes fees and expenses paid to Golden Gate Capital for ongoing consulting and management services provided pursuant to an Advisory Agreement entered into in connection with the Golden Gate Capital Acquisition. Prior to the completion of this offering, the Advisory Agreement will be terminated. See “Certain Relationships and Related Party Transactions—Golden Gate Capital Acquisition—Advisory Agreement.” |
| (e) | Includes vesting of incentive equity compensation issued to our employees. |
| (f) | Includes net pension cost and net post-retirement cost relating to pension and other post-retirement benefit obligations during the applicable period, but in each case excluding the service cost relating to benefits earned during such period. See note O to our audited combined financial statements included elsewhere in this prospectus. |
| (g) | Reflects miscellaneous adjustments permitted under our existing credit agreements, including such items as expenses related to reviewing potential acquisitions and costs associated with relocating the corporate headquarters. |
| (3) | Production costs (per ton) equal cost of goods sold divided by total tons sold. |
| (4) | As adjusted balance sheet data reflects (1) the filing of our amended and restated certificate of incorporation at or prior to the completion of this offering and (2) this offering. See “Capitalization.” |
14
Table of Contents
This offering and an investment in our common stock involve a high degree of risk. You should carefully consider the risks described below, together with the financial and other information contained in this prospectus, before you decide to purchase shares of our common stock. If any of the following risks actually occurs, our business, financial condition, results of operations, cash flows and prospects could be materially and adversely affected. As a result, the trading price of our common stock could decline and you could lose all or part of your investment in our common stock.
Risks Related to Our Business
The demand for commercial silica fluctuates, which could adversely affect our results of operations.
Demand in the end markets served by our customers is influenced by many factors, including the following:
| • | global and regional economic, political and military events and conditions; |
| • | fluctuations in energy, fuel, oil and natural gas prices and the availability of such fuels; |
| • | demand for oil, natural gas and petroleum products; |
| • | changes in residential and commercial construction demands, driven in part by fluctuating interest rates and demographic shifts; |
| • | demand for automobiles and other vehicles; |
| • | the substitution of plastic or other materials for glass; |
| • | competition from offshore producers of glass products; |
| • | changes in demand for our products due to technological innovations; |
| • | changes in laws and regulations (or the interpretation thereof) related to the mining and hydraulic fracturing industries, silica dust exposure or the environment; |
| • | prices, availability and other factors relating to our products; |
| • | increases in costs of labor and labor strikes; and |
| • | population growth rates. |
We cannot predict or control the factors that affect demand for our products. Negative developments in the above factors, among others, could cause the demand for commercial silica or other minerals to decline, which could adversely affect our business, financial condition, results of operations, cash flows and prospects.
Our operations are subject to the cyclical nature of our customers’ businesses, and we may not be able to mitigate that risk.
The substantial majority of our sales is to customers in industries that have historically been cyclical, such as glassmaking, building products, foundry and oil and natural gas recovery. These industries were adversely affected by the uncertain global economic climate in the second half of 2008 and in 2009. During periods of economic slowdown, our customers often reduce their production rates and also reduce capital expenditures and defer or cancel pending projects. Such developments occur even among customers that are not experiencing financial difficulties.
Demand in many of the end markets for commercial silica is driven by the construction and automotive industries. For example, the flat glass market depends on the automotive and commercial and residential construction and remodeling markets. The market for commercial silica used to manufacture building products is
15
Table of Contents
driven primarily by demand in the construction markets. The demand for foundry silica depends on the rate of automobile, light truck and heavy equipment production as well as construction. In the automotive industry, North American car and truck production was up 39% in 2010, but remains well below pre-recession levels. Housing starts in 2010 were approximately 587,000 units, a 6% improvement over 2009, but still only a fraction of the peak rate of 2.1 million units in 2005. The frac sand market is driven by demand for oil and natural gas. In periods of lower economic productivity or recession, oil and natural gas prices tend to decrease, as they did during late 2008 and portions of 2009, which, in turn, causes exploration and production companies to reduce their exploration, development, production and well completion activities. The reduced level of such activities could result in a corresponding decline in the demand for frac sand. In addition, given that silica transportation represents one of our customers’ largest costs, if, in response to economic pressures, our customers choose to move their production offshore, the increased logistics costs could reduce demand for our products. Continued weakness in the industries we serve has had, and may in the future have, an adverse effect on sales of our products and our results of operations. A continued or renewed economic downturn in one or more of the industries or geographic regions that we serve, or in the worldwide economy, could cause actual results of operations to differ materially from historical and expected results.
Our operations are subject to operating risks that are often beyond our control and could adversely affect production levels and costs, and such risks may not be covered by insurance.
Our mining, processing and production facilities are subject to risks normally encountered in the commercial silica industry. These risks include:
| • | changes in the price and availability of transportation; |
| • | changes in the price and availability of natural gas or electricity; |
| • | unusual or unexpected geological formations or pressures; |
| • | cave-ins, pit wall failures or rock falls; |
| • | unanticipated ground, grade or water conditions; |
| • | inclement or hazardous weather conditions, including flooding, and the physical impacts of climate change; |
| • | environmental hazards; |
| • | industrial accidents; |
| • | changes in laws and regulations (or the interpretation thereof) related to the mining and hydraulic fracturing industries, silica dust exposure or the environment; |
| • | inability to acquire or maintain necessary permits or mining or water rights; |
| • | restrictions on blasting operations; |
| • | inability to obtain necessary production equipment or replacement parts; |
| • | reduction in the amount of water available for processing; |
| • | technical difficulties or failures; |
| • | labor disputes; |
| • | late delivery of supplies; |
| • | fires, explosions or other accidents; and |
| • | facility shutdowns in response to environmental regulatory actions. |
Any of these risks could result in damage to, or destruction of, our mining properties or production facilities, personal injury, environmental damage, delays in mining or processing, losses or possible legal liability. Any
16
Table of Contents
prolonged downtime or shutdowns at our mining properties or production facilities could have a material adverse effect on us.
Not all of these risks are reasonably insurable, and our insurance coverage contains limits, deductibles, exclusions and endorsements. Our insurance coverage may not be sufficient to meet our needs in the event of loss and any such loss may have a material adverse effect on us.
A significant portion of our sales is generated at two of our plants. Any adverse developments at either of those plants or in the end markets those plants serve could have a material adverse effect on our financial condition and results of operations.
A significant portion of our sales is generated at our plants located in Ottawa, Illinois and Mill Creek, Oklahoma. In 2010, these plants represented a combined 49% of our total sales. Any adverse development at either of these plants or in the end markets these plants serve, including adverse developments due to catastrophic events or weather, decreased demand for commercial silica products, a decrease in the availability of transportation services or adverse developments affecting our customers, could have a material adverse effect on our financial condition and results of operations.
Our business and financial performance depend on the level of activity in the natural gas and oil industries.
Our operations that produce frac sand are materially dependent on the levels of activity in natural gas and oil exploration, development and production. More specifically, the demand for the frac sand we produce is closely related to the number of natural gas and oil wells completed in geological formations where sand-based proppants are used in fracture treatments. These activity levels are affected by both short- and long-term trends in natural gas and oil prices. In recent years, natural gas and oil prices and, therefore, the level of exploration, development and production activity, have experienced significant fluctuations. Worldwide economic, political and military events, including war, terrorist activity, events in the Middle East and initiatives by the Organization of the Petroleum Exporting Countries (“OPEC”), have contributed, and are likely to continue to contribute, to price volatility. Additionally, warmer than normal winters in North America and other weather patterns may adversely impact the short-term demand for natural gas and, therefore, demand for our products. Reduction in demand for natural gas to generate electricity could also adversely impact the demand for frac sand. Natural gas and oil prices experienced a decline in the second half of 2008 and during portions of 2009, and natural gas prices continued to be low in 2011. A prolonged reduction in natural gas and oil prices would generally depress the level of natural gas and oil exploration, development, production and well completion activity and result in a corresponding decline in the demand for the frac sand we produce. Such a decline could have a material adverse effect on our results of operations and financial condition. In addition, any future decreases in the rate at which oil and natural gas reserves are discovered or developed, whether due to increased governmental regulation, limitations on exploration and drilling activity or other factors, could have a material adverse effect on our business, even in a stronger natural gas and oil price environment.
We may be adversely affected by decreased demand for frac sand or the development of either effective alternative proppants or new processes to replace hydraulic fracturing.
Frac sand is a proppant used in the completion and re-completion of natural gas and oil wells through the process of hydraulic fracturing. Frac sand is the most commonly used proppant and is less expensive than ceramic proppant, which is also used in the hydraulic fracturing process to stimulate and maintain oil and natural gas production. A significant shift in demand from frac sand to other proppants, such as ceramic proppants, could have a material adverse effect on our financial condition and results of operations. The development and use of other effective alternative proppants, or the development of new processes to replace hydraulic fracturing altogether, could also cause a decline in demand for the frac sand we produce and could have a material adverse effect on our financial condition and results of operations.
17
Table of Contents
Federal, state and local legislative and regulatory initiatives relating to hydraulic fracturing and the potential for related regulatory action or litigation could result in increased costs and additional operating restrictions or delays for our customers, which could negatively impact our business, financial condition and results of operations.
A significant portion of our business supplies frac sand to hydraulic fracturing operators in the oil and natural gas industry. Increased regulation of hydraulic fracturing may adversely impact our business, financial condition and results of operations.
The federal Safe Drinking Water Act (the “SDWA”) regulates the underground injection of substances through the Underground Injection Control Program (the “UIC Program”). Currently, hydraulic fracturing generally is exempt from federal regulation under the UIC Program, and the hydraulic fracturing process is typically regulated by state or local governmental authorities. Although we do not directly engage in hydraulic fracturing activities, our customers purchase our frac sand for use in their hydraulic fracturing operations. The U.S. Environmental Protection Agency (“EPA”) has recently taken the position that hydraulic fracturing with fluids containing diesel fuel is subject to regulation under the UIC Program, specifically as “Class II” UIC wells. At the same time, the EPA has commenced a study of the potential environmental impacts of hydraulic fracturing activities, a committee of the U.S. House of Representatives (the “House”) is conducting an investigation of hydraulic fracturing practices and a subcommittee of the Secretary of Energy Advisory Board (the “SEAB”) of the U.S. Department of Energy has been tasked with recommending steps to improve the safety and environmental performance of hydraulic fracturing. As part of these studies, the EPA, the House committee and the SEAB subcommittee have requested that certain companies provide them with information concerning the chemicals used in the hydraulic fracturing process. These studies, depending on their results, could spur initiatives to regulate hydraulic fracturing under the SDWA or otherwise. The SEAB subcommittee issued a preliminary report in August 2011 recommending, among other things, measures to improve and protect air and water quality, improvements in communication among state and federal regulators, reduction of diesel fuel in shale gas production, disclosure of fracturing fluid composition and the creation of a publicly accessible database organizing all publicly disclosed information with respect to hydraulic fracturing operations. Legislation is currently before Congress to provide for federal regulation of hydraulic fracturing under the SDWA and to require disclosure of the chemicals used in the hydraulic fracturing process. If this or similar legislation becomes law, the legislation could establish an additional level of regulation that may lead to additional permitting requirements or other operating restrictions, making it more difficult to complete natural gas wells in shale formations. This could increase our customers’ costs of compliance and doing business or otherwise adversely affect the hydraulic fracturing services they perform, which may negatively impact demand for our frac sand products.
In addition, various state, local and foreign governments have implemented, or are considering, increased regulatory oversight of hydraulic fracturing through additional permitting requirements, operational restrictions, disclosure requirements and temporary or permanent bans on hydraulic fracturing in certain areas such as environmentally sensitive watersheds. For example, Wyoming, Colorado, Arkansas, Louisiana, Michigan, Montana, Texas and Pennsylvania have imposed disclosure requirements on hydraulic fracturing well owners and operators. The availability of information regarding the constituents of hydraulic fracturing fluids could make it easier for third parties opposing the hydraulic fracturing process to initiate individual or class action legal proceedings based on allegations that specific chemicals used in the hydraulic fracturing process could adversely affect groundwater and drinking water supplies or otherwise cause harm to human health or the environment. Moreover, disclosure to third parties or to the public, even if inadvertent, of our customers’ proprietary chemical formulas could diminish the value of those formulas and result in competitive harm to our customers, which could indirectly impact our business, financial condition and results of operations.
The adoption of new laws or regulations at the federal, state, local or foreign levels imposing reporting obligations on, or otherwise limiting or delaying, the hydraulic fracturing process could make it more difficult to complete natural gas wells in shale formations, increase our customers’ costs of compliance and doing business
18
Table of Contents
and otherwise adversely affect the hydraulic fracturing services they perform, which could negatively impact demand for our frac sand products. In addition, heightened political, regulatory and public scrutiny of hydraulic fracturing practices could potentially expose us or our customers to increased legal and regulatory proceedings, and any such proceedings could be time-consuming, costly or result in substantial legal liability or significant reputational harm. Any such developments could have a material adverse effect on our business, financial condition and results of operations, whether directly or indirectly. For example, we could be directly affected by adverse litigation involving us, or indirectly affected if the cost of compliance limits the ability of our customers to operate in the geographic areas we serve.
Our operations are dependent on our rights and ability to mine our properties and on our having renewed or received the required permits and approvals from governmental authorities and other third parties.
We hold numerous governmental, environmental, mining and other permits, water rights and approvals authorizing operations at each of our facilities. A decision by a governmental agency or other third party to deny or delay issuing a new or renewed permit or approval, or to revoke or substantially modify an existing permit or approval, could have a material adverse effect on our ability to continue operations at the affected facility. Expansion of our existing operations is also predicated on securing the necessary environmental or other permits, water rights or approvals, which we may not receive in a timely manner or at all. In addition, our facilities are located near existing and proposed third-party industrial operations that could affect our ability to fully extract, or the manner in which we extract, the mineral deposits to which we have mining rights.
Title to, and the area of, mineral properties and water rights may also be disputed. Mineral properties sometimes contain claims or transfer histories that examiners cannot verify. A successful claim that we do not have title to one or more of our properties or lack appropriate water rights could cause us to lose any rights to explore, develop and extract any minerals on that property, without compensation for our prior expenditures relating to such property. Our business may suffer a material adverse effect in the event one or more of our properties are determined to have title deficiencies.
In some instances, we have received access rights or easements from third parties, which allow for a more efficient operation than would exist without the access or easement. A third party could take action to suspend the access or easement, and any such action could be materially adverse to our results of operations or financial condition.
We may not be able to successfully implement our capacity expansion plans within our current timetable, the actual costs of the capacity expansion may exceed our current estimated costs and we may not be able to secure offtake agreements for the incremental production capacity. In addition, actual operating costs once we have completed the capacity expansion may be higher than anticipated.
We are currently executing several initiatives to increase our frac sand production capacity and augment our proppant product portfolio. At our Ottawa, Illinois facility, we are increasing our frac sand production capacity by 900,000 tons per year. At our Rockwood, Michigan facility, we are adding 250,000 tons of annual frac sand production capacity by installing an entirely new processing circuit to run on a continuous basis alongside our existing state-of-the-art low-iron silica circuit. These two projects were completed during the fourth quarter of 2011. We are also in the initial stages of building a new facility to produce resin-coated sand, a higher-strength alternative to traditional frac sand, in Rochelle, Illinois, that will be designed to coat up to 400 million pounds annually. This project is scheduled for completion and start-up in 2013.
Under our current business plan, we expect to fund our expansion plan through a combination of cash on our balance sheet and cash generated from our operations. If the assumptions on which we based our estimated capital expenditures change or are inaccurate, we may require additional funding. Such funding may not be available on terms acceptable to us, or at all. Moreover, actual operating costs once we have completed the capacity expansion may be higher than initially anticipated. We also have not secured offtake commitments for
19
Table of Contents
the incremental production from our capacity expansion plans, and we may not be able to secure such commitments. Furthermore, substantial investments in transportation infrastructure will be required to effectively execute the capacity expansion, and we may not be successful in expanding our logistical capabilities to accommodate the additional production capacity.
Any failure to successfully implement our capacity expansion plans due to an inability to obtain necessary permits, insufficient funding, delays, unanticipated costs or other factors, or failure to realize the anticipated benefits of our capacity expansion plans, including securing offtake commitments for the incremental production, could have a material adverse effect on our business, financial condition and results of operations.
Our future performance will depend on our ability to succeed in competitive markets, and on our ability to appropriately react to potential fluctuations in demand for and supply of frac sand.
We operate in a highly competitive market that is characterized by a small number of large, national producers and a larger number of small, regional or local producers. Competition in the industry is based on price, consistency and quality of product, site location, distribution capability, customer service, reliability of supply, breadth of product offering and technical support. As transportation costs are a significant portion of the total cost to customers of commercial silica—in many instances transportation costs can represent more than 50% of delivered cost—the commercial silica market is typically local, and competition from beyond the local area is limited. Notable exceptions to this are the frac sand and fillers and extenders markets, where certain product characteristics are not available in all deposits and not all plants have the requisite processing capabilities, necessitating that some products be shipped for extended distances.
We compete with large, national producers such as Unimin Corporation, Fairmount Minerals, Ltd., Badger Mining Corporation and Carmeuse Industrial Sands. Our larger competitors may have greater financial and other resources than we do, may develop technology superior to ours or may have production facilities that are located closer to key customers than ours. Because the markets for our products are typically local, we also compete with smaller, regional or local producers. For instance, in recent years there has been an increase in the number of small producers servicing the frac sand market due to an increased demand for hydraulic fracturing services. Should the demand for hydraulic fracturing services decrease, prices in the frac sand market could materially decrease as smaller, regional producers exit the market, selling frac sand at below market prices. In addition, oil and natural gas exploration and production companies and other providers of hydraulic fracturing services could acquire their own frac sand reserves, expand their existing frac sand production capacity or otherwise fulfill their own proppant requirements and existing or new frac sand producers could add to or expand their frac sand production capacity, which would negatively impact demand for our frac sand products. We may not be able to compete successfully against either our larger or smaller competitors in the future, and competition could have a material adverse effect on our business, financial condition, results of operations, cash flows and prospects.
A large portion of our sales is generated by our top ten customers, and the loss of, or a significant reduction in, purchases by our largest customers could adversely affect our operations.
During 2010, our top ten customers represented 45% of our sales from continuing operations, with no single customer accounting for more than 9%. We have long-term, competitively-bid fixed price supply agreements with three of these customers in the oil and gas proppants end market, including our top customer, that have initial terms expiring between 2014 and 2016. We do not have long-term contracts in place with the remaining top seven customers from 2010. In the fourth quarter of 2011, we signed six additional shorter term supply agreements with other customers in the oil and gas proppants end market. The terms of these new agreements range from 12 to 36 months and the agreements are generally fixed price, take-or-pay supply agreements. These customers may not continue to purchase the same levels of our commercial silica products in the future due to a variety of reasons. For example, some of our top customers could go out of business or, alternatively, be acquired by other companies that purchase the same products and services provided by us from other third-party providers. Our customers could also
20
Table of Contents
seek to capture and develop their own sources of commercial silica. If any of our major customers substantially reduces or altogether ceases purchasing our commercial silica products, we could suffer a material adverse effect on our business, financial condition, results of operations, cash flows and prospects.
In addition, the long-term supply agreements we have may negatively impact our results of operations. Certain of our long-term agreements are for sales at fixed prices that are adjusted only for certain cost increases. As a result, in periods with increasing prices, such as the period we are currently experiencing, our sales will grow at a slower rate than industry spot prices.
Increasing costs or a lack of dependability or availability of transportation services or infrastructure could have an adverse effect on our ability to deliver products at competitive prices.
Because of the relatively low cost of producing commercial silica, transportation and handling costs tend to be a significant component of the total delivered cost of sales. The high relative cost of transportation tends to favor manufacturers located in close proximity to the customer. In addition, as we continue to expand our commercial silica production, we will need increased transportation services, including rail cars. We contract with truck, rail, ship and barge services to move commercial silica from our production facilities to distribution outlets and our customers, and increased costs under these contracts could adversely affect our results of operations if we are unable to pass these costs on to our customers. In addition, we bear the risk of nondelivery under our customer contracts. In certain instances we commit to deliver products to our customers prior to production, under penalty of nonperformance. Labor disputes, derailments, adverse weather conditions or other environmental events, an increasingly tight railcar leasing market and changes to rail freight systems could interrupt or limit available transportation services. A significant increase in transportation service rates, a reduction in the dependability or availability of transportation services or relocation of our customers’ businesses to areas farther from our plants could impair our ability to deliver our products economically to our customers and to expand our markets.
Our production process consumes large amounts of natural gas and electricity. An increase in the price or a significant interruption in the supply of these or any other energy sources could have a material adverse effect on our financial condition or results of operations.
Energy costs, primarily natural gas and electricity, represented approximately 9% of our total sales in 2010. Natural gas is the primary fuel source used for drying in the commercial silica production process and, as such, our profitability is impacted by the price and availability of natural gas we purchase from third parties. The price and supply of natural gas are unpredictable and can fluctuate significantly based on international, political and economic circumstances, as well as other events outside our control, such as changes in supply and demand due to weather conditions, actions by OPEC and other oil and natural gas producers, regional production patterns and environmental concerns. In addition, potential climate change regulations or carbon or emissions taxes could result in higher production costs for energy, which may be passed on to us in whole or in part. In the past, the price of natural gas has been extremely volatile, and we expect this volatility to continue. For example, during the year ended December 31, 2010 and the nine months ended September 30, 2011, the monthly closing price of natural gas on the New York Mercantile Exchange ranged from a high of $5.81 per million British Thermal Units (“BTUs”) to a low of $3.29 per million BTUs. In order to manage this risk, we may hedge natural gas prices through the use of derivative financial instruments, such as forwards, swaps and futures. However, these measures carry risk (including nonperformance by counterparties) and do not in any event entirely eliminate the risk of decreased margins as a result of natural gas price increases. A significant increase in the price of energy that is not recovered through an increase in the price of our products or covered through our hedging arrangements or an extended interruption in the supply of natural gas or electricity to our production facilities could have a material adverse effect on our business, financial condition, results of operations, cash flows and prospects.
21
Table of Contents
Increases in the price of diesel fuel may adversely affect our results of operations.
Diesel fuel costs generally fluctuate with increasing and decreasing world crude oil prices, and accordingly are subject to political, economic and market factors that are outside of our control. Our operations are dependent on earthmoving equipment, railcars and tractor trailers, and diesel fuel costs are a significant component of the operating expense of these vehicles. We use earthmoving equipment in our mining operations, and we ship the vast majority of our products by either railcar or tractor trailer. To the extent that we perform these services with equipment that we own, we are responsible for buying and supplying the diesel fuel needed to operate these vehicles. To the extent that these services are provided by independent contractors, we may be subject to fuel surcharges that attempt to recoup increased diesel fuel expenses. To the extent we are unable to pass along increased diesel fuel costs to our customers, our results of operations could be adversely affected.
Diminished access to water may adversely affect our operations.
The mining and processing activities in which we engage at a number of our facilities require significant amounts of water, and some of our facilities are located in areas that are water-constrained. We have obtained water rights that we currently use to service the activities on our various properties, and we plan to obtain all required water rights to service other properties we may develop or acquire in the future. However, the amount of water that we are entitled to use pursuant to our water rights must be determined by the appropriate regulatory authorities in the jurisdictions in which we operate. Such regulatory authorities may amend the regulations regarding such water rights, increase the cost of maintaining such water rights or eliminate our current water rights, and we may be unable to retain all or a portion of such water rights. For instance, there are proposed regulations reducing water rights per acre for the aquifer accessed by our Mill Creek, Oklahoma facility. These new regulations, which could also affect local municipalities and other industrial operations, could have a material adverse effect on our operating costs and effectiveness if implemented. Such changes in laws, regulations or government policy and related interpretations pertaining to water rights may alter the environment in which we do business, which may negatively affect our financial condition and results of operations.
Title to, and the area of, water rights may also be disputed, including by Native American tribes asserting historical water rights. A successful claim that we lack appropriate water rights on one or more of our properties could cause us to lose any rights to explore, develop and operate mines on that property. Any decrease or disruption in our water rights or available water supply as a result of any of the above factors may adversely affect our operations.
The manufacture of resin-coated sand will be a new process for us, and failure to effectively integrate this new process with our existing processes could have a material adverse effect on our financial condition and results of operations.
We are currently constructing a resin-coating facility in Rochelle, Illinois that will produce resin-coated sand, which is a higher-strength alternative to traditional frac sand and involves a manufacturing process with which we are relatively inexperienced. Commercialization of resin-coated sand involves capital expenditures, which we have begun to incur, and new operational requirements. If we are unable to secure adequate, cost-effective supply commitments for the raw materials associated with resin-coated sand or if we are unable to successfully and efficiently construct the needed additional manufacturing capacity and infrastructure to produce resin-coated sand, our ability to sell this product to the marketplace may be adversely impacted. In addition, there are attendant risks of market acceptance and product performance that could result in less demand than anticipated and our having excess capacity. A lack of sales of resin-coated sand could have a material adverse effect on our financial condition and results of operations.
22
Table of Contents
If we cannot successfully complete acquisitions or integrate acquired businesses, our growth may be limited and our financial condition may be adversely affected.
Our business strategy includes supplementing internal growth by pursuing acquisitions of complementary businesses. Any acquisition involves potential risks, including, among other things:
| • | the validity of our assumptions about mineral reserves, future production, sales, capital expenditures, operating expenses and costs, including synergies; |
| • | an inability to successfully integrate the businesses we acquire; |
| • | the use of a significant portion of our available cash or borrowing capacity to finance acquisitions and the subsequent decrease in our liquidity; |
| • | a significant increase in our interest expense or financial leverage if we incur additional debt to finance acquisitions; |
| • | the assumption of unknown liabilities, losses or costs for which we are not indemnified or for which our indemnity is inadequate; |
| • | the diversion of management’s attention from other business concerns; |
| • | an inability to hire, train or retain qualified personnel both to manage and to operate our growing business and assets; |
| • | the incurrence of other significant charges, such as impairment of goodwill or other intangible assets, asset devaluation or restructuring charges; |
| • | unforeseen difficulties encountered in operating in new geographic areas; |
| • | customer or key employee losses at the acquired businesses; and |
| • | the accuracy of data obtained from production reports and engineering studies, geophysical and geological analyses and other information used when deciding to acquire a property, the results of which are often inconclusive and subject to various interpretations. |
If we cannot successfully complete acquisitions or integrate acquired businesses, our growth may be limited and our financial condition may be adversely affected.
We will be required to make substantial capital expenditures to maintain, develop and increase our asset base. The inability to obtain needed capital or financing on satisfactory terms, or at all, could have an adverse effect on our growth and profitability.
Although we currently use a significant amount of our cash reserves and cash generated from our operations to fund the maintenance and development of our existing mineral reserves and our acquisitions of new mineral reserves, we may depend on the availability of credit to fund future capital expenditures. Our ability to obtain bank financing or to access the capital markets for future equity or debt offerings may be limited by our financial condition at the time of any such financing or offering, the covenants contained in our existing credit facilities or future debt agreements, adverse market conditions or other contingencies and uncertainties that are beyond our control. Our failure to obtain the funds necessary to maintain, develop and increase our asset base could adversely impact our growth and profitability.
Even if we are able to obtain financing or access the capital markets, incurring additional debt may significantly increase our interest expense and financial leverage, and our level of indebtedness could restrict our ability to fund future development and acquisition activities. In addition, the issuance of additional common stock in an equity offering may result in significant stockholder dilution.
Our substantial indebtedness and pension obligations could adversely affect our financial flexibility and our competitive position.
We have, and we will continue to have, a significant amount of indebtedness. As of September 30, 2011, we had $258.5 million of outstanding indebtedness. As of September 30, 2011, we had no outstanding borrowings,
23
Table of Contents
$9.8 million of outstanding letters of credit, $1.2 million reserved against derivative agreements and $22.5 million of borrowing availability under the ABL Facility. Our substantial level of indebtedness increases the risk that we may be unable to generate cash sufficient to pay amounts due in respect of our indebtedness. We also have, and will continue to have, significant pension obligations. As of December 31, 2010, our unfunded pension obligations totaled $26.9 million. Our substantial indebtedness and pension obligations could have other important consequences to you and significant effects on our business. For example, they could:
| • | increase our vulnerability to adverse changes in general economic, industry and competitive conditions; |
| • | require us to dedicate a substantial portion of our cash flow from operations to make payments on our indebtedness and pension obligations, thereby reducing the availability of our cash flow to fund working capital, capital expenditures and other general corporate purposes; |
| • | limit our flexibility in planning for, or reacting to, changes in our business and the industry in which we operate; |
| • | restrict us from exploiting business opportunities; |
| • | make it more difficult to satisfy our financial obligations, including payments on our indebtedness; |
| • | place us at a disadvantage compared to our competitors that have less debt and pension obligations; and |
| • | limit our ability to borrow additional funds for working capital, capital expenditures, acquisitions, debt service requirements, execution of our business strategy or other general corporate purposes. |
Our credit facilities contain substantial restrictions and financial covenants that may restrict our business and financing activities.
Our existing credit facilities contain, and any future financing agreements that we may enter into will likely contain, operating and financial restrictions and covenants that may restrict our ability to finance future operations or capital needs or to engage in, expand or pursue our business activities. See “Description of Certain Indebtedness.”
Our ability to comply with these restrictions and covenants is uncertain and will be affected by the levels of cash flow from our operations and events or circumstances beyond our control. If market or other economic conditions deteriorate, our ability to comply with these covenants may be impaired. If we violate any of the restrictions, covenants, ratios or tests in our credit facilities, a significant portion of our indebtedness may become immediately due and payable and our lenders’ commitment to make further loans to us may terminate. We might not have, or be able to obtain, sufficient funds to make these accelerated payments. In addition, our obligations under our credit facilities are secured by substantially all of our assets, and if we are unable to repay our indebtedness under our credit facilities, the lenders could seek to foreclose on our assets. Our ABL Facility limits the amounts we can borrow to a borrowing base amount. Outstanding borrowings in excess of the borrowing base are required to be repaid immediately.
We may incur substantial debt in the future to enable us to maintain or increase our production levels and to otherwise pursue our business plan. This debt may impair our ability to operate our business.
Our business plan requires a significant amount of capital expenditures to maintain and grow our production levels. If commercial silica prices were to decline for an extended period of time, if the costs of our acquisition and development operations were to increase substantially or if other events were to occur which reduced our sales or increased our costs, we may be required to borrow significant amounts in the future to enable us to finance the expenditures necessary to replace the reserves we produce. The cost of the borrowings and our obligations to repay the borrowings could have important consequences to us, including:
| • | our ability to obtain additional financing, if necessary, for working capital, capital expenditures, acquisitions or other purposes may be impaired or such financing may not be available on favorable terms, or at all; |
24
Table of Contents
| • | covenants contained in our existing and future credit and debt arrangements will require us to meet financial tests that may affect our flexibility in planning for, and reacting to, changes in our business, including possible acquisition opportunities; |
| • | we will need a substantial portion of our cash flow to make principal and interest payments on our indebtedness and to improve the funded status of our defined benefit pension plan, reducing the funds that would otherwise be available for operations and future business opportunities; and |
| • | our debt level will make us more vulnerable than our less leveraged competitors to competitive pressures or a downturn in our business or the economy generally. |
Our ability to service our indebtedness will depend on, among other things, our future financial and operating performance, which will be affected by prevailing economic conditions and financial, business, regulatory and other factors, some of which are beyond our control. If our operating results are not sufficient to service our current or future indebtedness, we will be forced to take actions such as reducing or delaying business activities, acquisitions, investments and/or capital expenditures; selling assets; restructuring or refinancing our indebtedness; or seeking additional equity capital or bankruptcy protection. We may not be able to effect any of these remedies on satisfactory terms or at all.
Inaccuracies in our estimates of mineral reserves and resource deposits could result in lower than expected sales and higher than expected costs.
We base our mineral reserve and resource estimates on engineering, economic and geological data assembled and analyzed by our engineers and geologists, which are reviewed by outside firms. However, commercial silica reserve estimates are necessarily imprecise and depend to some extent on statistical inferences drawn from available drilling data, which may prove unreliable. There are numerous uncertainties inherent in estimating quantities and qualities of commercial silica reserves and non-reserve commercial silica deposits and costs to mine recoverable reserves, including many factors beyond our control. Estimates of economically recoverable commercial silica reserves necessarily depend on a number of factors and assumptions, all of which may vary considerably from actual results, such as:
| • | geological and mining conditions and/or effects from prior mining that may not be fully identified by available data or that may differ from experience; |
| • | assumptions concerning future prices of commercial silica products, operating costs, mining technology improvements, development costs and reclamation costs; and |
| • | assumptions concerning future effects of regulation, including the issuance of required permits and taxes by governmental agencies. |
Any inaccuracy in our estimates related to our mineral reserves and non-reserve mineral deposits could result in lower than expected sales and higher than expected costs.
Mine closures entail substantial costs, and if we close one or more of our mines sooner than anticipated, our results of operations may be adversely affected.
We base our assumptions regarding the life of our mines on detailed studies that we perform from time to time, but our studies and assumptions do not always prove to be accurate. If we close any of our mines sooner than expected, sales will decline unless we are able to increase production at any of our other mines, which may not be possible. The closure of an open pit mine also involves significant fixed closure costs, including accelerated employment legacy costs, severance-related obligations, reclamation and other environmental costs and the costs of terminating long-term obligations, including energy contracts and equipment leases. We accrue for the costs of reclaiming open pits, stockpiles, tailings ponds, roads and other mining support areas over the estimated mining life of our property. If we were to reduce the estimated life of any of our mines, the fixed mine closure costs would be applied to a shorter period of production, which would increase production costs per ton produced and could materially and adversely affect our results of operations and financial condition.
25
Table of Contents
Applicable statutes and regulations require that mining property be reclaimed following a mine closure in accordance with specified standards and an approved reclamation plan. The plan addresses matters such as removal of facilities and equipment, regrading, prevention of erosion and other forms of water pollution, re-vegetation and post-mining land use. We may be required to post a surety bond or other form of financial assurance equal to the cost of reclamation as set forth in the approved reclamation plan. The establishment of the final mine closure reclamation liability is based on permit requirements and requires various estimates and assumptions, principally associated with reclamation costs and production levels. If our accruals for expected reclamation and other costs associated with mine closures for which we will be responsible were later determined to be insufficient, our business, results of operations and financial condition would be adversely affected.
A shortage of skilled labor together with rising labor costs in the mining industry may further increase operating costs, which could adversely affect our results of operations.
Efficient mining using modern techniques and equipment requires skilled laborers, preferably with several years of experience and proficiency in multiple mining tasks, including processing of mined minerals. If the shortage of experienced labor continues or worsens or if we are unable to train the necessary number of skilled laborers, there could be an adverse impact on our labor productivity and costs and our ability to expand production.
As a result of current market conditions and the high demand for skilled labor in certain regions in which we operate, we are experiencing a record level of labor costs, and we expect the cost of labor to increase in the future. If the prices for our products decrease in the future, labor costs may not be commensurately reduced.
Our business may suffer if we lose, or are unable to attract and retain, key personnel.
We depend to a large extent on the services of our senior management team and other key personnel, and we are seeking to hire several key management personnel in the near term. Members of our senior management and other key employees have extensive experience and expertise in evaluating and analyzing industrial mineral properties, maximizing production from such properties, marketing industrial mineral production and developing and executing financing and hedging strategies. Competition for management and key personnel is intense, and the pool of qualified candidates is limited. The loss of any of these individuals or the failure to attract additional personnel, as needed, could have a material adverse effect on our operations and could lead to higher labor costs or the use of less-qualified personnel. In addition, if any of our executives or other key employees were to join a competitor or form a competing company, we could lose customers, suppliers, know-how and key personnel. We do not maintain key-man life insurance with respect to any of our employees. Our success will be dependent on our ability to continue to attract, employ and retain highly skilled personnel.
Our profitability could be negatively affected if we fail to maintain satisfactory labor relations.
As of December 31, 2010, various labor unions represented about 56% of our employees. If we are unable to renegotiate acceptable collective bargaining agreements with these labor unions in the future, we could experience, among other things, strikes, work stoppages or other slowdowns by our workers and increased operating costs as a result of higher wages, health care costs or benefits paid to our employees. An inability to maintain good relations with our workforce could cause a material adverse effect on our business and results of operations.
We rely upon trade secrets and contractual restrictions, and not patents, to protect our proprietary rights. Failure to protect our intellectual property rights may undermine our competitive position, and protecting our rights or defending against third-party allegations of infringement may be costly.
Our commercial success depends on our proprietary information and technologies, know-how and other intellectual property. Because of the technical nature of our business, we rely on trade secrets, trademarks and
26
Table of Contents
contractual restrictions to protect our intellectual property rights and currently do not hold any patents related to our business. The measures we take to protect our trade secrets and other intellectual property rights may be insufficient. Failure to protect, monitor and control the use of our existing intellectual property rights could cause us to lose our competitive advantage and incur significant expenses. It is possible that our competitors or others could independently develop the same or similar technologies or otherwise obtain access to our unpatented technologies. In such case, our trade secrets would not prevent third parties from competing with us. As a result, our results of operations may be adversely affected. Furthermore, third parties or employees may infringe or misappropriate our proprietary technologies or other intellectual property rights, which could also harm our business and results of operations. Policing unauthorized use of intellectual property rights can be difficult and expensive, and adequate remedies may not be available.
In addition, third parties may claim that our products infringe or otherwise violate their patents or other proprietary rights and seek corresponding damages or injunctive relief. Defending ourselves against such claims, with or without merit, could be time-consuming and result in costly litigation. An adverse outcome in any such litigation could subject us to significant liability to third parties (potentially including treble damages) or temporary or permanent injunctions prohibiting the manufacture or sale of our products, the use of our technologies or the conduct of our business. Any adverse outcome could also require us to seek licenses from third parties (which may not be available on acceptable terms, or at all) or to make substantial one-time or ongoing royalty payments. Protracted litigation could also result in our customers or potential customers deferring or limiting their purchase or use of our products until resolution of such litigation. In addition, we may not have insurance coverage in connection with such litigation and may have to bear all costs arising from any such litigation to the extent we are unable to recover them from other parties. Any of these outcomes could have a material adverse effect on our business, financial condition, results of operations, cash flows and prospects.
Silica-related health issues and litigation could have a material adverse effect on our business, reputation or results of operations.
The inhalation of respirable crystalline silica is associated with the lung disease silicosis. There is recent evidence of an association between crystalline silica exposure or silicosis and lung cancer and a possible association with other diseases, including immune system disorders such as scleroderma. These health risks have been, and may continue to be, a significant issue confronting the commercial silica industry. Concerns over silicosis and other potential adverse health effects, as well as concerns regarding potential liability from the use of silica, may have the effect of discouraging our customers’ use of our silica products. The actual or perceived health risks of mining, processing and handling silica could materially and adversely affect silica producers, including us, through reduced use of silica products, the threat of product liability or employee lawsuits, increased scrutiny by federal, state and local regulatory authorities of us and our customers or reduced financing sources available to the commercial silica industry.
Since at least 1975, we and/or our predecessors have been named as a defendant, usually among many defendants, in numerous products liability lawsuits brought by or on behalf of current or former employees of our customers alleging damages caused by silica exposure. As of December 31, 2010, we were the subject of approximately 146 active silica exposure claims, and, as of January 17, 2012, approximately 3,156 inactive claims. Almost all of the claims pending against us arise out of the alleged use of our silica products in foundries or as an abrasive blast media and have been filed in the states of Texas, Louisiana and Mississippi, although some cases have been brought in many other jurisdictions over the years.
We currently have certain limited sources of recovery for silica exposure claims to date, including an indemnity for those claims from a successor to our former owner and some insurance coverage. The indemnity covers only claims filed prior to 2005 for alleged exposure to our products only for the period prior to September 12, 1985 and contains other limitations. Existing and potential insurance coverage applies only to occurrences of alleged silica exposure prior to certain dates in 1985 and 1986, respectively. We have no insurance or indemnity for claims relating to silica exposure after these dates. Although the scope of coverage
27
Table of Contents
under certain insurance policies is currently being litigated, we believe, based on currently available information, they and the indemnity will remain in force. The silica-related litigation brought against us to date and associated litigation costs, settlements and verdicts have not resulted in a material liability to us to date. However, we continue to have silica exposure claims filed against us, including claims that allege silica exposure for periods not covered by insurance or an indemnity, and the costs, outcome and impact to us of any pending or future claims is not certain. Any such pending or future claims or inadequacies of our indemnity or insurance coverage could have a material adverse effect on our business, reputation, financial condition, results of operations, cash flows and prospects. For further information, see “Business—Legal Proceedings.”
We may have to utilize significant cash to meet our unfunded pension obligations and post-retirement health care liabilities and these obligations are subject to increase.
Many of our employees participate in our defined benefit pension plans. From January 1, 2011 through September 30, 2011, we made payments totaling $11.0 million toward reducing the unfunded liability of our defined benefit pension plans. Declines in interest rates or the market values of the securities held by the plans, or other adverse changes, could materially increase the underfunded status of our plans and affect the level and timing of required cash contributions. To the extent we use cash to reduce these unfunded liabilities, the amount of cash available for our working capital needs would be reduced. In addition, under the Employee Retirement Income Security Act of 1974, as amended (“ERISA”), the Pension Benefit Guaranty Corporation (“PBGC”) has the authority to institute proceedings to terminate a pension plan if (1) the plan has not met the minimum funding requirements, (2) the plan cannot pay current benefits when due, (3) a lump sum payment has been made to a participant who is a substantial owner of the sponsoring company (and certain other technical conditions exist) or (4) the loss to the PBGC is reasonably expected to increase unreasonably over time if the plan is not terminated. In the event our tax-qualified pension plans are terminated by the PBGC, we could be liable to the PBGC for the underfunded amount, which could trigger default provisions in our credit facilities.
We also have a post-retirement health and life insurance plan for many of our employees. The post-retirement benefit plan is unfunded. We derive post-retirement benefit expense from an actuarial calculation based on the provisions of the plan and a number of assumptions provided by us including information about employee demographics, retirement age, future health care costs, turnover, mortality, discount rate, amount and timing of claims and a health care inflation trend rate. Our pension obligation was $92.1 million as of December 31, 2010 (with plan assets of $65.2 million), and post-retirement healthcare obligations were $22.5 million as of December 31, 2010. The amount of cash ultimately required to fund these obligations will vary based on a number of factors including future return on assets, mortality rates and other such actuarial assumptions. Based on current assumptions, we expect to pay $12.5 million in the year 2011, a total of $13.6 million for the two-year period from 2012 through 2013, a total of $12.1 million for the two-year period from 2014 through 2015 and a total of $12.7 million thereafter. See “Management’s Discussion and Analysis of Financial Condition and Results of Operations—Contractual Obligations.”
Failure to maintain effective quality control systems at our mining, processing and production facilities could have a material adverse effect on our business and operations.
The performance, quality and safety of our products are critical to the success of our business. These factors depend significantly on the effectiveness of our quality control systems, which, in turn, depends on a number of factors, including the design of our quality control systems, our quality-training program and our ability to ensure that our employees adhere to the quality control policies and guidelines. Any significant failure or deterioration of our quality control systems could have a material adverse effect on our business, financial condition, results of operations and reputation.
Seasonal and severe weather conditions could have a material adverse impact on our business.
Our business could be materially adversely affected by weather conditions. Severe weather conditions may affect our customers’ operations, thus reducing their need for our products. Weather conditions may impact our
28
Table of Contents
operations, resulting in weather-related damage to our facilities and equipment or an inability to deliver equipment, personnel and products to job sites in accordance with contract schedules. In addition, the EPA has stated that climate change may lead to the increased frequency and severity of extreme weather events. Any such interference with our operations could force us to delay or curtail services and potentially breach our contractual obligations or result in a loss of productivity and an increase in our operating costs.
Our sales and profitability fluctuate on a seasonal basis and are affected by a variety of other factors.
Our sales and profitability are affected by a variety of factors, including actions of competitors, changes in general economic conditions, weather conditions and seasonal periods. As a result, our results of operations fluctuate on a quarterly basis and relative to corresponding periods in prior years, and any of these factors could adversely affect our business and cause our results of operations to decline. For example, we sell more of our products in the second and third quarters in the building products and recreation end markets due to the seasonal rise in construction driven by more favorable weather conditions. We sell fewer of our products in the first and fourth quarters due to reduced construction and recreational activity largely as a result of adverse weather conditions. Any unanticipated decrease in demand for our products during the second and third quarters could have a material adverse effect on our sales and profitability.
We may be subject to interruptions or failures in our information technology systems.
We rely on sophisticated information technology systems and infrastructure to support our business, including process control technology. Any of these systems may be susceptible to outages due to fire, floods, power loss, telecommunications failures and similar events. The failure of any of our information technology systems may cause disruptions in our operations, which could adversely affect our sales and profitability.
We rely on a different source for our 2010 industry and market data than for the same data in prior years. Neither the 2010 data nor the data prior to 2010 can be verified with certainty, and either the 2010 data or the data prior to 2010 may prove to be inaccurate.
We have relied on the Minerals Yearbook produced by the USGS for our industry and market data for years prior to 2010. The USGS has not yet produced its 2010 yearbook and has provided only preliminary estimates of commercial silica demand in 2010. We experienced unprecedented demand for our frac sand products from producers of oil and natural gas in 2010, and based on our experience and results of operations in 2010, we believe that our internal estimates of market demand, compiled through consultation with independent third parties, more accurately represent 2010 demand for commercial silica than the preliminary USGS estimates. Neither the 2010 data nor the data prior to 2010 can be verified with certainty, and either the 2010 data or the data prior to 2010 may prove to be inaccurate.
In addition, certain of this industry data constitutes forward-looking statements. We cannot guarantee the accuracy of such forward-looking statements, and you should be aware that results and events could differ materially and adversely from those contained in these forward-looking statements. See “Forward-Looking Statements.”
A terrorist attack or armed conflict could harm our business.
Terrorist activities, anti-terrorist efforts and other armed conflicts involving the United States could adversely affect the U.S. and global economies and could prevent us from meeting financial and other obligations. We could experience loss of business, delays or defaults in payments from payors or disruptions of fuel supplies and markets if pipelines, production facilities, processing plants or refineries are direct targets or indirect casualties of an act of terror or war. Such activities could reduce the overall demand for oil and natural gas, which, in turn, could also reduce the demand for our products and services. Terrorist activities and the threat of potential terrorist activities and any resulting economic downturn could adversely affect our results of operations, impair our ability to raise capital or otherwise adversely impact our ability to realize certain business strategies.
29
Table of Contents
If we fail to establish and maintain adequate internal controls over financial reporting, we may not be able to report our financial results in a timely and reliable manner, which could harm our business and impact the value of our common stock.
We depend on our ability to produce accurate and timely financial statements in order to run our business. If we fail to do so, our business could be negatively affected and our independent registered public accounting firm may be unable to attest to the accuracy of our financial statements and effectiveness of our internal controls.
We reissued our 2010 financial statements after management identified a material weakness in its internal controls related to stock-based compensation. Based on a misinterpretation of accounting guidance, management did not properly record compensation for equity-based awards granted at GGC USS Holdings, LLC (our “parent LLC”) to certain of our employees. This resulted in an understatement of stock-based compensation expense in 2009 and 2010. A material weakness is a control deficiency, or combination of control deficiencies, that results in more than a remote likelihood that a material misstatement of the annual or interim financial statements will not be prevented or detected. See “Management’s Discussion and Analysis of Financial Condition and Results of Operations—Internal Control Over Financial Reporting.” No additional equity-based awards are expected to be granted to our employees at our parent LLC in the future and, therefore, no additional remediation efforts are necessary.
If we fail to maintain effective internal controls in the future, it could result in a material misstatement of our financial statements that would not be prevented or detected on a timely basis, which could cause investors to lose confidence in our financial information or cause our stock price to decline.
Risks Related to Environmental, Mining and Other Regulation
We and our customers are subject to extensive environmental and health and safety regulations that impose, and will continue to impose, significant costs and liabilities. In addition, future regulations, or more stringent enforcement of existing regulations, could increase those costs and liabilities, which could adversely affect our results of operations.
We are subject to a variety of federal, state and local regulatory environmental requirements affecting the mining and mineral processing industry, including among others, those relating to employee health and safety, environmental permitting and licensing, air and water emissions, greenhouse gas emissions, water pollution, waste management, remediation of soil and groundwater contamination, land use, reclamation and restoration of properties, hazardous materials and natural resources. These laws, regulations and permits have had, and will continue to have, a significant effect on our business. Some environmental laws impose substantial penalties for noncompliance, and others, such as the federal Comprehensive Environmental Response, Compensation, and Liability Act (“CERCLA”), impose strict, retroactive and joint and several liability for the remediation of releases of hazardous substances. Liability under CERCLA, or similar state and local laws, may be imposed as a result of conduct that was lawful at the time it occurred or for the conduct of, or conditions caused by, prior operators or other third parties. Failure to properly handle, transport, store or dispose of hazardous materials or otherwise conduct our operations in compliance with environmental laws could expose us to liability for governmental penalties, cleanup costs and civil or criminal liability associated with releases of such materials into the environment, damages to property or natural resources and other damages, as well as potentially impair our ability to conduct our operations. In addition, future environmental laws and regulations could restrict our ability to expand our facilities or extract our mineral deposits or could require us to acquire costly equipment or to incur other significant expenses in connection with our business. Future events, including changes in any environmental requirements (or their interpretation or enforcement) and the costs associated with complying with such requirements, could have a material adverse effect on us.
30
Table of Contents
Any failure by us to comply with applicable environmental laws and regulations may cause governmental authorities to take actions that could adversely impact our operations and financial condition, including:
| • | issuance of administrative, civil and criminal penalties; |
| • | denial, modification or revocation of permits or other authorizations; |
| • | imposition of injunctive obligations or other limitations on our operations, including cessation of operations; and |
| • | requirements to perform site investigatory, remedial or other corrective actions. |
Moreover, environmental requirements, and the interpretation and enforcement thereof, change frequently and have tended to become more stringent over time. For example, greenhouse gas emission regulation is becoming more rigorous. We expect to be required to report annual greenhouse gas emissions from our operations to the EPA, and additional greenhouse gas emission related requirements at the supranational, federal, state, regional and local levels are in various stages of development. The U.S. Congress has considered, and may adopt in the future, various legislative proposals to address climate change, including a nationwide limit on greenhouse gas emissions. In addition, the EPA has issued regulations, including the “Tailoring Rule,” that subject greenhouse gas emissions from certain stationary sources to the Prevention of Significant Deterioration and Title V provisions of the federal Clean Air Act. Any such regulations could require us to modify existing permits or obtain new permits, implement additional pollution control technology, curtail operations or increase significantly our operating costs. Any regulation of greenhouse gas emissions, including, for example, through a cap-and-trade system, technology mandate, emissions tax, reporting requirement or other program, could adversely affect our business, financial condition, reputation, operating performance and product demand.
In addition to environmental regulation, we are subject to laws and regulations relating to human exposure to crystalline silica. Several federal and state regulatory authorities, including the U.S. Mining Safety and Health Administration, may continue to propose changes in their regulations regarding workplace exposure to crystalline silica, such as permissible exposure limits and required controls and personal protective equipment. Both the North American Industrial Mining Association and the National Industrial Sand Association, both of which we are a member, track silicosis-related issues and aim to work with government policymakers in crafting such regulations.
We may not be able to comply with any new laws and regulations that are adopted, and any new laws and regulations could have a material adverse effect on our operating results by requiring us to modify our operations or equipment or shut down some or all of our plants. Additionally, our customers may not be able to comply with any new laws and regulations, and any new laws and regulations could have a material adverse effect on our customers by requiring them to shut down old plants or to relocate plants to locations with less stringent regulations farther away from our facilities. We cannot at this time reasonably estimate our costs of compliance or the timing of any costs associated with any new laws and regulations, or any material adverse effect that any new standards will have on our customers and, consequently, on our operations.
We are subject to various lawsuits relating to the actual or alleged exposure of persons to silica. See “—Risks Related to Our Business—Silica-related health issues and litigation could have a material adverse effect on our business, reputation or results of operations.”
We are subject to the Federal Mine Safety and Health Act of 1977, which imposes stringent health and safety standards on numerous aspects of our operations.
Our operations are subject to the Federal Mine Safety and Health Act of 1977, as amended by the Mine Improvement and New Emergency Response Act of 2006, which imposes stringent health and safety standards on numerous aspects of mineral extraction and processing operations, including the training of personnel,
31
Table of Contents
operating procedures, operating equipment and other matters. Our failure to comply with such standards, or changes in such standards or the interpretation or enforcement thereof, could have a material adverse effect on our business and financial condition or otherwise impose significant restrictions on our ability to conduct mineral extraction and processing operations.
We and our customers are subject to other extensive regulations, including licensing, plant and wildlife protection and reclamation regulation, that impose, and will continue to impose, significant costs and liabilities. In addition, future regulations, or more stringent enforcement of existing regulations, could increase those costs and liabilities, which could adversely affect our results of operations.
In addition to the regulatory matters described above, we and our customers are subject to extensive governmental regulation on matters such as permitting and licensing requirements, plant and wildlife protection, wetlands protection, reclamation and restoration of mining properties after mining is completed, the discharge of materials into the environment and the effects that mining and hydraulic fracturing have on groundwater quality and availability. Our future success depends, among other things, on the quantity of our commercial silica and other mineral deposits and our ability to extract these deposits profitably, and our customers being able to operate their businesses as they currently do.
In order to obtain permits and renewals of permits in the future, we may be required to prepare and present data to governmental authorities pertaining to the impact that any proposed exploration or production activities may have on the environment. Certain approval procedures may require preparation of archaeological surveys, endangered species studies and other studies to assess the environmental impact of new sites or the expansion of existing sites. Compliance with these regulatory requirements is expensive and significantly lengthens the time needed to develop a site. Finally, obtaining or renewing required permits is sometimes delayed or prevented due to community opposition and other factors beyond our control. The denial of a permit essential to our operations or the imposition of conditions with which it is not practicable or feasible to comply could impair or prevent our ability to develop or expand a site. Significant opposition to a permit by neighboring property owners, members of the public or other third parties or delay in the environmental review and permitting process also could impair or delay our ability to develop or expand a site. New legal requirements, including those related to the protection of the environment, could be adopted that could materially adversely affect our mining operations (including our ability to extract mineral deposits), our cost structure or our customers’ ability to use our commercial silica products. Such current or future regulations could have a material adverse effect on our business and we may not be able to obtain or renew permits in the future.
Our inability to acquire, maintain or renew financial assurances related to the reclamation and restoration of mining property could have a material adverse effect on our business, financial condition and results of operations.
We are generally obligated to restore property in accordance with regulatory standards and our approved reclamation plan after it has been mined. We are required under federal, state and local laws to maintain financial assurances, such as surety bonds, to secure such obligations. The inability to acquire, maintain or renew such assurances, as required by federal, state and local laws, could subject us to fines and penalties as well as the revocation of our operating permits. Such inability could result from a variety of factors, including:
| • | the lack of availability, higher expense or unreasonable terms of such financial assurances; |
| • | the ability of current and future financial assurance counterparties to increase required collateral; and |
| • | the exercise by financial assurance counterparties of any rights to refuse to renew the financial assurance instruments. |
Our inability to acquire, maintain or renew necessary financial assurances related to the reclamation and restoration of mining property could have a material adverse effect on our business, financial condition and results of operations.
32
Table of Contents
Risks Related to This Offering and Ownership of Our Common Stock
An active public market for our common stock may not develop following this offering, which could limit your ability to sell your shares of our common stock at an attractive price, or at all.
Prior to this offering, there has been no public market for our common stock. We cannot predict the extent to which investor interest in our company will lead to the development of an active trading market in our common stock or how liquid that market might become. An active public market for our common stock may not develop or be sustained after the offering. If an active public market does not develop or is not sustained, it may be difficult for you to sell your shares of common stock at a price that is attractive to you, or at all.
We are a “controlled company,” controlled by Golden Gate Capital, whose interests in our business may be different from yours.
Upon completion of this offering, our parent LLC, which is controlled by Golden Gate Capital, will own approximately 41.2 million shares, or 77.8%, of our outstanding common stock. Accordingly, our parent LLC will be able to control virtually all matters requiring stockholder approval, including amendments to our certificate of incorporation and bylaws and approval of significant corporate transactions, including mergers and sales of substantially all of our assets. Prior to the completion of this offering, we intend to enter into a director designation agreement that will provide certain rights to our parent LLC, including with respect to director nominations.
Because of the equity ownership of our parent LLC, we will be considered a “controlled company” for purposes of the New York Stock Exchange (“NYSE”) listing requirements. As such, we will be exempt from the NYSE corporate governance requirements that our board of directors meet the standard of independence established by those corporate governance requirements and will be exempt from the requirements that we have separate compensation and nominating and corporate governance committees made up entirely of directors who meet such independence standards. The NYSE independence standards are intended to ensure that directors who meet the independence standards are free of any conflicting interest that could influence their actions as directors. It is possible that the interests of our parent LLC may in some circumstances conflict with our interests and the interests of our other stockholders, including you.
Our stock price may be volatile or may decline regardless of our operating performance, and you may not be able to resell your shares at or above the initial public offering price.
After this offering, the market price for our common stock is likely to be volatile, in part because our shares have not been traded publicly. In addition, the market price of our common stock may fluctuate significantly in response to a number of factors, most of which we cannot control, including:
| • | quarterly variations in our operating results compared to market expectations; |
| • | changes in preferences of our customers; |
| • | announcements of new products or significant price reductions by us or our competitors; |
| • | size of the public float; |
| • | stock price performance of our competitors; |
| • | fluctuations in stock market prices and volumes; |
| • | default on our indebtedness or foreclosure of our properties; |
| • | actions by competitors; |
| • | changes in senior management or key personnel; |
| • | changes in financial estimates by securities analysts; |
33
Table of Contents
| • | negative earnings or other announcements by us or other industrial companies; |
| • | downgrades in our credit ratings or the credit ratings of our competitors; |
| • | issuances of capital stock; and |
| • | global economic, legal and regulatory factors unrelated to our performance. |
Numerous factors affect our business and cause variations in our operating results and affect our net sales, including overall economic trends, our ability to identify and respond effectively to customer preferences, actions by competitors, pricing, the level of customer service that we provide, changes in product mix or sales channels, our ability to source and distribute products effectively and weather conditions.
The initial public offering price of our common stock will be determined by negotiations between us, the selling stockholder and the underwriters based on a number of factors and may not be indicative of prices that will prevail following the completion of this offering. Volatility in the market price of our common stock may prevent investors from being able to sell their common stock at or above the initial public offering price. As a result, you may suffer a loss on your investment.
In addition, stock markets have experienced extreme price and volume fluctuations that have affected and continue to affect the market prices of equity securities of many industrial companies. In the past, stockholders have instituted securities class action litigation following periods of market volatility. If we were involved in securities litigation, we could incur substantial costs and our resources and the attention of management could be diverted from our business.
Future sales of our common stock, or the perception in the public markets that these sales may occur, may depress our stock price.
Sales of substantial amounts of our common stock in the public market after this offering, or the perception that these sales could occur, could adversely affect the price of our common stock and could impair our ability to raise capital through the sale of additional shares. Upon completion of this offering, we will have 52,941,176 shares of common stock outstanding. The shares of common stock offered in this offering will be freely tradable without restriction under the Securities Act, except for any shares of our common stock that may be held or acquired by our directors, executive officers and other affiliates, as that term is defined in the Securities Act, which will be restricted securities under the Securities Act. Restricted securities may not be sold in the public market unless the sale is registered under the Securities Act or an exemption from registration is available.
We, each of our officers and directors and the selling stockholder have agreed, subject to certain exceptions, with the underwriters not to dispose of or hedge any of the shares of common stock or securities convertible into or exchangeable for, or that represent the right to receive, shares of common stock during the period from the date of this prospectus continuing through the date 180 days after the date of this prospectus, except with the prior written consent of Morgan Stanley & Co. LLC. See “Underwriters.”
All of our shares of common stock outstanding as of the date of this prospectus may be sold in the public market by existing stockholders 180 days after the date of this prospectus, subject to applicable limitations imposed under federal securities laws. See “Shares Eligible for Future Sale” for a more detailed description of the restrictions on selling shares of our common stock after this offering.
In the future, we may also issue our securities if we need to raise capital in connection with a capital raise or acquisition. The amount of shares of our common stock issued in connection with a capital raise or acquisition could constitute a material portion of our then outstanding shares of common stock.
34
Table of Contents
Anti-takeover provisions in our charter documents and Delaware law might discourage or delay acquisition attempts for us that you might consider favorable.
Our certificate of incorporation and bylaws will contain provisions that may make the acquisition of our company more difficult without the approval of our board of directors. These provisions, which in some cases do not apply to our parent LLC until it holds less than 35% of our outstanding shares:
| • | authorize the issuance of undesignated preferred stock, the terms of which may be established and the shares of which may be issued without stockholder approval, and which may include super voting, special approval, dividend, or other rights or preferences superior to the rights of the holders of common stock; |
| • | prohibit stockholder action by written consent, which requires all stockholder actions to be taken at a meeting of our stockholders; |
| • | provide that the board of directors is expressly authorized to make, alter or repeal our bylaws; and |
| • | establish advance notice requirements for nominations for elections to our board or for proposing matters that can be acted upon by stockholders at stockholder meetings. |
Our certificate of incorporation also contains a provision that provides us with protections similar to Section 203 of the Delaware General Corporation Law (the “DGCL”), and will prevent us from engaging in a business combination with a person who acquires at least 15% of our common stock for a period of three years from the date such person acquired such common stock, except for our parent LLC (or its members) and, in certain instances, persons who purchase common stock from our parent LLC (or its members), and unless board or stockholder approval is obtained prior to the acquisition. These anti-takeover provisions and other provisions under Delaware law could discourage, delay or prevent a transaction involving a change in control of our company, even if doing so would benefit our stockholders. These provisions could also discourage proxy contests and make it more difficult for you and other stockholders to elect directors of your choosing and to cause us to take other corporate actions you desire.
Our certificate of incorporation contains a provision renouncing our interest and expectancy in certain corporate opportunities.
Our certificate of incorporation provides for the allocation of certain corporate opportunities between us and Golden Gate Capital. Under these provisions, neither Golden Gate Capital, its affiliates and subsidiaries, nor any of their officers, directors, agents, stockholders, members or partners will have any duty to refrain from engaging, directly or indirectly, in the same business activities or similar business activities or lines of business in which we operate. For instance, a director of our company who also serves as a director, officer or employee of Golden Gate Capital or any of its subsidiaries or affiliates may pursue certain acquisitions or other opportunities that may be complementary to our business and, as a result, such acquisition or other opportunities may not be available to us. These potential conflicts of interest could have a material adverse effect on our business, financial condition, results of operations or prospects if attractive corporate opportunities are allocated by Golden Gate Capital to itself or its subsidiaries or affiliates instead of to us. The terms of our certificate of incorporation are more fully described in “Description of Capital Stock.”
If you purchase shares of common stock sold in this offering, you will incur immediate and substantial dilution.
If you purchase shares of common stock in this offering, you will incur immediate and substantial dilution in the amount of $15.88 per share, assuming an initial public offering price of $17.00 per share (the midpoint of the range set forth on the cover of this prospectus), because the initial public offering price per share is substantially higher than the net tangible book value per share of our outstanding common stock. This dilution is due in large part to the fact that our earlier investors paid substantially less than the initial public offering price when they purchased their shares. In addition, you may also experience additional dilution upon future equity issuances or the exercise of stock options to purchase common stock granted to our employees, consultants and directors under our stock option and equity incentive plans. See “Dilution.”
35
Table of Contents
If securities or industry analysts do not publish research or publish inaccurate or unfavorable research about our business, our stock price and trading volume could decline.
The trading market for our common stock will depend in part on the research and reports that securities or industry analysts publish about us or our business. We do not currently have and may never obtain research coverage by securities and industry analysts. If no securities or industry analysts commence coverage of our company, the trading price for our stock would be negatively impacted. If we obtain securities or industry analyst coverage and if one or more of the analysts who covers us downgrades our stock or publishes inaccurate or unfavorable research about our business, our stock price would likely decline. If one or more of these analysts ceases coverage of us or fails to publish reports on us regularly, demand for our stock could decrease, which could cause our stock price and trading volume to decline.
We do not expect to pay any cash dividends for the foreseeable future.
The continued operation and expansion of our business will require substantial funding. Accordingly, we do not anticipate that we will pay any cash dividends on shares of our common stock for the foreseeable future. Any determination to pay dividends in the future will be at the discretion of our board of directors and will depend on our results of operations and financial condition, contractual restrictions, restrictions imposed by applicable law and other factors our board of directors deems relevant. Additionally, we are currently restricted from paying cash dividends by the agreements governing our indebtedness, and we expect these restrictions to continue in the future. Accordingly, if you purchase shares in this offering, realization of a gain on your investment will depend on the appreciation of the price of our common stock, which may never occur. Investors seeking cash dividends in the foreseeable future should not purchase our common stock.
We will incur increased costs as a result of becoming a public company.
As a public company, we will incur significant legal, accounting, insurance and other expenses that we have not incurred as a private company, including costs associated with public company reporting requirements. We also have incurred and will incur costs associated with complying with the requirements of the Sarbanes-Oxley Act of 2002, the Dodd-Frank Act of 2010, and related rules implemented by the Securities and Exchange Commission (“SEC”) and the NYSE. In particular, we will be required to do the following:
| • | prepare and distribute periodic public reports and other stockholder communications in compliance with our obligations under the federal securities laws and NYSE rules; |
| • | create or expand the roles and duties of our board of directors, our board committees and management; |
| • | institute more comprehensive financial reporting and disclosure compliance functions; |
| • | hire additional financial and accounting personnel and other experienced accounting and finance staff with the expertise to address the complex accounting matters applicable to public companies; |
| • | enhance and formalize closing procedures at the end of our accounting periods; |
| • | enhance our internal audit function; |
| • | establish an investor relations function; |
| • | establish new internal policies, such as those relating to disclosure controls and procedures and insider trading; and |
| • | retain and involve to a greater degree outside counsel and accountants in the activities listed above. |
The expenses incurred by public companies generally for reporting and corporate governance purposes have been increasing. We expect these rules and regulations to increase our legal and financial compliance costs and to make some activities more time-consuming and costly, although we are currently unable to estimate these costs with any degree of certainty.
36
Table of Contents
These laws and regulations could also make it more difficult or costly for us to obtain certain types of insurance, including director and officer liability insurance, and we may be forced to accept reduced policy limits and coverage or incur substantially higher costs to obtain the same or similar coverage. These laws and regulations could also make it more difficult for us to attract and retain qualified persons to serve on our board of directors, our board committees or as our executive officers. Furthermore, if we are unable to satisfy our obligations as a public company, we could be subject to delisting of our common stock, fines, sanctions and other regulatory action and potentially civil litigation.
Compliance with Section 404 of the Sarbanes-Oxley Act of 2002 will require significant expenditures and effort by management, and if our independent registered public accounting firm is unable to provide an unqualified attestation report on our internal controls, our stock price could be adversely affected.
As a private company, we do not currently meet all the standards contemplated by Section 404 of the Sarbanes-Oxley Act of 2002 that we will eventually be required to meet. Pursuant to Section 404 of the Sarbanes-Oxley Act of 2002 and related rules and regulations and beginning with our Annual Report on Form 10-K for the year ending December 31, 2012, our management will be required to report on, and our independent registered public accounting firm to attest to, the effectiveness of our internal control over financial reporting. The rules governing the standards that must be met for management to assess our internal control over financial reporting are complex and require significant documentation, testing and possible remediation. We do not currently have comprehensive documentation of our internal controls, nor do we document or test our compliance with these controls on a periodic basis in accordance with Section 404. Furthermore, we have not tested our internal controls in accordance with Section 404 and, due to our lack of documentation, such a test would not be possible to perform at this time.
We are currently in the process of reviewing, documenting and testing our internal control over financial reporting. We may encounter problems or delays in completing the implementation of any changes necessary to make a favorable assessment of our internal control over financial reporting. In addition, in connection with the attestation process by our independent registered public accounting firm, we may encounter problems or delays in completing the implementation of any requested improvements and receiving a favorable attestation. If we cannot favorably assess the effectiveness of our internal control over financial reporting, or if our independent registered public accounting firm is unable to provide an unqualified attestation report on our internal controls, investors could lose confidence in our financial information and our stock price could decline.
In addition, we have incurred and will incur incremental costs and expect to devote substantial management effort in order to improve our internal control over financial reporting and comply with Section 404, including increased auditing and legal fees and costs associated with hiring additional accounting and financial staff with appropriate public company experience and technical accounting knowledge. These additional costs will increase our operating expenses and could reduce or eliminate our ability to earn a profit.
37
Table of Contents
This prospectus contains forward-looking statements that are subject to risks and uncertainties. All statements other than statements of historical fact included in this prospectus are forward-looking statements. Forward-looking statements give our current expectations and projections relating to our financial condition, results of operations, plans, objectives, future performance and business. You can identify forward-looking statements by the fact that they do not relate strictly to historical or current facts. These statements may include words such as “anticipate,” “estimate,” “expect,” “project,” “plan,” “intend,” “believe,” “may,” “will,” “should,” “can have,” “likely” and other words and terms of similar meaning in connection with any discussion of the timing or nature of future operating or financial performance or other events. For example, all statements we make relating to our estimated and projected costs, expenditures, cash flows, growth rates and financial results, our plans and objectives for future operations, growth or initiatives, strategies or the expected outcome or impact of pending or threatened litigation are forward-looking statements. All forward-looking statements are subject to risks and uncertainties that may cause actual results to differ materially from those that we expected, including:
| • | fluctuations in demand for commercial silica; |
| • | the cyclical nature of our customers’ businesses; |
| • | operating risks that are beyond our control, such as changes in the price and availability of transportation, natural gas or electricity; unusual or unexpected geological formations or pressures; cave-ins, pit wall failures or rock falls; or unanticipated ground, grade or water conditions; |
| • | our dependence on two of our plants for a significant portion of our sales; |
| • | the level of activity in the natural gas and oil industries; |
| • | decreased demand for frac sand or the development of either effective alternative proppants or new processes to replace hydraulic fracturing; |
| • | federal, state and local legislative and regulatory initiatives relating to hydraulic fracturing and the potential for related regulatory action or litigation affecting our customers’ operations; |
| • | our rights and ability to mine our properties and our renewal or receipt of the required permits and approvals from governmental authorities and other third parties; |
| • | our ability to implement our capacity expansion plans within our current timetable and budget and our ability to secure offtake agreements for our increased production capacity, and the actual operating costs once we have completed the capacity expansion; |
| • | our ability to succeed in competitive markets; |
| • | loss of, or reduction in, business from our largest customers; |
| • | increasing costs or a lack of dependability or availability of transportation services or infrastructure; |
| • | increases in the prices of, or interruptions in the supply of, natural gas and electricity, or any other energy sources; |
| • | increases in the price of diesel fuel; |
| • | diminished access to water; |
| • | our ability to effectively integrate the manufacture of resin-coated sand with our existing processes; |
| • | our ability to successfully complete acquisitions or integrate acquired businesses; |
| • | our ability to make capital expenditures to maintain, develop and increase our asset base and our ability to obtain needed capital or financing on satisfactory terms; |
| • | substantial indebtedness and pension obligations; |
38
Table of Contents
| • | restrictions imposed by our indebtedness on our current and future operations; |
| • | the accuracy of our estimates of mineral reserves and resource deposits; |
| • | substantial costs of mine closures; |
| • | a shortage of skilled labor and rising labor costs in the mining industry; |
| • | our ability to attract and retain key personnel; |
| • | our ability to maintain satisfactory labor relations; |
| • | our reliance on trade secrets and contractual restrictions, rather than patents, to protect our proprietary rights; |
| • | silica-related health issues and corresponding litigation; |
| • | our significant unfunded pension obligations and post-retirement health care liabilities; |
| • | our ability to maintain effective quality control systems at our mining, processing and production facilities; |
| • | seasonal and severe weather conditions; |
| • | fluctuations in our sales and results of operations due to seasonality and other factors; |
| • | interruptions or failures in our information technology systems; |
| • | our reliance on different sources for our 2010 industry and market data than for the same data in prior years; |
| • | the impact of a terrorist attack or armed conflict; |
| • | our failure to maintain adequate internal controls; |
| • | extensive and evolving environmental, mining, health and safety, licensing, reclamation and other regulation (and changes in their enforcement or interpretation); |
| • | our ability to acquire, maintain or renew financial assurances related to the reclamation and restoration of mining property; and |
| • | other factors disclosed in the section entitled “Risk Factors” and elsewhere in this prospectus. |
We derive many of our forward-looking statements from our operating budgets and forecasts, which are based on many detailed assumptions. While we believe that our assumptions are reasonable, we caution that it is very difficult to predict the impact of known factors, and it is impossible for us to anticipate all factors that could affect our actual results. Important factors that could cause actual results to differ materially from our expectations, or cautionary statements, are disclosed under the sections entitled “Risk Factors” and “Management’s Discussion and Analysis of Financial Condition and Results of Operations” in this prospectus. All written and oral forward-looking statements attributable to us, or persons acting on our behalf, are expressly qualified in their entirety by these cautionary statements as well as other cautionary statements that are made from time to time in our other SEC filings and public communications. You should evaluate all forward-looking statements made in this prospectus in the context of these risks and uncertainties.
We caution you that the important factors referenced above may not contain all of the factors that are important to you. In addition, we cannot assure you that we will realize the results or developments we expect or anticipate or, even if substantially realized, that they will result in the consequences or affect us or our operations in the way we expect. The forward-looking statements included in this prospectus are made only as of the date hereof. We undertake no obligation to update or revise any forward-looking statement as a result of new information, future events or otherwise, except as otherwise required by law.
39
Table of Contents
We estimate that, based upon the initial public offering price of $17.00 per share, we will receive net proceeds from this offering of approximately $42.5 million, after deducting underwriting discounts and commissions and estimated offering expenses payable by us. We will not receive any proceeds from the sale of shares of our common stock by the selling stockholder, including any shares sold by the selling stockholder in connection with the exercise of the underwriters’ option to purchase additional shares.
We intend to use the net proceeds of approximately $42.5 million from the sale of common stock by us in this offering to make an $8.0 million payment to terminate the Advisory Agreement entered into in connection with the Golden Gate Acquisition and to provide approximately $34.5 million to fund future capital expenditures for our business, including the construction of our new resin-coating facility described elsewhere in this prospectus. The other principal purposes for this offering are to create a public market for our common stock, facilitate our future access to the public equity markets, provide liquidity for our existing stockholder and increase our visibility in our markets. Our management will have broad discretion over the uses of the net proceeds from this offering and reserves the right to change the use of proceeds. Pending application of the net proceeds as described above, we intend to invest the net proceeds in short-term, investment-grade, interest-bearing securities.
40
Table of Contents
We currently intend to retain all available funds and any future earnings to fund the development and growth of our business and to repay indebtedness and, therefore, we do not anticipate paying any cash dividends in the foreseeable future. Additionally, because we are a holding company, our ability to pay dividends on our common stock is limited by restrictions on the ability of our subsidiaries to pay dividends or make distributions to us, including restrictions under the terms of the agreements governing our indebtedness. See “Description of Certain Indebtedness.” Any future determination to pay dividends will be at the discretion of our board of directors, subject to compliance with covenants in current and future agreements governing our indebtedness, and will depend on our results of operations, financial condition, capital requirements and other factors that our board of directors deems relevant.
In May 2010, we paid a net cash dividend to our parent LLC in the aggregate amount of $25.0 million. The dividend was paid in connection with a refinancing transaction.
41
Table of Contents
The following table sets forth our cash and cash equivalents and our capitalization as of September 30, 2011 on an actual basis and on an as adjusted basis to give effect to (1) the filing of our amended and restated certificate of incorporation at or prior to the completion of this offering and (2) this offering. You should read the following table in conjunction with “Selected Historical Combined Financial and Operating Data,” “Management’s Discussion and Analysis of Financial Condition and Results of Operations” and our unaudited condensed combined financial statements and the related notes included elsewhere in this prospectus.
| As of September 30, 2011 | ||||||||
| Actual | As Adjusted(1) | |||||||
| (unaudited) | ||||||||
| (amounts in thousands) | ||||||||
| Cash and cash equivalents(2) |
$ | 73,809 | $ | 108,331 | ||||
|
|
|
|
|
|||||
| Debt, including current portion: |
||||||||
| Short-term liabilities:(3) |
||||||||
| Asset-Based Revolving Line-of-Credit(4) |
— | — | ||||||
| Long-term liabilities: |
||||||||
| Senior Secured Credit Facility: |
||||||||
| Term Loan Facility(5) |
258,464 | 258,464 | ||||||
| Subordinated Notes: |
||||||||
| Note to parent LLC(6) |
15,000 | — | ||||||
|
|
|
|
|
|||||
| Total debt, including current portion |
$ | 273,464 | $ | 258,464 | ||||
|
|
|
|
|
|||||
| Common stock, $0.01 par value per share, 100 million shares authorized; 50 million shares issued and outstanding, on an actual basis; 500 million shares authorized, on an as adjusted basis; 52,941,176 shares issued and outstanding, on an as adjusted basis |
500 | 529 | ||||||
|
|
|
|
|
|||||
| Total stockholders’ equity |
$ | 118,452 | $ | 152,974 | ||||
|
|
|
|
|
|||||
| Total capitalization |
$ | 391,916 | $ | 411,438 | ||||
|
|
|
|
|
|||||
| (1) | A $1.00 increase or decrease in the assumed initial public offering price of $17.00 per share, the midpoint of the range set forth on the cover of this prospectus, would result in an approximately $2.9 million increase or decrease in each of cash and cash equivalents, total stockholders’ equity and total capitalization, assuming that the number of shares offered by us set forth on the cover of this prospectus remains the same, and after deducting underwriting discounts and commissions and estimated offering expenses payable by us. Each 1.0 million increase or decrease in the number of shares offered by us would increase or decrease each of cash and cash equivalents, total stockholders’ equity and total capitalization by approximately $17.0 million, assuming the initial public offering price of $17.00 per share, the midpoint of the range set forth on the cover of this prospectus, remains the same, and after deducting underwriting discounts and commissions and estimated offering expenses payable by us. The as adjusted information discussed above is illustrative only and will change based on the actual initial public offering price and other terms of this offering. |
| (2) | As of December 31, 2011, cash and cash equivalents was $59.2 million. This reduction in cash and cash equivalents is the result of a cash payment of $4.0 million in connection with our acquisition of land in Sparta, Wisconsin and additional capital and working capital investment costs as a result of our recently completed capacity expansion projects. |
| (3) | As of December 31, 2011, our outstanding debt balance, including current portion, was $276.8 million. This increase is the result of the issuance of a $4.0 million note in connection with our acquisition of land in Sparta, Wisconsin for a total purchase price of $8.0 million, net of scheduled principal repayments to our Term Loan Facility. |
| (4) | Provides for aggregate borrowings of up to $35.0 million, subject to certain borrowing base limitations, and expires on October 31, 2015. As of September 30, 2011, we had no outstanding borrowings, $9.8 million of outstanding letters of credit, $1.2 million reserved against derivative agreements and $22.5 million of borrowing availability under the ABL Facility. See “Description of Certain Indebtedness—ABL Facility.” |
| (5) | Represents the aggregate principal amount of the Term Loan Facility, which matures on June 8, 2017. See “Description of Certain Indebtedness—Term Loan Facility.” |
| (6) | On December 22, 2010, we entered into a $15.0 million promissory note with our parent LLC to provide working capital for a new subsidiary. The note matures on December 22, 2015 and bears interest at 10%. Upon effectiveness of this offering, this note will be contributed as a capital contribution by our parent LLC to us. |
42
Table of Contents
Our net tangible book value as of September 30, 2011, before giving effect to the sale by us of 2,941,176 shares of common stock offered in this offering, was approximately $25.0 million, or approximately $0.50 per share. Net tangible book value (deficit) per share represents the amount of our total tangible assets less the amount of our total liabilities, divided by the number of shares of common stock outstanding at September 30, 2011, prior to the sale by us of 2,941,176 shares of common stock offered in this offering. Dilution in net tangible book value (deficit) per share represents the difference between the amount per share paid by investors in this offering and the net tangible book value (deficit) per share of our common stock outstanding immediately after this offering.
After giving effect to the sale by us of 2,941,176 shares of common stock in this offering at an assumed initial public offering price of $17.00 per share, the midpoint of the range set forth on the front cover of this prospectus, after deducting underwriting discounts and commissions and estimated expenses payable by us in connection with this offering, our as adjusted net tangible book value as of September 30, 2011 would have been approximately $59.5 million, or $1.12 per share of common stock. This represents an immediate increase in net tangible book value of $0.62 per share to existing stockholders and immediate dilution of $15.88 per share to new investors purchasing shares of common stock in this offering at the initial public offering price. If the initial public offering price is higher or lower than $17.00 per share, the dilution to new stockholders will be higher or lower.
The following table illustrates this dilution in net tangible book value to new investors:
| Assumed initial public offering price per share |
$ | 17.00 | ||||||
| Net tangible book value per share as of September 30, 2011 |
$ | 0.50 | ||||||
| Increase in net tangible book value per share to existing stockholders attributable to this offering |
0.62 | |||||||
|
|
|
|||||||
| As adjusted net tangible book value per share as of September 30, 2011 (assuming the completion of this offering) |
1.12 | |||||||
|
|
|
|||||||
| Dilution per share to new investors in this offering |
$ | 15.88 | ||||||
|
|
|
The following table summarizes, as of September 30, 2011, the number of shares of our common stock purchased from us, the aggregate cash consideration paid to us and the average price per share paid to us by existing stockholders, which has been determined without regard to any distributions on, or accretion of liquidation value of, our common stock and to be paid by new investors purchasing shares of our common stock from us in this offering. The table is based on the initial public offering price of $17.00 per share, the midpoint of the range set forth on the front cover of this prospectus, after deducting underwriting discounts and commissions and estimated offering expenses payable by us in connection with this offering:
| Shares Purchased | Total Consideration | Average Price Per Share |
||||||||||||||||||
| Number | Percentage | Amount | Percentage | |||||||||||||||||
| Existing stockholders |
50,000,000 | 94 | % | $ | 310,386,000 | 86 | % | $ | 6.21 | |||||||||||
| New investors |
2,941,176 | 6 | 49,999,992 | 14 | 17.00 | |||||||||||||||
|
|
|
|
|
|
|
|
|
|||||||||||||
| Total |
52,941,176 | 100 | % | $ | 360,385,992 | 100 | % | 6.81 | ||||||||||||
|
|
|
|
|
|
|
|
|
|||||||||||||
The sale of 8,823,529 shares of common stock to be sold by the selling stockholder in this offering will reduce the number of shares held by existing stockholders to 41,176,471, or 78% of the total shares outstanding, and will increase the number of shares held by investors participating in this offering to 11,764,705, or 22% of the total shares outstanding. In addition, if the underwriters’ option to purchase additional shares is exercised in full, the number of shares of common stock held by existing stockholders will be further reduced to 39,411,765, or 74% of the total number of shares of common stock to be outstanding upon the completion of this offering, and the number of shares of common stock held by investors participating in this offering will be further increased to 13,529,411, or 26% of the total number of shares of common stock to be outstanding upon the completion of this offering.
43
Table of Contents
The tables and calculations above are based on 50 million shares of common stock issued and outstanding as of January 17, 2012, and exclude 1,501,398 shares of our common stock issuable upon the exercise of options, as well as 3,349,614 remaining shares of common stock reserved for issuance under the 2011 Plan, which we adopted prior to this offering.
To the extent that any outstanding options are exercised, new investors will experience further dilution.
44
Table of Contents
SELECTED HISTORICAL COMBINED FINANCIAL AND OPERATING DATA
The following table sets forth our selected historical combined financial and operating data as of the dates and for the periods indicated. We have derived the selected historical combined financial and operating data as of December 31, 2006, 2007 and 2008, for the year ended December 31, 2006 and for the periods from January 1, 2007 through August 8, 2007, from August 9, 2007 through October 17, 2007 and from October 18, 2007 through December 31, 2007 from our audited combined financial statements, which are not included in this prospectus. We have derived the selected historical combined financial and operating data for the periods from January 1, 2008 through November 24, 2008, and from November 25, 2008 through December 31, 2008, and as of and for the years ended December 31, 2009 and 2010 from our combined financial statements that are included elsewhere in this prospectus, which were audited by Grant Thornton LLP, an independent registered public accounting firm. We have derived the selected historical combined financial and operating data as of September 30, 2011 and for the nine months ended September 30, 2010 and 2011 from our unaudited condensed combined financial statements included elsewhere in this prospectus. Our unaudited condensed combined financial statements have been prepared on the same basis as our audited combined financial statements and, in our opinion, include all adjustments, consisting of normal and recurring adjustments, that we consider necessary for a fair presentation of our financial position and results of operations for such periods. Operating results for the quarter periods are not necessarily indicative of results for a full year or for any other period.
As a result of our acquisition by an affiliate of Harvest Partners, LLC in August 2007, by an affiliate of Harbinger Capital in October 2007 and the Golden Gate Capital Acquisition in November 2008, our financial data is presented on a predecessor and successor basis. We refer to USS Holdings, Inc. as it existed prior to the acquisition by Harvest Partners, LLC on August 9, 2007 as “Predecessor 3.” We refer to USS Holdings, Inc. for the period from August 9, 2007 until October 17, 2007 as “Predecessor 2.” We refer to USS Holdings, Inc. for the period from October 18, 2007 until November 24, 2008 as “Predecessor 1.” We refer to U.S. Silica Holdings, Inc. for the period from and after November 25, 2008 as the “Successor.”
The Predecessor 3 period combined financial data reflects the accounting basis in our assets and liabilities existing prior to August 9, 2007. The Predecessor 2 period combined financial data reflects the accounting basis in our assets and liabilities resulting from our purchase by an affiliate of Harvest Partners, LLC. The Predecessor 1 period combined financial data reflects the accounting basis in our assets and liabilities resulting from our purchase by an affiliate of Harbinger Capital. The Successor period combined financial data reflects the accounting basis in our assets and liabilities resulting from our purchase by an affiliate of Golden Gate Capital.
The presentation of the years ended December 31, 2007 and December 31, 2008 includes the combined results of the Predecessor 3, Predecessor 2 and Predecessor 1 periods and the combined results of the Predecessor 1 and Successor periods, respectively. We have presented the combination of these respective periods because we believe it provides an easier to read discussion of the results of operations and provides the investor with information from which to analyze our financial results in a manner that is consistent with the way management reviews and analyzes our results of operations. In addition, the combined results provide investors with the most meaningful comparison between our results for prior and future periods. See notes 1 and 2 to the following table for a separate presentation of the results for the Predecessor 3, Predecessor 2, Predecessor 1 and Successor periods in accordance with GAAP. See also our historical combined financial statements and the related notes for the year ended December 31, 2008 included elsewhere in this prospectus for a separate presentation of the results for the Predecessor 1 and Successor periods in accordance with GAAP.
45
Table of Contents
The selected historical combined data presented below should be read in conjunction with “Risk Factors,” “Management’s Discussion and Analysis of Financial Condition and Results of Operations” and our combined financial statements and the related notes and other financial data included elsewhere in this prospectus.
| Predecessor 3 | Predecessor 3/ Predecessor 2/ Predecessor 1 Combined (Non- GAAP)(1) |
Predecessor
1/ Successor Combined (Non- GAAP)(2) |
Successor | |||||||||||||||||||||||||||
| Year Ended December 31, | Nine Months Ended September 30, |
|||||||||||||||||||||||||||||
| 2006 | 2007 | 2008 | 2009 | 2010 | 2010 | 2011 | ||||||||||||||||||||||||
| (amounts in thousands, excluding per ton figures) | ||||||||||||||||||||||||||||||
| Statement of Operations Data: |
||||||||||||||||||||||||||||||
| Sales |
$ | 209,967 | $ | 217,776 | $ | 233,583 | $ | 191,623 | $ | 244,953 | $ | 185,482 | $ | 211,965 | ||||||||||||||||
| Operating income |
34,344 | 13,568 | 26,573 | 25,614 | 45,991 | 36,847 | 47,755 | |||||||||||||||||||||||
| Income before income taxes |
12,370 | (11,496 | ) | 24,061 | 2,280 | 13,721 | 9,798 | 27,741 | ||||||||||||||||||||||
| Net income |
38,674 | (7,469 | ) | 17,277 | 5,539 | 11,392 | 7,620 | 20,208 | ||||||||||||||||||||||
| Statement of Cash Flows Data: |
||||||||||||||||||||||||||||||
| Net cash provided by (used in): |
||||||||||||||||||||||||||||||
| Operating activities |
$ | 21,697 | $ | (5,792 | ) | $ | 38,256 | $ | 13,863 | $ | 36,738 | 24,399 | 22,395 | |||||||||||||||||
| Investing activities |
(12,194 | ) | (184,262 | ) | (332,206 | ) | (13,308 | ) | (15,163 | ) | (10,279 | ) | (28,692 | ) | ||||||||||||||||
| Financing activities |
(3,469 | ) | 185,410 | 303,719 | (288 | ) | 28,451 | 26,593 | 15,606 | |||||||||||||||||||||
| Other Financial Data: |
||||||||||||||||||||||||||||||
| Capital expenditures |
$ | (13,710 | ) | $ | (10,325 | ) | $ | (10,042 | ) | $ | (13,350 | ) | $ | (15,241 | ) | (10,355 | ) | (28,753 | ) | |||||||||||
| Operating Data: |
||||||||||||||||||||||||||||||
| Total tons sold |
6,777 | 6,623 | 6,389 | 5,089 | 5,965 | 4,508 | 4,688 | |||||||||||||||||||||||
| Average realized price |
$ | 30.98 | $ | 32.88 | $ | 36.56 | $ | 37.65 | $ | 41.07 | $ | 41.15 | $ | 45.22 | ||||||||||||||||
| Production costs (per ton)(3) |
23.20 | 25.10 | 26.33 | 26.76 | 26.49 | $ | 26,36 | $ | 27.99 | |||||||||||||||||||||
| Oil & Gas Proppants: |
||||||||||||||||||||||||||||||
| Sales |
$ | 10,690 | $ | 18,019 | $ | 37,875 | $ | 35,836 | $ | 69,556 | $ | 51,185 | $ | 69,322 | ||||||||||||||||
| Segment contribution margin(4) |
23,557 | 23,515 | 43,118 | $ | 31,896 | $ | 43,828 | |||||||||||||||||||||||
| Industrial & Specialty Products: |
||||||||||||||||||||||||||||||
| Sales |
$ | 199,277 | $ | 199,757 | $ | 195,708 | $ | 155,787 | $ | 175,397 | $ | 134,297 | $ | 142,643 | ||||||||||||||||
| Segment contribution margin(4) |
41,688 | 37,419 | 46,031 | $ | 37,018 | $ | 38,495 | |||||||||||||||||||||||
| Balance Sheet Data: |
||||||||||||||||||||||||||||||
| Cash and cash equivalents |
$ | 9,082 | $ | 4,438 | $ | 14,207 | $ | 14,474 | $ | 64,500 | $ | 55,187 | $ | 73,809 | ||||||||||||||||
| Total assets |
193,902 | 383,782 | 471,190 | 463,967 | 508,534 | 504,198 | 543,504 | |||||||||||||||||||||||
| Total long-term debt (including current portion) |
130,449 | 111 | 177,018 | 179,107 | 238,442 | 238,819 | 258,464 | |||||||||||||||||||||||
| Total liabilities |
296,597 | 91,680 | 349,527 | 336,937 | 410,970 | 393,791 | 425,052 | |||||||||||||||||||||||
| Total stockholders’ equity |
(102,695 | ) | 292,102 | 121,663 | 127,030 | 97,564 | 110,407 | 118,452 | ||||||||||||||||||||||
| (1) | Our acquisition by an affiliate of Harvest Partners, LLC in August 2007 and by an affiliate of Harbinger Capital in October 2007 established a new basis of accounting that primarily affected inventory, intangible assets, goodwill, taxes, debt and equity. The combined data is not presented in accordance with GAAP and Article 11 of Regulation S-X. Except for purchase accounting adjustments primarily relating to depreciation, depletion and amortization, the results for the three combined periods are comparable. Therefore, we believe that combining the three periods into a single period for comparative purposes gives the most meaningful presentation for the users of this financial information. |
46
Table of Contents
| Period from January 1, 2007 to August 8, 2007 (Predecessor 3) |
Period from August 9, 2007 to October 17, 2007 (Predecessor 2) |
Period from October 18, 2007 to December 31, 2007 (Predecessor 1) |
||||||||||
| (amounts in thousands, excluding per ton figures) | ||||||||||||
| Statement of Operations Data: |
||||||||||||
| Sales |
$ | 132,085 | $ | 43,981 | $ | 41,710 | ||||||
| Operating income (loss) |
14,538 | (4,269 | ) | 3,299 | ||||||||
| Income (loss) before income taxes |
(3,235 | ) | (11,995 | ) | 3,734 | |||||||
| Net income (loss) |
(2,751 | ) | (7,976 | ) | 3,258 | |||||||
| Statement of Cash Flows Data: |
||||||||||||
| Net cash provided by (used in): |
||||||||||||
| Operating activities |
$ | 9,820 | $ | (7,630 | ) | $ | (7,982 | ) | ||||
| Investing activities |
58 | (117,583 | ) | (66,737 | ) | |||||||
| Financing activities |
(8,638 | ) | 123,654 | 70,394 | ||||||||
| Other Financial Data: |
||||||||||||
| Capital expenditures |
$ | (6,977 | ) | $ | (1,338 | ) | $ | (2,010 | ) | |||
| Operating Data: |
||||||||||||
| Total tons sold |
4,123 | 1,287 | 1,213 | |||||||||
| Average realized price (per ton) |
$ | 32.04 | $ | 34.17 | $ | 34.39 | ||||||
| Production costs (per ton) |
23.91 | 27.16 | 26.97 | |||||||||
| Oil & Gas Proppants: |
||||||||||||
| Sales |
$ | 10,053 | $ | 3,730 | $ | 4,236 | ||||||
| Industrial & Specialty Products: |
||||||||||||
| Sales |
$ | 122,032 | $ | 40,251 | $ | 37,474 | ||||||
| Balance Sheet Data: |
||||||||||||
| Cash and cash equivalents |
$ | 9,057 | $ | 608 | $ | 4,438 | ||||||
| Total assets |
337,067 | 383,039 | 383,782 | |||||||||
| Total long-term debt (including current portion) |
196,803 | 112 | 111 | |||||||||
| Total liabilities |
293,243 | 93,866 | 91,680 | |||||||||
| Total stockholders’ equity |
43,824 | 289,172 | 292,102 | |||||||||
| (2) | The Golden Gate Capital Acquisition established a new basis of accounting that primarily affected inventory, intangible assets, goodwill, taxes, debt and equity. The combined data is not presented in accordance with GAAP and Article 11 of Regulation S-X. Except for purchase accounting adjustments primarily relating to depreciation, depletion and amortization, the results for the two combined periods are comparable. Therefore, we believe that combining the two periods into a single period for comparative purposes gives the most clarity for the users of this financial information. See our historical combined financial statements and the related notes for the year ended December 31, 2008 included elsewhere in this prospectus for a separate presentation of the results for the Predecessor 1 and Successor periods in accordance with GAAP. |
47
Table of Contents
| Period from January 1, 2008 to November 24, 2008 (Predecessor 1) |
Period
from November 25, 2008 to December 31, 2008 (Successor) |
|||||||
| (amounts in thousands, excluding per ton figures) |
||||||||
| Statement of Operations Data: |
||||||||
| Sales |
$ | 216,386 | $ | 17,197 | ||||
| Operating income (loss) |
26,906 | (333 | ) | |||||
| Income (loss) before income taxes |
27,592 | (3,531 | ) | |||||
| Net income (loss) |
19,135 | (1,858 | ) | |||||
| Statement of Cash Flows Data: |
||||||||
| Net cash provided by (used in): |
||||||||
| Operating activities |
$ | 27,913 | $ | 10,343 | ||||
| Investing activities |
(7,043 | ) | (325,163 | ) | ||||
| Financing activities |
(18,803 | ) | 322,522 | |||||
| Other Financial Data: |
||||||||
| Capital expenditures |
$ | (7,818 | ) | $ | (2,224 | ) | ||
| Operating Data: |
||||||||
| Total tons sold |
5,896 | 493 | ||||||
| Average realized price (per ton) |
$ | 36.70 | $ | 34.88 | ||||
| Production costs (per ton) |
$ | 26.22 | $ | 27.60 | ||||
| Oil & Gas Proppants: |
||||||||
| Sales |
$ | 34,684 | $ | 3,191 | ||||
| Segment contribution margin |
21,649 | 1,908 | ||||||
| Industrial & Specialty Products: |
||||||||
| Sales |
$ | 181,702 | $ | 14,006 | ||||
| Segment contribution margin |
41,666 | 22 | ||||||
| Balance Sheet Data: |
||||||||
| Cash and cash equivalents |
$ | 14,440 | $ | 14,207 | ||||
| Total assets |
476,135 | 471,190 | ||||||
| Total long-term debt (including current portion) |
176,615 | 177,018 | ||||||
| Total liabilities |
354,935 | 349,527 | ||||||
| Total stockholders’ equity |
121,200 | 121,663 | ||||||
| (3) | Production costs (per ton) equal cost of goods sold divided by total tons sold. |
| (4) | In the second quarter of 2011, we changed our segment reporting structure to two segments, Oil & Gas Proppants and Industrial & Specialty Products, and recast the historical financial statements included in the prospectus as required by GAAP. Segment contribution margin was not reported for 2006 and 2007. |
48
Table of Contents
MANAGEMENT’S DISCUSSION AND ANALYSIS OF
FINANCIAL CONDITION AND RESULTS OF OPERATIONS
The following discussion and analysis summarizes the significant factors affecting the consolidated operating results, financial condition, liquidity and cash flows of our company as of and for the periods presented below. The following discussion and analysis should be read in conjunction with our combined financial statements and the related notes included elsewhere in this prospectus. This discussion contains forward-looking statements that are based on the beliefs of our management, as well as assumptions made by, and information currently available to, our management. Actual results could differ materially from those discussed in or implied by forward-looking statements as a result of various factors, including those discussed below and elsewhere in this prospectus, particularly in the section entitled “Risk Factors.”
Overview
We are the second largest domestic producer of commercial silica, a specialized mineral that is a critical input into a variety of attractive end markets. During our 111-year history, we have developed core competencies in mining, processing, logistics and materials science that enable us to produce and cost-effectively deliver products to customers across these markets. In our largest end market, oil and gas proppants, our frac sand is used to stimulate and maintain the flow of hydrocarbons in horizontally drilled oil and natural gas wells. This segment of our business is experiencing rapid growth due to recent technological advances in the hydraulic fracturing process, which have made the extraction of large volumes of oil and natural gas from U.S. shale formations economically feasible. Our silica is also used as an economically irreplaceable raw material in a wide range of industrial applications, including glassmaking and chemical manufacturing. Additionally, in recent years a number of attractive new end markets have developed for our high-margin, performance silica products, including solar panels, specialty coatings, wind turbines, polymer additives and geothermal energy systems.
We operate 13 facilities across the United States and control 283 million tons of reserves. We own one of the largest frac sand processing plants in the United States and control approximately 138 million tons of reserves that can be processed to meet API frac sand size specifications. Our operations are organized into two segments based on end markets served: (1) Oil & Gas Proppants and (2) Industrial & Specialty Products. Our segments are complementary because our ability to sell to a wide range of customers across end markets allows us to maximize recovery rates in our mining operations, optimize our asset utilization and reduce the cyclicality of our earnings.
Recent Trends and Outlook
From 1980 to 2008, U.S. commercial silica industry volumes generally grew in line with U.S industrial production, primarily influenced by the manufacture of glass, building materials, foundry moldings and chemicals. Beginning in 2004, demand for oil and gas proppants supplemented growth in industrial and specialty products end markets. The economic downturn of 2008 and 2009 decreased demand for commercial silica products, particularly in the glassmaking, foundry, building products, chemicals and fillers and extenders end markets. With the recent economic recovery, however, we estimate overall demand for commercial silica grew in excess of 45% in 2010. Trends driving the acceleration in demand include:
| • | Increased demand in the oil and gas proppants end market. The increased demand for frac sand has been driven by the growth in the use of hydraulic fracturing as a means to extract hydrocarbons from shale formations. Based on USGS data and our internal estimates, we believe total consumption of frac sand increased from 3.8 million tons in 2004 to approximately 17.0 million tons in 2010. In addition, Freedonia projected in April 2011 that domestic proppant producers will experience annual increases in sales of 15% through 2015. We significantly expanded our sales efforts to the frac sand market in 2008 and have since experienced rapid growth in our sales associated with our oil and gas activities. |
49
Table of Contents
| • | Rebound of demand in industrial end markets and continued growth in specialty end markets. The economic downturn resulting from the financial crisis negatively impacted demand for our products in industrial and specialty products end markets, most notably in the glassmaking, building products foundry and chemicals end markets. This drop coincided with a similar drop in key economic demand drivers, including housing starts, light vehicle sales, repair and remodel activity and industrial production. To the extent these demand drivers recover to historical levels (which is difficult to predict given current economic uncertainty), we expect to see a corresponding increase in the demand for commercial silica. In addition, to the extent commercial silica products continue to be used in key alternative energy markets, we anticipate continued volume growth in specialty end markets such as solar panels and geothermal energy systems as well as the increased use of commercial silica in new applications such as specialty coatings and polymer additives. |
| • | Rapid increases in prices of commercial silica. Rapid increases in demand and constrained supply have led to rapid increases in price in the last several years. The USGS estimated in October 2010 an industry-wide average price of $23.86 per ton in 2006 relative to a $28.30 per ton price in 2009, which represents a 5.9% annual increase. For reference, our average realized price per ton was $30.98 in 2006, $37.65 in 2009 and $45.22 in the nine months ended September 30, 2011. We expect continued growth of horizontal drilling, increased innovation in specialty markets and supply tightness to exert continued upward pressure on prices in both of our operating segments. |
How We Generate Our Sales
We derive our sales by mining and processing minerals that our customers purchase for various uses. Our sales are primarily a function of the price per ton realized and the volumes sold. In some instances, our sales also include a charge for transportation services we provide to our customers. Our transportation revenue fluctuates based on a number of factors, including the volume of product we transport under contract, service agreements with our customers, the mode of transportation utilized and the distance between our plants and customers.
We primarily sell our products under short-term fixed price agreements or at prevailing market rates. For a limited number of customers, we sell under long-term, competitively-bid supply agreements. We have take-or-pay supply agreements with nine of our customers in the oil and gas proppants end market with initial terms expiring between 2012 and 2016. These agreements define, among other commitments, the volume of product that our customers must purchase, the volume of product that we must provide and the price that we will charge and that our customers will pay for each product. Prices under these agreements are generally fixed and subject to upward adjustment in response to certain cost increases. As a result, our realized prices may not grow at rates consistent with broader industry pricing. For example, during periods of rapid price growth, our realized prices may grow more slowly than those of competitors, and during periods of price decline, our realized prices may outperform industry averages. Additionally, at the time certain take-or-pay supply agreements were signed, two of these customers provided advance payments for future shipments aggregating $27.0 million ($14.8 million of these payments was recorded on the balance sheet as deferred revenue as of September 30, 2011). A percentage of these advance payments is recognized as revenue with each ton of applicable product shipped to the customer. The pricing terms of certain of these agreements are currently less than prevailing market prices. Collectively, sales to customers with long-term supply agreements in 2010 accounted for 18% of our total sales in 2010.
We invoice the majority of our clients on a per shipment basis, although for some larger customers, we consolidate invoices weekly or monthly. Standard terms are net 30 days, although extended terms are offered in competitive situations. The amounts invoiced include the amount charged for the product, transportation costs (if paid by us) and costs for additional services as applicable, such as costs related to transload the product from railcars to trucks for delivery to the customer site.
The Costs of Conducting Our Business
The principal expenses involved in conducting our business are labor costs, electricity and drying fuel costs, maintenance and repair costs for our mining and processing equipment and facilities and transportation costs. We
50
Table of Contents
believe the majority of our operating costs are relatively stable in price, but can vary significantly based on the volume of product produced. We benefit from owning the majority of the mineral deposits that we mine and having long-term mineral rights leases or supply agreements for our other primary sources of raw material, which limit royalty payments.
Operating labor costs represented our largest spend category at approximately 19% of our sales in 2010. We employ a mix of union and non-union labor, with 56% of our workforce being unionized. Our union contracts stipulate annual escalation factors for certain wages and benefits.
We incur significant electricity and drying fuel (principally natural gas) costs in connection with the operation of our processing facilities. Electricity and dryer fuel costs represented 5% and 4% of our total sales in 2010, respectively.
We capitalize the costs of our mining equipment and generally depreciate it over its expected useful life. Depreciation, depletion and amortization costs represented approximately 8% of our sales for 2010. Preventive and remedial repair and maintenance costs that do not involve the replacement of major components of our equipment and facilities are expensed as incurred. These repair and maintenance costs can be significant due to the abrasive nature of our products and represented approximately 7% of our sales in 2010.
We also provide a range of transportation services to our customers, including management of truck, rail, ship and barge shipments of our products. Total transportation costs represented approximately 13% of sales in 2010.
Additionally, we incur expenses related to our corporate operations, including costs for the sales and marketing; research and development; finance; legal; and environmental, health and safety functions of our organization. These costs are principally driven by personnel expenses. In total, our selling, general and administrative costs represented approximately 9% of sales in 2010. We anticipate that as a public company we will incur additional legal, accounting, insurance and other expenses that we have not incurred as a private company, including costs associated with public company reporting requirements. These requirements include compliance with the Sarbanes-Oxley Act as well as other rules implemented by the SEC, and applicable stock exchange rules. We expect these rules and regulations to substantially increase our legal and financial compliance costs and to make certain financial reporting and other activities more time-consuming and costly.
Our effective federal income tax rate for 2010 was approximately 17% of pretax earnings. This rate was lower than the statutory effective rate primarily due to the benefit received from statutory percentage depletion allowances.
How We Evaluate Our Business
Our management uses a variety of financial and operational metrics to analyze our performance. Our business is organized into two segments, Oil & Gas Proppants and Industrial & Specialty Products. We evaluate the performance of these segments based on their volumes sold, average realized price and contribution margin earned. Additionally, we consider a number of factors in evaluating the performance of the business as a whole, including total volumes sold, average realized price and Adjusted EBITDA. We view these metrics as important factors in evaluating our profitability and review these measurements frequently to analyze trends and make decisions.
Segment Contribution Margin
Segment contribution margin is a key metric that management uses to evaluate our operating performance and to determine resource allocation between segments. Segment contribution margin excludes certain corporate costs not associated with the operations of the segment. These unallocated costs include costs related to corporate functional areas such as sales, production and engineering, corporate purchasing, accounting, treasury, information technology, legal and human resources.
51
Table of Contents
For more detail on the reconciliation of segment contribution margin to its most directly comparable GAAP financial measure, income (loss) before income taxes, see note R to our audited combined financial statements and note I to our unaudited condensed combined financial statements included in this prospectus.
Adjusted EBITDA
Adjusted EBITDA is included in this prospectus because it is a key metric used by management to assess our operating performance and by our lenders to evaluate our covenant compliance. Our target performance goals under our incentive compensation plan are tied, in part to our Adjusted EBITDA. See “Executive Compensation—Compensation Discussion and Analysis—Elements of Compensation—Equity and Cash Incentives—Summary of Our New Plan.” In addition, the ABL Facility contains a fixed charge coverage ratio covenant that we must meet if our excess availability (as defined in the ABL Facility) falls below $10.0 million, and Term Loan Facility contains a consolidated leverage ratio covenant that we must meet at the end of each fiscal quarter, both of which are calculated based on our Adjusted EBITDA. Noncompliance with the financial ratio covenants contained in the ABL Facility and the Term Loan Facility could result in the acceleration of our obligations to repay all amounts outstanding under those agreements. Moreover, the ABL Facility and the Term Loan Facility contain covenants that restrict, subject to certain exceptions, our ability to make permitted acquisitions, incur additional indebtedness, make restricted payments (including dividends) and retain excess cash flow based, in some cases, on our ability to meet leverage ratios calculated based on our Adjusted EBITDA. See “Description of Certain Indebtedness.”
Adjusted EBITDA is not a measure of our financial performance or liquidity under GAAP and should not be considered as an alternative to net income as a measure of operating performance, cash flows from operating activities as a measure of liquidity or any other performance measure derived in accordance with GAAP. Additionally, Adjusted EBITDA is not intended to be a measure of free cash flow for management’s discretionary use, as it does not consider certain cash requirements such as interest payments, tax payments and debt service requirements. Adjusted EBITDA contains certain other limitations, including the failure to reflect our cash expenditures, cash requirements for working capital needs and cash costs to replace assets being depreciated and amortized, and excludes certain non-recurring charges that may recur in the future. Management compensates for these limitations by relying primarily on our GAAP results and by using Adjusted EBITDA only supplementally. Our measure of Adjusted EBITDA is not necessarily comparable to other similarly titled captions of other companies due to potential inconsistencies in the methods of calculation.
Basis of Presentation and Results of Operations
We were acquired by Golden Gate Capital through a merger completed on November 25, 2008. The Golden Gate Capital Acquisition was financed by the ABL Facility, the Term Loan Facility, our mezzanine loan facility (the “Mezzanine Loan Facility”) and $27.0 million in advances from customers. We refer to the results of Predecessor 1’s operations for the period from January 1, 2008 to November 24, 2008 as the 2008 Predecessor Period and to our operating results for the period from November 25, 2008 to December 31, 2008 as the 2008 Successor Period.
Due to the Golden Gate Capital Acquisition, the historical financial statements for all successor periods included in this prospectus are not comparable to either the financial statements of the 2008 Predecessor Period included in this prospectus or our results of operations following this offering. In particular, our financial statements for the year ended December 31, 2008 include one-time charges totaling $5.1 million, including expenses related to the change in our ownership and efforts by our previous owner to monetize its investment. These expenses include a non-cash cost of goods sold charge resulting from the revaluing of inventory to fair market value, transaction fees, legal fees, management incentive payments and other related expenses included in selling, general and administrative expenses. Furthermore, the financial data for the 2008 Predecessor Period represents a period of time prior to Golden Gate Capital’s ownership. As such, the results for these periods do not necessarily represent the results of operations that would have been achieved during the period had Golden Gate Capital owned our operations.
52
Table of Contents
The following table and discussion sets forth our combined statement of operations data and the historical combined financial data of our predecessor for the periods presented. The results of operations by segment are discussed in further detail following this combined overview.
| Predecessor | Successor | |||||||||||||||||||||||||
| Period from January 1 to November 24, 2008 |
Period from November 25 to December 31, 2008 |
Year Ended December 31, 2009 |
Year Ended December 31, 2010 |
Nine Months Ended September 30, 2010 |
Nine Months Ended September 30, 2011 |
|||||||||||||||||||||
| (amounts in thousands, excluding per ton figures) | ||||||||||||||||||||||||||
| Statement of Operations Data: |
||||||||||||||||||||||||||
| Sales (1) |
$ | 216,386 | $ | 17,197 | $ | 191,623 | $ | 244,953 | $ | 185,482 | $ | 211,965 | ||||||||||||||
| Cost of goods sold (1) |
154,616 | 13,605 | 136,200 | 157,994 | 119,001 | 131,145 | ||||||||||||||||||||
| Selling, general and administrative |
19,600 | 2,122 | 11,922 | 21,663 | 15,369 | 17,429 | ||||||||||||||||||||
| Depreciation, depletion and amortization |
15,264 | 1,803 | 17,887 | 19,305 | 14,265 | 15,636 | ||||||||||||||||||||
|
|
|
|
|
|
|
|
|
|
|
|
|
|||||||||||||||
| Operating income |
26,906 | (333 | ) | 25,614 | 45,991 | 36,847 | 47,755 | |||||||||||||||||||
| Interest expense |
640 | 3,343 | 28,228 | 23,034 | 17,708 | 14,505 | ||||||||||||||||||||
| Early extinguishment of debt |
— | — | — | 10,195 | 10,195 | 6,043 | ||||||||||||||||||||
| Other income, net, including interest income |
(1,326 | ) | (145 | ) | (4,894 | ) | (959 | ) | (854 | ) | (534 | ) | ||||||||||||||
|
|
|
|
|
|
|
|
|
|
|
|
|
|||||||||||||||
| Income before income taxes |
27,592 | (3,531 | ) | 2,280 | 13,721 | 9,798 | 27,741 | |||||||||||||||||||
| Provision/(benefit) for income taxes |
8,457 | (1,673 | ) | (3,259 | ) | 2,329 | 2,178 | 7,533 | ||||||||||||||||||
|
|
|
|
|
|
|
|
|
|
|
|
|
|||||||||||||||
| Net Income |
$ | 19,135 | $ | (1,858 | ) | $ | 5,539 | $ | 11,392 | $ | 7,620 | $ | 20,208 | |||||||||||||
|
|
|
|
|
|
|
|
|
|
|
|
|
|||||||||||||||
| Other Financial Data: |
||||||||||||||||||||||||||
| Adjusted EBITDA (2) |
$ | 49,746 | $ | (186 | ) | $ | 50,013 | $ | 72,152 | $ | 56,124 | $ | 66,354 | |||||||||||||
| Operating data: |
||||||||||||||||||||||||||
| Oil & Gas Proppants: |
||||||||||||||||||||||||||
| Tons sold |
879 | 75 | 787 | 1,522 | 1,084 | 1,428 | ||||||||||||||||||||
| Average realized price (per ton) |
$ | 39.46 | $ | 42.55 | $ | 45.53 | $ | 45.70 | $ | 47.22 | $ | 48.55 | ||||||||||||||
| Sales |
$ | 34,684 | $ | 3,191 | $ | 35,836 | $ | 69,556 | $ | 51,185 | $ | 69,322 | ||||||||||||||
| Segment contribution margin |
$ | 21,649 | $ | 1,908 | $ | 23,515 | $ | 43,118 | $ | 31,896 | $ | 43,828 | ||||||||||||||
| Industrial & Specialty Products: |
||||||||||||||||||||||||||
| Tons sold |
5,017 | 418 | 4,302 | 4,443 | 3,424 | 3,260 | ||||||||||||||||||||
| Average realized price (per ton) |
$ | 36.22 | $ | 33.51 | $ | 36.21 | $ | 39.48 | $ | 39.22 | $ | 43.76 | ||||||||||||||
| Sales |
$ | 181,702 | $ | 14,006 | $ | 155,787 | $ | 175,397 | $ | 134,297 | $ | 142,643 | ||||||||||||||
| Segment contribution margin |
$ | 41,666 | $ | 22 | $ | 37,419 | $ | 46,031 | $ | 37,018 | $ | 38,495 | ||||||||||||||
| (1) | Sales includes the revenues from transportation services provided to our customers. Transportation expense is our cost to deliver our products to our customers and is included in cost of goods sold in our combined financial statements. Cost of goods sold does not include depreciation, depletion or amortization. |
| (2) | For a definition of Adjusted EBITDA and a reconciliation to its most directly comparable financial measure calculated and presented in accordance with GAAP, see note 2 to “Summary—Summary Historical Combined Financial and Operating Data.” |
53
Table of Contents
Nine Months Ended September 30, 2011 Compared with Nine Months Ended September 30, 2010
Sales
Sales increased $26.5 million, or 14%, to $212.0 million for the nine months ended September 30, 2011 compared to $185.5 million for the nine months ended September 30, 2010. Of this increase, $18.1 million, or 68%, was attributable to growth in the Oil & Gas Proppants segment. Growth in the Industrial & Specialty Products segment accounted for the remaining growth, or an $8.4 million increase. Overall, average realized price increased 10% and volumes increased 4% from the comparable prior period, respectively.
Oil & Gas Proppants sales increased $18.1 million, or 35%, to $69.3 million for the nine months ended September 30, 2011 compared to $51.2 million for the nine months ended September 30, 2010. Robust drilling activity in the oil and natural gas industry led to a 31% increase in volume. A 3% increase in average realized price per ton also contributed to the overall sales growth as demand for frac sand continued to exceed supply for many products, specifically coarser grade frac sand which commands higher prices in the market. This imbalance between supply and demand is the main driver of favorable pricing trends in the oil and natural gas industry. Growth in average realized prices was partially offset due primarily to lower delivery charges, principally a result of varying volumes and terms related to service arrangements with some of our customers during the nine months ended September 30, 2011. Delivery charges can vary significantly from period to period based on certain factors, such as the amount of sales in the period that were completed under service agreements, the distance of any required shipping under such agreements, the amount of sales that were sold free on board to our customers versus shipped to transload facilities and the amount of any surcharges charged by the transload operators, among other factors.
Industrial & Specialty Products sales increased $8.3 million, or 6%, to $142.6 million for the nine months ended September 30, 2011 compared to $134.3 million for the nine months ended September 30, 2010. An increase in pricing in most end markets driven by increasing demand, an increase in transportation revenue and a favorable shift in product mix to higher price products, especially our ground and finely ground silica, which is generally used in end markets such as fillers and extenders and fiberglass, drove a 12% increase in average realized price. This was partially offset by a 5% decline in volume, which resulted from our efforts to reallocate certain grades of production from this segment to the Oil & Gas Proppants Segment.
Segment Contribution Margin
Oil & Gas Proppants contribution margin increased $11.9 million, or 37%, to $43.8 million for the nine months ended September 30, 2011 compared to $31.9 million for the nine months ended September 30, 2010 due to the factors noted above.
Industrial & Specialty Products contribution margin increased $1.5 million, or 4%, to $38.5 million for the nine months ended September 30, 2011 compared to $37.0 million for the nine months ended September 30, 2010 due to the factors noted above.
For more detail on the reconciliation of segment contribution margin to its most directly comparable GAAP financial measure, income (loss) before income taxes, see note I to our unaudited condensed combined financial statements included elsewhere in this prospectus.
Selling, General and Administrative Expenses
Selling, general and administrative expenses increased $2.0 million, or 13%, to $17.4 million for the nine months ended September 30, 2011 compared to $15.4 million for the nine months ended September 30, 2010, primarily due to higher compensation expense including severance costs of $0.5 million and a $0.4 million increase in equity-based compensation. Selling, general and administrative expenses also increased as a result of an expansion of our commercial team to serve the oil and gas proppants end market, including $1.0 million related to activity in the new resin-coated sand business. As a percentage of sales, selling, general and administrative expenses were approximately in line with the prior year.
54
Table of Contents
Depreciation, Depletion and Amortization
Depreciation, depletion and amortization increased $1.3 million, or 9%, to $15.6 million for the nine months ended September 30, 2011 compared to $14.3 million for the nine months ended September 30, 2010, principally due to capital spending placed in service since the comparable quarter.
Operating Income
Operating income increased $11.0 million, or 30%, to $47.8 million for the nine months ended September 30, 2011 compared to $36.8 million for the nine months ended September 30, 2010 as a result of increased sales in both segments.
Interest Expense
Interest expense decreased $3.2 million, or 18%, to $14.5 million for the nine months ended September 30, 2011 compared to $17.7 million for the nine months ended September 30, 2010 due to a refinancing of the Term Loan Facility and Mezzanine Loan Facility in the second quarter of 2010. While the overall amount of debt outstanding increased, the refinancing resulted in a substantially lower average effective interest rate on our debt, reducing overall interest expense.
Provision for Income Taxes
Provision for income taxes increased $5.4 million, or 245%, to $7.6 million for the nine months ended September 30, 2011 compared to $2.2 million for the nine months ended September 30, 2010. The increase resulted mainly from higher pre-tax earnings, offset by a lower estimated tax rate for the nine months ended September 30, 2011.
Net Income/Loss
Net income increased $12.6 million to $20.2 million for the nine months ended September 30, 2011 compared to $7.6 million for the nine months ended September 30, 2010 due to the factors noted above.
Year Ended December 31, 2010 Compared with Year Ended December 31, 2009
Sales
Sales increased $53.3 million, or 28%, to $245.0 million for the year ended December 31, 2010 compared to $191.6 million for the year ended December 31, 2009. Oil & Gas Proppants sales increased by $33.8 million, accounting for 63% of the total growth. Industrial & Specialty Products sales increased $19.6 million, representing 37% of the growth in overall sales. Overall, average realized price increased 9% and volumes increased 17% from the comparable prior period, respectively.
Oil & Gas Proppant sales increased $33.8 million, or 94%, to $69.6 million for the year ended December 31, 2010 compared to $35.8 million for the year ended December 31, 2009. The increase was primarily driven by a 93% increase in volumes. We initiated an effort to reallocate certain production from industrial end markets to the oil and gas proppants end market in response to increased hydraulic fracturing activity. Average realized price remained relatively constant as increased transportation revenues were offset by unfavorable product mix.
Industrial & Specialty Products sales increased $19.6 million, or 13%, to $175.4 million for the year ended December 31, 2010 compared to $155.8 million for the year ended December 31, 2009. An increase in pricing in most end markets, as well as a favorable shift in product mix to higher price markets such as the fiberglass, foundry and fillers and extenders end markets, which serve the automotive and construction industries, drove a 9% increase in average realized price. Volumes increased by 3%, as our reallocation of some production away from certain industrial and specialty products end markets to the oil and gas proppants end market was more than offset by growth in many other industrial and specialty products end markets as the result of the economic recovery.
55
Table of Contents
Segment Contribution Margin
Oil & Gas Proppants contribution margin increased $19.6 million, or 83%, to $43.1 million for the year ended December 31, 2010 compared to $23.5 million for the year ended December 31, 2009 due to the factors noted above.
Industrial & Specialty Products contribution margin increased $8.6 million, or 23%, to $46.0 million for the year ended December 31, 2010 compared to $37.4 million for the year ended December 31, 2009 due to the factors noted above.
For more detail on the reconciliation of segment contribution margin to its most directly comparable GAAP financial measure, income (loss) before income taxes, see note R to our audited combined financial statements included elsewhere in this prospectus.
Selling, General and Administrative Expenses
Selling, general and administrative expenses increased $9.8 million, or 82%, to $21.7 million for the year ended December 31, 2010 compared to $11.9 million for the year ended December 31, 2009. 2009 benefitted from a $3.3 million reversal of an accrual for silicosis litigation that reduced expenses and that did not recur in 2010.
The remaining differences were a result of increased sales and marketing headcount and higher incentive compensation payouts, reflecting the significant improvement in operating performance. Excluding the impact of the reversal of the silica litigation accrual in 2009, selling, general and administrative expenses as a percentage of sales were 8%. This compares to 9% for 2010.
Depreciation, Depletion and Amortization
Depreciation, depletion and amortization increased $1.4 million, or 8%, to $19.3 million for the year ended December 31, 2010 compared to $17.9 million for the year ended December 31, 2009, due to both increased capital spending and higher depletion related to additional tons being mined.
Operating Income
Operating income earned increased $20.4 million, or 80%, to $46.0 million for the year ended December 31, 2010 compared to $25.6 million for the year ended December 31, 2009 as a result of increased sales and improved gross margins.
Interest Expense
Interest expense decreased $5.2 million, or 18%, to $23.0 million for the year ended December 31, 2010 compared to $28.2 million for the year ended December 31, 2009 due to the refinancing of the Term Loan Facility and Mezzanine Loan Facility in the second quarter of 2010. While the overall amount of debt outstanding increased, the refinancing resulted in a substantially lower average effective interest rate on our debt, reducing overall interest expense.
Early Extinguishment of Debt
On May 7, 2010, both the Term Loan Facility and the Mezzanine Loan Facility were refinanced with significantly favorable terms to prior loan agreements. As a result, expenses related to the early extinguishment of the existing debt were incurred totaling $10.2 million. These expenses included non-cash charges related to unamortized original issue discounts and debt issuance costs, payments for lender fees and a prepayment penalty on the Mezzanine Loan Facility.
56
Table of Contents
Provision for Income Taxes
The provision for income taxes decreased $5.6 million, or 170%, to $2.3 million for the year ended December 31, 2010, compared to a $3.3 million benefit for the year ended December 31, 2009. The effective tax rates were 17.2% for the year ended December 31, 2010 and (143)% for the year ended December 31, 2009. The most significant factor contributing to the 2009 tax benefit was the increase in statutory depletion deduction which, although it occurs in both years, is driven by mine site profitability rather than pre-tax earnings.
Net Income/Loss
Net income increased $5.9 million to $11.4 million for the year ended December 31, 2010 compared to net income of $5.5 million for the year ended December 31, 2009 due to the factors noted above.
Year Ended December 31, 2009 Compared with the 2008 Successor Period and the 2008 Predecessor Period
Sales
Sales were $191.6 million in the year ended December 31, 2009 compared to $17.2 million and $216.4 million in the 2008 Successor Period and the 2008 Predecessor Period, respectively. The decrease was due to decreases in sales for the two segments. Total tons sold was 5,089 in 2009 compared to 493 and 5,896 in the 2008 Successor Period and the 2008 Predecessor Period, respectively. The average realized price was $37.65 in 2009 compared to $34.88 and $36.70 in the 2008 Successor Period and the 2008 Predecessor Period, respectively.
Oil & Gas Proppant sales were $35.8 million in the year ended December 31, 2009 relative to $3.2 million and $34.7 million in the 2008 Successor Period and 2008 Predecessor Period, respectively. This decline was a function of a decrease in volumes, offset by an increase in product price. Volumes declined as part of a broader slowdown in hydraulic fracturing activity in the United States in 2009. Average realized price primarily increased as a result of a favorable shift in mix to the higher-priced coarser grades of products.
Industrial & Specialty Products sales were $155.8 million in the year ended December 31, 2009 relative to $14.0 million and $181.7 million in the 2008 Successor Period and 2008 Predecessor Period, respectively. Industrial and specialty products end markets include foundry, building products, and glass end markets, all of which were significantly impacted by the recession and, in particular, the decrease in automotive and construction activity in 2009. As a result, Industrial & Specialty Products volumes declined. This was partially offset by an increase in pricing in nearly all major end markets for this segment.
Segment Contribution Margin
Oil & Gas Proppants contribution margin was $23.5 million in the year ended December 31, 2009 relative to $1.9 million and $21.6 million in the 2008 Successor Period and 2008 Predecessor Period, respectively due to the factors noted above.
Industrial & Specialty Products contribution margin was $37.4 million in 2009 relative to $22,000 and $41.7 million in the 2008 Successor Period and 2008 Predecessor Period, respectively due to the factors noted above.
For more detail on the reconciliation of segment contribution margin to its most directly comparable GAAP financial measure, income (loss) before income taxes, see note R to our audited combined financial statements included elsewhere in this prospectus.
Selling, General and Administrative Expenses
Selling, general and administrative expenses for 2009 were $11.9 million compared to $2.1 million and $19.6 million in the 2008 Successor Period and 2008 Predecessor Period, respectively. The largest single factor
57
Table of Contents
in the decrease was a $6.1 million reduction in business development costs. These costs related to a number of strategic initiatives, including the sale of U.S. Silica, in November 2008. 2009 benefitted from a $3.3 million reversal of an accrual for silicosis litigation that reduced expenses. A similar reversal occurred in 2008, but in the amount of $0.8 million. Cost curtailment efforts in reaction to the decline in overall sales also contributed to the decrease. These efforts included a reduction in incentive compensation payments which contributed to a $1.8 million decrease in SG&A expenses.
Depreciation, Depletion and Amortization
Depreciation, depletion and amortization for 2009 was $17.9 million compared to $1.8 million and $15.3 million in the 2008 Successor Period and 2008 Predecessor Period, respectively. The increase was primarily due to an increase in asset values as a result of a fair market value appraisal related to the change in ownership that occurred in the fourth quarter of 2008.
Operating Income
Operating income incurred for 2009 was $25.6 million compared to $(0.3) million and $26.9 million in the 2008 Successor Period and 2008 Predecessor Period, respectively. The decrease was a result of the factors noted earlier.
Interest Expense
Interest expense for 2009 was $28.2 million compared to $3.3 million and $0.6 million in the 2008 Successor Period and 2008 Predecessor Period, respectively. The increase was due to the issuance of debt related to the recapitalization in the fourth quarter of 2008.
Provision for Income Taxes
The benefit for income taxes of $3.3 million in the year ended December 31, 2009 compared to a $1.7 million benefit and $8.5 million expense in the 2008 Successor Period and 2008 Predecessor Period, respectively. The effective tax rates were (143)% for 2009 and (47)% and 31% for the 2008 Successor Period and 2008 Predecessor Period, respectively. The swings in the effective tax rate are primarily due to the statutory depletion deduction which is driven by mine site profitability rather than pre-tax earnings. A reconciliation of the federal statutory rate of 35% to our effective tax rates is presented in note N to our audited combined financial statements included elsewhere in this prospectus.
Net Income/Loss
Net income for 2009 was $5.5 million compared to a $1.9 million loss in the 2008 Successor Period and net income of $19.1 million for the 2008 Predecessor Period as a result of the factors noted above.
58
Table of Contents
Liquidity and Capital Resources
Overview
Our principal liquidity requirements have historically been to service our debt, to meet our working capital, capital expenditure and mine development expenditure needs, to pay dividends to our shareholder, and to finance acquisitions. We have historically met our liquidity and capital investment needs with funds generated through operations. We have historically funded our acquisitions through borrowings under our credit facilities and equity investments. Our working capital is the amount by which current assets exceed current liabilities and is a measure of our ability to pay our liabilities as they become due. As of September 30, 2011, our working capital was $109.3 million and we had $22.5 million of availability under the ABL Facility. See “—Credit Facilities—ABL Facility.”
Following completion of this offering, we believe that cash generated through operations and our financing arrangements will be sufficient to meet working capital requirements, anticipated capital expenditures and scheduled debt payments for at least the next 12 months.
Cash Flow Analysis
A summary of operating, investing and financing activities is shown in the following table:
| Predecessor | Successor | |||||||||||||||||||||||||
| Period from January 1 to November 24, 2008 |
Period from November 25 to December 31, 2008 |
Year Ended December 31, 2009 |
Year Ended December 31, 2010 |
Nine Months Ended September 30, 2010 |
Nine Months Ended September 30, 2011 |
|||||||||||||||||||||
| (amounts in thousands) | ||||||||||||||||||||||||||
| Net cash provided by |
||||||||||||||||||||||||||
| Operating activities |
$ | 27,913 | $ | 10,343 | $ | 13,863 | $ | 36,738 | $ | 24,399 | $ | 22,395 | ||||||||||||||
| Investing activities |
(7,043 | ) | (325,163 | ) | (13,308 | ) | (15,163 | ) | (10,279 | ) | (28,692 | ) | ||||||||||||||
| Financing activities |
(18,803 | ) | 322,522 | (288 | ) | 28,451 | 26,593 | 15,606 | ||||||||||||||||||
Net Cash Provided by (Used in) Operating Activities
Operating activities consist primarily of net income adjusted for non-cash items, including depreciation and amortization and the effect of working capital changes.
Net cash provided by operating activities was $22.4 million for the nine months ended September 30, 2011 compared to $24.4 million in the nine months ended September 30, 2010. This $2.0 million decrease was primarily the result of a $12.3 million improvement in earnings before income taxes, offset by a $5.7 million increase in contributions to our employee pension plan, the collection of a $4.4 million insurance settlement in 2010 that did not occur in 2011, as well as non-cash adjustments related to the early extinguishment of debt in 2011 and 2010. Based on current actuarial assumptions, we expect to make additional future cash payments toward reducing the unfunded liability of our employee pension plan. See “—Contractual Obligations.”
Net cash provided by operating activities was $36.7 million in 2010 compared to $13.9 million in 2009. The $22.8 million increase in cash provided by operating activities was due primarily to a $20.4 million increase in operating income in 2010.
Net cash provided by operating activities was $13.9 million in 2009 compared to $10.3 million and $27.9 million for the 2008 Successor Period and 2008 Predecessor Period, respectively. The decrease in cash provided
59
Table of Contents
by operating activities was primarily the result of a decrease in net income. Lower net income was largely driven by an increase in interest expense related to the recapitalization of U.S. Silica in November 2008.
Net Cash Used in Investing Activities
Investing activities consist primarily of capital expenditures for growth and maintenance.
Net cash used in investing activities was $28.7 million in the nine months ended September 30, 2011. This use of cash is due to capital expenditures of $28.8 million to expand our production capacity at two of our facilities.
Net cash used in investing activities was $15.2 million in 2010. This use of cash is primarily due to customary maintenance capital spending, as well as $3.0 million in reserves acquisition costs and $3.8 million to expand production capacity at one of our facilities.
Net cash used in investing activities was $13.3 million in 2009. This use of cash is primarily due to capital spending, including $9.9 million to expand production capacity at two of our facilities.
Net cash used in investing activities was $325.2 million and $7.0 million in the 2008 Successor Period and 2008 Predecessor Period, respectively. This use of cash is primarily due to the acquisition of U.S. Silica in the amount of $322.9 million. The remainder relates to process improvements and replacement of existing equipment at a number of our facilities. The Ottawa facility also incurred expenditures for reserve expansion.
Management anticipates that our capital expenditures in 2011 will be approximately $62.8 million, which is primarily associated with the Ottawa and Rockwood capacity expansions discussed above. We anticipate limited additional spending will be required to complete these projects as both became operational during the fourth quarter of 2011. Capital expenditures in 2012 are expected to be approximately $79 million, of which approximately $14 million will be for maintenance, approximately half will be for our new resin-coating facility that we are currently constructing and the remainder will be for other growth initiatives. Management believes that, including the net proceeds of this offering, there will be sufficient cash on hand to fund the currently anticipated capital projects, but we are continuing to evaluate additional potential growth opportunities.
Net Cash Used in Financing Activities
Financing activities consisted primarily of borrowings and repayments related to the ABL Facility, the Term Loan Facility and the Mezzanine Loan Facility, as well as dividends to our parent LLC, fees and expenses paid in connection with our credit facilities and outstanding checks from our customers.
Net cash provided by financing activities was $15.6 million in the nine months ended September 30, 2011. During the period, net outstanding debt increased $19.2 million and included an increase in the Term Loan Facility of $95.6 million with $75.0 million of those proceeds used to repay the entire amount outstanding on the Mezzanine Loan Facility. We incurred financing fees of $4.0 million and a prepayment penalty of $1.5 million in connection with this refinancing.
Net cash provided by financing activities in 2010 was $28.5 million, which included a $64.7 million increase in the size of the Term Loan Facility, a $6.5 million decrease in the size of the Mezzanine Loan Facility, the issuance of a $15.0 million note to our parent LLC, an $11.8 million capital contribution from our parent and a $51.6 million dividend paid to our parent LLC. In addition, we paid $3.9 million in financing fees and prepayment penalties related to the debt refinancing.
Net cash used in financing activities in 2009 was $0.3 million, which resulted from a $3.3 million increase in our Mezzanine Loan Facility, which is partially offset by $2.0 million in amortization of the term loan.
Net cash provided by financing activities of $322.5 million in the 2008 Successor Period related to a recapitalization of our business. Net cash used in financing activities in the 2008 Predecessor Period was $18.8 million, which included a $20.2 million dividend paid.
60
Table of Contents
Credit Facilities
ABL Facility
On August 9, 2007, we entered into the ABL Facility with various banks and other financial institutions as lenders thereunder and Wells Fargo Bank, National Association (successor by merger to Wachovia Bank, National Association) (“Wells Fargo”), as administrative agent and lender. The ABL Facility provides for borrowings in the aggregate amount of up to $35.0 million, with a letter of credit facility sublimit of $15.0 million; provided, however, that the aggregate principal amount of the loans and letter of credit obligations outstanding at any one time shall not exceed the applicable borrowing base.
Borrowing availability under the ABL Facility is determined by a formula that considers eligible accounts receivable and inventory less any outstanding letters of credit plus a reserve for derivatives. As of September 30, 2011, our available borrowing base was $33.5 million. We had no borrowings outstanding as of September 30, 2011, $9.8 million of outstanding letters of credit and $1.2 million reserved against derivative agreements, which left $22.5 million available under the ABL Facility.
Borrowings under the ABL Facility are subject to the accuracy of representations and warranties in all material respects and the absence of any defaults under the ABL Facility and the Term Loan Facility.
The ABL Facility contains customary covenants and restrictions on our activities related to, among other things: the incurrence of additional indebtedness; liens and negative pledges; dividends and distributions; investments, acquisitions and speculative transactions; contingent obligations; transactions with affiliates; fundamental changes to our business, property and assets; insurance; sale lease-backs; the ability to change the nature of our business, our fiscal year and our accounting policies; the ability to amend or waive any of the terms of any permitted subordinated debt, the Term Loan Facility and our organizational documents; designations of senior debt other than the ABL Facility obligations and the Term Loan Facility obligations; and the performance of material contracts, including intellectual property licenses. The ABL Facility also requires that we maintain (a) during any fiscal quarter, if excess availability falls below $6.5 million, a fixed charge coverage ratio of not less than 1.10 to 1.00 until excess availability is equal to or greater than $10.0 million and (b) aggregate excess availability of not less than $5.0 million at all times.
For additional information regarding the terms of the ABL Facility, see “Description of Certain Indebtedness—ABL Facility.”
Term Loan Facility
On November 25, 2008, in connection with the Golden Gate Capital Acquisition, we entered into the Term Loan Facility with various banks and other financial institutions as lenders thereunder and BNP Paribas, as administrative agent. On May 7, 2010, the Term Loan Facility was amended and restated to, among other things, (1) increase the aggregate principal amount available thereunder from $102.0 million to $165.0 million and (2) add an incremental term loan facility in the maximum aggregate principal amount of $25.0 million. On June 8, 2011, the Term Loan Facility was again amended and restated to, among other things, (1) further increase the aggregate principal amount available thereunder to $260.0 million and (2) increase the maximum aggregate principal amount under the incremental term loan facility to $50.0 million.
The Term Loan Facility contains customary covenants and restrictions on our activities related to, among other things: the incurrence of additional indebtedness; liens and negative pledges; dividends and distributions; investments and acquisitions; contingent obligations; transactions with shareholders (holders of at least 10% of the equity securities) and affiliates; fundamental changes to our business, property and assets; sale lease-backs; the ability to change the nature of our business, our fiscal year and our accounting policies; the ability to amend or waive any of the terms of the Management Agreement, the ABL Facility and other material agreements;
61
Table of Contents
designations of senior debt other than the Term Loan Facility obligations and the ABL Facility obligations; and the performance of material contracts, including real property leases and intellectual property licenses. The Term Loan Facility also requires compliance with certain financial covenants, including the maintenance of a maximum consolidated leverage ratio as of the last day of each fiscal quarter at levels set forth in the Term Loan Facility and a maximum capital expenditures covenant restricting our capital expenditures at times when our unrestricted cash (including availability under the ABL facility) is less than $40.0 million.
For additional information regarding the terms of the Term Loan Facility, see “Description of Certain Indebtedness—Term Loan Facility.”
Off-Balance Sheet Arrangements
We have no off-balance sheet arrangements that have or are likely to have a current or future material effect on our financial condition, changes in financial condition, sales, expenses, results of operations, liquidity, capital expenditures or capital resources.
Contractual Obligations
As of December 31, 2010, the total of our future contractual cash commitments, including the repayment of our debt obligations under the ABL Facility, the Term Loan Facility and the Mezzanine Loan Facility, is summarized as follows:
| Contractual Obligations |
Payments Due by Period | |||||||||||||||||||
| (amounts in thousands) | ||||||||||||||||||||
| Total | Less than 1 year |
1-3 years | 3-5 years | More than 5 years |
||||||||||||||||
| Interest on Long-Term Debt |
$ | 106,409 | $ | 18,405 | $ | 36,524 | $ | 36,145 | $ | 15,335 | ||||||||||
| Long-Term Debt Obligations(1) |
238,442 | 1,510 | 3,025 | 80,579 | 153,328 | |||||||||||||||
| Retirement Plans |
50,880 | 12,479 | 13,554 | 12,098 | 12,749 | |||||||||||||||
| Operating Lease Obligations(2) |
16,699 | 5,054 | 7,294 | 1,644 | 2,707 | |||||||||||||||
| Other Long-Term Liabilities(3) |
3,886 | 1,466 | 432 | 424 | 1,564 | |||||||||||||||
| Total Contractual Cash Obligations(4)(5) |
$ | 416,316 | $ | 38,914 | $ | 60,829 | $ | 130,890 | $ | 185,683 | ||||||||||
| (1) | As of December 31, 2010, we had the following amounts outstanding under our credit facilities: no amounts outstanding under the ABL Facility; $163.4 million, net of unamortized original issue discount, outstanding under the Term Loan Facility; and $75.0 million outstanding under the Mezzanine Loan Facility. On June 8, 2011, we amended and restated the Term Loan Facility to, among other things, increase the aggregate principal amount available thereunder to $260.0 million and reprice the interest rate to LIBOR plus 375 basis points, and used the proceeds to prepay the Mezzanine Loan Facility in its entirety. See “—Liquidity and Capital Resources—Credit Facilities.” |
| (2) | We are obligated under certain operating leases for railroad cars, mining properties, mining and processing equipment, office space, transportation and other equipment. Certain of our operating lease arrangements include options to purchase the equipment for fair market value at the end of the original lease term. Annual operating lease commitments are presented in more detail in note F to our audited combined financial statements included elsewhere in this prospectus. |
| (3) | Other long-term obligations include advisory fees paid to Golden Gate Capital and mineral royalty payments. See “Certain Relationships and Related Party Transactions—Golden Gate Capital Acquisition—Advisory Agreement.” |
| (4) | The above table excludes discounted asset retirement obligations in the amount of $6.4 million at December 31, 2010, the majority of which have a settlement date beyond 2025. |
| (5) | We have indemnified underwriters for surety bonds issued on our behalf and are a contingent guarantor on a railcar lease, both of which are excluded from this table. See note P to our audited combined financial statements included elsewhere in this prospectus. |
62
Table of Contents
Environmental Matters
We are subject to various federal, state and local laws and regulations governing, among other things, hazardous materials, air and water emissions, environmental contamination and reclamation and the protection of the environment and natural resources. We have made, and expect to make in the future, expenditures to comply with such laws and regulations, but cannot predict the full amount of such future expenditures. We may also from time to time incur fines and penalties associated with noncompliance with such laws and regulations. In particular, on September 8, 2011 we voluntarily disclosed potential violations of air emission permits at our Rockwood, Michigan facility to the EPA and the Michigan Department of Environmental Quality, and while no proceedings have been instituted at this time by either agency we could incur penalties or be subject to other requirements in the future as a result of such potential violations. As of December 31, 2010, we had $6.4 million accrued for future reclamation costs, as compared to $5.9 million as of December 31, 2009.
We discuss certain environmental matters relating to our various production and other facilities, certain regulatory requirements relating to human exposure to crystalline silica and our mining activity and how such matters may affect our business in the future under “Business—Regulation and Legislation.”
Critical Accounting Policies
Our discussion and analysis of our financial condition and results of operations are based upon our combined financial statements, which have been prepared in accordance with accounting principles generally acceptable in the United States of America. The preparation of these financial statements requires us to make estimates and assumptions that affect the reported amounts of assets and liabilities and the disclosure of contingent assets and liabilities at the dates of the financial statements and the reported revenues and expenses during the reporting periods. We evaluate these estimates and assumptions on an ongoing basis and base our estimates on historical experience, current conditions and various other assumptions that are believed to be reasonable under the circumstances. The results of these estimates form the basis for making judgments about the carrying values of assets and liabilities as well as identifying and assessing the accounting treatment with respect to commitments and contingencies. Our actual results may materially differ from these estimates.
Listed below are the accounting policies we believe are critical to our financial statements due to the degree of uncertainty regarding the estimates or assumptions involved, and that we believe are critical to the understanding of our operations.
Impairment of Long-Lived Assets
We periodically evaluate whether current events or circumstances indicate that the carrying value of our long-lived assets, including goodwill and other intangible assets, to be held and used may not be recoverable. If such circumstances are determined to exist, an estimate of future cash flows produced by the long-lived assets, or the appropriate grouping of assets, is compared to the carrying value to determine whether an impairment exists. If an asset is determined to be impaired, the loss is measured based on quoted market prices in active markets, if available. If quoted market prices are not available, the estimate of fair value is based on various valuation techniques, including a discounted value of estimated future cash flows. A detailed determination of the fair value may be carried forward from one year to the next if certain criteria have been met. We report an asset to be disposed of at the lower of its carrying value or its estimated net realizable value.
Factors we generally consider important in our evaluation and that could trigger an impairment review of the carrying value of long-lived assets include significant underperformance relative to expected operating trends, significant changes in the way assets are used, underutilization of our tangible assets, discontinuance of certain products by us or by our customers, a decrease in estimated mineral reserves, and significant negative industry or economic trends.
The recoverability of the carrying value of our mineral properties is dependent upon the successful development, start-up and commercial production of our mineral deposit and the related processing facilities. Our
63
Table of Contents
evaluation of mineral properties for potential impairment primarily includes assessing the existence or availability of required permits and evaluating changes in our mineral reserves, or the underlying estimates and assumptions, including estimated production costs. Assessing the economic feasibility requires certain estimates, including the prices of products to be produced and processing recovery rates, as well as operating and capital costs.
Although we believe the carrying values of our long-lived assets were realizable as of the relevant balance sheet date, future events could cause us to conclude otherwise.
Mine Reclamation Costs
Reclamation costs are allocated to expense over the life of the related assets and are periodically adjusted to reflect changes in the estimated present value resulting from the passage of time and revisions to the estimates of either timing or amount of the reclamation and remediation costs. The estimated net future costs of dismantling, restoring and reclaiming operating mines and related mine sites, in accordance with federal, state and local regulatory requirements, are accrued in the period in which the liability is incurred at the estimated fair value. The associated asset retirement costs are capitalized as part of the carrying amount of the underlying asset and depreciated over the estimated useful life of the asset. The liability is accreted through charges to operating expenses. If the asset retirement obligation is settled for other than the carrying amount of the liability, a gain or loss is recognized on settlement.
Self-Insurance and Product Liability Claim Reserves
We are self-insured for healthcare costs and for large insurance deductibles related to worker’s compensation. We are also self-insured for third party product liability claims alleging occupational disease. We provide for estimated future losses based on reported cases and past claim history. Accounting for these liabilities requires us to use our best judgment. While we believe that our accruals for these matters are adequate, if the actual loss is significantly different than the estimated loss for these liabilities, our results of operations could be materially affected. See “Risk Factors—Risks Related to Our Business—Silica-related health issues and litigation could have a material adverse effect on our business reputation or results of operations” for a further discussion of the manner in which we record amounts for product liability claims.
Employee Benefit Plans
We provide a range of benefits to our employees and retired employees, including pensions and postretirement healthcare and life insurance benefits. We record annual amounts relating to these plans based on calculations specified by generally accepted accounting principles, which include various actuarial assumptions, including discount rates, assumed rates of returns, compensation increases, turnover rates and healthcare cost trend rates. We review the actuarial assumptions on an annual basis and make modifications to the assumptions based on current rates and trends when it is deemed appropriate to do so. As required by U.S. generally accepted accounting principles, the effect of the modifications is generally recorded or amortized over future periods. We believe that the assumptions utilized in recording our obligations under the plans, which are presented in note M to our audited combined financial statements included elsewhere in this prospectus, are reasonable based on advice from our actuaries and information as to assumptions used by other employers.
Equity-Based Awards
We account for equity-based awards in accordance with applicable guidance, which establishes standards of accounting for transactions in which an entity exchanges its equity instruments for goods or services. Equity-based compensation expense is recorded based upon the fair value of the award at grant date. Such costs are recognized as expense on a straight-line basis over the corresponding vesting period. The fair value of the grants issued was calculated based on a Black-Scholes pricing model. This model included certain market assumptions
64
Table of Contents
related to future volumes, projected fees and/or prices, expected costs of sales and direct operating costs and risk adjusted discount rates. We also take into consideration the rights and preferences of awarded equity incentives. The application of this valuation model involves assumptions that are judgmental and highly sensitive in the valuation of incentive awards, which affects compensation expense related to these awards. These assumptions include an estimate of the time to liquidity event, volatility and risk free rate over a period of time corresponding to the time to liquidity event.
The fair value of the equity units was estimated using the following assumptions:
| Risk-free interest rate |
1.87 | % | ||
| Expected volatility |
50 | % | ||
| Time to liquidity event |
4 years |
Our risk-free interest rate is an interpolated rate from the U.S. constant maturity treasury rate for a term corresponding to the time to liquidity event, as described below. An increase in the risk-free rate will increase compensation expense.
Our expected volatility is a measure of the amount by which the price of various comparable companies common stock has fluctuated or is expected to fluctuate, as our common stock is not publicly-traded. The comparable companies were selected by analyzing public companies in the industry based on various factors including, but not limited to, company size, financial data availability, active trading volume and capital structure. An increase in the expected volatility will increase compensation expense.
Our time to liquidity event is the period of time over which the underlying equity units are expected to remain outstanding. An increase in the expected term will increase compensation expense.
We will continue to use judgment in evaluating the risk-free interest rate, expected volatility and lives related to our equity-based compensation on a prospective basis and incorporating these factors into our pricing model.
Taxes
Deferred taxes are provided on the liability method whereby deferred tax assets are recognized for deductible temporary differences and operating loss and tax credit carryforwards and deferred tax liabilities are recognized for taxable temporary differences. This approach requires recognition of deferred tax liabilities and assets for the expected future tax consequences of events that have been included in the financial statements or tax returns. Under this method, deferred tax liabilities and assets are determined based upon the difference between the financial statement and tax basis of assets and liabilities using enacted tax rates in effect for the year in which the expenses are expected to reverse. Valuation allowances are provided if, based on the weight of available evidence, it is more likely than not that some or all of the deferred tax assets will not be realized.
We recognize a tax benefit associated with an uncertain tax position when, in our judgment, it is more likely than not that the position will be sustained upon examination by a taxing authority. For a tax position that meets the more-likely-than-not recognition threshold, we initially and subsequently measure the tax benefit as the largest amount that it judges to have a greater than 50% likelihood of being realized upon ultimate settlement with a taxing authority. The liability associated with unrecognized tax benefits is adjusted periodically due to changing circumstances, such as the progress of tax audits, case law developments and new or emerging legislation. Such adjustments are recognized entirely in the period in which they are identified. The effective tax rate includes the net impact of changes in the liability for unrecognized tax benefits and subsequent adjustments as considered appropriate by management. At the adoption date, we applied the uncertain tax position guidance to all tax positions for which the statute of limitations remained open. The adoption of this guidance did not have a material impact on our combined financial condition or results of operations.
65
Table of Contents
We evaluate quarterly the realizability of our deferred tax assets by assessing the need for a valuation allowance and by adjusting the amount of such allowance, if necessary. The factors used to assess the likelihood of realization are our forecast of future taxable income and available tax planning strategies that could be implemented to realize the net deferred tax assets. Failure to achieve forecasted taxable income might affect the ultimate realization of the net deferred tax assets. Factors that may affect our ability to achieve sufficient forecasted taxable income include, but are not limited to, the following: a decline in sales or margins, increased competition or loss of market share. In addition, we operate within multiple taxing jurisdictions and are subject to audit in these jurisdictions. These audits can involve complex issues, which may require an extended time to resolve. We believe that adequate provisions for income taxes have been made for all years.
The largest permanent item in computing both our effective tax rate and taxable income is the deduction allowed for statutory depletion. The impact of statutory depletion on the effective tax rate is presented in note N to our audited combined financial statements included elsewhere in this prospectus. The deduction for statutory depletion does not necessarily change proportionately in income before income taxes.
Recent Accounting Pronouncements
New accounting guidance that we have recently adopted, as well as accounting guidance that has been recently issued but not yet adopted by us, are included in note B to our audited combined financial statements included elsewhere in this prospectus under the sections entitled “Impact of Recent Accounting Standards/Pronouncements” and “Accounting Guidance Pending Adoption,” respectively.
Quantitative and Qualitative Disclosures About Market Risk
Interest Rate and Commodity Price Risks
We use interest rate and natural gas hedge agreements in the normal course of our business to manage both our interest and energy costs and the risks associated with changing interest rates and natural gas prices. These hedge agreements are used to exchange the difference between fixed and variable-rate interest amounts or natural gas prices calculated by reference to an agreed-upon notional principal amount or natural gas quantity. We do not use derivative financial instruments for trading or speculative purposes. By their nature, all such instruments involve risk, including the possibility that a loss may occur from the failure of another party to perform according to the terms of a contract (credit risk) or the possibility that future changes in market price may make a financial instrument less valuable or more onerous (market risk). As is customary for these types of instruments, we do not require collateral or other security from other parties to these instruments. In management’s opinion, there is no significant risk of loss in the event of nonperformance of the counterparties to these financial instruments.
The fair value of the hedge agreements represents the estimated receipts or payments that would be required to settle the agreements at year-end. Quoted market prices were used to estimate the fair values of the interest rate and natural gas hedge agreements. The notional amount represents agreed upon amounts on which calculations of dollars to be exchanged are based. They do not represent amounts exchanged by the parties and, therefore, are not a measure of our exposure. Our credit exposure is limited to the fair value of the contracts with a positive fair value plus interest receivable, if any, as of the reporting date.
| December 31, 2009 | December 31, 2010 | |||||||||||||||||||||||
| Maturity Date |
Contract/Notional Amount |
Carrying Amount |
Fair Value |
Contract/Notional Amount |
Carrying Amount |
Fair Value |
||||||||||||||||||
| Natural gas rate swap agreements |
2010 | 926,029 million BTU | $ | 68 | $ | 68 | ||||||||||||||||||
| Natural gas rate cap agreement |
2010 | 60,000 million BTU | $ | 11 | $ | 11 | ||||||||||||||||||
| Natural gas rate swap agreements |
2011 | 420,000 million BTU | $ | (109 | ) | $ | (109 | ) | ||||||||||||||||
| Interest rate cap agreement(1) |
2012 | $100 million | $ | 412 | $ | 412 | $100 million | $ | 13 | $ | 13 | |||||||||||||
| Interest rate cap agreement(1) |
2013 | $20 million | $ | 244 | $ | 244 | ||||||||||||||||||
| (1) | Agreements limit the LIBOR floating interest rate base to 4%. |
66
Table of Contents
We have designated these contracts as qualified cash flow hedges. Accordingly, the effective portion of the gain or loss on the derivative instrument is reported as a component of other comprehensive income and recognized in earnings in the same period or periods during which the hedged transaction affects earnings. We had no ineffective contracts as of December 31, 2010.
A hypothetical increase or decrease in interest rates by 1.0% would have changed our interest expense by $2.4 million for the year ended December 31, 2010.
Market Risk
We are exposed to various market risks, including changes in interest rates. Market risk related to interest rates is the potential loss arising from adverse changes in interest rates. We do not believe that inflation has a material impact on our financial position or results of operations during periods covered by the financial statements included in this prospectus.
Credit Risk
We are subject to risks of loss resulting from nonpayment or nonperformance by our customers. We examine the creditworthiness of third-party customers to whom we extend credit and manage our exposure to credit risk through credit analysis, credit approval, credit limits and monitoring procedures, and for certain transactions, we may request letters of credit, prepayments or guarantees, although collateral is generally not required.
Internal Control Over Financial Reporting
We reissued our 2010 financial statements after management identified a material weakness in its internal controls related to stock-based compensation. Based on a misinterpretation of accounting guidance, management did not properly record compensation for equity-based awards granted at our parent LLC to certain of our employees. This resulted in an understatement of stock-based compensation expense in 2009 and 2010. A material weakness is a control deficiency, or combination of control deficiencies, that results in more than a remote likelihood that a material misstatement of the annual or interim financial statements will not be prevented or detected. See “Management’s Discussion and Analysis of Financial Condition and Results of Operations—Internal Control Over Financial Reporting.” No additional equity-based awards are expected to be granted to our employees at our parent LLC in the future and, therefore, no additional remediation efforts are necessary.
If we fail to maintain effective internal controls in the future, it could result in a material misstatement of our financial statements that would not be prevented or detected on a timely basis, which could cause investors to lose confidence in our financial information or cause our stock price to decline.
67
Table of Contents
Our Company
Business Overview
We are the second largest domestic producer of commercial silica, a specialized mineral that is a critical input into a variety of attractive end markets. During our 111-year history, we have developed core competencies in mining, processing, logistics and materials science that enable us to produce and cost-effectively deliver over 200 products to customers across these end markets. In our largest end market, oil and gas proppants, our frac sand is used to stimulate and maintain the flow of hydrocarbons in horizontally drilled oil and natural gas wells. This segment of our business is experiencing rapid growth due to recent technological advances in the hydraulic fracturing process, which have made the extraction of large volumes of oil and natural gas from U.S. shale formations economically feasible. Our commercial silica is also used as an economically irreplaceable raw material in a wide range of industrial applications, including glassmaking and chemical manufacturing. Additionally, in recent years a number of attractive new end markets have developed for our high-margin, performance silica products, including solar panels, specialty coatings, wind turbines, polymer additives and geothermal energy systems.
We operate 13 facilities across the United States and control 283 million tons of reserves, including approximately 138 million tons of reserves that can be processed to meet API frac sand size specifications. We produce a wide range of frac sand sizes and are one of the few commercial silica producers capable of rail delivery of large quantities of API grade frac sand to each of the major U.S. shale basins. We believe that due to a combination of these favorable attributes and robust drilling activity in the oil and natural gas industry, we have become a preferred commercial silica supplier to our customers in the oil and gas proppants end market and, consequently, are experiencing high demand for our frac sand. To meet this demand, we are investing significant resources to increase our proppant production, including expanding our frac sand capabilities by approximately 1.2 million tons, or approximately 75% above tons sold in 2010, and constructing a new facility to produce resin-coated sand, which significantly expands our addressable proppant market.
Our operations are organized into two segments based on end markets served: (1) Oil & Gas Proppants and (2) Industrial & Specialty Products. Our segments are complementary because our ability to sell to a wide range of customers across end markets allows us to maximize recovery rates in our mining operations, optimize our asset utilization and reduce the cyclicality of our earnings. In 2010, we generated approximately $245.0 million of sales, $72.2 million of Adjusted EBITDA and $11.4 million of net income. These figures represent increases of 28%, 44% and 106%, respectively, compared to 2009. In particular, the Oil & Gas Proppants segment contribution margin grew by 83% in 2010 and represented approximately 48% of total segment contribution margin, compared to 39% for the prior year.
Our Strengths
We attribute our success to the following strengths:
| • | Large-scale producer with a diverse and high-quality reserve base. Our 13 geographically dispersed facilities control 283 million tons of reserves, including API size frac sand and large quantities of silica with distinct characteristics, giving us the ability to sell over 200 products to over 1,400 customers. Our large-scale production capabilities and long reserve life make us a preferred commercial silica supplier to our customers. A consistent, reliable supply of large quantities of silica gives our customers the security to customize their production processes around our commercial silica. Furthermore, our scale provides us earnings diversification and a larger addressable market. |
| • | Geographically advantaged footprint with intrinsic transportation advantages. The strategic location of our facilities and our logistics capabilities enable us to enjoy high customer retention and a larger addressable market. In our Oil & Gas Proppants segment, our network of frac sand producing plants |
68
Table of Contents
| with access to on-site rail and the strategic locations of our transloads serve to expand our addressable market to every major U.S. shale basin. We believe we are one of the few frac sand producers capable of delivering API grade frac sand cost-effectively to most all of the major U.S. shale basins by on-site rail. Additionally, due to the high weight-to-value ratio of many silica products in our Industrial & Specialty Products segment, the proximity of our facilities to our customers’ facilities often results in us being their sole supplier. This advantage has enabled us to enjoy strong customer retention in this segment, with our top five Industrial & Specialty Products segment customers purchasing from us for an average of over 50 years. |
| • | Low-cost operating structure. We believe the combination of the following factors contributes to our low-cost structure and our high margins: |
| • | our ownership of the vast majority of our reserves, resulting in mineral royalty rates that were less than 0.5% of our sales in 2010; |
| • | the close proximity of our mines to their respective processing plants, which allows for a cost-efficient and highly automated production process; |
| • | our processing expertise, which enables us to create over 200 products with unique characteristics while minimizing waste material; |
| • | our integrated logistics management expertise and geographically advantaged facility network, which enables us to reliably ship products by the most cost-effective method available, whether by truck, rail, ship or barge; |
| • | our large customer base across numerous end markets, which allows us to maximize our mining recovery rate and asset utilization; and |
| • | our large overall and plant-level operating scale. |
| • | Strong reputation with our customers and the communities in which we operate. We believe that we have built a strong reputation during our 111-year operating history. Our customers know us for our dependability and our high-quality, innovative products, as we have a long track record of timely delivery of our products according to customer specifications. We also have an extensive network of technical resources, including materials science and petroleum engineering expertise, that enables us to collaborate with our customers to develop new products and improve the performance of their existing applications. We are also well known in the communities in which we operate as a preferred employer and a responsible corporate citizen, which generally serves us well in hiring new employees and securing difficult-to-obtain permits for expansions and new facilities. |
| • | Experienced management team. The members of our senior management team bring significant experience to the dynamic environment in which we operate. Their expertise covers a range of disciplines, including industry-specific operating and technical knowledge as well as experience managing high-growth businesses. We believe we have assembled a flexible, creative and responsive team with a mentality that is particularly well suited to the rapidly evolving unconventional oil and natural gas drilling landscape, which is the principal driver of our growth. |
Our Strategy
The key drivers of our growth strategy include:
| • | Expand our proppant production capacity and product portfolio. We are currently executing several initiatives to increase our frac sand production capacity and augment our proppant product portfolio. At our Ottawa, Illinois facility, we recently implemented operating improvements and installed a new dryer with six mineral separators to increase our annual frac sand production capacity by 900,000 tons. At our Rockwood, Michigan facility, we recently added 250,000 tons of annual frac sand production capacity by installing an entirely new processing circuit to run on a continuous basis alongside our |
69
Table of Contents
| existing state-of-the-art low-iron silica circuit. These two projects were completed during the fourth quarter of 2011. We are also in the initial stages of building a new facility to produce resin-coated sand that will be designed to coat up to 400 million pounds annually, which is scheduled for completion and start-up in 2013. We expect to fund all of these projects through a combination of cash on our balance sheet and cash generated from our operations. |
| • | Increase our exposure to attractive industrial and specialty products end markets. We intend to increase our exposure and market share in certain industrial and specialty products end markets that we believe are poised for growth. For example, at our Rockwood facility, we have doubled our production capacity for low-iron silica, which is used to maximize light transmission in ultra-clear architectural glass and solar panels. In addition, we recently opened a representative office in Shanghai, China to market our fine ground silica products across the Asia Pacific region for use in specialty end markets. We are also exploring opportunities to grow our presence in the specialty coatings and polymer additives end markets, where our ultra-fine ground silica is used to enhance strength, scratch resistance and stability. |
| • | Optimize product mix and further develop value-added capabilities to maximize margins. We will continue to actively manage our product mix at each of our plants to ensure we are maximizing our profit margins. This requires us to use our proprietary expertise in balancing key variables, such as mine geology, processing capacities, transportation availability, customer requirements and pricing. In 2010, while our tons sold increased by 17%, we believe this expertise helped enable us to increase our operating income by 80%. We also expect to continue investing in ways to increase the value we provide to our customers by expanding our product offerings, increasing our transportation assets, improving our supply chain management and upgrading our information technology. We hope to use these strategies to increase our operating income faster than our tons sold into the future. |
| • | Evaluate both greenfield and brownfield expansion opportunities. We will continue to leverage our reputation, processing capabilities and infrastructure to increase production, as well as explore other opportunities to expand our reserve base. We may accomplish this by developing greenfield projects, where we can capitalize on our technical knowledge of geology, mining and processing and our strong reputation within local communities. For instance, on December 30, 2011, we purchased land in Sparta, Wisconsin, for which we recently received initial permitting for a new mining and production facility that, if pursued, would be targeted toward the production of frac sand. Our evaluation of this potential new facility is in the preliminary stages, however, and we can provide no assurances that we will continue to evaluate or complete the facility. We are also continuously exploring potential brownfield projects, such as the possibility of increasing the capacity at some subsequent date of the new resin-coating facility that we are currently constructing. Additionally, we may pursue “bolt on” and other opportunistic acquisitions, taking advantage of our asset footprint, our management’s experience with high-growth businesses and our strong customer relationships. We may also evaluate international acquisitions as unconventional oil and natural gas drilling expands globally. |
| • | Maintain financial strength and flexibility. We intend to maintain financial strength and flexibility to enable us to pursue acquisitions and new growth opportunities as they arise. As of September 30, 2011, we had $73.8 million of cash on hand and $22.5 million of available borrowings under our credit facilities. |
Our Industry
The commercial silica industry consists of businesses that are involved in the mining, processing and sale of commercial silica. Commercial silica, also referred to as “silica,” “industrial sand and gravel,” “silica sand” and “quartz sand,” is a term applied to sands and gravels containing a high percentage of silica (silicon dioxide, SiO2) in the form of quartz. Commercial silica deposits occur throughout the United States, but mines and processing facilities are typically located near end markets and in areas with access to transportation infrastructure. Other factors affecting the feasibility of commercial silica production include deposit composition, product quality specifications, land-use and environmental regulation, including permitting requirements, access to electricity, natural gas and water and a producer’s expertise and know-how.
70
Table of Contents
Extraction and Production Processes
Commercial silica deposits are formed from a variety of sedimentary processes and have distinct characteristics that range from hard sandstone rock to loose, unconsolidated dune sands. While the specific extraction method utilized depends primarily on the deposit composition, most silica is mined using conventional open-pit bench extraction methods and begins after clearing the deposit of any overlaying soil and organic matter. The silica deposit composition and chemical purity also dictate the processing methods and equipment utilized. For example, broken rock from a sandstone deposit may require one, two or three stages of crushing to liberate the silica grains required for most markets. Unconsolidated deposits may require little or no crushing, as silica grains are not tightly cemented together.
After extracting the ore, the silica is washed with water to remove fine impurities such as clay and organic particles. In some deposits, these fine contaminants or impurities are tightly bonded to the surface of the silica grain and require attrition scrubbing to be removed. Other deposits require the use of flotation to collect and separate contaminates from the silica. When these contaminants are weakly magnetic, special high intensity magnets may be utilized in the process to improve the purity of the final commercial silica product. After the silica was been washed, most output is dried prior to sale.
The final step in the production process involves the classification of commercial silica products according to their chemical purity, particle shape and particle size distribution. Generally, commercial silica is produced and sold in whole grain (unground) form and in ground form. Whole grain silica generally ranges from 12 to 140 mesh (the number of openings per linear inch on a sizing screen). Whole grain silica products are sold in a range of shapes, sizes and purity levels to be used in a variety of industrial applications, such as glass, foundry, building products, oil and natural gas recovery, filtration and recreation. Some whole grain silica is further processed to ground silica of much smaller particle sizes, ranging from 5 to 250 microns (one-millionth of a meter).
Product Distribution
Most commercial silica is shipped in bulk to customers by truck or rail. According to the 2009 USGS Minerals Yearbook, of the total commercial silica produced in the United States in 2009, approximately 52% was transported by truck from the plant to the site of first sale or use, 35% was transported by rail and 13% by unspecified modes of transportation. There has been a shift away from truck to rail, as more volumes have been directed to the oil and gas proppants end market, which typically utilizes rail transportation.
For bulk commercial silica, transportation cost represents a significant portion of the overall product cost. Consequently, the majority of production transported by truck is sold within approximately 200 miles of the producing facility. This limitation emphasizes the importance of rail, ship or barge access for low cost delivery outside of the 200-mile truck radius. As a result, facility location is one of the most important considerations for producers and customers. These factors dictate the all-in delivered cost of silica production. Exceptions to this include frac sands used in oil and natural gas recovery and finer grade commercial silica, where transporting the materials long distances is economically feasible due to their relatively high unit values.
In addition to bulk shipments, commercial silica products can be packaged and shipped in 50 to 100 pound bags or bulk super sacks. Bag shipments are usually made to smaller customers with batch operations, warehouse distributor locations or for ocean container shipments made overseas. The products that are shipped in bags are often higher-value products, such as ground and fine ground industrial silica.
Primary End Markets
The special properties of commercial silica—chemistry, purity, grain size, color, inertness, hardness and resistance to high temperatures—make it critical to a variety of industries. Commercial silica is a key input in the well completion process, specifically, in the hydraulic fracturing techniques used in unconventional oil and
71
Table of Contents
natural gas wells. In the industrial and specialty products end markets, stringent quality requirements must be met when commercial silica is used as an ingredient to produce thousands of everyday applications, including glass, building and foundry products and metal castings, as well as certain specialty applications such as solar panels, wind turbines, geothermal energy systems and catalytic converters. Due to the unique properties of commercial silica, it is an economically irreplaceable raw material in a wide range of industrial applications. Major end markets include:
Oil and Gas Proppants
Commercial silica is used as a proppant by companies involved in oil and natural gas recovery in unconventional resource plays. Unconventional oil and natural gas production requires fracturing and other well stimulation techniques to recover oil or natural gas that is trapped in the source rock and typically involves horizontal drilling. Frac sand is pumped down oil and natural gas wells at high pressures to prop open rock fissures in order to increase the flow rate of hydrocarbons from the wells. Additionally, every 4 to 5 years proppants may be used to “re-fracture” the shale and keep the fractures open. Proppants represent the single largest class of materials used in the stimulation of oil and natural gas wells, accounting for more than 40% of market value in 2010 according to a Freedonia report dated April 2011. The 2009 USGS Minerals Yearbook reports that sales of commercial silica products for oil and natural gas recovery accounted for approximately 28% by volume and 43% by value of total commercial silica product sales in 2009. Based on our own internal and other third-party estimates, we believe commercial silica used by the oil and gas proppants end market increased significantly in 2010 and likely accounted for approximately 44% of total commercial silica volumes.
Glass
Commercial silica is a critical input into and accounts for 60% to 70% of the raw materials in glass production. According to the 2009 USGS Minerals Yearbook, approximately 32% by volume and 23% by value of all commercial silica products sold in the United States in 2009 were used in glassmaking. The glassmaking markets served by commercial silica producers include containers, flat glass, specialty glass and fiberglass. Demand typically varies within each of these end markets.
The container glass, flat glass and fiberglass end markets are generally mature end markets. Demand for container glass has historically grown in line with population growth, and we expect similar growth in the future. Flat glass and fiberglass tend to be correlated with construction and automotive production activity, and as a result remain depressed relative to peak demand given the contraction of these end markets over the past few years. To the extent construction and automotive production activity recovers in the coming years (which is difficult to predict given current economic uncertainty), we expect that demand in these end markets will increase. See “Risk Factors—Risks Related to Our Business—Our operations are subject to the cyclical nature of our customers’ businesses, and we may not be able to mitigate that risk.”
The demand for low-iron glass, which is utilized in glass for solar panels and certain grades of architectural glass has been experiencing more rapid growth. In addition, glass fibers are being incorporated in high strength wind turbines, a fast growing alternative energy source. Commercial silica used in production of these products is generally of higher quality and tighter specifications than the commercial silica used in the manufacturing of other glass products.
Building Products
Commercial silica is used in the manufacturing of building products for commercial and residential construction. The 2009 USGS Minerals Yearbook reports that commercial silica sold to manufacturers of building products accounted for approximately 8% by volume and 9% by value of all commercial silica sold in the United States in 2009. Whole grain commercial silica products are used in flooring compounds, mortars and grouts, specialty cements, stucco and roofing shingles. Ground commercial silica products are used by building
72
Table of Contents
products manufacturers as functional extenders and to add durability and weathering properties to cementious compounds. In addition, geothermal wells are a fast growing alternative energy source that require specialized ground silica products in their well casings for effectiveness. The market for commercial silica used to manufacture building products is driven primarily by the demand in the construction markets. The historical trend for this market has been one of growth, especially in demand for cementious compounds for new construction, renovation and repair. Although the housing construction market has recently declined, to the extent the housing market recovers in the coming years (which is difficult to predict given current economic uncertainty), we expect that demand in this end market will increase. See “Risk Factors—Risks Related to Our Business—Our operations are subject to the cyclical nature of our customers’ businesses, and we may not be able to mitigate that risk.”
Foundry
According to the 2009 USGS Minerals Yearbook, in 2009, commercial silica products used for foundry purposes represented approximately 13% by volume and 8% by value of all commercial silica products sold in the United States. Commercial silica products are used in the production of molds for metal castings and in metal casting products. In addition, commercial whole grain silica is sold to coaters of foundry silica who then sell their product to foundries for cores and shell casting processes. The demand for foundry silica depends on the rate of automobile and light truck production, construction and production of heavy equipment like rail cars. Over the past decade, there has been some movement of foundry supply chains to Mexico and other offshore production areas. Additionally, foundry demand decreased significantly in 2009 as a result of the decrease in automotive and heavy equipment production. To the extent production levels recover in the coming years (which is difficult to predict given current economic uncertainty), we expect foundry demand to improve. See “Risk Factors—Risks Related to Our Business—Our operations are subject to the cyclical nature of our customers’ businesses, and we may not be able to mitigate that risk.”
Chemicals
In 2009, sales of commercial silica products to manufacturers of chemicals equaled approximately 3% by volume and 3% by value of the total commercial silica products sold in the United States according to the 2009 USGS Minerals Yearbook. Both whole grain and ground silica products are used in the manufacturing of silicon-based chemicals, such as sodium silicate, that are used in a variety of applications, including food processing, detergent products, paper textiles and specialty foundry applications. This end market is driven by the development of new products by the chemicals manufacturers, including specialty coatings and polymer additives. We expect this end market to grow as these manufacturers continue their product and applications development.
Fillers and Extenders
According to the 2009 USGS Minerals Yearbook, in 2009, commercial silica products sold for use as fillers represented approximately 1% by volume and 2% by value of all commercial silica products sold in the United States. Commercial silica products are sold to producers of paints and coating products for use as fillers and extenders in architectural, industrial and traffic paints and are sold to producers of rubber and plastic for us in the production of epoxy molding compounds and silicone rubber. The commercial silica products used in this end market is most often ground silica, including finer ground classifications. The market for fillers and extenders is driven by demand in the construction and automotive production industries as well as by demand for materials in the housing remodeling industry. Although construction, automotive production and housing remodeling demand decreased in 2009, to the extent these industries recover in the coming years (which is difficult to predict given current economic uncertainty), we expect demand to improve. See “Risk Factors—Risks Related to Our Business—Our operations are subject to the cyclical nature of our customers’ businesses, and we may not be able to mitigate that risk.”
73
Table of Contents
Demand Trends
From 1980 to 2008, U.S. commercial silica industry volumes generally grew in line with U.S industrial production, primarily influenced by the manufacture of glass, building materials, foundry moldings and chemicals. The economic downturn of 2008 and 2009 decreased demand for commercial silica products, particularly in the glassmaking, foundry, specialty coatings and building products end markets. With the recent economic recovery, however, we estimate overall demand for commercial silica increased greater than 45% in 2010. Demand for commercial silica in industrial and specialty products end markets once again began to grow. We also saw increased demand for new specialty applications, such as solar panels, specialty coatings, wind turbines, polymer additives and geothermal energy systems.
In addition to rebounding industrial end markets and increasing demand for commercial silica products for certain specialty applications, the significant demand growth in 2010 was primarily driven by an acceleration in demand for frac sand. Based on industry data and our own internal estimates, we believe frac sand demand has grown by more than 28% per annum since 2004. The following chart depicts consumption in each of the oil and gas proppants and industrial and specialty products end markets from 2004 through 2010.
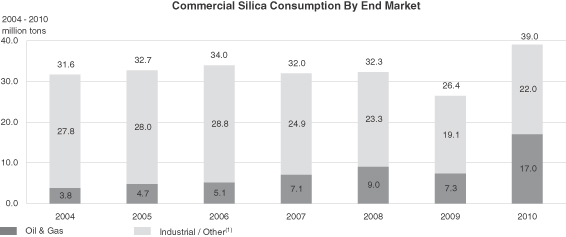
Data Source: For years 2004 through 2009, the 2009 USGS Minerals Yearbook; for 2010, internal estimates compiled through consultation with third parties and management. See “Market and Industry Data.”
| (1) | Industrial/Other end markets include glassmaking, foundry, metallurgical, abrasives, filtration, recreational, traction/engine, coal washing, roofing granules and fillers and other, as defined by the USGS. |
The 2009 USGS Minerals Yearbook estimated the value of the commercial silica market value at approximately $762.0 million. The oil and gas proppants end market was estimated at $326.0 million, while remaining industrial segments aggregated to $436.0 million. Given our estimates of the significant growth in frac sand production in 2010, as well as the recovery in industrial end markets, we believe the overall commercial silica market exceeded $1 billion in 2010, with the oil and gas proppants end market contributing in excess of $600.0 million.
74
Table of Contents
We believe that commercial silica consumption increased at an average annual rate of 9.9% from 2008 to 2010 and that this growth was principally driven by the acceleration in growth in frac sand demand. This demand growth is primarily due to technological developments, such as improvements in horizontal drilling that have made the extraction of oil and natural gas increasingly cost-effective in areas that historically would have been economically impractical to develop. Frac sand is an essential component in the efficient exploitation of these reservoirs, and as more of these reservoirs have been developed, the demand for frac sand has correspondingly increased. The following chart identifies trends in the number of horizontal drill rigs from 2002 to 2011 and the CAGR over such period.
Data Source: Baker Hughes, Inc., January 2012
| (1) | Data reported as year-end rig count for each period (2002-2011). |
In addition to the increase in the number of horizontal drill rigs, the growth in demand is also the product of an increase in the amount of frac sand used per rig, which is growing as a result of the following factors:
| • | improved drill rig productivity, resulting in more wells drilled per year per rig; |
| • | the increase in the number of fracturing sites within each well where fracturing occurs and proppant is needed; |
| • | the increase in the length of the horizontal distance covered in each stage of the well due to advances in horizontal drilling technologies; and |
| • | the increase in proppant use per foot completed in each fracturing stage. |
Based on these drivers, demand for all proppants is projected to increase approximately 16% per year to $5.1 billion in 2015, and, more specifically, demand for frac sand and resin-coated sand in the United States and Canada is projected to increase 15% per year to $1.9 billion in 2015, according to a Freedonia report dated April 2011.
Supply
Supplies of commercial silica have failed to keep pace with demand for approximately the past 18 months. During the economic downturn of 2008 and 2009, demand for commercial silica from customers in various industrial and specialty products end markets decreased. As a result, there was no significant expansion of domestic commercial silica. This, combined with the continued growth in demand for frac sand in 2010 and the rebound in industrial and specialty products end markets, has created a supply-demand disparity over approximately the past 18 months. We believe that if the present level of demand growth continues for the
75
Table of Contents
foreseeable future (which is difficult to predict given current economic uncertainty), a significant expansion in the supply of commercial silica will be needed to balance the market. We, and other large producers, have implemented or announced some supply expansions, and other smaller producers have made similar announcements. However, there are several key constraints to increasing production on an industry-wide basis, including:
| • | the difficulty of finding silica reserves suitable for use as frac sand, which, according to the API, must meet stringent technical specifications, including, among others, sphericity, grain size, crush resistance, acid solubility, purity and turbidity; |
| • | the difficulty of securing contiguous reserves of silica large enough to justify the capital investment required to develop a mine and processing plant; |
| • | a lack of industry-specific geological, exploration, development and mining knowledge and experience needed to enable the identification, acquisition and development of high-quality reserves; |
| • | the difficulty of identifying reserves with the above characteristics that either are located in close proximity to oil and natural gas reservoirs or have the rail access needed for low-cost transportation to major shale basins; |
| • | the difficulty of securing mining, production, water, air, refuse and other federal, state and local operating permits from the proper authorities, a process that can require up to three years; and |
| • | the difficulty of assembling a large, diverse portfolio of customers to optimize operations. |
Pricing
Historically, commercial silica has been characterized by regional markets created by the high weight-to-value ratio of silica. According to a USGS report dated October 2010, from 1970 to 2000, commercial silica prices increased at an average annual rate of 4.5%. Since 2000, the increased demand for commercial silica from our customers in both the oil and gas proppants end market and industrial and specialty products end markets and limited supply increases have resulted in favorable pricing trends in both of our operating segments. From 2000 to 2009, commercial silica prices increased at an average annual rate of 9.0%.
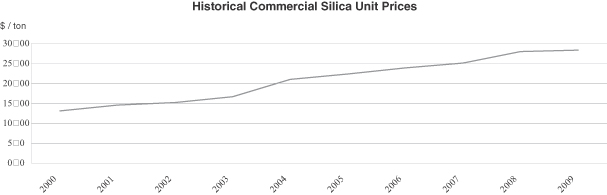
Source:USGS, October 2010
If the use of hydraulic fracturing continues to increase, and if the general economic recovery continues to result in increased demand from our customers in industrial and specialty products end markets, we expect the prices that our products command will continue to increase.
76
Table of Contents
Our Products
In order to serve a broad range of end markets, we produce and sell a variety of commercial silica products, including whole grain and ground products, as well as other industrial mineral products that we believe complement our commercial silica products.
Whole Grain Silica Products. We sell whole grain commercial silica products in a range of shapes, sizes and purity levels. We sell whole grain silica that has a round shape and high crush strength to be used as frac sand in connection with oil and natural gas recovery, and we have begun investing in the construction of a production facility for resin-coated sand. We also sell whole grain silica products in a range of size distributions, grain shapes and chemical purity levels to our customers involved in the manufacturing of glass products, including a low-iron whole grain product sold to manufacturers of architectural and solar glass applications. In addition, we sell over 80 grades of whole grain round silica to the foundry industry and provide whole grain commercial silica to the building products industry. In 2010, sales of whole grain commercial silica products accounted for approximately 75% of our total sales.
Ground Silica Products. Our ground commercial silica products are inherently inert, white and bright, with high purity. We market our ground silica in sizes ranging from 40 to 250 microns for use in plastics, rubber, polishes, cleansers, paints, ceramic frits and glazes, textile fiberglass and precision castings. We also produce and market fine ground silica in sizes ranging from 5 to 40 microns for use in premium paints, specialty coatings, sealants, silicone rubber and epoxies. We believe we are currently the only commercial silica producer in the United States that manufactures a 5-micron product. In 2010, sales of ground silica products accounted for approximately 17% of our total sales.
Other Industrial Mineral Products. We also produce and sell certain other industrial mineral products, such as aplite, calcined kaolin clay and magnesium silicate. Aplite is a mineral used to produce container glass and insulation fiberglass and is a source of alumina that has a low melting point and a low tendency to form defects in glass. Calcined kaolin clay is a mineral primarily used as a functional extender. Calcined kaolin clay is chemically inert, has a high covering power, gives desirable flow properties and reduces the amount of expensive pigments required. These characteristics make calcined kaolin clay an ideal functional extender in paints, plastics, specialty coatings and rubber. We also produce and sell a highly selective adsorbent made from a mixture of silica and magnesium, used extensively in preparative and analytical chromatography. In 2010, sales of these other industrial mineral products accounted for approximately 8% of our total sales.
Our Primary End Markets and Customers
We sell our products to a variety of end markets. At the end of 2008, we began investing heavily in our capacity to supply frac sand to customers in the oil and gas proppants end market. Our high-quality reserves of frac sand have enabled us to quickly build a presence in this fast-growing market, and we are currently investing in our capacity to offer resin-coated sand for the same purpose. Our customers in the oil and gas proppants end market include Schlumberger Ltd., Halliburton Company, Nabors Industries Ltd., Weatherford International Ltd. and Baker Hughes, Inc. Sales to the oil and gas proppants end market comprised approximately 16%, 19% and 28% of our total sales in 2008, 2009 and 2010, respectively.
Our primary markets have historically been core industrial end markets with customers engaged in the production of glass, building products, foundry products, chemicals and fillers and extenders. Our diverse customer base drives high recovery rates across our production. We also benefit from strong and long-standing relationships with our customers in each of the industrial and specialty products end markets we serve. In our industrial and specialty products end markets, our customers are leaders in their respective industries and include Owens-Illinois, Inc., Owens Corning, Saint-Gobain Glass, The Sherwin-Williams Company and PPG Industries. Sales to our industrial and specialty products end markets comprised approximately 84%, 81% and 72% of our total sales in 2008, 2009 and 2010, respectively.
77
Table of Contents
We primarily sell our products under short term fixed price agreements or at prevailing market rates. For a limited number of our customers, particularly in the oil and gas proppants end market, we sell under long-term, competitively-bid contracts. Certain of these long-term contracts are at fixed prices that are presently below market, and these below-market prices are adjustable only for certain cost increases. Sales under these long-term contracts collectively accounted for 18% of sales in 2010. Although these long-term contracts would provide us with some downside protection if there were to be a significant reduction in demand for frac sand, we believe that there is, and that there will continue to be, sufficient demand for frac sand such that we would not experience an adverse effect if these long-term contracts are not renewed or are canceled. Historically we have not entered into long-term contracts with our customers in the industrial and specialty products end markets because of the high cost to our customers of switching providers. We typically renegotiate our price agreements with these customers annually.
The following table provides more detail regarding the end markets that we serve and our significant customer relationships in those markets:
| End Market |
Primary Customers | |
| Oil and gas proppants |
Schlumberger Limited, Halliburton Company, Nabors Industries Ltd., Weatherford International Ltd., Baker Hughes, Inc. | |
| Glass |
Owens-Illinois, Inc., Owens Corning, Saint-Gobain Glass | |
| Building products |
Owens Corning, BASF Corporation | |
| Foundry |
Porter Warner Industries, LLC, Thyssen Krupp Waupaca | |
| Chemicals |
PPG Industries, Occidental Chemical Corporation | |
| Fillers and extenders |
The Sherwin-Williams Company, Dow Corning Corporation |
78
Table of Contents
Production
Our 13 production facilities are located primarily in the eastern half of the United States, with operations in Alabama, Illinois, Louisiana, Michigan, Missouri, New Jersey, Oklahoma, Pennsylvania, South Carolina, Tennessee, Texas, Virginia and West Virginia. The following map shows the locations of our facilities.
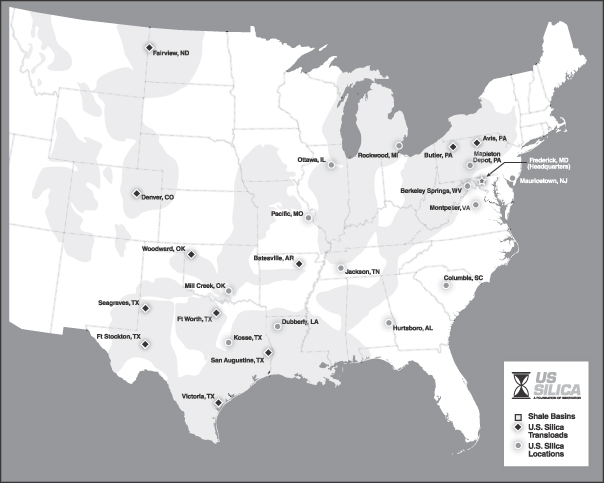
We conduct only surface mining operations and do not operate any underground mines. Mining methods at our facilities include conventional hard rock mining, hydraulic mining, surface or open-pit mining of loosely consolidated silica deposits and dredge mining. Hard rock mining involves drilling and blasting in order to break up sandstone into sizes suitable for transport to the processing facility by truck or conveyer. Hydraulic mining involves spraying high-pressure water to break up loosely consolidated sandstone at the mine face. Surface or open-pit mining involves using earthmoving equipment, such as bucket loaders, to gather silica deposits for processing. Lastly, dredging involves gathering silica deposits from mining ponds and transporting them by slurry pipelines for processing. We may also use slurry pipelines in our hydraulic and open-pit mining efforts to expedite processing. Silica mining and processing typically has less of an environmental impact than the mining and processing of other minerals, in part because it uses fewer chemicals.
Our processing plants are equipped to receive the mined sand, wash away impurities, eliminate oversized or undersized particles and remove moisture through a multi-stage drying process. Each of our facilities operates year-round, typically in shift schedules designed to optimize facility utilization in accordance with market
79
Table of Contents
demand. Our facilities receive regular preventative maintenance, and we make additional capital investments in our facilities as required to support customer volumes and internal performance goals.
In connection with expanding our presence in the oil and gas proppants end market, we are in the process of constructing a facility to produce resin-coated sand for use in the hydraulic fracturing process. In advance of opening that facility, we are negotiating a tolling agreement with a third party whereby we will ship sand processed at our facilities to a third-party facility to be coated in resin. The resin-coated sand will then be shipped back to us to be sold to customers.
Quality Control
We maintain a standard of excellence through our ISO 9001-registered quality systems at our mining and processing facilities. We use automated process control systems that efficiently manage the majority of the mining and processing functions, and we monitor the quality and consistency of our products by conducting hourly tests throughout the production process to detect variances. We generally test each customer load prior to shipment, and all of our major facilities operate a testing laboratory to evaluate and ensure the quality of our products and services. We also provide customers with documentation verifying that all products shipped meet customer specifications. These quality assurance functions ensure that we deliver quality products to our customers and maintain customer trust and loyalty.
In addition, we have certain company-wide quality control mechanisms. We maintain a company-wide quality assurance database that facilitates easy access and analysis of product and process data from all plants. We also have a fully staffed and equipped corporate laboratory that provides critical technical expertise, analytical testing resources and application development to promote product value and cost savings. The lab consists of four departments: a foundry lab, a paint and coatings lab, an analytical lab and a minerals-processing lab. The foundry lab is fully equipped for analyzing foundry silica based on grain size distribution, acidity, acid demand value and turbidity, which is a measure of silica cleanliness. The paint and coatings lab provides formulation, application, and testing of paints, coatings and grouts for end use in fillers and extenders as well as building products. The analytical lab performs various analyses on products for quality control assessment. The minerals-processing lab models plant production processes to test variations in deposits and improve our ability to meet customer requirements, and also performs some limited testing of our frac sand products to verify that they meet API size and crush specifications.
Distribution
We ship our commercial silica products direct to our customers by truck, rail, ship or barge. Generally, we utilize trucks for shipments of 200 miles or less from our plant sites and to distribute our bagged products. Given the weight-to-value ratio of most of our products, the majority of our shipments outside this 200-mile radius are by rail. We frequently utilize rail-truck transfer stations to deliver our products to the oil and natural gas industry when this method of transportation provides us with lower delivery costs to specific customers or regions. We are continuously looking to increase the number of available transload points to which we have access. When cost effective, we also occasionally ship products by barge or ship, both domestically and internationally. All three methods of shipping are typically performed with equipment owned by third parties. Both we and our customers lease a significant number of railcars for shipping purposes, as well as to facilitate the short-term storage of our products, particularly our frac sand products. The railcar leasing market is increasingly tight due to rising demand, and we expect to require additional rail cars as we continue to expand our commercial silica production. We have added 200 railcars to our leased fleet in the fourth quarter of 2011 and are negotiating additional leases. We believe that we will have access to a sufficient supply of railcars to meet our needs for the upcoming year.
For some of our high-margin, finer ground commercial silica and other specialty products such as calcined kaolin clay, we can effectively distribute our products nationally and, in some cases, internationally. These sales are typically made through distributors and are shipped by rail for North American locations and by barge or ship for international locations.
80
Table of Contents
Our Reserves
We believe we have a broad and high-quality mineral reserves base due to our strategically located mines and facilities. “Reserves” are defined by SEC Industry Guide 7 as that part of a mineral deposit which could be economically and legally extracted or produced at the time of the reserve determination. Industry Guide 7 divides reserves between “proven (measured) reserves” and “probable (indicated) reserves” which are defined as follows:
| • | Proven (measured) reserves. Reserves for which (1) quantity is computed from dimensions revealed in outcrops, trenches, workings or drill holes; grade and/or quality are computed from the results of detailed sampling and (2) the sites for inspection, sampling and measurement are spaced so closely and the geologic character is so well defined that size, shape, depth and mineral content of reserves are well-established. |
| • | Probable (indicated) reserves. Reserves for which quantity and grade and/or quality are computed from information similar to that used for proven (measured) reserves, but the sites for inspection, sampling, and measurement are farther apart or are otherwise less adequately spaced. The degree of assurance, although lower than that for proven (measured) reserves, is high enough to assume continuity between points of observation. |
We categorize our reserves as proven or probable in accordance with these SEC definitions. We estimate that we had a total of approximately 283 million tons of proven and probable recoverable mineral reserves as of December 31, 2010. The quantity and nature of the mineral reserves at each of our properties are estimated by our internal geologists and mining engineers. Our internal geologists and engineers update our reserve estimates annually, making necessary adjustments for operations at each location during the year and additions or reductions due to property acquisitions and dispositions, quality adjustments and mine plan updates. We review these estimates on a periodic basis with John T. Boyd Company, an independent third party, to assure their reasonableness. Before acquiring new reserves, we perform surveying, drill core analysis and other tests to confirm the quantity and quality of the acquired reserves. In some instances, we acquire the mineral rights to reserves without actually taking ownership of the properties.
Description of Deposits
The following is a description of the nature of our silica and aplite deposits for each of our reserve or deposit locations:
Ottawa, Illinois
The deposit has a minimum silica (SiO2) content of 99%. The controlling attributes are iron (Fe2O3) content and grain size distribution. Iron is concentrated near the surface, where orange iron staining is evident and also increases where the bottom contact becomes concentrated in iron pyrite. Maximum average full face iron content is 0.045%. The deposit tends to run a coarser grain size distribution in top half of deposit.
Mill Creek, Oklahoma
The deposit has a minimum silica (SiO2) content of 99%. The controlling attributes are iron (Fe2O3) content, calcium (CaO) and grain size distribution. Multiple faces are exposed to average out variability in grain size and iron. The sand/overburden contact is occasionally concentrated in CaO, and any sand with greater than 0.30% CaO is removed during the overburden removal process. Sand with iron greater than 0.025% is not mined.
Pacific, Missouri
The deposit has a minimum silica (SiO2) content of 99%. The controlling attributes are iron (Fe2O3) and calcium (CaO). Calcium can be concentrated at upper sand contact with overlying carbonate cap rock. This enriched calcium zone is known from drill sample results and is stripped during the overburden removal process. Average full mining face washed sand samples are less than 0.03% iron and 0.05% calcium.
81
Table of Contents
Berkeley Springs, West Virginia
The deposit has a minimum silica (SiO2) content of 99%. The controlling attribute is iron (Fe2O3). Ore that is higher than 0.06% iron is not mined. Ore less than 0.06% iron is mined and blended for feed to plant.
Mapleton Depot, Pennsylvania
The deposit has a minimum silica (SiO2) content of 99%. The controlling attribute is iron (Fe2O3). Ore that is higher than 0.06% iron is not mined. Ore less than 0.06% iron is mined and blended for feed to plant.
Kosse, Texas
The deposit has a minimum silica (SiO2) content of 99%. The controlling attributes are iron content (Fe2O3) for kaolin and sand and size distribution for sand. Up to three different pits are mined at any one time to assure consistency of ore and to smooth out variability of attributes. Maximum sand irons are 0.045% and clay irons are 1.05%.
Mauricetown, New Jersey
The deposit has a minimum silica (SiO2) content of 99%. There is no critical attribute in the mining of this deposit other than that occasional zones high in clay are avoided in the course of dredge mining.
Columbia, South Carolina
The deposit has a minimum silica (SiO2) content of 99%. The controlling attributes are iron content (Fe2O3) and percentage of clay/slimes. Clay content increases at depth and generally the pit bottom follows a marker bed at 250-foot elevation where clay content is in excess of 11%. Sand having iron values greater than 0.03% are avoided and not mined.
Montpelier, Virginia
Montpelier produces alumina sands (aplite) from an andesine anorthosite, which intruded into the Sabot Gneiss, a Precambrian amphibolite. The ore body is characterized as a dome-like structure and comprised of two general phases: a coarse-grained, non-foliated phase and a granulated, medium-grained, foliated phase.
The deposit is variable in its geologic nature and contains masses of host rock (consisting of granite gneiss, biotite gneiss and amphibolites) along with occasional dikes. The deposit is highly weathered and soft near the surface. Hardness and strength increase with depth.
Aplite is used as a flux agent in glass making and is sold to the same end markets and used in the same processes and in a similar manner as our silica product.
Aplite ore (Andesine Feldspar) deposit is intermixed with an assemblage of other minerals that must be separated out to make an acceptable product. The controlling attributes are titanium (TiO2), aluminum (AI2O3), iron (Fe2O3) and phosphorous (P2O5). Ore is blended from multiple faces to produce a product generally at 21% AI2O3, 0.25% Fe2O3, 0.11% TiO2, and 0.55% P2O5.
Rockwood, Michigan
The deposit has a minimum silica (SiO2) content of 99%. The controlling attribute is iron content (Fe2O3). Mineable sand must have less than 0.01% Fe2O3.
82
Table of Contents
Jackson, Tennessee
The deposit has a minimum silica (SiO2) content of 99%. The controlling attribute of iron (Fe2O3) content is managed through keeping clay overburden from intermixing with the sand and maintaining adequate washing of sand in the wet processing of the sand.
Dubberly, Louisiana
The deposit has a minimum silica (SiO2) content of 99%. The controlling attributes are iron (Fe2O3) content and grain size distribution. Mining full-face average for iron is 0.045%. The grain size distribution averages greater than 25% plus 50 mesh. Fine and coarse areas are blended to meet the grain size average.
Batesville, Arkansas
The deposit has a minimum silica (SiO2) content of 99%. The controlling attribute is iron (Fe2O3) content. Deposit has two horizons; a low iron horizon where sand has less than 0.009% Fe2O3 and a regular iron horizon where sand has greater than 0.009% Fe2O3.
Hurtsboro, Alabama
The deposit has a minimum silica (SiO2) content of 99%. The controlling attribute is grain size distribution. Sand reserves are located on the crests of rolling hills and mining occurs from multiple pits and faces within pits to assure optimum grain size distribution is available to meet the market product mix.
Sparta, Wisconsin
The deposit has minimum silica (SiO2) content of 99%. The controlling attributes are sand grain crush strength and size distribution. A thin layer of silt overlies the deposit that ranges between 50 to 100 feet thick. The deposit is unconsolidated, well sorted and falls predominantly within the 20/70 grain size distribution.
Mineral Rights
The mineral rights and access to mineral reserves for the majority of our operations are secured through land that is owned in fee. There are no underlying agreements and/or royalties associated with these lands. The operations in this category include: Berkeley Springs, Dubberly, Jackson, Kosse, Mauricetown, Montpelier, Ottawa, Pacific, Batesville, Rockwood and Sparta.
The mineral rights and access to mineral reserves at our Mill Creek operation are a combination of land owned in fee that includes a non-participating royalty payment of $0.11 per saleable ton that was contractually negotiated with and paid to the original sellers of the property that covers 95% of the reserves and a lease agreement on one property that involves an annual minimum payment of $50,000 and a production royalty payment of $0.55 per saleable ton on the remaining 5% of reserves.
The Columbia operation mineral reserves and rights are secured under a long-term mineral lease. The lease expires in 2033 and includes an annual minimum payment of $175,000 and a production royalty of 5.5% of the gross revenue.
The Hurtsboro operation mineral reserves and rights are secured under two mineral leases. The majority of the reserves are under a long-term lease that expires in 2019 and includes an annual minimum payment of $8,000 and a production royalty payment of 3% of weighted average selling price. The second mineral lease expires in 2013 and includes an annual minimum payment of $15,000 and a production royalty of 3% of the weighted average selling price. All reserves will be mined from the property prior to the expiration of lease in 2013. The
83
Table of Contents
mineral lease that expires in 2019 has been renewed in the past, and it is expected that if mining is still occurring on this property we will have no problem negotiating an extension of this lease.
The Mapleton Depot operation mineral reserves and rights are secured under two long-term mineral leases that expire in 2025 but may continue thereafter on a year-to-year basis if mining is still occurring. Annual minimums are $1,000, and production royalty payments are either 6.5% of free on board pit price or 0.255 cents per mined ton, whichever is higher.
None of our operations are on government land and, accordingly, we do not have any mineral rights or associated mining claims.
84
Table of Contents
Summary of Reserves
The following table provides information on each of our 13 production facilities and a currently undeveloped site in Batesville, Arkansas, as of December 31, 2010. The property we recently acquired in Sparta, Wisconsin is not included in the table below because we acquired it after that date and have not yet had a reserve analysis performed for that property. Included is the location and area of the facility; the type, amount and ownership status of its reserves; and the primary end markets that it serves.
| Mine/Plant Location |
Owned/Leased |
Area | Proven Reserves |
Probable Reserves |
Combined Proven and Probable Reserves |
2010 Production |
Primary End Markets Served | |||||||||||||||||
| (in acres) | (amounts in thousands) | |||||||||||||||||||||||
| Ottawa, IL |
Owned | 1,781 owned | 79,890 | 40,800 | 120,690 | 2,001 | Oil and gas proppants, glass, chemicals and foundry | |||||||||||||||||
| Mill Creek, OK |
Owned | |
2,214 owned 15 mineral |
|
— | 21,865 | 21,865 | 1,121 | Oil and gas proppants, glass, foundry and building products | |||||||||||||||
| Pacific, MO |
Owned | 524 owned | 15,956 | 7,994 | 23,950 | 412 | Oil and gas proppants, glass, foundry and fillers and extenders | |||||||||||||||||
| Berkeley Springs, WV |
Owned | 4,435 owned | 3,820 | — | 3,820 | 305 | Glass, building products and fillers and extenders | |||||||||||||||||
| Mapleton Depot, PA |
Owned/Leased | |
1,761 owned 194 mineral 98 access |
|
6,662 | 10,000 | 16,662 | 566 | Glass and building products | |||||||||||||||
| Kosse, TX(1) |
Owned | |
960 owned 118
mineral |
|
13,053 | — | 13,053 | 229 | Glass, building products and fillers and extenders | |||||||||||||||
| Mauricetown, NJ |
Owned | 1,279 owned | 3,179 | 9,750 | 12,929 | 231 | Filtration, foundry and building products | |||||||||||||||||
| Columbia, SC |
Leased |
|
648 lease 204 owned |
|
5,967 | 1,680 | 7,647 | 340 | Glass, building products and fillers and extenders | |||||||||||||||
| Montpelier, VA(2) |
Owned | 824 owned | — | 14,820 | 14,820 | 172 | Glass and building products | |||||||||||||||||
| Rockwood, MI |
Owned | 830 owned | 5,140 | — | 5,140 | 168 | Glass and building products | |||||||||||||||||
| Jackson, TN |
Owned | 132 owned | 875 | 725 | 1,600 | 126 | Fiberglass and building products | |||||||||||||||||
| Dubberly, LA |
Owned | |
356 owned 25 tailings |
|
4,894 | — | 4,894 | 175 | Glass, foundry and building products | |||||||||||||||
| Batesville, AR |
Owned | 477 owned | — | 34,732 | 34,732 | — | — | |||||||||||||||||
| Hurtsboro, AL |
Leased | |
117 owned 1,108 mineral |
|
1,578 | — | 1,578 | 116 | Foundry and building products | |||||||||||||||
|
|
|
|
|
|
|
|
|
|||||||||||||||||
| Total |
141,014 | 142,366 | 283,380 | 5,962 | ||||||||||||||||||||
| (1) | Kosse’s reserves are comprised of 9,136 tons of silica (70.0%) and 3,917 tons of kaolin clay (30.0%). |
| (2) | Montpelier’s reserves are comprised entirely of the mineral aplite. |
85
Table of Contents
Our Facilities
The following is a detailed description of our 13 production facilities and our currently undeveloped sites in Batesville, Arkansas and Sparta, Wisconsin.
Ottawa, Illinois
Our surface mines in Ottawa use natural gas and electricity to produce whole grain and ground silica through a variety of mining methods, including hard rock mining, hydraulic mining and dredging. The reserves are part of the St. Peter Sandstone deposit that stretches north-south from Minnesota to Missouri and east-west from Illinois to Nebraska and South Dakota. The facility is located approximately 80 miles southwest of Chicago and is accessible by major highways including U.S. Interstate 80.
We acquired the Ottawa facility in 1987 by merger with the Ottawa Silica Company, which had historically used the property to produce whole grain and ground silica for customers in industrial and specialty products end markets. Since acquiring the facility we have renovated and upgraded its production capabilities to enable it to produce multiple products through various processing methods, including washing, hydraulic sizing, grinding, screening and blending. These production techniques allow the Ottawa facility to meet a wide variety of focused specifications on product composition from customers. As such, the Ottawa facility services multiple end markets, such as glass, building products, foundry, fillers and extenders, chemicals and oil and gas proppants. In November 2009, we expanded the frac sand capacity of this facility by 500,000 tons, and during the fourth quarter of 2011 we completed the addition of another 900,000 tons of frac sand capacity. Once the product is appropriately processed, it is shipped either in bulk or packaged form by rail by either the CSX Corporation or the BNSF Railway Company (via the Illinois Railway short line), truck or barge through terminals located on the plant site and at a leased site approximately three miles from the plant.
Mill Creek, Oklahoma
Our surface mines in Mill Creek use natural gas and electricity to produce whole grain, ground and fine ground silica through a variety of mining methods, including hard rock and hydraulic mining. The reserves are part of the Oil Creek formation in south central Oklahoma. The facility is located approximately 100 miles southeast of Oklahoma City and is accessible by major highways including U.S. Interstate 35.
We acquired the Mill Creek facility in 1987 by merger with the Pennsylvania Glass Sand Corporation, which had historically used the property to produce whole grain silica for customers in industrial and specialty products end markets. Since acquiring the facility we have renovated and upgraded its production capabilities to enable it to produce multiple products through various processing methods, including hydraulic sizing, fluid bed drying, grinding and scalping. These production techniques allow the Mill Creek facility to meet a wide variety of focused specifications on product composition from customers. As such, the Mill Creek facility services multiple end markets, such as glass, foundry, fillers and extenders, building products and oil and gas proppants. Once the product is appropriately processed, it is packaged in bulk and shipped either by rail by BNSF Railway Company or by truck.
Pacific, Missouri
Our surface mines at the Pacific facility use natural gas and electricity to produce whole grain, ground and fine ground silica through a variety of mining methods, including hard rock and hydraulic mining. The reserves are part of the St. Peter Sandstone deposit that stretches north-south from Minnesota to Missouri and east-west from Illinois to Nebraska and South Dakota. The facility is located approximately 50 miles southwest of St. Louis and is accessible by major highways including U.S. Interstate 44.
We acquired the Pacific facility in 1987 by merger with the Pennsylvania Glass Sand Corporation, which had historically used the property to produce whole grain silica for customers in industrial and specialty products
86
Table of Contents
end markets. Since acquiring the facility we have renovated and upgraded its production capabilities to enable it to produce multiple products through various processing methods, including hydraulic sizing, fluid bed drying, grinding, dry screening, classifying and microsizing. In August 2010, we expanded this facility’s processing capabilities to include the processing of frac sand. These production techniques allow the Pacific facility to meet a wide variety of focused specifications on product composition from customers. As such, the Pacific facility services multiple end markets, such as glass, foundry, fillers and extenders and oil and gas proppants. Once the product is appropriately processed, it is packaged in bulk and shipped either by rail directly by Union Pacific Corporation and through open switching on the same line by BNSF Railway Company or by truck.
Berkeley Springs, West Virginia
Our surface mines at the Berkeley Springs facility use natural gas and electricity to produce whole grain, ground and fine ground silica and florisil through hard rock mining. The reserves are part of the Oriskany deposit along the Warm Springs Ridge in western West Virginia. The facility is located approximately 100 miles northwest of Baltimore and is accessible by major highways including U.S. Interstate 70.
We acquired the Berkeley Springs facility in 1987 by merger with the Pennsylvania Glass Sand Corporation, which had historically used the property to produce whole grain silica for customers in industrial and specialty products end markets. Since acquiring the facility we have renovated and upgraded its production capabilities to enable it to produce multiple products through various processing methods, including primary, secondary and tertiary crushing, grinding, flotation, de-watering, fluid bed drying, mechanical screening and rotary drying processing. These production techniques allow the Berkeley Springs facility to meet a wide variety of focused specifications from customers producing specialty epoxies, resins and polymers, geothermal energy equipment and fiberglass. As such, the Berkeley Springs facility services multiple end markets, such as glass, building products, foundry, chemicals and fillers and extenders. Once the product is appropriately processed, it is packaged in bulk and shipped by rail by the CSX Corporation or truck.
Rockwood, Michigan
Our surface mines at the Rockwood facility use natural gas and electricity to produce whole grain silica. The reserves are part of the Sylvania deposit and are notable for their low iron content, making them particularly valuable to customers producing specialty glass for architectural or alternative energy applications. The facility is located approximately 30 miles southwest of Detroit and is accessible by major highways including U.S. Interstate 75.
We acquired the Rockwood facility in 1987 by merger with the Ottawa Silica Company, which had historically used the property to produce whole grain and ground silica for customers in industrial and specialty products end markets. Since acquiring the facility we have renovated and upgraded its production capabilities to enable it to produce multiple products through various processing methods, including fluid bed drying, dry screening and classifying. These production techniques allow the Rockwood facility to meet a wide variety of focused specifications on product composition from customers. As such, the Rockwood facility services multiple end markets, such as glass, building products, oil and gas proppants and chemicals. During the fourth quarter of 2011, we completed the addition of 250,000 tons of annual frac sand capacity at the Rockwood facility by installing an entirely new processing circuit to run on a continuous basis alongside our existing state-of-the-art low-iron silica circuit. Once the product is appropriately processed, it is packaged in bulk and shipped by rail by the Canadian National Railway or truck.
Mapleton Depot, Pennsylvania
Our surface mines in Mapleton Depot use natural gas, fuel oil and electricity to produce whole grain silica through hard rock mining. The reserves are part of the Ridgely Sandstone member of the Oriskany deposit in central Pennsylvania. The facility is located approximately 40 miles northwest of Harrisburg and is accessible by major highways including U.S. Interstates 99, 80 and 76.
87
Table of Contents
We acquired the Mapleton Depot facility in 1987 by merger with the Pennsylvania Glass Sand Corporation, which had historically used the property to produce whole grain silica for customers in industrial and specialty products end markets. Since acquiring the facility, we have renovated and upgraded its production capabilities to enable it to produce multiple products through various processing methods, including hydraulic sizing, fluid bed drying, scalping and a low iron circuit. These production techniques allow the Mapleton Depot facility to meet a wide variety of focused specifications on product composition from customers. As such, the Mapleton Depot facility services multiple end markets, such as glass, specialty glass, building products and recreation. Once the product is appropriately processed, it is packaged in bulk and shipped either by rail by Norfolk Southern Corporation or by truck.
Kosse, Texas
Our surface mines in Kosse use natural gas and electricity to produce whole grain silica and kaolin clay through scraping mining. The reserves are part of the Simsboro member of the Rockdale deposit in central Texas. The facility is located approximately 90 miles south of Dallas and is accessible by major highways including U.S. Interstates 45 and 35.
We acquired the Kosse facility in 1987 by merger with the Ottawa Silica Company, which had historically used the property to produce whole grain silca and kaolin clay for customers in industrial and specialty products end markets. Since acquiring the facility, we have renovated and upgraded its production capabilities to enable It to produce multiple products through various processing methods, including washing, hydraulic sizing, fluid bed drying, dry screening, centrifuging and spray drying. These production techniques allow the Kosse facility to meet a wide variety of focused specifications on product composition from customers. As such, the Kosse facility services multiple end markets, such as glass, building products, fillers and extenders and recreation. Once the product is appropriately processed, it is packaged in bag or bulk and shipped either by rail by Union Pacific Railroad or by truck.
Mauricetown, New Jersey
Our surface mines near the Mauricetown facility use natural gas, fuel oil and electricity, to produce whole grain silica through dredge mining. The reserves are mined from the Maurice River and are similar to those found in the Cohansey, Bridgeton and Cape May deposits. The facility is located approximately 50 miles south of Philadelphia and is accessible by major highways including U.S. Interstate 295 and state Highway 55.
We acquired the Mauricetown facility in 1999 from Unimin Corporation, which had historically used the property to produce whole grain silica for customers in industrial and specialty products end markets. Since acquiring the facility, we have renovated and upgraded its production capabilities, including the construction of a new wet processing plant, to enable it to produce multiple products through various processing methods, including washing, hydraulic sizing, fluid bed drying, rotary drying and scalping. These production techniques allow the Mauricetown facility to meet a wide variety of focused specifications on product composition from customers. As such, the Mauricetown facility services multiple end markets, such as foundry, filtration, building products and recreation. Once the product is appropriately processed, it is packaged in bags or bulk and shipped either by rail by Winchester & Western Railroad or by truck.
Columbia, South Carolina
Our surface mines in Columbia use natural gas, fuel oil and electricity to produce whole grain, ground and fine ground silica through dune mining. The reserves are part of the Tuscaloosa deposit near central South Carolina. The facility is located approximately 10 miles west of Columbia and is accessible by major highways including U.S. Interstates 26 and 20.
88
Table of Contents
We acquired the Columbia facility in 1987 by merger with the Pennsylvania Glass Sand Corporation, which had historically used the property to produce whole grain silica for customers in industrial and specialty products end markets. Since acquiring the facility, we have renovated and upgraded its production capabilities to enable it to produce multiple products through various processing methods, including hydraulic sizing, fluid bed drying, scalping and grinding. These production techniques allow the Columbia facility to meet a wide variety of focused specifications on product composition from customers. As such, the Columbia facility services multiple end markets, such as glass, building products, fillers and extenders, filtration and oil and gas proppants. Once the product is appropriately processed, it is bagged or shipped in bulk either by rail by Norfolk Southern Corporation or by truck.
Montpelier, Virginia
Our surface mines in Montpelier use natural gas, fuel oil and electricity to produce mineral aplite through hard rock mining. The reserves are part of igneous rock deposits that are unique to this location. The facility is located approximately 20 miles northwest of Richmond and is accessible by major highways including U.S. Interstates 64 and 95.
We acquired the Montpelier facility in 1993 from The Feldspar Company, which had historically used the property to produce mineral aplite for customers in industrial and specialty products end markets. Since acquiring the facility, we have renovated and upgraded its production capabilities to enable it to produce multiple products through various processing methods, including hydraulic crushing and sizing, washing, fluid bed drying and grinding. These production techniques allow the Montpelier facility to meet a wide variety of focused specifications on product composition from customers. As such, the Montpelier facility services multiple end markets, such as glass, building products and recreation. Once the product is appropriately processed, it is packaged in bulk and shipped either by rail by Norfolk Southern Corporation or CSX Corporation or by truck.
Jackson, Tennessee
Our surface mines in Jackson use natural gas and electricity to produce whole grain, ground and fine ground silica through dredge mining. The reserves are part of the Clairborne deposit, which is part of the Gulf Coastal Plain-Upper Mississippi Embayment. The facility is located approximately 75 miles northeast of Memphis and is accessible by major highways including U.S. Interstate 40.
We acquired the Jackson facility in 1997 from Nicks Silica Company, which had historically used the property to produce whole grain and ground silica for customers in industrial and specialty products end markets. Since acquiring the facility, we have renovated and upgraded its production capabilities, turning it into one of our premier grinding facilities and enabling it to produce multiple products through various processing methods, including rotary drying, screening and grinding.
These production techniques allow the Jackson facility to meet a wide variety of focused specifications on product composition from customers. As such, the Jackson facility services multiple end markets, such as fiberglass, building products, ceramics, fillers and extenders and recreation. Once the product is appropriately processed, it is shipped in bulk by truck.
Dubberly, Louisiana
Our surface mines in Dubberly use natural gas and electricity to produce whole grain silica through dredge mining. The reserves are part of the Sparta deposit, which is part of the Clairborne Group. The facility is located approximately 30 miles east of Shreveport and is accessible by major highways including U.S. Interstate 20 and state Highway 63.
89
Table of Contents
We acquired the Dubberly facility in 1987 by merger with the Ottawa Silica Company, which had historically used the property to produce whole grain silica for customers in industrial and specialty products end markets. Since acquiring the facility, we have renovated and upgraded its production capabilities to enable it to produce multiple products through various processing methods, including screening, washing, rotary drying and conditioning to remove heavy and iron bearing minerals. These production techniques allow the Dubberly facility to meet a wide variety of focused specifications on product composition from customers. As such, the Dubberly facility services multiple end markets, such as glass, foundry and building products. Once the product is appropriately processed, it is bagged or shipped in bulk by truck.
Batesville, Arkansas
Whitebuck is a sandstone deposit with over 34 million tons of probable reserves near the town of Batesville, Arkansas. We acquired the reserves in 2010 from White Buck, LLC. There is no facility on the property and it is not currently permitted. We submitted an application for a permit in October 2011. The deposit has high purity sandstone and can provide a long-term supplement to the reserves at our Mill Creek operations. The reserves are part of the St. Peter Sandstone deposit, which is part of the same formation being mined at our Ottawa and Pacific operations. The property is located approximately 85 miles northeast of Little Rock and is accessible by highways including state Highways 67 and 167.
Hurtsboro, Alabama
Our surface mines in Hurtsboro use propane and electricity, to produce whole grain silica. Sand feed for processing is trucked in from surrounding mine locations. The reserves are part of the Cusseta member of the lower Ripley deposit. The facility is located approximately 75 miles east of Montgomery and is accessible by major highways including U.S. Interstate 85 and state Highway 431.
We acquired the Hurtsboro facility in 1988 from Warrior Sand & Gravel Company, which had historically used the property to produce whole grain silica for customers in industrial and specialty products end markets. Since acquiring the facility, we have renovated and upgraded its production capabilities to enable it to produce multiple products through various processing methods, including trucking in sand from surrounding locations, hydraulic sizing, screening and fluid bed drying. These production techniques allow the Hurtsboro facility to meet a wide variety of focused specifications on product composition from customers. As such, the Hurtsboro facility services multiple end markets, such as foundry, building products and recreation. Once the product is appropriately processed, it is shipped in bulk by truck.
Sparta, Wisconsin
On December 30, 2011, we acquired the deposits in Sparta from Sharon Wagman, following the receipt of a conditional use permit on December 19, 2011 for the development of a new mining and production facility. Sparta City Council reaffirmed this permit on January 3, 2012 after an appeals review. There is currently no facility on the property. The deposit is a high purity reworked Van Oser member of the Jordan sandstone and provides a supplement to the frac sand reserves at our Ottawa operations. The Jordan Sandstone is known for its round grains and superior crush strength properties. The property is located approximately 30 miles northeast of La Crosse, Wisconsin, approximately 120 miles northwest of Madison and is accessible by highways including Interstate 90 and the CP railroad.
Commercial Team
Our commercial team consists of more than 40 individuals responsible for all aspects of our sales process, including pricing, marketing, transportation and logistics, product development and general customer service. This necessitates a highly organized staff and extensive coordination between departments. For example, product development requires the collaboration of our sales team, our production facilities and our corporate laboratory.
90
Table of Contents
Our sales team interacts directly with our customers in determining their needs, our production facilities fulfill the orders and our corporate laboratory is responsible for ensuring that our products meet those needs.
Our commercial team can be divided into four units:
| • | Sales. Our sales team is organized by both region and end market. Domestically, we have an experienced group of regional sales managers underneath a national sales director, along with dedicated team members for the oil and gas proppants and glass end markets. Our oil and gas proppants team is based out of an office in Houston staffed by a petroleum engineer and other experts with in-depth market and technical knowledge. Internationally, we opened our first office abroad in 2011 in Shanghai, which will establish key partnerships with local industry leaders and develop business opportunities across the Asia Pacific region. As we make decisions to enter or expand our presence in certain end markets or regions, we will continue to add dedicated team members to support that growth. |
| • | Marketing. Our marketing team coordinates all of our new and existing customer outreach efforts. This includes producing exhibits for trade shows and exhibitions, manufacturing product overview materials, participating in regional water filtration meetings and other trade associations and managing our advertising efforts in trade journals. |
| • | Transportation and Logistics. Our transportation and logistics team manages over 100,000 domestic and international shipments annually by directing inbound and outbound rail and truck traffic, supervising equipment maintenance, coordinating with rail carriers to ensure equipment availability, ensuring compliance with shipping regulations and strategically planning for future growth. |
| • | Technical. Our technical team is anchored by our corporate laboratory in Berkeley Springs, West Virginia. At this facility, we perform a variety of analyses including: |
| • | analytical chemistry by X-Ray Fluorescence (XRF) and Inductively Coupled Plasma (ICP) spectroscopy; |
| • | particle characterization by sieve, SediGraph, Brunauer, Emmett and Teller (BET) surface area and microscopy; |
| • | ore evaluation by mineral processing, flotation and magnetic separation; |
| • | API frac sand evaluation, including crush resistance; and |
| • | AFS green sand evaluation by various foundry sand tests. |
We utilize these analytical capabilities to develop new product offerings for customers in the solar panels, ceramics and fillers and extenders end markets, among others. Many other product analyses are performed locally at our 13 processing facilities to support plant operations and customer quality requirements.
We also have a variety of other technical competencies including process engineering, equipment design, facility construction, maintenance excellence, environmental engineering, geology and mine planning and development. Effective integration of these capabilities has been a critical component of our business success and has allowed us to establish and maintain an extensive, high-quality silica sand reserve base, maximize the value of our reserves by producing and selling a wide range of high-quality products, optimize processing costs to provide strong value to customers and prioritize operating in a safe and environmentally sustainable manner.
Competition
Both of our reporting segments operate in a highly competitive market that is characterized by a small number of large, national producers and a larger number of small, regional or local producers. According to a USGS report dated January 2011, in 2010, there were 68 producers of commercial silica with a combined 124
91
Table of Contents
active operations in 34 states within the United States. Competition in the industry across both of our reporting segments is based on price, consistency and quality of product, site location, distribution capability, customer service, reliability of supply, breadth of product offering and technical support. As transportation costs are a significant portion of the total cost to customers of commercial silica—in many instances transportation costs can represent more than 50% of delivered cost—the commercial silica market is typically local, and competition from beyond the local area is limited. Notable exceptions to this are the frac sand and fillers and extenders markets, where certain product characteristics are not available in all deposits and not all plants have the requisite processing capabilities, necessitating that some products be shipped for extended distances.
We believe the five leading producers of commercial silica across both of our reporting segments represented in excess of 60% of total industry production in 2009 and we compete with these large, national producers such as Unimin Corporation, Fairmount Minerals, Ltd., Badger Mining Corporation and Cameuse Industrial Sands. Our larger competitors may have greater financial and other resources than we do, may develop technology superior to ours or may have production facilities that are located closer to key customers than ours.
Because the markets for our products are typically local, we also compete with smaller, regional or local producers. For instance, in recent years there has been an increase in the number of small producers servicing the frac sand market due to an increased demand for hydraulic fracturing services. Moreover, as a result of this increased demand, existing or new frac sand producers could add to or expand their frac sand production capacity, thereby increasing competition.
Intellectual Property
Our intellectual property primarily consists of trade secrets, know-how and trademarks, including our name “U.S. Silica” and products such as “OTTAWA WHITE.” We strategically rely on trade secrets, rather than patents, to protect our proprietary processes, methods, documentation and other technologies, as well as certain other business information. Patent protection requires a costly and uncertain federal registration process that would place our confidential information in the public domain. Typically, we utilize trade secrets to protect the formulations and processes we use to manufacture our products and to safeguard our proprietary formulations and methods. We believe we can effectively protect our trade secrets indefinitely through the use of confidentiality agreements and other security measures.
Employees
As of September 30, 2011, we employed a workforce of 685 employees, the majority of whom are hourly wage plant workers living in the areas surrounding our mining facilities. The majority of our hourly employees are represented by labor unions that include the Teamsters, United Steelworkers, Paper Allied-Industrial Chemical & Energy, Glass/Molders/Pottery/Plastics and Laborers. We believe that we maintain good relations with our workers and their respective unions and have not experienced any material strikes or work stoppages since 1987.
The majority of our employees have a tenure with us of approximately 16 years, and we have an annual employee turnover rate of less than 1.0%. We believe this low turnover rate has directly contributed to improved process efficiencies and safety, which in turn help drive cost reductions. We believe our labor rates compare favorably to other mining and manufacturing facilities in the same geographic areas. We maintain workers’ compensation coverage in amounts required by law and have no material claims pending. We also offer all full-time employees a competitive package of employee benefits, which includes medical, dental, life and disability coverage.
Seasonality
Our business is affected to some extent by seasonal fluctuations in weather that impact our production levels and our customers’ business needs. For example, in the second and third quarters, we sell more commercial silica
92
Table of Contents
to our customers in the building products and recreation end markets due to the seasonal rise in construction driven by more favorable weather conditions. Our sales and sometimes our production levels are lower in the first and fourth quarters due to lower market demand and due to our customers in these end markets experiencing slowdowns largely as a result of adverse weather conditions.
Legal Proceedings
In addition to the matter described below, we are subject to various other legal claims and proceedings which arise in the ordinary course of our business, including employment related claims, involving routine claims incidental to our business. Although the outcome of these routine claims cannot be predicted with certainty, we do not believe that the ultimate resolution of these claims will have a material adverse effect on our results of operations, financial condition or cash flows.
Prolonged inhalation of excessive levels of respirable crystalline silica dust can result in silicosis, a disease of the lungs. Breathing large amounts of respirable silica dust over time may injure a person’s lungs by causing scar tissue to form. Crystalline silica in the form of quartz is a basic component of soil, sand, granite and most other types of rock. Cutting, breaking, crushing, drilling, grinding and abrasive blasting of or with crystalline silica containing materials can produce fine silica dust, the inhalation of which may cause silicosis, lung cancer and possibly other diseases including immune system disorders such as scleroderma. Sources of exposure to respirable crystalline silica dust include sandblasting, foundry manufacturing, crushing and drilling of rock, masonry and concrete work, mining and tunneling, and cement and asphalt pavement manufacturing.
Since at least 1975, we and/or our predecessors have been named as a defendant, usually among many defendants, in numerous lawsuits brought by or on behalf of current or former employees of our customers alleging damages caused by silica exposure. Prior to 2001, the number of silicosis lawsuits filed annually against the commercial silica industry remained relatively stable and was generally below 100, but between 2001 and 2004 the number of silicosis lawsuits filed against the commercial silica industry substantially increased. This increase led to greater scrutiny of the nature of the claims filed, and in June 2005 the U.S. District Court for the Southern District of Texas issued an opinion in the former federal silica multi-district litigation remanding almost all of the 10,000 cases then pending in the multi-district litigation back to the state courts from which they originated for further review and medical qualification, leading to a number of silicosis case dismissals across the United States. In conjunction with this and other favorable court rulings establishing “sophisticated user” and “no duty to warn” defenses for silica producers, several states, including Texas, Ohio and Florida, have passed medical criteria legislation that requires proof of actual impairment before a lawsuit can be filed.
As a result of the above developments, the filing rate of new claims against us over the past three years has decreased to below pre-2001 levels, and we were named as a defendant in eighteen, two and ten new silicosis cases filed in 2008, 2009 and 2010, respectively. As of December 31, 2010, there were a total of approximately 146 active silica-related products liability claims pending in which we were a defendant, and, as of January 17, 2012, approximately 3,156 inactive claims. Almost all of the claims pending against us arise out of the alleged use of our silica products in foundries or as an abrasive blast media, and involve various other defendants. We have insurance policies and an indemnity from a former owner that cover certain claims for alleged silica exposure for periods prior to certain dates in 1985 (with respect to the indemnity and certain insurance) and 1986 (with respect to the balance of the insurance). Although the scope of coverage under those policies is currently being litigated, we believe, based on currently available information, they and the indemnity will remain in force.
The silica-related litigation brought against us to date has not resulted in material liability to us. However, we continue to have silica-related products liability claims filed against us, including claims that allege silica exposure for periods for which we have neither insurance nor indemnity coverage. Any such pending or future claims or inadequacies of our insurance coverage or indemnity could have a material adverse effect on our business, reputation or results of operations. For more information regarding silica-related litigation, see “Risk Factors—Risks Related to Our Business—Silica-related health issues and litigation could have a material adverse effect on our business, reputation or results of operations.”
93
Table of Contents
Regulation and Legislation
Mining and Workplace Safety
Federal Regulation
The U.S. Mine Safety and Health Administration (“MSHA”) is the primary regulatory organization governing the commercial silica industry. Accordingly, MSHA regulates quarries, surface mines, underground mines and the industrial mineral processing facilities associated with quarries and mines. The mission of MSHA is to administer the provisions of the Federal Mine Safety and Health Act of 1977 and to enforce compliance with mandatory safety and health standards. MSHA works closely with the Industrial Minerals Association, a trade association in which we have a significant leadership role, in pursuing this mission. As part of MSHA’s oversight, representatives perform at least two unannounced inspections annually for each above-ground facility. To date these inspections have not resulted in any citations for material violations of MSHA standards.
We also are subject to the requirements of the U.S. Occupational Safety and Health Act (“OSHA”) and comparable state statutes that regulate the protection of the health and safety of workers. In addition, the OSHA Hazard Communication Standard requires that information be maintained about hazardous materials used or produced in operations and that this information be provided to employees, state and local government authorities and the public. OSHA regulates the customers and users of commercial silica and provides detailed regulations requiring employers to protect employees from overexposure to silica through the enforcement of permissible exposure limits and the OSHA Hazard Communication Standard.
Internal Controls
We adhere to a strict occupational health program aimed at controlling exposure to silica dust, which includes dust sampling, a respiratory protection program, medical surveillance, training and other components. Our safety program is designed to ensure compliance with the standards of our Occupational Health and Safety Manual and MSHA regulations. For both health and safety issues, extensive training is provided to employees. We have safety committees at our plants made up of salaried and hourly employees. We perform annual internal health and safety audits and conduct semi-annual crisis management drills to test our plants’ abilities to respond to various situations. Health and safety programs are administered by our corporate health and safety department with the assistance of plant Environmental, Health and Safety Coordinators.
Environmental Matters
We and the commercial silica industry are subject to extensive governmental regulation on, among other things, matters such as permitting and licensing requirements, plant and wildlife protection, hazardous materials, air and water emissions and environmental contamination and reclamation. A variety of state, local and federal agencies conduct this regulation.
Federal Regulation
At the federal level, we may be required to obtain permits under Section 404 of the Clean Water Act from the U.S. Army Corps of Engineers for the discharge of dredged or fill material into waters of the United States, including wetlands and streams, in connection with our operations. We also may be required to obtain permits under Section 402 of the Clean Water Act from the EPA (or the relevant state environmental agency in states where the permit program has been delegated to the state) for discharges of pollutants into waters of the United States, including discharges of wastewater or stormwater runoff associated with construction activities. Failure to obtain these required permits or to comply with their terms could subject us to administrative, civil and criminal penalties as well as injunctive relief.
The U.S. Clean Air Act and comparable state laws regulate emissions of various air pollutants through air emissions permitting programs and the imposition of other requirements. These regulatory programs may require
94
Table of Contents
us to install expensive emissions abatement equipment, modify our operational practices and obtain permits for our existing operations, and before commencing construction on a new or modified source of air emissions, such laws may require us to reduce emissions at existing facilities. As a result, we may be required to incur increased capital and operating costs because of these regulations. We could be subject to administrative, civil and criminal penalties as well as injunctive relief for noncompliance with air permits or other requirements of the U.S. Clean Air Act and comparable state laws and regulations.
As part of our operations, we utilize or store petroleum products and other substances such as diesel fuel, lubricating oils and hydraulic fluid. We are subject to applicable requirements regarding the storage, use, transportation and disposal of these substances, including the relevant Spill Prevention, Control and Countermeasure requirements that the EPA imposes on us. Spills or releases may occur in the course of our operations, and we could incur substantial costs and liabilities as a result of such spills or releases, including those relating to claims for damage or injury to property and persons.
Additionally, some of our operations are located on properties that historically have been used in ways that resulted in the release of contaminants, including hazardous substances, into the environment, and we could be held liable for the remediation of such historical contamination. CERCLA, also known as the Superfund law, and comparable state laws impose joint and several liability, without regard to fault or legality of conduct, on classes of persons who are considered to be responsible for the release of hazardous substances into the environment. These persons include the owner or operator of the site where the release occurred and anyone who disposed or arranged for the disposal of a hazardous substance released at the site. Under CERCLA, such persons may be subject to liability for the costs of cleaning up the hazardous substances, for damages to natural resources, and for the costs of certain health studies. In addition, it is not uncommon for neighboring landowners and other third parties to file claims for personal injury and property damage allegedly caused by the hazardous substances released into the environment.
In addition, the Resource Conservation and Recovery Act (“RCRA”) and comparable state statutes regulate the generation, transportation, treatment, storage, disposal and cleanup of hazardous and non-hazardous wastes. Under the auspices of the EPA, the individual states administer some or all of the provisions of RCRA, sometimes in conjunction with their own, more stringent requirements. In the course of our operations, we generate industrial solid wastes that may be regulated as hazardous wastes.
Our operations may also be subject to broad environmental review under the National Environmental Policy Act (“NEPA”). NEPA requires federal agencies to evaluate the environmental impact of all “major federal actions” significantly affecting the quality of the human environment. The granting of a federal permit for a major development project, such as a mining operation, may be considered a “major federal action” that requires review under NEPA. Therefore, our projects may require review and evaluation under NEPA. As part of this evaluation, the federal agency considers a broad array of environmental impacts, including, among other things, impacts on air quality, water quality, wildlife (including threatened and endangered species), historical and archeological resources, geology, socioeconomics and aesthetics. NEPA also requires the consideration of alternatives to the project. The NEPA review process, especially the preparation of a full environmental impact statement, can be time consuming and expensive. The purpose of the NEPA review process is to inform federal agencies’ decision-making on whether federal approval should be granted for a project and to provide the public with an opportunity to comment on the environmental impacts of a proposed project. While NEPA requires only that an environmental evaluation be conducted and does not mandate a result, a federal agency could decide to deny a permit, or impose certain conditions on its approval, based on its environmental review under NEPA, or a third party may challenge the adequacy of a NEPA review.
Federal agencies granting permits for our operations also must consider impacts to endangered and threatened species and their habitat under the Endangered Species Act. We also must comply with and are subject to liability under the Endangered Species Act, which prohibits and imposes stringent penalties for the harming of endangered or threatened species and their habitat. Federal agencies also must consider a project’s
95
Table of Contents
impacts on historic or archeological resources under the National Historic Preservation Act, and we may be required to conduct archeological surveys of project sites and to avoid or preserve historical areas or artifacts.
State and Local Regulation
Because our operations are located in numerous states, we are also subject to a variety of different state and local environmental review and permitting requirements. Some states in which our projects are located or are being developed have state laws similar to NEPA; thus our development of new sites or the expansion of existing sites may be subject to comprehensive state environmental reviews even if it is not subject to NEPA. In some cases, the state environmental review may be more stringent than the federal review. Our operations may require state-law based permits in addition to federal permits, requiring state agencies to consider a range of issues, many the same as federal agencies, including, among other things, a project’s impact on wildlife and their habitats, historic and archaeological sites, aesthetics, agricultural operations and scenic areas. Some states also have specific permitting and review processes for commercial silica mining operations, and states may impose different or additional monitoring or mitigation requirements than federal agencies. The development of new sites and our existing operations also are subject to a variety of local environmental and regulatory requirements, including land use, zoning, building and transportation requirements.
As demand for frac sand in the oil and natural gas industry has driven a significant increase in current and expected future production of commercial silica, some local communities have expressed concern regarding silica sand mining operations. These concerns have generally included exposure to ambient silica sand dust, truck traffic, water usage and blasting. In response, certain state and local communities have developed or are in the process of developing regulations or zoning restrictions intended to minimize dust from getting airborne, control the flow of truck traffic, significantly curtail the amount of practicable area for mining activities, provide compensation to local residents for potential impacts of mining activities and, in some cases, ban issuance of new permits for mining activities. To date, we have not experienced any material impact to our existing mining operations or planned capacity expansions as a result of these types of concerns. We are not aware of any proposals for significant increased scrutiny on the part of state or local regulators in the jurisdictions in which we operate or community concerns with respect to our operations that would reasonably be expected to have a material adverse effect on our business, financial condition or results of operations going forward.
We have a long history of positive engagement with the communities that surround our existing mining operations. We have less than 1% employee turnover and have had no significant strikes in more than 20 years, evidence of the strong relationship we have with our employees. We believe this strong relationship helps foster good relations with the communities in which we operate. Although additional regulatory requirements could negatively impact our business, financial condition and results of operations, we believe our existing operations are less likely to be negatively impacted by virtue of our good community relations.
Planned expansion of our mining and production capacity in new communities could be more significantly impacted by increased regulatory activity. Difficulty or delays in obtaining or inability to obtain new mining permits or increased costs of compliance with future state and local regulatory requirements could have a material negative impact on our ability to grow our business. In an effort to minimize these risks, we continue to be engaged with local communities in order to grow and maintain strong relationships with residents and regulators.
Costs of Compliance
We may incur significant costs and liabilities as a result of environmental, health and safety requirements applicable to our activities. Failure to comply with environmental laws and regulations may result in the assessment of administrative, civil and criminal penalties, imposition of investigatory, cleanup and site restoration costs and liens, the denial or revocation of permits or other authorizations and the issuance of injunctions to limit or cease operations. Compliance with these laws and regulations may also increase the cost of
96
Table of Contents
the development, construction and operation of our projects and may prevent or delay the commencement or continuance of a given project. In addition, claims for damages to persons or property may result from environmental and other impacts of our activities.
The process for performing environmental impact studies and reviews for federal, state and local permits for our operations involves a significant investment of time and monetary resources. We cannot control the permit approval process. We cannot predict whether all permits required for a given project will be granted or whether such permits will be the subject of significant opposition. The denial of a permit essential to a project or the imposition of conditions with which it is not practicable or feasible to comply could impair or prevent our ability to develop a project. Significant opposition and delay in the environmental review and permitting process also could impair or delay our ability to develop a project. Additionally, the passage of more stringent environmental laws could impair our ability to develop new operations and have an adverse effect on our financial condition and results of operations.
97
Table of Contents
Below is a list of the names and ages as of September 30, 2011 of our directors, director designee and executive officers and a brief account of the business experience of each of them.
| Name |
Age | Position | ||||
| Bryan A. Shinn |
50 | President, Chief Executive Officer and Director | ||||
| William A. White |
54 | Chief Financial Officer | ||||
| Brian Slobodow |
43 | Chief Administrative Officer and Director | ||||
| Bradford B. Casper |
37 | Vice President of Strategic Planning | ||||
| R. Dale Lynch |
45 | Vice President of Finance | ||||
| Michael L. Winkler |
47 | Vice President of Operations | ||||
| Robert H. Morrow |
61 | Vice President of National Accounts | ||||
| James I. Manion |
61 | General Counsel | ||||
| Rajeev Amara |
35 | Director | ||||
| Prescott H. Ashe |
44 | Director | ||||
| Charles Shaver |
53 | Chairman of the Board | ||||
| William J. Kacal |
63 | Director Designee | ||||
Executive Officers
Bryan A. Shinn has served as our President since March 2011 and as our Chief Executive Officer and a member of our board of directors since January 10, 2012. Prior to assuming this position, Mr. Shinn was our Senior Vice President of Sales and Marketing from October 2009 to February 2011. Before joining us, Mr. Shinn was employed by the E. I. du Pont de Nemours and Company from 1983 to September 2009, where he held a variety of key leadership roles in operations, sales, marketing and business management, including Global Business Director and Global Sales Director. Mr. Shinn earned a B.S. in mechanical engineering from the University of Delaware. As a result of these and other professional experiences, Mr. Shinn possesses particular knowledge and experience in operations, sales, marketing, management and corporate strategy that strengthen the board’s collective qualifications, skills and experience.
William A. White has served as our Chief Financial Officer since October 2006. Mr. White also served as our Vice President of Finance from January 2006 to July 2011, our Corporate Controller from 1996 to 2005 and held various other positions with us from 1991 to 1996. Before joining us, Mr. White was Corporate Accounting Manager at Union Carbide Corporation from 1985 to 1991 and worked at a regional Certified Public Accounting firm from 1980 to 1985. Mr. White earned a B.B.A. from Marshall University and is a licensed Certified Public Accountant in West Virginia.
Brian Slobodow has served as a member of our board of directors since March 2011 and as our Chief Administrative Officer since January 10, 2012. Prior to assuming this position, Mr. Slobodow served as our Chief Executive Officer from March 2011 to January 10, 2012, when he reduced his own responsibilities due to personal health reasons. In his role as our Chief Administrative Officer, Mr. Slobodow will focus his efforts on talent management, information technology, regulatory affairs, procurement and the implementation of process excellence throughout our company. Before joining us, Mr. Slobodow was President and Chief Operating Officer of Neways Worldwide, a portfolio company of Golden Gate Capital, from May 2007 to March 2011, held numerous positions at Johnson & Johnson Consumer Companies, Inc. from 2003 to May 2007, including Vice President, Global Supply Chain and served as a management consultant for A.T. Kearney from 1995 to 2003. Mr. Slobodow earned a B.S. in industrial and manufacturing engineering from the University of Rhode Island and an M.B.A. from the M.I.T. Sloan School of Management. As a result of these and other professional experiences, Mr. Slobodow possesses particular knowledge and experience in operations, management, corporate strategy, organizational design and private equity management that strengthen the board’s collective qualifications, skills and experience.
98
Table of Contents
Bradford B. Casper has served as our Vice President of Strategic Planning since May 2011. Before joining us, Mr. Casper was at Bain & Company, Inc., where he held various positions from 2002 to May 2011 in the United States, Australia and Hong Kong, most recently serving as a Principal from July 2010 to May 2011. Mr. Casper earned a B.S. in accounting from the University of Illinois at Urbana-Champaign and an M.B.A. from the Wharton School at the University of Pennsylvania.
R. Dale Lynch has served as our Vice President of Finance since July 2011. Before joining us, Mr. Lynch worked as a consultant from April 2010 to July 2011, served as Executive Vice President of Finance for Allied Capital Corporation from 2004 to April 2010 and held various investment banking and research positions with Lehman Brothers from 1997 to 2004 and Merrill Lynch from 1989 to 1994. Mr. Lynch earned a B.S. in accounting from The Pennsylvania State University and an M.B.A. from the University of Chicago Booth School of Business.
Michael L. Winkler has served as our Vice President of Operations since June 2011. Before joining us, Mr. Winkler was Vice President of Operations for Campbell Soup Company from August 2007 to June 2011 and held various positions with Mars Inc. from 1996 to August 2007, including Plant Manager—Columbus Plant and Director of Industrial Engineering. Mr. Winkler earned a B.S. in industrial engineering from the University of Wisconsin—Platteville and an M.B.A. from the University of North Texas.
Robert H. Morrow has served as our Vice President of National Accounts since 2004. Prior to assuming this position, Mr. Morrow was our Vice President of Logistics and Procurement from 1999 to 2004, our Director of Logistics from 1996 to 1999 and held various finance positions with us from 1975 to 1996. Before joining us, Mr. Morrow worked in operations and finance for Stewart Warner Corporation (Hobbs Division) from 1972 to 1975. Mr. Morrow earned a B.A. in business administration from Illinois State University and an M.B.A. from National University.
James I. Manion has served as our General Counsel since 2003. Prior to assuming this position, Mr. Manion was our Assistant General Counsel from 1998 to 2003. Before joining us, Mr. Manion specialized in transactional and corporate law and was a partner in the law firm of Jackson & Kelly from 1988 to 1998. Mr. Manion earned a B.S. in foreign service from Georgetown University and a J.D. from Georgetown University Law Center.
Directors and Director Designee
Rajeev Amara has served as a member of our board of directors since November 2008. Mr. Amara is a Managing Director of Golden Gate Capital, which he joined in 2000. At Golden Gate Capital, Mr. Amara leads the investment effort in the industrials and energy sector. Prior to joining Golden Gate Capital, Mr. Amara worked as an investment banker with the Los Angeles office of Donaldson, Lufkin & Jenrette from 1997 to 1999. With respect to service on public company boards, Mr. Amara has served on the board of directors of Aspect Software, Inc. since January 2011. Mr. Amara earned a B.S. in economics from the Wharton School of the University of Pennsylvania. As a result of these and other professional experiences, Mr. Amara possesses particular knowledge and experience in accounting, finance and capital structure; strategic planning and leadership of complex organizations; and board practices of other major corporations that strengthen the board’s collective qualifications, skills and experience.
Prescott H. Ashe has served as a member of our board of directors since November 2008. Mr. Ashe has been a Managing Director of Golden Gate Capital since 2000. Mr. Ashe has over 20 years of private equity investing experience and has participated in both growth-equity and management buyout transactions with more than $10.0 billion in value. Prior to joining Golden Gate Capital, Mr. Ashe worked at Bain Capital, LLC from 1991 to 2000 and at Bain & Company, Inc. from 1990 to 1991. With respect to service on public company boards, Mr. Ashe has served on the board of directors of Aeroflex Holding Corp. since August 2007, GXS Worldwide, Inc. since June 2010 and Aspect Software, Inc. since May 2003. Mr. Ashe earned a J.D. from Stanford Law School and a B.S. in business administration from the University of California at Berkeley. As a
99
Table of Contents
result of these and other professional experiences, Mr. Ashe possesses particular knowledge and experience in accounting, finance, and capital structure; strategic planning and leadership of complex organizations; and board practices of other major corporations that strengthen the board’s collective qualifications, skills and experience.
William J. Kacal will become a member of our board of directors upon the listing of our common stock on the NYSE. Mr. Kacal currently serves as a director of Integrity Bank SSB (“Integrity Bank”), the National Association of Corporate Directors—Texas Tri-Cities Chapter, Goodwill Industries International (“Goodwill International”), Goodwill Industries of Houston (“Goodwill Houston”) and the Boy Scouts of America—Sam Houston Area Council (“Boy Scouts Houston”). Mr. Kacal serves on the Audit Committee of Integrity Bank, and previously served as the Chairman of the Audit Committee of Goodwill International, Goodwill Houston and the Boy Scouts Houston. Mr. Kacal has over 40 years of accounting and management experience with Deloitte & Touche LLP (“Deloitte”), most recently serving as a partner from 1981 until his retirement in May 2011, and prior to that serving as a member of the audit staff from 1970 to 1981. Mr. Kacal also served as a member of the board of directors from 2004 to May 2011 and as a member of the executive committee from 2004 to 2008. During his time with Deloitte, Mr. Kacal worked extensively with companies in the oil and natural gas industry. Mr. Kacal earned a B.B.A. in Accounting from Texas A&M University and is a licensed Certified Public Accountant in Texas. As a result of these and other professional experiences, Mr. Kacal possesses particular knowledge and experience in accounting, finance and capital structure; strategic planning and leadership of complex organizations; and board practices of other entities that strengthen the board’s collective qualifications, skills and experience.
Charles Shaver has served as a member of our board of directors since July 2011 and is currently our Chairman of the Board. Mr. Shaver has been an Operating Partner of Golden Gate Capital since April 2011. Prior to joining Golden Gate Capital, Mr. Shaver served as the Chief Executive Officer and President of the TPC Group Inc. from 2004 to April 2011, as a Vice President and General Manager for Gentek, Inc. from 2001 to 2004 and as a Vice President and General Manager for Arch Chemicals, Inc. from 2001 to 2004. Mr. Shaver began his career with The Dow Chemical Company, where he held a series of operational and business positions from 1980 to 1996. Mr. Shaver earned a B.S. in chemical engineering from Texas A&M University. As a result of these and other professional experiences, Mr. Shaver possesses particular knowledge and experience in all aspects of corporate functions and company operations that strengthen the board’s collective qualifications, skills and experience.
Family Relationships
There are no family relationships between any of our executive officers or directors.
Corporate Governance
Board Composition
Initially, our board of directors will consist of six members. At any time that our parent LLC owns at least a majority of our then outstanding common stock, the size of our board of directors will be determined by the affirmative vote of at least a majority of our then outstanding common stock. At any time that our parent LLC does not own at least a majority of our then outstanding common stock, the size of our board of directors will be determined by the affirmative vote of our board of directors.
At any time that our parent LLC owns at least a majority of our then outstanding common stock, vacancies will be filled by the affirmative vote of at least a majority of our then outstanding common stock. At any time that our parent LLC does not own at least a majority of our then outstanding common stock, vacancies will be filled by the affirmative vote of our board of directors. The term of office for each director will be until his or her successor is elected at our annual meeting or his or her death, resignation or removal, whichever is earliest to occur. Stockholders will elect directors each year at our annual meeting.
100
Table of Contents
With respect to the roles of Chairman of the Board and Chief Executive Officer, our Corporate Governance Guidelines provide that the roles may be separated or combined, and our board of directors exercises its discretion in combining or separating these positions as it deems appropriate in light of prevailing circumstances. Our board of directors believes that the combination or separation of these positions should continue to be considered as part of the succession planning process. Currently the roles are separated, with Mr. Shaver serving as Chairman. Our Corporate Governance Guidelines provide the flexibility for our board to modify our leadership structure in the future as appropriate. We believe that our business, like many U.S. companies, is well served by this flexible leadership structure.
Upon completion of this offering, our parent LLC will continue to control a majority of the voting power of our outstanding common stock. As a result, we will be a “controlled company” under the NYSE corporate governance standards. As a controlled company, exemptions under the standards will free us from the obligation to comply with certain corporate governance requirements, including the requirements:
| • | that we have a compensation committee or nominating and corporate governance committee; |
| • | that a majority of our board of directors consists of “independent directors,” as defined under the rules of the NYSE; |
| • | that any corporate governance and nominating committee or compensation committee be composed entirely of independent directors with a written charter addressing the committee’s purpose and responsibilities; and |
| • | for an annual performance evaluation of the nominating and corporate governance committee and compensation committee. |
These exemptions do not modify the independence requirements for our Audit Committee, and we intend to comply with the requirements of Rule 10A-3 of the Exchange Act and the rules of the NYSE within the applicable time frame.
Nomination of Directors by Our Parent LLC
In connection with this offering, we will enter into a director designation agreement that will provide for our parent LLC to nominate designees to our board of directors. Any directors appointed pursuant to the Designation Agreement may be removed at the discretion of our parent LLC at any time with or without cause. See “Certain Relationships and Related Party Transactions—Director Designation Agreement.”
Board Committees
Upon completion of this offering, our board of directors will have an Audit Committee and a Compensation and Governance Committee. The composition, duties and responsibilities of these committees are as set forth below. In the future, our board may establish other committees, as it deems appropriate, to assist it with its responsibilities.
| Board Member |
Audit |
Compensation and Governance Committee | ||
| Rajeev Amara |
X | X | ||
| Prescott H. Ashe |
— | — | ||
| William J. Kacal |
Chair | X | ||
| Charles Shaver |
X | Chair | ||
| Bryan A. Shinn |
— | — | ||
| Brian Slobodow |
— | — |
101
Table of Contents
Audit Committee
The Audit Committee will be responsible for, among other matters: (1) appointing, compensating, retaining, evaluating, terminating and overseeing our independent registered public accounting firm; (2) discussing with our independent registered public accounting firm their independence from management; (3) reviewing with our independent registered public accounting firm the scope and results of their audit; (4) approving all audit and permissible non-audit services to be performed by our independent registered public accounting firm; (5) overseeing the financial reporting process and discussing with management and our independent registered public accounting firm the interim and annual financial statements that we file with the SEC; (6) reviewing and monitoring our accounting principles, accounting policies, financial and accounting controls and compliance with legal and regulatory requirements; (7) establishing procedures for the confidential anonymous submission of concerns regarding questionable accounting, internal controls or auditing matters; (8) reviewing and approving related person transactions; and (9) overseeing our enterprise risk management program.
Our board of directors has affirmatively determined that Mr. Kacal meets the definition of “independent director” for purposes of serving on an Audit Committee under Rule 10A-3 of the Exchange Act and the NYSE rules. In addition, our board of directors has determined that Mr. Kacal will qualify as an “audit committee financial expert,” as such term is defined in Item 407(d)(5) of Regulation S-K. Our board of directors will adopt a new written charter for the Audit Committee, which will be available at our corporate website at http://www.ussilica.com after the completion of this offering. Our website is not part of this prospectus.
Compensation and Governance Committee
The Compensation and Governance Committee will be responsible for, among other matters: (1) reviewing key employee compensation goals, policies, plans and programs; (2) reviewing and providing recommendations to the board of directors regarding the compensation of our directors, chief executive officer and other executive officers; (3) reviewing and approving employment agreements and other similar arrangements between us and our executive officers; (4) administration of stock plans and other incentive compensation plans; (5) identifying individuals qualified to become members of our board of directors, consistent with criteria approved by our board of directors; (6) overseeing the organization of our board of directors to discharge the board’s duties and responsibilities properly and efficiently; (7) identifying best practices and recommending corporate governance principles; and (8) developing and recommending to our board of directors a set of Corporate Governance Guidelines and principles applicable to us.
As a controlled company, we will rely upon the exemption from the requirement that we have a separate compensation committee and nominating and corporate governance committee composed entirely of independent directors within one year of the date of this prospectus. Our board of directors will adopt a new written charter for the Compensation and Governance Committee, which will be available on our corporate website at http://www.ussilica.com after the completion of this offering. Our website is not part of this prospectus.
Compensation Committee Interlocks and Insider Participation
For 2010, the board of directors, which consisted of our Chief Executive Officer and persons affiliated with Golden Gate Capital, made all compensation decisions. See “Certain Relationships and Related Party Transactions” for information with respect to transactions with Golden Gate Capital.
No interlocking relationships exist between the members of our board of directors and the board of directors or compensation committee of any other company.
Director Compensation
None of the three directors serving on our board of directors as of December 31, 2010 received compensation as a director during 2010. All directors receive reimbursement for reasonable out-of-pocket
102
Table of Contents
expenses incurred in connection with meetings of the board. Only those non-employee directors who are not affiliated with Golden Gate Capital are eligible to receive compensation from us for their service on our board of directors. Non-employee directors who are not affiliated with Golden Gate Capital will be paid an annual retainer of $70,000, paid in equal quarterly installments. An additional $10,000 will be paid annually for each committee on which a non-employee director serves, and the chairman of the Audit Committee will be paid an additional $35,000 annually for serving in that capacity. Finally, Mr. Kacal will receive options, upon the completion of this offering, to purchase 10,000 shares of our common stock at the initial public offering price. We anticipate that future non-employee directors who are not affiliated with Golden Gate Capital will receive similar option grants.
103
Table of Contents
Compensation Discussion and Analysis
Introduction
This Compensation Discussion and Analysis describes the compensation arrangements we have with our named executive officers as required under the rules of the SEC. The SEC rules require disclosure for the last completed fiscal year for the principal executive officer (our Chief Executive Officer) and principal financial officer (our Chief Financial Officer), regardless of compensation level, and the three most highly compensated executive officers other than the CEO and CFO (collectively, our “NEOs”).
Our entire board of directors currently performs all compensation-related functions. To date, the board of directors has been responsible for the oversight, implementation and administration of all of our executive compensation plans and programs. The board of directors determined all of the components of compensation of the CEO, and, in consultation with the CEO, the compensation of the remaining executive officers.
Upon completion of this offering, we will establish a Compensation and Governance Committee comprised of Messrs. Amara, Kacal and Shaver. We expect that our Compensation and Governance Committee will undertake a substantial review of our existing compensation programs, objectives and philosophy and determine whether such programs, objectives and philosophy are appropriate given that we will have become a public company. In addition, as we gain experience as a public company, we expect that the specific direction, emphasis and components of our executive compensation program will continue to evolve.
Executive Compensation Objectives and Philosophy
The key objectives of our executive compensation programs are (1) to attract, motivate, reward and retain superior executive officers with the skills necessary to successfully lead and manage our business, (2) to achieve accountability for performance by linking annual cash incentive compensation to the achievement of measurable performance objectives, and (3) to align the interests of the executive officers and our equityholders through short-term incentive compensation programs. For our NEOs, these short-term incentives are designed to accomplish these objectives by providing a significant financial correlation between our financial results and their total compensation.
In 2011, a significant portion of the compensation of our NEOs has historically consisted of cash incentive compensation contingent upon the achievement of financial performance metrics. We expect to continue to provide our NEOs with a portion of their compensation in this manner as well as through equity compensation in connection with the 2011 Plan. These two elements of executive compensation are aligned with the interests of our stockholders because the amount of compensation ultimately received will vary with our company’s financial performance. Equity compensation derives its value from our equity value, which is likely to fluctuate based on our financial performance.
We seek to apply a consistent philosophy to compensation for all executive officers. Our compensation philosophy is based on the following core principles:
To Pay for Performance
Individuals in leadership roles are compensated based on a combination of total company and, beginning with 2011, individual performance factors. Total company performance is evaluated in part based on the degree to which pre-established financial objectives are met. Individual performance is evaluated based upon several individualized leadership factors, including:
| • | attaining specific personal performance objectives; |
104
Table of Contents
| • | building and developing individual skills and a strong leadership team; and |
| • | developing an effective infrastructure to support business growth and profitability. |
To Pay Competitively
We are committed to providing a total compensation program designed to retain our high-caliber performers and attract superior leaders to our company. To achieve this goal, we compare our pay practices and overall pay levels with other industrial and mineral organizations and regularly confer with a third-party consulting firm for informational purposes.
To Pay Equitably
We believe that it is important to apply generally consistent guidelines for all executive officer compensation programs. In order to deliver equitable pay levels, we expect that the Compensation and Governance Committee will consider depth and scope of accountability, complexity of responsibility, qualifications and executive performance, both individually and collectively as a team.
In addition to short- and long-term compensation, we have found it important to provide our employees with competitive post-employment compensation. Post-employment compensation consists primarily of severance benefits. We believe that severance benefits are an important component in a well-structured executive officer compensation package, and we have sought to ensure that the package is competitive at the time of hiring. Consistent with all of our salaried employees, our NEOs Messrs. Slobodow, White, Winkler, Lynch and Casper are entitled to the standard company benefits. As a result of his prior employment agreement, Mr. Ulizio was entitled to additional severance prior to the end of his employment with us. See “—Potential Payments Upon Termination and Change of Control.”
Compensation and Governance Committee Review of Compensation
We expect that following this offering, the Compensation and Governance Committee will review compensation elements and amounts for NEOs on an annual basis, at the time of a promotion or other change in level of responsibilities, as well as when competitive circumstances or business needs may require. We occasionally use a third-party consulting firm to assist us with determining compensation levels and expect the Compensation and Governance Committee to continue to do so when appropriate, although we did not use such a firm in connection with determining 2011 compensation levels. We expect that each year our head of human resources will compile a report of benchmark data for executive positions for similar companies, including summaries of base salary, annual cash incentive plan opportunities and awards and long-term incentive award values. We expect that the Compensation and Governance Committee will determine a list of companies that we will benchmark our compensation packages against shortly after completion of this offering and will compare our pay practices and overall pay levels with other leading industrial organizations, and, where appropriate, with non-industrial organizations when establishing our pay guidelines.
We expect that the CEO will provide compensation recommendations to the Compensation and Governance Committee for executives other than himself based on this data and the other considerations mentioned in this Compensation Discussion and Analysis. We expect that the Compensation and Governance Committee will recommend a compensation package for our CEO and determine compensation packages for our other NEOs that are consistent with our compensation philosophy to be strategically positioned above the median of our peer group and competitive with other leading industrial organizations.
We expect that the Compensation and Governance Committee will consider input from our CEO and CFO when setting financial objectives for our incentive plans. We also expect that the Compensation and Governance Committee in determining compensation will consider input from our CEO, with the assistance of our head of
105
Table of Contents
human resources (for officers other than themselves), regarding benchmarking and recommendations for base salary, annual incentive targets and other compensation awards. The Compensation and Governance Committee will likely give significant weight to our CEO’s judgment when assessing each of the other officer’s performance and determining appropriate compensation levels and incentive awards. The members of the board of directors (other than the CEO) meeting in executive session, will determine the compensation of the CEO, including his annual incentive targets.
Elements of Compensation
As discussed throughout this Compensation Discussion and Analysis, the compensation policies applicable to our NEOs are reflective of our pay-for-performance philosophy, whereby a portion of cash compensation is contingent upon achievement of measurable financial objectives, as opposed to current cash and other compensation not directly linked to objective financial performance.
The elements of our compensation program in 2011 were:
| • | base salary; |
| • | equity-based incentives; |
| • | performance-based cash incentives; and |
| • | certain additional executive benefits and perquisites. |
Beginning in 2011 with the establishment of the 2011 Plan, a significant portion of executive compensation was made in the form of grants of equity in order to tie our NEOs’ compensation to enhanced equity value in order to further incentivize our executive officers to enhance equityholder value over the long term. Base salary and performance-based cash incentives are currently the most significant elements of our executive compensation program and, on an aggregate basis, they are intended to substantially satisfy our program’s overall objectives. Typically, the board of directors has sought to set each of these elements of compensation at the same time to enable the board of directors to simultaneously consider all of the significant elements and their impact on total compensation and the extent to which the determinations made will reflect the principles of our compensation philosophy and related guidelines with respect to allocation of compensation among certain of these elements and total compensation. We strive to achieve an appropriate mix between the various elements of our compensation program to meet our compensation objectives and philosophy; however, we do not apply any rigid allocation formula in setting our executive compensation, and we may make adjustments to this approach for various positions after giving due consideration to prevailing circumstances.
Base Salary
We provide a base salary to our executive officers to compensate them for their services during the year and to provide them with a stable source of income. The base salaries for our NEOs in 2011 were established by our board of directors, based in large part on the salaries established for persons holding similar positions with similar companies and by the board of directors’ review of other factors, including:
| • | the individual’s performance, results, qualifications and tenure; |
| • | the job’s responsibilities, pay mix (base salary, annual cash incentives, perquisites and other executive benefits) and similar companies’ compensation practices; and |
| • | our ability to replace the individual. |
Our NEOs’ base salary levels are reviewed annually to determine whether they are near the median range for persons holding similar positions with companies that are similar in size and nature to us. In 2011, the board of directors reviewed, in lieu of conducting formal benchmarking, publicly available information about the compensation of comparable executives within industries that are complimentary to ours, as well as information
106
Table of Contents
regarding compensation from any third-party sources that the board of directors determined to be relevant. Upon concluding its 2011 review, the board of directors approved an increase in Mr. White’s annual base salary from $196,200 to $250,000 based on the broadened scope of his position as well as his tenure and experience with us. This salary increase also more accurately positions Mr. White’s annual salary with chief financial officers in complimentary industries to ours and with companies of similar size and nature to us.
The annual base salaries in effect for each of our NEOs as of December 31, 2011 were as follows:
| Name and Principal Position |
Annual Salary ($) |
|||
| Brian Slobodow, Chief Executive Officer |
375,000 | |||
| William A. White, Chief Financial Officer |
250,000 | |||
| R. Dale Lynch, Vice President of Finance |
300,000 | |||
| Michael L. Winkler, Vice President of Operations |
230,000 | |||
| Bradford B. Casper, Vice President of Strategic Planning |
222,000 | |||
In March 2011, Mr. Slobodow was appointed our new Chief Executive Officer following the resignation of John A. Ulizio. In addition, Mr. Winkler succeeded Mr. Didawick, who retired in March 2011, as our Vice President of Operations. See “—Employment and Other Agreements.” On January 10, 2012, Mr. Slobodow reduced his responsibilities as our Chief Executive Officer to become our Chief Administrative Officer, and Bryan A. Shinn, our President since March 2011, assumed the additional responsibility of Chief Executive Officer.
In the future, we expect that salaries for executive officers will continue to be reviewed annually, as well as at the time of a promotion or other change in level of responsibilities, or when competitive circumstances or business needs may require. As noted above, we expect that the Compensation and Governance Committee will recommend a compensation package that is consistent with our compensation philosophy to be strategically positioned above the median of our to be determined peer group.
Equity-Based Incentives
Our equity award program is the primary vehicle for offering long-term incentives to our NEOs. Our equity-based incentives are granted in the form of options to purchase shares of our common stock, including the grant of options at the commencement of employment for the majority of our current NEOs. We believe that equity grants align the interests of our NEOs with our stockholders, provide our NEOs with incentives linked to long-term performance and create an ownership culture. In addition, the vesting feature of our equity grants contributes to executive retention because this feature provides an incentive to our NEOs to remain in our employ during the vesting period. To date, we have not had an established set of criteria for granting equity awards; instead the board of directors exercises its judgment and discretion, in consultation with our CEO, and considers, among other things, the role and responsibility of the NEO, competitive factors, the amount of stock-based equity compensation already held by the NEO, and the cash-based compensation received by the NEO to determine the level of equity awards that it approves.
In 2011, the board approved and granted stock options to certain members of our management team, including four of our NEOs. All 2011 stock option grants vest and become exercisable over one to four years, and all 2011 stock option grants included two tranches of stock options: Tranche I stock options and Tranche II stock options. The exercise price of the Tranche I options reflected the fair market value of our common stock on the date of grant as determined by our board of directors in reliance upon a number of factors. The exercise price of the Tranche II stock options reflected the fair market value of our common stock on the date of grant as determined by our board of directors and included a premium to such fair market value. Our board of directors granted the Tranche II options at an exercise price above fair market value to create a situation in which our
107
Table of Contents
NEOs realize an economic gain in connection with the Tranche II options only if there is a considerable appreciation in the value of our common stock between the date of grant and the date of exercise.
The following table sets forth the stock option grants we made to our NEOs in 2011:
| Name |
Date of Grant |
Number of Shares Underlying Option |
Exercise Price ($) |
Vesting Start Date |
||||||||||||
| Brian Slobodow |
7/12/2011 | 152,455 | 10.33 | 7/12/2012 | ||||||||||||
| 7/12/2011 | 207,072 | 16.90 | 7/12/2012 | |||||||||||||
| Michael L. Winkler |
7/12/2011 | 50,818 | 10.33 | 7/12/2012 | ||||||||||||
| 7/12/2011 | 77,652 | 16.90 | 7/12/2012 | |||||||||||||
| R. Dale Lynch |
7/25/2011 | 50,818 | 10.33 | 7/25/2012 | ||||||||||||
| 7/25/2011 | 77,652 | 16.90 | 7/25/2012 | |||||||||||||
| Bradford B. Casper |
7/12/2011 | 50,818 | 10.33 | 7/12/2012 | ||||||||||||
| 7/12/2011 | 77,652 | 16.90 | 7/12/2012 | |||||||||||||
| (1) | In each case, vesting remains subject to continued service through each vesting date. Refer to “—Compensation Discussion and Analysis—Compensation Tables—Outstanding Equity Awards at Fiscal Year-End” for the vesting schedule applicable to each award. |
Performance-Based Cash Incentives
We pay performance-based cash incentives in order to align the compensation of our employees, including our NEOs, with our short-term operational and performance goals and to provide near-term rewards for employees to meet these goals. Our short-term, performance-based cash incentive plan provides for incentive payments for each fiscal year. For 2011, these incentive payments will be based on the attainment of both pre-established objective financial goals and individual personal performance objectives. These incentive payments are intended to motivate our employees to work effectively to achieve financial performance and personal performance objectives and reward them when these objectives are met and results are approved by the board of directors.
The following table sets forth (1) the financial metric used to determine each NEO’s payment under our 2011 performance-based cash incentive program and (2) the related threshold, target and maximum levels:
| Performance Metric |
Threshold (in millions) |
Target (in millions) |
Maximum (in millions) | |||
| Adjusted EBITDA(1) |
$86.8 | >$90.0 | >$100.0 |
| (1) | For a calculation of Adjusted EBITDA, see note 2 to “Summary—Summary Historical Combined Financial and Operating Data.” Adjusted EBITDA was used because it is a key metric used by management and the board of directors to assess our operating performance. For 2010, our board of directors set the Adjusted EBITDA goal at the beginning of the year based on management projections. |
Attainment of Adjusted EBITDA objectives will account for 50% of each NEO’s bonus. The other 50% of each NEO’s bonus will be determined by the accomplishment of a variety of personal performance objectives, which are designed to coincide with the achievement of our strategic overall short-term operational and performance goals, which include:
| • | Investing in our team, such as by redesigning our leadership structure, filling key positions and increasing our internal talent development. |
| • | Driving volume and value for our customers, such as by initiating capital projects at our current production facilities, increasing efficiency and spurring technical innovation. |
108
Table of Contents
| • | Tailoring and enhancing how we bring our products to market, such as by aligning our selling and marketing resources with our customers, exploring new market initiatives and establishing a presence in key international markets. |
| • | Accelerating new technology development, such as by executing our strategic plan for resin-coated products or improving our internal development capabilities. |
| • | Transforming the culture of our workplace, such as by establishing us as a benchmark leader in our industry. |
No defined weights have been established for any of the above performance-based objectives. Each NEO’s personal performance will be evaluated against the criteria applicable to his position by the board of directors or the Compensation and Governance Committee. In addition, our NEOs’ specific performance-based objectives are dependent in part upon our financial results in 2011, which are currently unavailable. As a result, the successful achievement and completion of the above objectives cannot yet be determined. As such, compensation related to the achievement of these objectives is not yet calculable. We expect that such amounts will be finalized upon the completion of the audit of our 2011 financial results and subsequent approval by the board of directors. The threshold, target and maximum payout opportunities of our NEOs for 2011 based on the above goals are set forth in the “Grants of Plan-Based Awards.”
The following table shows each NEO’s performance-based cash incentive targets as a percentage of base salary for 2012 as of December 31, 2011. For 2012, we are again using Adjusted EBITDA as the financial measure for the plan. We are using Adjusted EBITDA for the same reasons we used Adjusted EBITDA for 2011. We do not believe that disclosure of our 2012 Adjusted EBITDA goals are relevant to an understanding of compensation for 2011. In addition, because the components of Adjusted EBITDA for 2012 contain highly sensitive data, we do not disclose specific future measures and targets because we believe that such disclosure would result in serious competitive harm and be detrimental to our operating performance. Our 2012 Adjusted EBITDA goals are intended to be realistic and reasonable, but challenging, in order to drive performance on an individual basis.
| Fiscal 2012 | ||||||||||||
| Percentage of Base Salary | ||||||||||||
| Name |
Threshold Payout |
Target Payout |
Maximum Payout |
|||||||||
| Brian Slobodow |
25 | % | 50 | % | 75 | % | ||||||
| William A. White |
23 | % | 45 | % | 68 | % | ||||||
| Michael L. Winkler |
23 | % | 45 | % | 68 | % | ||||||
| R. Dale Lynch |
25 | % | 50 | % | 75 | % | ||||||
| Bradford B. Casper |
18 | % | 35 | % | 53 | % | ||||||
Although Adjusted EBITDA was used as the financial measure for 2011 and will be used as the financial measure for 2012, the Compensation and Governance Committee may use other objective financial performance indicators for the plan in the future, including, without limitation, the price of our common stock, shareholder return, return on equity, return on investment, return on capital, sales productivity, comparable store sales growth, economic profit, economic value added, net income, operating income, gross margin, sales, free cash flow, earnings per share, operating company contribution, a derivative of Adjusted EBITDA or market share.
Parent LLC Class C and Class D Membership Interests
On July 30, 2009, Messrs. Ulizio and White were granted Class C Units and Class D Units in our parent LLC, which owns all of our common stock prior to the completion of this offering. This permits the executives to share in the increase in our value and is intended to focus their efforts on our long-term results. Combined, Messrs. Ulizio and White own 63% of the Class C Units and 71% of the Class D Units. The remaining Class C
109
Table of Contents
Units and Class D Units are held by another of our current employees. The Class C Units and the Class D Units were allocated based on the individual’s relative position and responsibilities. The Class C Units vest ratably over five years, with vesting occurring on November 25 of each year. The Class D Units were fully vested upon grant. The Class C Units and the Class D Units may not be transferred without the prior written consent of Golden Gate Capital unless (1) all or substantially all of the outstanding units are being sold to an independent third party or (2) the transfer is to a spouse, lineal descendent, sibling, parent, heir, executor or similar person or entity. See “Security Ownership of Certain Beneficial Owners” for information on the holdings of Messrs. Ulizio and White in our parent LLC.
Equity and Cash Incentives—Summary of the 2011 Plan
On July 8, 2011, we adopted the 2011 Plan. The 2011 Plan provides for grants of stock options, stock appreciation rights, restricted stock and other incentive-based awards. Independent directors, officers and other employees of us and our subsidiaries, as well as others performing consulting or advisory services for us, will be eligible for grants under the 2011 Plan. The purpose of the 2011 Plan is to provide incentives that will attract, retain and motivate high performing officers, directors, employees and consultants by providing them with appropriate incentives and rewards either through a proprietary interest in our long-term success or compensation based on their performance in fulfilling their personal responsibilities. Each member of management that chooses to participate in the 2011 plan has signed a non-compete agreement. The following is a summary of the material terms of the 2011 Plan, but does not include all of the provisions of the 2011 Plan. For further information about the 2011 Plan, we refer you to the complete copy of the 2011 Plan, which we will file as an exhibit to the registration statement, of which this prospectus is a part. The 2011 Plan also gives us the right, in certain situations, to repurchase shares of common stock that were obtained through the exercise, grant or payment of an award under the 2011 Plan. Pursuant to the 2011 Plan, these repurchase rights will be terminated upon the completion of this offering.
All equity incentive compensation awarded to our NEOs in 2011 was granted under the 2011 Plan. As of January 17, 2012, options to acquire 1,650,386 shares of common stock had been granted under the 2011 Plan of which 1,501,398 were outstanding. As of January 17, 2012, no other forms of awards had been granted under the 2011 Plan.
Administration
Upon completion of this offering, the 2011 Plan will be administered by the Compensation and Governance Committee designated by our board of directors. Among the committee’s powers will be to determine the form, amount and other terms and conditions of awards; clarify, construe or resolve any ambiguity in any provision of the 2011 Plan or any award agreement’ amend the terms of outstanding awards; and adopt such rules, forms, instruments and guidelines for administering the 2011 Plan as it deems necessary or proper. All actions, interpretations and determinations by the committee or by our board of directors are final and binding.
The Compensation and Governance Committee will have full authority to administer and interpret the 2011 Plan, to grant discretionary awards under the 2011 Plan, to determine the persons to whom awards will be granted, to determine the types of awards to be granted, to determine the terms and conditions of each award, to determine the number of shares of common stock to be covered by each award and to make all other determinations in connection with the 2011 Plan and the awards thereunder as the Compensation and Governance Committee, in its sole discretion, deems necessary or desirable.
Available Shares
The aggregate number of shares of common stock which may be issued or used for reference purposes under the 2011 Plan or with respect to which awards may be granted is five million shares, subject to automatic increase on the first day of each fiscal year beginning in 2012 and ending in 2019 by the lesser of (1) 2% of the shares of common stock outstanding on the last day of the immediately preceding fiscal year, or (2) such lesser
110
Table of Contents
number of shares as determined by the Compensation and Governance Committee. The shares may be either authorized and unissued shares of our common stock or shares of common stock held in or acquired for our treasury. In general, if awards under the 2011 Plan are for any reason cancelled or expire or terminate unexercised, the shares covered by such awards will again be available for the grant of awards under the 2011 Plan.
Eligibility for Participation
Independent members of our board of directors, as well as employees of, and consultants to, us or any of our subsidiaries and affiliates are eligible to receive awards under the 2011 Plan. The selection of participants is within the sole discretion of the Compensation and Governance Committee.
Award Agreement
Awards granted under the 2011 Plan shall be evidenced by award agreements, which need not be identical, that provide additional terms, conditions, restrictions and/or limitations covering the grant of the award, including, without limitation, additional terms providing for the acceleration of exercisability or vesting of awards in the event of a change of control or conditions regarding the participant’s employment, as determined by the committee in its sole discretion.
Stock Options
The committee may grant nonqualified stock options and incentive stock options to purchase shares of our common stock only to eligible employees. The Compensation and Governance Committee will determine the number of shares of our common stock subject to each option, the term of each option, which may not exceed ten years, or five years in the case of an incentive stock option granted to a 10.0% stockholder, the exercise price, the vesting schedule, if any, and the other material terms of each option. No incentive stock option or nonqualified stock option may have an exercise price less than the fair market value of a share of our common stock at the time of grant or, in the case of an incentive stock option granted to a 10.0% stockholder, 110.0% of such share’s fair market value. Options will be exercisable at such time or times and subject to such terms and conditions as determined by the committee at grant and the exercisability of such options may be accelerated by the committee in its sole discretion.
Stock Appreciation Rights
The Compensation and Governance Committee may grant stock appreciation rights, which we refer to as SARs, either with a stock option, which may be exercised only at such times and to the extent the related option is exercisable, which we refer to as a Tandem SAR, or independent of a stock option, which we refer to as a Non-Tandem SAR. A SAR is a right to receive a payment in shares of our common stock or cash, as determined by the Compensation and Governance Committee, equal in value to the excess of the fair market value of one share of our common stock on the date of exercise over the exercise price per share established in connection with the grant of the SAR. The term of each SAR may not exceed ten years. The exercise price per share covered by an SAR will be the exercise price per share of the related option in the case of a Tandem SAR and will be the fair market value of our common stock on the date of grant in the case of a Non-Tandem SAR. The Compensation and Governance Committee may also grant limited SARs, either as Tandem SARs or Non-Tandem SARs, which may become exercisable only upon the occurrence of a change in control, as defined in the 2011 Plan, or such other event as the Compensation and Governance Committee may, in its sole discretion, designate at the time of grant or thereafter.
Restricted Stock
The Compensation and Governance Committee may award shares of restricted stock. Except as otherwise provided by the Compensation and Governance Committee upon the award of restricted stock, the recipient
111
Table of Contents
generally has the rights of a stockholder with respect to the shares, including the right to receive dividends, the right to vote the shares of restricted stock and, conditioned upon full vesting of shares of restricted stock, the right to tender such shares, subject to the conditions and restrictions generally applicable to restricted stock or specifically set forth in the recipient’s restricted stock agreement. The Compensation and Governance may determine at the time of award that the payment of dividends, if any, will be deferred until the expiration of the applicable restriction period.
Recipients of restricted stock are required to enter into a restricted stock agreement with us that states the restrictions to which the shares are subject, which may include satisfaction of pre-established performance goals, and the criteria or date or dates on which such restrictions will lapse.
If the grant of restricted stock or the lapse of the relevant restrictions is based on the attainment of performance goals, the committee will establish for each recipient the applicable performance goals, formulae or standards and the applicable vesting percentages with reference to the attainment of such goals or satisfaction of such formulae or standards while the outcome of the performance goals are substantially uncertain. Such performance goals may incorporate provisions for disregarding, or adjusting for, changes in accounting methods, corporate transactions, including, without limitation, dispositions and acquisitions, and other similar events or circumstances. Section 162(m) of the Code requires that performance awards be based upon objective performance measures. The performance goals for performance-based restricted stock will be based on one or more of the objective criteria set forth on Exhibit A to the 2011 Plan and are discussed in general below.
Other Stock-Based Awards
The Compensation and Governance Committee may, subject to limitations under applicable law, make a grant of such other stock-based awards, including, without limitation, performance units, dividend equivalent units, stock equivalent units, restricted stock units and deferred stock units under the 2011 Plan that are payable in cash or denominated or payable in or valued by shares of our common stock or factors that influence the value of such shares. The Compensation and Governance Committee shall determine the terms and conditions of any such other awards, which may include the achievement of certain minimum performance goals for purposes of compliance with Section 162(m) of the Code and/or a minimum vesting period. The performance goals for performance-based other stock-based awards will be based on one or more of the objective criteria set forth on Exhibit A to the 2011 Plan and discussed in general below.
Performance Awards
The Compensation and Governance Committee may grant a performance award to a participant payable upon the attainment of specific performance goals. The Compensation and Governance Committee may grant performance awards that are intended to qualify as performance-based compensation under Section 162(m) of the Code as well as performance awards that are not intended to qualify as performance-based compensation under Section 162(m) of the Code. Based on service, performance and/or such other factors or criteria, if any, as the Compensation and Governance Committee may determine, the Compensation and Governance Committee may, at or after grant, accelerate the vesting of all or any part of any performance award.
Performance Goals
The Compensation and Governance Committee may grant awards of restricted stock, performance awards, and other stock-based awards that are intended to qualify as performance-based compensation for purposes of Section 162(m) of the Code. These awards may be granted, vest and be paid based on attainment of specified performance goals established by the committee. These performance goals will be based on the attainment of a certain target level of, or a specified increase or decrease in, one or more of the following measures selected by the committee: (1) earnings per share; (2) operating income; (3) gross income; (4) net income (before or after taxes); (5) cash flow; (6) gross profit; (7) gross profit return on investment; (8) gross margin return on
112
Table of Contents
investment; (9) gross margin; (10) operating margin; (11) working capital; (12) earnings before interest and taxes; (13) earnings before interest, tax, depreciation and amortization; (14) return on equity; (15) return on assets; (16) return on capital; (17) return on invested capital; (18) net revenues; (19) gross revenues; (20) revenue growth; (21) net revenues by segment; (22) revenue growth by segment; (23) overall revenue growth; (24) overall contribution margin; (25) contribution margin by segment; (26) sales or market share; (27) total shareholder return; (28) economic value added; (29) specified objectives with regard to limiting the level of increase in all or a portion of our bank debt or other long-term or short-term public or private debt or other similar financial obligations, which may be calculated net of cash balances and/or other offsets and adjustments as may be established by the committee in its sole discretion; (30) the fair market value of a share of common stock; (31) the growth in the value of an investment in the common stock assuming the reinvestment of dividends; (32) reduction in operating expenses; (33) volume growth by segment; (34) overall volume growth; (35) price growth by segment; (36) overall price growth; (37) contribution margin growth; (38) reduction in variable costs; (39) reduction in fixed costs; (40) asset productivity; (41) cost per ton; (42) output per employee; (43) logistics efficiency; or (44) customer acquisitions.
To the extent permitted by law, the Compensation and Governance Committee may also exclude the impact of an event or occurrence which the committee determines should be appropriately excluded, including: (1) restructurings, discontinued operations, extraordinary items and other unusual or non-recurring charges; (2) an event either not directly related to our operations or not within the reasonable control of management; or (3) a change in accounting standards required by generally accepted accounting principles.
Performance goals may also be based on an individual participant’s performance goals, as determined by the Compensation and Governance Committee, in its sole discretion.
In addition, all performance goals may be based upon the attainment of specified levels of our performance, or the performance of a subsidiary, division or other operational unit, under one or more of the measures described above relative to the performance of other corporations. The Compensation and Governance Committee may designate additional business criteria on which the performance goals may be based or adjust, modify or amend those criteria.
Change in Control
In connection with a change in control, as defined in the 2011 Plan, the Compensation and Governance Committee may accelerate vesting of outstanding awards under the 2011 Plan. In addition, such awards will be, in the discretion of the committee, (1) assumed and continued or substituted in accordance with applicable law, (2) purchased by us for an amount equal to the excess of the price of a share of our common stock paid in a change in control over the exercise price of the award(s), or (3) cancelled if the price of a share of our common stock paid in a change in control is less than the exercise price of the award. The Compensation and Governance Committee may also, in its sole discretion, provide for accelerated vesting or lapse of restrictions of an award at any time.
Stockholder Rights
Except as otherwise provided in the applicable award agreement, and with respect to an award of restricted stock a participant has no rights as a stockholder with respect to shares of our common stock covered by any award until the participant becomes the record holder of such shares.
Amendment and Termination
Notwithstanding any other provision of the 2011 Plan, our board of directors may at any time amend any or all of the provisions of the 2011 Plan, or suspend or terminate it entirely, retroactively or otherwise; provided, however, that, unless otherwise required by law or specifically provided in the 2011 Plan, the rights of a
113
Table of Contents
participant with respect to awards granted prior to such amendment, suspension or termination may not be adversely affected without the consent of such participant.
Transferability
Awards granted under the 2011 Plan are generally nontransferable (other than by will or the laws of descent and distribution), except that the committee may provide for the transferability of nonqualified stock options at the time of grant or thereafter to certain family members.
Effective Date
The 2011 Plan is effective as of its approval by our board of directors on July 8, 2011.
Additional Executive Benefits and Perquisites
We provide our executive officers with executive benefits and perquisites that the board of directors believes are reasonable and in the best interests of the company and its stockholders. Consistent with our compensation philosophy, we intend to continue to maintain our current benefits for our executive officers, including retirement plans, health and welfare benefits and life insurance and long-term disability insurance described below. The Compensation and Governance Committee, in its discretion, may revise, amend or add to an officer’s executive benefits if it deems it advisable. We believe these benefits are generally equivalent to benefits provided by comparable companies. We have no current plans to change the levels of benefits provided thereunder.
Retirement Plan Benefits. We sponsor a 401(k) plan covering substantially all eligible employees. Employee contributions to the 401(k) plan are voluntary. We contribute an amount equal to 25% of a covered employee’s eligible contribution up to 8% of a participant’s salary. We also contribute from 0% to 75% of a covered employee’s eligible contribution up to 8%, if applicable, based on our profits from the previous fiscal year as an incentive to encourage our employees to participate in the 401(k) plan. The contributions based on our profits are paid during the Spring of the following fiscal year. In the case of both the matching program and the profit sharing program, our contributions vest over a period of five years. Finally, we also provide a 4% defined contribution of monthly basic income into a participant’s 401(k) account if that participant does not participate in our defined pension plan. These contributions vest each year. Contributions by participants are limited to their annual tax deferred contribution limit as allowed by the Internal Revenue Service. Our total contributions to 401(k) plan participants were $1.4 million, $0.9 million and $0.8 million for 2008, 2009 and 2010, respectively.
Health and Welfare Benefits. We offer health, dental and vision coverage for all employees, including our NEOs, and pay premiums on behalf of our NEOs on the same basis as on behalf of all of our other salaried employees.
Life Insurance and Long-Term Disability Insurance. As of December 2010, we offered life insurance up to a cap of $300,000 or three times each employee’s annual salary. Beginning in 2011, we offer life insurance up to a cap of $600,000 or five times each employee’s annual salary. We offer long-term disability insurance up to a cap of $10,000 per month. We pay life insurance premiums on behalf of our NEOs, but do not pay any premiums on behalf of our NEOs related to long-term disability insurance.
Accounting and Tax Considerations
In determining which elements of compensation are to be paid, and how they are weighted, we also take into account whether a particular form of compensation will be deductible under Section 162(m) of the Code. Section 162(m) generally limits the deductibility of compensation paid to our NEOs to $1.0 million during any fiscal year unless such compensation is “performance-based” under Section 162(m). However, under a Section 162(m) transition rule for compensation plans or agreements of corporations which are privately held and
114
Table of Contents
which become publicly held in an initial public offering, compensation paid under a plan or agreement that existed prior to the initial public offering will not be subject to Section 162(m) until the earlier of (1) the expiration of the plan or agreement, (2) a material modification of the plan or agreement, (3) the issuance of all employer stock and other compensation that has been allocated under the plan, or (4) the first meeting of stockholders at which directors are to be elected that occurs after the close of the third calendar year following the year of the initial public offering (the “Transition Date”). After the Transition Date, rights or awards granted under the plan, other than options and stock appreciation rights, will not qualify as “performance-based compensation” for purposes of Section 162(m) unless such rights or awards are granted or vest upon pre-established objective performance goals, the material terms of which are disclosed to and approved by our stockholders.
Our compensation program is intended to maximize the deductibility of the compensation paid to our NEOs to the extent that we determine it is in our best interests. Consequently, we may rely on the exemption from Section 162(m) afforded to us by the transition rule described above for compensation paid pursuant to our pre-existing plans. Many other Code provisions, SEC regulations and accounting rules affect the payment of executive compensation and are generally taken into consideration as programs are developed.
Compensation Tables
The purpose of the following tables is to provide information regarding the compensation earned during our most recently completed fiscal year by our NEOs.
Summary Compensation Table
The following table presents information concerning the total compensation of our NEOs, who are (1) our principal executive officer, (2) our principal financial officer and (3) our three most highly compensated executive officers, other than our principal executive officer and principal financial officer, who were serving as executive officers at the end of our fiscal year ended December 31, 2011. No disclosure is provided for 2010 for those persons who were not NEOs in 2010.
| Name and Principal Position |
Year | Salary ($) |
Bonus ($)(1) |
Option Awards ($)(2) |
Non-Equity Incentive Plan Compensation ($)(3) |
Change in Pension Value and Nonqualified Deferred Compensation Earnings ($) |
All Other Compensation ($)(4) |
Total ($) |
||||||||||||||||||||||||
| Brian Slobodow |
2011 | 299,760 | — | 1,326,332 | (5 | ) | — | 68,328 | 1,694,420 | |||||||||||||||||||||||
| Chief Executive Officer |
||||||||||||||||||||||||||||||||
| John A. Ulizio |
2011 | 62,500 | — | — | — | 3,495 | 290,166 | 356,161 | ||||||||||||||||||||||||
| Former Chief Executive Officer |
2010 | 300,000 | 100,000 | — | 231,563 | 995 | 35,520 | 668,078 | ||||||||||||||||||||||||
| William A. White |
2011 | 221,679 | — | — | (5 | ) | — | 38,002 | 259,681 | |||||||||||||||||||||||
| Chief Financial Officer |
2010 | 179,450 | 75,000 | — | 104,791 | 31,028 | 390,269 | |||||||||||||||||||||||||
| Michael L. Winkler |
2011 | 127,237 | — | 500,475 | (5 | ) | — | 12,688 | 640,400 | |||||||||||||||||||||||
| Vice President of Operations |
||||||||||||||||||||||||||||||||
| R. Dale Lynch |
2011 | 130,769 | — | 502,268 | (5 | ) | — | 7,413 | 640,450 | |||||||||||||||||||||||
| Vice President of Finance |
||||||||||||||||||||||||||||||||
| Bradford B. Casper |
2011 | 138,750 | — | 498,414 | (5 | ) | — | 16,239 | 653,403 | |||||||||||||||||||||||
| Vice President of Strategic Planning |
||||||||||||||||||||||||||||||||
| (1) | For Messrs. Ulizio and White, bonus awards represent a special discretionary bonus paid in recognition of our NEOs’ contributions in connection with the refinancing of our credit agreements in 2010. |
| (2) | Represents the aggregate grant date fair values of stock options computed in accordance with FASB ASC Topic 718. For information on the assumptions used by the Company in calculating the fair value of the stock options, see note N to our unaudited condensed combined financial statements included elsewhere in this prospectus. |
| (3) | Represents amounts paid under our performance-based cash incentive plan. See “—Compensation Discussion and Analysis—Elements of Compensation—Performance-Based Cash Incentive.” |
115
Table of Contents
| (4) | “All Other Compensation” for 2011 and 2010 includes employer contributions to our NEOs’ 401(k) plan accounts, premiums paid for health coverage, premiums paid for life insurance, relocation expenses and amounts reimbursed for the payment of taxes, as applicable. The table below presents an itemized account of “All Other Compensation” provided in 2010 to our NEOs, regardless of any minimum thresholds provided under the SEC rules and regulations. |
| Name |
Year | Company Contributions to 401(k) Plan ($) |
Company-Paid Premiums for Health Coverage ($) |
Company-Paid Premiums for Life Insurance ($) |
Relocation Expenses ($) |
Living Expenses ($) |
Severance ($) |
Reimbursements for the Payment of Income Taxes (“Gross-Ups”) ($) |
||||||||||||||||||||||||
| Brian Slobodow |
2011 | 12,973 | 11,046 | 495 | 35,000 | 4,444 | — | 4,370 | ||||||||||||||||||||||||
| John A. Ulizio |
2011 | 8,175 | 14,682 | 962 | — | — | 266,346 | — | ||||||||||||||||||||||||
| 2010 | 20,500 | 13,436 | 1,584 | — | — | — | — | |||||||||||||||||||||||||
| William A. White |
2011 | 22,241 | 14,728 | 1,034 | — | — | — | — | ||||||||||||||||||||||||
| 2010 | 19,921 | 9,523 | 1,584 | — | — | — | — | |||||||||||||||||||||||||
| Michael L. Winkler |
2011 | 6,133 | 6,186 | 369 | — | — | — | — | ||||||||||||||||||||||||
| R. Dale Lynch |
2011 | 7,000 | — | 413 | — | — | — | — | ||||||||||||||||||||||||
| Bradford B. Casper |
2011 | 7,400 | 8,591 | 248 | — | — | — | — | ||||||||||||||||||||||||
| (5) | Non-Equity Incentive Plan Compensation earned in 2011 is dependent in part upon financial results of 2011, which are currently unavailable. As a result, such compensation is not yet calculable. We expect that such amounts will be finalized upon the completion of the audit of the 2011 financial results and subsequent approval by the board of directors and will be reported in a future Current Report on Form 8-K. |
Grants of Plan-Based Awards
During 2011, each of our NEOs participated in our performance-based cash incentive plan in which each officer was eligible for awards set forth under “Estimated Potential Payouts Under Non-Equity Incentive Plan Awards” below. The actual payout for each of our NEOs is set forth above under the “Non-Equity Incentive Plan Compensation” column of the Summary Compensation Table. For a detailed discussion of our performance-based cash incentive plan, refer to “—Compensation Discussion and Analysis—Elements of Compensation—Performance-Based Cash Incentives.”
The following table presents information concerning each grant of an award made to an NEO in fiscal 2011 under any plan.
| Estimated Potential Payouts Under Non-Equity Incentive Plan Awards |
Estimated Potential Payouts Under Equity Incentive Plan Awards |
All Other Stock Awards: Number of Shares or Stock Units (#) |
All Other Option Awards: Number of Securities Underlying Options (#) |
Exercise or Base Price of Option Awards ($/Sh)(1) |
Grant Date Fair Value of Stock and Award Options ($)(1)(2) |
|||||||||||||||||||||||||||||||||||||||
| Name |
Grant Date |
Threshold ($) |
Target ($) |
Maximum ($) |
Threshold # |
Target # |
Maximum # |
|||||||||||||||||||||||||||||||||||||
| Brian Slobodow |
|
— 7/12/2011 7/12/2011 |
|
|
93,750 — — |
|
|
187,500 — — |
|
|
281,250 — — |
|
|
— — — |
|
|
— — — |
|
|
— — — |
|
|
— — — |
|
|
— 152,455 207,072 |
|
|
— 10.33 16.90 |
|
|
— 4.53 3.07 |
| |||||||||||
| John A. Ulizio |
— | — | — | — | — | — | — | — | — | — | — | |||||||||||||||||||||||||||||||||
| William A. White |
— | 56,250 | 112,500 | 168,750 | — | — | — | — | — | — | — | |||||||||||||||||||||||||||||||||
| Michael L. Winkler |
|
— |
|
|
51,750 — — |
|
|
103,500 — — |
|
|
155,250 — — |
|
|
— — — |
|
|
— — — |
|
|
— — — |
|
|
— — — |
|
|
— 50,818 77,652 |
|
|
— 10.33 16.90 |
|
|
— 4.76 3.33 |
| |||||||||||
| R. Dale Lynch |
|
— 7/25/2011 7/25/2011 |
|
|
33,000 — — |
|
|
66,000 — — |
|
|
99,000 — — |
|
|
— — — |
|
|
— — — |
|
|
— — — |
|
|
— — — |
|
|
— 50,818 77,652 |
|
|
— 10.33 16.90 |
|
|
— 4.78 3.34 |
| |||||||||||
| Bradford B. Casper |
|
— |
|
|
16,268 — — |
|
|
32,537 — — |
|
|
48,805 — — |
|
|
— — — |
|
|
— — — |
|
|
— — — |
|
|
— — — |
|
|
— 50,818 77,652 |
|
|
— 10.33 16.90 |
|
|
— 4.75 3.31 |
| |||||||||||
| (1) | For additional information regarding the different exercise prices of option awards granted in 2011, see “—Compensation Discussion and Analysis—Elements of Compensation—Equity-Based Incentives.” |
| (2) | The vesting schedule applicable to each award is set forth below in the section entitled “Outstanding Equity Awards at Fiscal Year-End. |
| (3) | Represents the aggregate grant date fair values of stock options computed in accordance with FASB ASC Topic 718. For information on the assumptions used by the Company in calculating the fair value of the stock options, see note N to our unaudited condensed combined financial statements included elsewhere in this prospectus. |
116
Table of Contents
Outstanding Equity Awards at Fiscal Year-End
The following table presents information concerning unexercised options that have not vested for each NEO outstanding as of the end of fiscal 2011. None of our NEOs held any stock awards in us as of December 31, 2011. In addition, prior to 2011, we did not grant any equity awards.
| Name |
Grant Date |
Number of Securities Underlying Unexercised Options (#) Exercisable |
Number of Securities Underlying Unexercised Options (#) Un-Exercisable |
Equity Incentive Plan Awards: Number of Securities Underlying Unexercised Unearned Options (#) |
Option Exercise Price ($) |
Option Expiration Date |
||||||||||||||||||
| Brian Slobodow |
|
7/12/2011 |
(1) |
|
— |
|
|
152,455 |
|
|
— |
|
10.33 | 7/12/2021 | ||||||||||
| 7/12/2011 | (2) | — | 207,072 | |
— |
|
16.90 | 7/12/2021 | ||||||||||||||||
| Michael L. Winkler |
|
7/12/2011 |
(3) |
|
— |
|
|
50,818 |
|
|
— |
|
10.33 | 7/12/2021 | ||||||||||
| 7/12/2011 | (4) | — | 77,652 | — | 16.90 | 7/12/2021 | ||||||||||||||||||
| R. Dale Lynch |
|
7/25/2011 |
(5) |
|
— |
|
|
50,818 |
|
|
— |
|
10.33 | 7/25/2021 | ||||||||||
| 7/25/2011 | (6) | — | 77,652 | — | 16.90 | 7/25/2021 | ||||||||||||||||||
| Bradford B. Casper |
|
7/12/2011 |
(7) |
|
— |
|
|
50,818 |
|
|
— |
|
10.33 | 7/12/2021 | ||||||||||
| 7/12/2011 | (8) | — | 77,652 | — | 16.90 | 7/12/2021 | ||||||||||||||||||
| (1) | 95,284 of the shares subject to the option shall vest on July 12, 2012, 19,057 of the shares subject to the option shall vest on January 1, 2013, and 38,114 of the shares subject to the option shall vest on January 1, 2014, subject to Mr. Slobodow’s continued service to us on each such vesting date. |
| (2) | 129,420 of the shares subject to the option shall vest on July 12, 2012, 25,884 of the shares subject to the option shall vest on January 1, 2013, and 51,768 of the shares subject to the option shall vest on January 1, 2014, subject to Mr. Slobodow’s continued service to us on each such vesting date. |
| (3) | 1/4th of the total number of shares subject to the option vest annually beginning on the first anniversary, July 25, 2012, and continuing through the fourth anniversary, July 25, 2015, subject to Mr. Winkler’s continued service to us on each such vesting date. |
| (4) | 1/4th of the total number of shares subject to the option vest annually beginning on the first anniversary, July 25, 2012, and continuing through the fourth anniversary, July 25, 2015, subject to Mr. Winkler’s continued service to us on each such vesting date. |
| (5) | 1/4th of the total number of shares subject to the option vest annually beginning on the first anniversary, July 25, 2012, and continuing through the fourth anniversary, July 25, 2015, subject to Mr. Lynch’s continued service to us on each such vesting date. |
| (6) | 1/4th of the total number of shares subject to the option vest annually beginning on the first anniversary, July 25, 2012, and continuing through the fourth anniversary, July 25, 2015, subject to Mr. Lynch’s continued service to us on each such vesting date. |
| (7) | 13,721 of the shares subject to the option shall vest on July 12, 2012, 12,705 of the shares subject to the option shall vest on July 12, 2013, 12,704 of the shares subject to the option shall vest on July 12, 2014, and 11,688 of the shares subject to the option shall vest on July 12, 2015, subject to Mr. Casper’s continued service to us on each such vesting date. |
| (8) | 20,966 of the shares subject to the option shall vest on July 12, 2012, 19,413 of the shares subject to the option shall vest on July 12, 2013 and July 12, 2014, and 17,860 of the shares subject to the option shall vest on July 12, 2015, subject to Mr. Casper’s continued service to us on each such vesting date. |
Exercises and Stock Vested
None of our NEOs exercised any option awards during 2011. None of our NEOs held any stock awards in us that vested in 2011.
Deferred Compensation
Our deferred compensation plan is an unfunded, nonqualified deferred compensation plan that was available to our executives and key employees beginning on January 1, 1998. There have been no new entrants to the deferred compensation plan since January 1, 2000; however the deferred compensation plan has not been terminated due to the costs associated with termination. Under the deferred compensation plan, eligible employees can elect to defer each year up to 100% of gross compensation, including bonuses and annual cash incentive awards. Although we have the discretion to provide matching credits under the deferred compensation plan, no matching credits were provided in 2011. All amounts credited to a participant’s account under the deferred compensation plan are notionally invested in mutual funds or other investments available in the market. Amounts under the deferred compensation plan are generally distributed in a
117
Table of Contents
lump sum upon a participant’s death, disability or mutual agreement of the participant and us. A participant who separates from service at or after age 70 (or after the participant’s tenth anniversary of participation, whichever is later) shall be paid in the form of ten annual installments, or in a lump sum payment at our sole discretion. Mr. Ulizio was our only NEO who participated in our nonqualified deferred compensation plan during 2011. In connection with his resignation from the company in March 2011, Mr. Ulizio elected to receive a lump sum payment equal to the aggregate balance of his account.
| Name |
Executive Contributions in Last Fiscal Year ($) |
Registrant Contributions in Last Fiscal Year ($) |
Aggregate Earnings in Last Fiscal Year ($) |
Aggregate Withdrawals / Distributions ($) |
Aggregate Balance at Last Fiscal Year ($) |
|||||||||||||||
| John A. Ulizio |
— | — | 3,495 | 28,310 | — | |||||||||||||||
Pension Benefits
None of our NEOs participate in or have account balances in any qualified or nonqualified defined benefit plans sponsored by us. Either our board of directors or our Compensation and Governance Committee may elect to adopt qualified or nonqualified benefit plans in the future if it determines that doing so is in our best interest.
Employment and Other Agreements
Brian Slobodow
We are party to an employment agreement with Mr. Slobodow, our Chief Administrative Officer. Mr. Slobodow was originally hired as our Chief Executive Officer, but reduced his own responsibilities on January 10, 2012 due to personal health reasons. Under the terms of his employment agreement, effective June 1, 2011, Mr. Slobodow is entitled to an annual base salary of $375,000, subject to review and adjustment. Mr. Slobodow is also eligible to earn a short-term, performance-based cash incentive payment for each year. The bonus shall be equal to 50% of his annual base salary.
Mr. Slobodow is also entitled to receive benefits in accordance with the health and welfare plans we provide to other members of our senior management. Mr. Slobodow is also entitled to up to 20 days of paid time off, family relocation expenses to the Princeton, New Jersey or Frederick, Maryland region from Park City, Utah and reimbursement for all reasonable business expenses that he incurs in the course of performing his duties and responsibilities which are consistent with our policies in effect from time to time with respect to travel, entertainment and other business expenses, subject to our requirements with respect to reporting and documentation of such expenses.
Mr. Slobodow’s employment continues until the earlier of his resignation (with or without good reason), death or disability or termination by us (with or without cause). If we terminate Mr. Slobodow’s employment without cause or Mr. Slobodow resigns for good reason, Mr. Slobodow is entitled to receive severance equal to his annual base salary payable in regular installments from the date of termination through the later of (1) June 1, 2012 and the six-month anniversary of the date of termination if Mr. Slobodow has executed and delivered a general release of any and all claims arising out of or related to his employment with us and the termination of his employment. Mr. Slobodow is also entitled to receive reimbursement of the then-prevailing monthly premium for COBRA healthcare coverage if he so elects. Mr. Slobodow is not entitled to any of these benefits solely as a result of the change in responsibilities that occurred on January 10, 2012.
Mr. Slobodow has also agreed to customary restrictions with respect to the use of our confidential information and has agreed that all intellectual property developed or conceived by Mr. Slobodow while he is employed by us which relates to our business is our property. During the term of Mr. Slobodow’s employment with us and during the six-month period immediately thereafter, Mr. Slobodow has agreed not to (1) participate (whether as an officer, director, employee or otherwise) in any businesses that compete with us, (2) solicit or hire
118
Table of Contents
any of our employees and (3) induce or attempt to induce any customer, supplier, licensee, licensor, franchisee, distributor or other business relation of us to cease doing business with us or in any way interfere with our relationship with such person or entity. During any period in which Mr. Slobodow has breached the above restrictions, we have no obligation to pay Mr. Slobodow any severance described above.
Mr. Slobodow’s compensation is not expected to change at this time due to the change in responsibilities that occurred on January 10, 2012.
Bryan A. Shinn
We are party to an employment agreement with Mr. Shinn, our President and Chief Executive Officer. Mr. Shinn was originally hired as our Senior Vice President of Sales and Marketing, was appointed to serve as our President in March 2011 and assumed the additional responsibility of Chief Executive Officer on January 10, 2012. Under the terms of his employment agreement, Mr. Shinn was initially entitled to an annual base salary of $232,000, subject to review and adjustment. Mr. Shinn is also eligible to participate in our short-term, performance-based cash incentive plan. In addition to bonuses received through the short-term, performance-based cash incentive plan, Mr. Shinn’s employment agreement provides that we would pay Mr. Shinn a one-time special bonus of $50,000, provided that he was a full-time employee as of March 1, 2010. This special bonus was paid in the first quarter of 2010.
We also agreed to pay Mr. Shinn a special allowance equal to 80% of the difference between the purchase price of his prior home and the (1) sale price of his prior home or (2) the appraised value of his prior home if his prior home is neither sold nor under contract to be sold within 180 days of the date on which his employment began. Pursuant to these terms, we paid Mr. Shinn a special allowance in the amount of $125,000 in 2010. Also pursuant to our contract with Mr. Shinn, we agreed to pay temporary living expenses for up to 180 days, which resulted in payments to Mr. Shinn of approximately $17,000 in 2010.
Mr. Shinn’s annual base salary was $300,000 as of December 31, 2011, and he is eligible to receive an annual bonus for fiscal 2012 of up to 50% of his base salary if the short-term, performance-based cash incentive plan pays out at 100%. Mr. Shinn’s compensation is not expected to change at this time due to the change in responsibilities that occurred on January 10, 2012.
William A. White
We are party to an employment agreement with Mr. White, our Chief Financial Officer. Under the terms of his employment agreement, effective December 21, 2011, Mr. White is entitled to an annual base salary of $250,000, subject to review and adjustment. Mr. White is also eligible to earn a short-term, performance-based cash incentive payment for each year. The bonus shall be equal to 45% of his annual base salary.
Mr. White is also entitled to receive benefits in accordance with the health and welfare plans we provide to other members of our senior management. Mr. White is also entitled to up to 20 days of paid time off and reimbursement for all reasonable business expenses that he incurs in the course of performing his duties and responsibilities as Chief Financial Officer which are consistent with our policies in effect from time to time with respect to travel, entertainment and other business expenses, subject to our requirements with respect to reporting and documentation of such expenses.
Mr. White’s employment continues until the earlier of his resignation (with or without good reason), death or disability or termination by us (with or without cause). If we terminate Mr. White’s employment without cause or Mr. White resigns for good reason, Mr. White is entitled to receive severance equal to his annual base salary payable in regular installments from the date of termination through the twelve-month anniversary of the date of termination if Mr. White has executed and delivered a general release of any and all claims arising out of or related to his employment with us and the termination of his employment. Mr. White is also entitled to receive reimbursement of the then-prevailing monthly premium for COBRA healthcare coverage if he so elects.
119
Table of Contents
Mr. White has also agreed to customary restrictions with respect to the use of our confidential information and has agreed that all intellectual property developed or conceived by Mr. White while he is employed by us which relates to our business is our property. During the term of Mr. White’s employment with us and during the six-month period immediately thereafter, Mr. White has agreed not to (1) participate (whether as an officer, director, employee or otherwise) in any businesses that compete with us, (2) solicit or hire any of our employees and (3) induce or attempt to induce any customer, supplier, licensee, licensor, franchisee, distributor or other business relation of us to cease doing business with us or in any way interfere with our relationship with such person or entity. During any period in which Mr. White has breached the above restrictions, we have no obligation to pay Mr. White any severance described above.
John A. Ulizio
We are party to a consulting agreement with Mr. Ulizio, our former Chief Executive Officer. Under the terms of the consulting agreement, Mr. Ulizio has agreed to provide consulting services relating to, among other things, federal, state, provincial or local legislation or regulation, the administration of our occupational health program, litigation, the preparation of articles and presentations and participation in trade association and other organization activities relating to crystalline silica.
We are obligated to pay Mr. Ulizio at a rate of $1,500 per day, subject to a minimum of $10,000 per quarter, even if we fail to use his consulting services to such extent in any quarter. Mr. Ulizio is entitled to be reimbursed by us for all ordinary and necessary out-of-pocket expenses for travel, lodging, meals or any similar expenses incurred by Mr. Ulizio in performing his consulting services. All of this is in addition to our obligation to pay Mr. Ulizio severance pursuant to the termination of his employment. As a result of such termination, we are paying him severance equal to his base salary (as in effect immediately prior to the termination of his employment) for a period of 24 months which aggregates to approximately $600,000. Mr. Ulizio is also entitled to participate in our group health plan for 18 months, which aggregates to a benefit of approximately $22,000.
The term of the consulting agreement began on April 1, 2011 and ends on March 31, 2013. Mr. Ulizio has agreed to refrain from disclosing any confidential information to any third party prior to, during or after the termination of the consulting agreement. Mr. Ulizio has also agreed to refrain from using any confidential information for his personal gain. The consulting agreement may be terminated at any time by us or by Mr. Ulizio upon 90 days’ written notice to the other party.
Potential Payments Upon Termination and Change in Control
The information below describes and quantifies certain compensation that would become payable to our NEOs if, as of December 31, 2010, his employment with us had been terminated. Due to the number of factors that affect the nature and amount of any benefits provided upon the events discussed below, any actual amounts paid or distributed may be different. Factors that could affect these amounts include the timing during the year of any such event.
120
Table of Contents
John A. Ulizio
Mr. Ulizio ceased to be Chief Executive Officer and president on March 8, 2011 and, therefore, Mr. Ulizio is no longer entitled to the benefits outlined in the table below. See “—Employment and Other Agreements” above for a description of the benefits that Mr. Ulizio is currently receiving from us.
| Involuntary without Cause or Voluntary with Good Reason |
Involuntary without Cause following Change in Control ($) |
|||||||||||||||
| Component |
Voluntary Resignation ($) |
Without Signed Release ($) |
With Signed Release ($) |
|||||||||||||
| Base Salary(1) |
0 | 109,615 | 600,000 | 600,000 | ||||||||||||
| Bonus |
0 | 0 | 0 | 0 | ||||||||||||
|
|
|
|
|
|
|
|
|
|||||||||
| Total Cash Severance |
0 | 109,615 | 600,000 | 600,000 | ||||||||||||
| Value of Accelerated Equity(2) |
0 | 0 | 0 | 0 | ||||||||||||
| Benefits and Perquisites(3) |
0 | 4,909 | 22,091 | 22,091 | ||||||||||||
|
|
|
|
|
|
|
|
|
|||||||||
| Total Severance |
0 | 114,524 | 622,091 | 622,091 | ||||||||||||
|
|
|
|
|
|
|
|
|
|||||||||
| (1) | Mr. Ulizio’s base salary and benefits are to be paid in equal installments over an 18-month period. |
| (2) | Mr. Ulizio had no outstanding equity in us as of December 31, 2011. Any unvested interests held in our parent LLC by Mr. Ulizio would not vest unless Golden Gate Capital (in its sole discretion) affirmatively caused such interests to vest. |
| (3) | Represents group health benefits payable over 18 months. |
Other NEOs
Each NEO, other than Mr. Ulizio, is subject to our severance policy for salaried personnel. Such NEOs are entitled to the same payments and benefits as all other salaried personnel. Pursuant to this policy, salaried employees who are terminated due to (1) force reductions caused by lack of business or (2) job eliminations caused by downsizing or restructuring are entitled to both regular and special severance pay. Regular severance pay consists of pay based on such NEO’s base salary as in effect immediately prior to the termination of his employment for one week for each complete year of employment with the company. There is no proration of severance pay for partial years of employment. Minimum regular severance pay is five weeks. Special severance pay is available to employees eligible for regular severance pay who sign a standard release agreement. Special severance pay consists of pay for based on such NEO’s base salary as in effect immediately prior to the termination of his employment one week for each complete year of employment with the company. Minimum special severance pay is five weeks. When combining regular severance pay and special severance pay, maximum severance pay is limited to fifty-two weeks. As of December 31, 2011, all of the stock options held by our NEOs are subject to vesting upon a change in control.
Director Compensation
See “Management—Corporate Governance—Director Compensation.”
Director and Officer Indemnification and Limitation of Liability
Upon completion of this offering, our amended and restated bylaws will provide that we will indemnify our directors and officers to the fullest extent permitted by the DGCL. In addition, upon completion of this offering, our amended and restated certificate of incorporation will provide that our directors are not liable for monetary damages for breach of fiduciary duty.
In addition, prior to the completion of this offering, we will enter into indemnification agreements with each of our executive officers and directors. The indemnification agreements will provide the executive officers and
121
Table of Contents
directors with contractual rights to indemnification, expense advancement and reimbursement, to the fullest extent permitted under the DGCL. We will also enter into an indemnification priority agreement with Golden Gate Capital to clarify the priority of advancement of expenses and indemnification obligations among us, our subsidiaries and any of our directors appointed by Golden Gate Capital or its affiliates and other related matters.
There is no pending litigation or proceeding naming any of our directors or officers in which indemnification is being sought, and we are not aware of any pending or threatened litigation that may result in claims for indemnification by any director or officer.
122
Table of Contents
SECURITY OWNERSHIP OF CERTAIN BENEFICIAL OWNERS
The following table sets forth information as of January 17, 2012 regarding the beneficial ownership of our common stock (1) immediately prior to and (2) as adjusted to give effect to this offering by:
| • | each person or group who is known by us to own beneficially more than 5% of our outstanding common stock; |
| • | each of our named executive officers; |
| • | each of our directors and director designee; and |
| • | all of our executive officers and directors and our director designee as a group. |
For further information regarding material transactions between us and certain of our stockholders, see “Certain Relationships and Related Party Transactions.”
Beneficial ownership for the purposes of the following table is determined in accordance with the rules and regulations of the SEC. These rules generally provide that a person is the beneficial owner of securities if such person has or shares the power to vote or direct the voting thereof, or to dispose or direct the disposition thereof or has the right to acquire such powers within 60 days. Common stock subject to options that are currently exercisable or exercisable within 60 days of January 17, 2012 are deemed to be outstanding and beneficially owned by the person holding the options. These shares, however, are not deemed outstanding for the purposes of computing the percentage ownership of any other person. Percentage of beneficial ownership is based on 50,000,000 shares of common stock outstanding prior to the completion of this offering and 52,941,176 shares of common stock to be outstanding after the completion of this offering. Except as disclosed in the footnotes to this table and subject to applicable community property laws, we believe that each stockholder identified in the table possesses sole voting and investment power over all shares of common stock shown as beneficially owned by the stockholder. Unless otherwise indicated in the table or footnotes below, the address for each beneficial owner is c/o U.S. Silica Holdings, Inc., 8490 Progress Drive, Suite 300, Frederick, Maryland 21701.
| Shares Beneficially Owned Prior to This Offering |
Shares To Be Sold in This Offering Assuming No Exercise of the Option to Purchase Additional Shares |
Shares To Be Sold in This Offering Assuming Full Exercise of the Option to Purchase Additional Shares |
Shares Beneficially Owned After This Offering Assuming No Exercise of the Option to Purchase Additional Shares |
Shares Beneficially Owned After This Offering Assuming Full Exercise of the Option to Purchase Additional Shares |
||||||||||||||||||||||||||||
| Name |
# | % | # | # | # | % | # | % | ||||||||||||||||||||||||
| GGC USS Holdings, LLC(1) |
50,000,000 | 100 | 8,823,529 | 10,588,235 | 41,176,471 | 77.8 | 39,411,765 | 74.4 | ||||||||||||||||||||||||
| Brian Slobodow |
— | — | — | — | — | — | — | — | ||||||||||||||||||||||||
| William A. White |
(1 | ) | (1 | ) | (1 | ) | (1 | ) | (1 | ) | (1 | ) | (1 | ) | (1 | ) | ||||||||||||||||
| Bradford B. Casper |
— | — | — | — | — | — | — | — | ||||||||||||||||||||||||
| R. Dale Lynch |
— | — | — | — | — | — | — | — | ||||||||||||||||||||||||
| Michael L. Winkler |
— | — | — | — | — | — | — | — | ||||||||||||||||||||||||
| Rajeev Amara |
(1 | ) | (1 | ) | (1 | ) | (1 | ) | (1 | ) | (1 | ) | (1 | ) | (1 | ) | ||||||||||||||||
| Prescott H. Ashe |
(1 | ) | (1 | ) | (1 | ) | (1 | ) | (1 | ) | (1 | ) | (1 | ) | (1 | ) | ||||||||||||||||
| Charles Shaver |
(1 | ) | (1 | ) | (1 | ) | (1 | ) | (1 | ) | (1 | ) | (1 | ) | (1 | ) | ||||||||||||||||
| Bryan A. Shinn |
(1 | ) | (1 | ) | (1 | ) | (1 | ) | (1 | ) | (1 | ) | (1 | ) | (1 | ) | ||||||||||||||||
| William J. Kacal |
— | — | — | — | — | — | — | — | ||||||||||||||||||||||||
| Executive Officers and Directors and our Director Designee as a Group |
— | — | — | — | — | — | — | — | ||||||||||||||||||||||||
| * | Represents beneficial ownership of less than 1% of our outstanding common stock. |
123
Table of Contents
| (1) | Prior to this offering, all of our issued and outstanding common stock is held by our parent LLC. Interests in our parent LLC are held directly or indirectly by a private investor group, including funds managed by Golden Gate Capital, Paribas North America, Messrs. Shaver and White, Bryan A. Shinn, our President and CEO, and John A. Ulizio, our former CEO. Although Paribas North America and Messrs. Shaver, White, Shinn and Ulizio do not have voting or dispositive power over securities owned by our parent LLC, each owns interests of our parent LLC with varying rights to participate in distributions by our parent LLC. The following table sets forth information as of January 17, 2012 regarding the beneficial ownership of our common stock if our parent LLC were to distribute our common stock to its members (a) immediately prior to and (b) following this offering. All of the amounts and percentages below are calculated at an assumed initial public offering price of $17.00 per share, the midpoint of the range set forth on the cover page of this prospectus. If the initial public offering price is higher or lower than $17.00 per share, the amounts and percentages below could be higher or lower. |
| Shares Beneficially Owned Prior to This Offering |
Shares To Be Sold in This Offering Assuming No Exercise of the Option to Purchase Additional Shares |
Shares To Be Sold in This Offering Assuming Full Exercise of the Option to Purchase Additional Shares |
Shares Beneficially Owned After This Offering Assuming No Exercise of the Option to Purchase Additional Shares |
Shares Beneficially Owned After This Offering Assuming Full Exercise of the Option to Purchase Additional Shares |
||||||||||||||||||||||||||||
| Name |
# | % | # | # | # | % | # | % | ||||||||||||||||||||||||
| Funds managed by Golden Gate Capital(a) |
46,809,426 | 93.6 | % | 8,412,372 | 10,070,055 | 38,397,054 | 72.5 | % | 36,739,371 | 69.4 | % | |||||||||||||||||||||
| Paribas North America |
1,611,868 | 3.2 | % | 347,830 | 416,319 | 1,264,038 | 2.4 | % | 1,195,549 | 2.3 | % | |||||||||||||||||||||
| Charles Shaver |
80,035 | * | — | — | 80,035 | * | 80,035 | * | ||||||||||||||||||||||||
| Bryan A. Shinn |
496,441 | 1.0 | % | 23,674 | 38,079 | 472,767 | * | 458,362 | * | |||||||||||||||||||||||
| William A. White |
496,441 | 1.0 | % | 23,674 | 38,079 | 472,767 | * | 458,362 | * | |||||||||||||||||||||||
| John A. Ulizio |
505,789 | 1.0 | % | 15,979 | 25,703 | 489,810 | * | 480,086 | * | |||||||||||||||||||||||
| * | Represents beneficial ownership of less than one percent (1%) of our common stock. |
| (a) | Each of Messrs. Amara and Ashe is a managing director of Golden Gate Capital, and each may be deemed to be the beneficial owner of shares indirectly beneficially owned by the funds managed by Golden Gate Capital. |
Each of the above persons and entities, other than our parent LLC, disclaims membership in any group and disclaims beneficial ownership of these securities, except to the extent of his or its pecuniary interest therein. The principal office address of our parent LLC is c/o Golden Gate Private Equity, Inc., One Embarcadero Center, 39th Floor, San Francisco, California 94111.
| (2) | Does not include any shares of common stock Messrs. Amara and Ashe may be deemed to indirectly beneficially own through interests held by funds managed by Golden Gate Capital in our parent LLC. See note 1 above. |
124
Table of Contents
CERTAIN RELATIONSHIPS AND RELATED PARTY TRANSACTIONS
Policies for Approval of Related Person Transactions
In connection with this offering, we will adopt a written policy with respect to related party transactions. Under our related person transaction policy, a “Related Person Transaction” is any transaction, arrangement or relationship between us or any of our subsidiaries and a Related Person not including any transactions involving $120,000 or less when aggregated with all similar transactions. A “Related Person” is any of our executive officers, directors or director nominees, any stockholder beneficially owning in excess of 5% of our stock or securities exchangeable for our stock, any immediate family member of any of the foregoing persons, and any firm, corporation or other entity in which any of the foregoing persons is an executive officer, a partner or principal or in a similar position or in which such person has a 5% or greater beneficial ownership interest in such entity.
Pursuant to our Related Person Transaction policy, any Related Person Transaction must be approved or ratified by a majority of the disinterested directors on the board of directors or a designated committee thereof consisting solely of disinterested directors. In approving any Related Person Transaction, the board of directors or the committee must determine that the transaction is on terms no less favorable to us in the aggregate than those generally available to an unaffiliated third party under similar circumstances.
Transactions with Related Persons, though not classified as Related Person Transactions by our policy and thus not subject to its review and approval requirements, may still need to be disclosed if required by the applicable securities laws, rules and regulations.
Other than compensation agreements and other arrangements which are described under “Executive Compensation” and the transactions described below, since January 1, 2008, there has not been, and there is not currently proposed, any transaction or series of similar transactions to which we were or will be a party in which the amount involved exceeded or will exceed $120,000 and in which any of our directors, executive officers, holders of more than 5% of any class of our voting securities or any member of the immediate family of the foregoing persons had or will have a direct or indirect material interest.
Golden Gate Capital Acquisition
Acquisition Agreement
On November 25, 2008, Golden Gate Capital acquired U.S. Silica Company from Harbinger Capital pursuant to an Acquisition Agreement, dated June 27, 2008, by and among certain entities affiliated with Harbinger Capital and Golden Gate Capital. Prior to the Golden Gate Capital Acquisition, U.S. Silica Company was an indirect, wholly owned subsidiary of Harbinger Capital, held through its direct, wholly owned subsidiary, Hourglass Acquisition I, LLC. We were formed by Golden Gate Capital to effect the acquisition of Hourglass Acquisition I, LLC, and through that acquisition U.S. Silica Company became our indirect, wholly owned subsidiary. The consideration for the transaction was approximately $310.4 million (net of customary adjustments for transaction expenses, indebtedness and certain tax liabilities), consisting of a $126.2 million capital contribution from Golden Gate Capital and other investors, $182.0 million in borrowings under the Term Loan Facility and the Mezzanine Loan Facility (as defined below) and $27.0 million in advances from customers.
The Acquisition Agreement contains negotiated representations and warranties and covenants of our former owner and us. These representations and warranties and covenants continue in full force and effect for various periods specified in the Acquisition Agreement, ranging from six to thirty-six months. The Acquisition Agreement also provides for indemnification in the event of a breach of these representations and warranties and covenants. For breaches of certain of these representations and warranties, our former owner is not required to indemnify us for aggregate amounts less than $4.0 million or greater than $40.0 million. No party to the Acquisition Agreement has brought an indemnification claim against any other party as of the date of this prospectus.
125
Table of Contents
Advisory Agreement
In connection with the Golden Gate Capital Acquisition, we also entered into an Advisory Agreement with Golden Gate Capital, which agreement was subsequently amended and restated in connection with the refinancing of our Term Loan Facility on June 8, 2011. Pursuant to the Advisory Agreement, Golden Gate Capital agreed to provide business and organizational strategy and financial and advisory services as mutually agreed upon by Golden Gate Capital and us. Such services have included support and assistance to management with respect to negotiating and analyzing acquisitions and divestitures, negotiating and analyzing financing alternatives, preparing financial projections, monitoring compliance with financing agreements, marketing functions and searching for and hiring management personnel.
As compensation for these services, we paid Golden Gate Capital a one-time transaction fee as of the closing of the Golden Gate Capital Acquisition in the aggregate amount of $3.0 million and we pay (1) an annual advisory fee in the aggregate amount equal to $1.25 million, payable quarterly in arrears, and (2) a transaction fee of 1.25% of the aggregate value of each transaction resulting in a change in control of our parent LLC or its subsidiaries, along with each acquisition, divestiture, recapitalization and financing. In addition to the fees described above, we also reimburse Golden Gate Capital for all out-of-pocket costs incurred by Golden Gate Capital in connection with its activities under the Advisory Agreement, and indemnify Golden Gate Capital from and against all losses, claims, damages and liabilities related to the performance of its duties under the Advisory Agreement.
The Advisory Agreement has an initial term expiring on November 25, 2018 and is automatically renewable for additional one-year terms thereafter unless we or Golden Gate Capital give at least 90 days’ notice of non-renewal. The advisory fees paid to Golden Gate Capital aggregated $0.1 million, $1.0 million and $1.2 million in 2008, 2009 and 2010, respectively, and $0.9 million in the nine months ended September 30, 2011. These expenses are recorded as other operating expenses. In connection with this offering, we plan to pay Golden Gate Capital $8.0 million in connection with terminating this agreement.
Director Designation Agreement
In connection with this offering, we intend to enter into a director designation agreement with our parent LLC that will provide for the rights of our parent LLC to nominate designees to our board of directors. The director designation agreement will provide that, for so long as our parent LLC has nomination rights under the agreement, we may not take any action, including making or recommending any amendment to our certificate of incorporation or bylaws, that (1) would decrease the size of our board of directors if such decrease would cause us to fail to satisfy the requirement under the NYSE corporate governance standards that a majority of our board of directors consist of independent directors without the resignation of a director nominated by our parent LLC or (2) otherwise could reasonably be expected to adversely affect our parent LLC’s rights under the director designation agreement, in each case without the consent of our parent LLC.
Our parent LLC will have the right to nominate individuals to our board of directors at each meeting of stockholders where directors are to be elected and, subject to limited exceptions, we will include in the slate of nominees recommended to our stockholders for election as directors the number of individuals designated by our parent LLC as follows:
| • | prior to the earlier of (1) one year after our parent LLC owns less than 50% of our outstanding common stock or (2) our parent LLC owns less than 35% of our outstanding common stock, such number of individuals as are designated by our parent LLC, so long as we are able to comply with the requirement under the NYSE corporate governance standards that a majority of our board of directors consist of independent directors at such time as our parent LLC owns less than 50% of our outstanding common stock; and |
| • | during such time as our parent LLC no longer has the unfettered right to nominate individuals to our board of directors but while our parent LLC still owns at least 10% of our outstanding common |
126
Table of Contents
| stock, such number of individuals designated by our parent LLC in relative proportion to our parent LLC’s then current ownership (rounded up), so long as we are able to comply with the requirement under the NYSE corporate governance standards that a majority of our board of directors consist of independent directors at such time as our parent LLC owns less than 50% of our outstanding common stock. |
The director designation agreement will also provide that, in the event of a vacancy on our board of directors arising through the death, resignation or removal of a director nominated by our parent LLC, such vacancy may be filled by our board of directors only with a director nominated by our parent LLC. Our certificate of incorporation will provide that any director nominated by our parent LLC may, at its discretion, be removed at any time with or without cause.
Registration Rights Agreement
In connection with the Golden Gate Capital Acquisition, Golden Gate Capital entered into a registration rights agreement with us. Pursuant to the registration rights agreement, Golden Gate Capital has the right to request a long-form registration on not more than four occasions and a short-form registration on an unlimited number of occasions. In addition, Golden Gate Capital has piggyback registration rights in connection with offerings initiated by us.
The registration rights are subject to customary cutbacks and other limitations. We are able to postpone for a reasonable period of time, which may not exceed 120 days, the filing of a registration statement that Golden Gate Capital requests that we file pursuant to the registration rights agreement if our board of directors determines that the filing of the registration statement will have a material adverse effect on our plan to engage in certain business transactions.
We are required to pay all fees and expenses incurred in connection with the registrations, except that we are not required to pay for any underwriting discounts or commissions or transfer taxes relating to the transfer of securities by any persons other than us. We are also subject to customary cross-indemnification and contribution arrangements with respect to the registration of our common stock. Our parent LLC is required to comply with any lock-up restrictions that may be reasonably requested by the managing underwriters of an offering, regardless of whether its securities are included in a registration.
Indemnification Agreements
Prior to the completion of this offering, we intend to enter into indemnification agreements with each of our directors and executive officers. For more information regarding these agreements, see “Executive Compensation—Director and Officer Indemnification and Limitation of Liability.”
Parent LLC Promissory Note
On December 22, 2010, we entered into a promissory note with our parent LLC. See “Description of Certain Indebtedness—Parent LLC Promissory Note.”
Historical Credit Agreement
Mezzanine Loan Facility
On November 25, 2008, in connection with the Golden Gate Capital Acquisition, we entered into the Mezzanine Loan Facility with GGC Finance Partnership, L.P. (“GGC Finance”) pursuant to which we issued original notes in the aggregate principal amount of $80.0 million, and GGC Finance purchased such original notes in order to provide funds to us to consummate the Golden Gate Capital Acquisition. On May 7, 2010, we amended and restated the Mezzanine Loan Facility to effect the issuance of restated notes in the aggregate
127
Table of Contents
principal amount of $75.0 million in exchange for the original notes. The restated notes were scheduled to mature on May 7, 2017. The restated notes bore interest, during each interest period from the date of issuance until paid in full, at a rate per annum equal to adjusted LIBOR (as defined in the Mezzanine Loan Facility) for such fiscal quarter plus the applicable margin of 10.25% per annum, all or a part of which was permitted to be paid in kind. On June 8, 2011, we prepaid the restated notes in full in connection with the refinancing of the Term Loan Facility. The total payoff amount was $78.2 million, which consisted of a prepayment fee of $1.5 million, accrued interest of $1.7 million and a principal balance of $75.0 million.
Subordination Agreement
On November 25, 2008, we, Wells Fargo, BNP Paribas and GGC Finance entered into a Subordination Agreement (as amended, the “Subordination Agreement”) pursuant to which GGC Finance agreed to the subordination in right of payment of our existing and future obligations owed to GGC Finance to the payment of our existing and future obligations owed under the Term Loan Facility and the ABL Facility. On May 7, 2010, the Subordination Agreement was amended in connection with the amendment and restatement of the Note Purchase Agreement. Pursuant to the Subordination Agreement, the restated notes and all of our other obligations under the Mezzanine Loan Facility were at all times to be and remain subordinate and subject in right of payment to prior payment in full of all of our obligations under the Term Loan Facility and the ABL Facility. The Subordination Agreement was terminated in connection with our repayment in full of all outstanding indebtedness under the Mezzanine Loan Facility and the concomitant termination of such facility as described above.
128
Table of Contents
DESCRIPTION OF CERTAIN INDEBTEDNESS
Set forth below is a summary of the terms of the agreements governing certain of our outstanding indebtedness. This summary is not a complete description of all of the terms of the agreements. The agreements setting forth the principal terms and conditions of certain of our outstanding indebtedness are filed as exhibits to the registration statement of which this prospectus forms a part.
ABL Facility
On August 9, 2007, we entered into the ABL Facility with various banks and other financial institutions as lenders thereunder and Wells Fargo, as administrative agent and lender, which was amended by Amendment No. 1 and Consent to Loan and Security Agreement, dated as of November 25, 2008, Amendment No. 2 to Loan and Security Agreement and Consent, dated as of May 7, 2010, and Amendment No. 3 to Loan and Security Agreement and Consent, dated as of June 8, 2011, for an asset-based financing arrangement that allows the lenders to make loans and provide other financial accommodations in the aggregate amount of up to $35.0 million, with a letter of credit facility sublimit of $15.0 million; provided, however, that the aggregate principal amount of the loans and letter of credit obligations outstanding at any one time shall not exceed the borrowing base as set forth below. The ABL Facility is scheduled to expire on October 31, 2015.
Borrowing Base
The borrowing base is an amount equal to (a) 85% of eligible accounts; plus (b) the lesser of (1) the sum of (A) 30% multiplied by the value of the eligible work in process inventory; plus (B) 60% multiplied by the value of the eligible finished goods inventory and (2) $7.5 million; plus (c) 5% of eligible accounts (such amount in addition to clause (a) above; provided that such percentage shall be reduced by 1/6th of the original percentage amount as of each monthly anniversary of the closing date until such percentage is 0%); plus (d) the lesser of (1) 85% of eligible ITT receivables (as defined in the ABL Facility) and (2) $1.5 million; plus (e) 20% multiplied by the value of eligible stores inventory (provided that such percentage shall be reduced monthly by 1/6th of the original percentage amount as of each monthly anniversary of the closing date until such percentage is 0%); minus (f) reserves established from time to time by Wells Fargo. Subject to the terms of the ABL Facility, Wells Fargo, in its commercially reasonable discretion, shall be entitled to reduce or increase the advance rates and standards of eligibility.
Interest and Fees
Borrowings may be requested as prime rate loans or Eurocurrency rate loans; provided that if an event of default has occurred and is continuing, then Eurocurrency rate loans may not be requested. The applicable margin rate is determined based on excess availability as determined with reference to the borrowing base. Prime rate loans accrue interest at the prime rate plus (a) 1.75% if quarterly average excess availability is greater than $10.0 million or (b) 2.00% if quarterly average excess availability is less than or equal to $10.0 million. Eurocurrency rate loans accrue interest at the adjusted Eurocurrency rate plus (a) 2.75% if quarterly average excess availability is greater than $10.0 million or (b) 3.00% if quarterly average excess availability is less than or equal to $10.0 million.
Interest payments on prime rate loans are due on the first day of each calendar month in arrears. Interest payments on Eurocurrency rate loans are due (a) on the last day of each interest period for interest periods that are three months or (b) if the interest period exceeds three months, then on (1) each three-month anniversary of the first day of such interest period or (2) the last day of such interest period.
On the first day of each month in arrears, Wells Fargo is paid for the benefit of the lenders an unused line fee at a rate equal to 0.375% per annum calculated on the average daily unused portion of the maximum credit during the immediately preceding month (or part thereof). Wells Fargo is also paid letter of credit fees at a rate
129
Table of Contents
equal to the applicable margin per annum on the average daily maximum amount available to be drawn under all letters of credit for the immediately preceding quarter (or part thereof), payable in arrears as of the first day of each succeeding quarter. Such letter of credit fee rates equal (a) 2.75% if quarterly average excess availability is greater than $10.0 million or (b) 3.00% if quarterly average excess availability is less than or equal to $10.0 million. A letter of credit fronting and negotiation fee of 0.125% per annum on the average daily maximum amount available to be drawn under each letter of credit issued in addition to reasonable and customary charges is also paid, among other fees and amounts.
Prepayments
Voluntary prepayments are permitted in whole or in part, without premium or penalty, subject to certain minimum prepayment requirements (i.e., $1.0 million and multiples of $500,000 in excess thereof or, in accordance with settlement procedures, $100,000 and multiples of $100,000 in excess thereof). We have the right to terminate or permanently reduce the unused portion of the maximum credit at any time or from time to time upon five business days’ notice to Wells Fargo, subject to certain minimum requirements (i.e., $1.0 million and multiples of $500,000 in excess thereof); provided, however, that no such termination or reduction is permitted if (a) after giving effect thereto, the aggregate amount of the loans and the letter of credit obligations would exceed the maximum credit or (b) such termination or reduction would reduce the maximum credit to below $10.0 million, unless in connection with the termination of the ABL Facility and the repayment of the obligations thereunder.
The ABL Facility requires prepayments (1) upon demand by Wells Fargo, (2) with respect to 100% of net cash proceeds of any recovery event not used to acquire fixed or capital assets immediately after the 270th day of receipt thereof and (3) with respect to 100% of net cash proceeds within five business days of any asset disposition that exceeds the $500,000 threshold in any fiscal year; provided that such prepayments shall be subject to the terms of the Intercreditor Agreement (as defined below).
Covenants
Borrowings under the ABL Facility are subject to the accuracy of representations and warranties in all material respects and the absence of any defaults under the ABL Facility and the Term Loan Facility.
The ABL Facility contains customary covenants and restrictions on our activities related to, among other things: the incurrence of additional indebtedness; liens and negative pledges; dividends and distributions; investments, acquisitions and speculative transactions; contingent obligations; transactions with affiliates; fundamental changes to our business, property and assets; insurance; sale lease-backs; the ability to change the nature of our business, our fiscal year and our accounting policies; the ability to amend or waive any of the terms of any permitted subordinated debt, the Term Loan Facility and our organizational documents; designations of senior debt other than the ABL Facility obligations and the Term Loan Facility obligations; and the performance of material contracts, including intellectual property licenses. The ABL Facility also requires that we maintain (a) during any fiscal quarter, if excess availability falls below $6.5 million, a fixed charge coverage ratio of not less than 1.10 to 1.00 until excess availability is equal to or greater than $10.0 million and (b) aggregate excess availability of not less than $5.0 million at all times.
Events of Default
Events of default under the ABL Facility include, but are not limited to, (1) failure to pay principal, interest, fees or other amounts under the ABL Facility (inclusive of reimbursement of the issuing bank for letters of credit) when due, taking into account any applicable grace period, (2) cross-default or failure to pay certain other debt, (3) failure to perform or observe covenants and other terms of the ABL Facility or Term Loan Facility, subject to certain grace periods, (4) breach of warranty, (5) bankruptcy events, (6) unsatisfied final judgments (to the extent not covered by insurance) over a $10.0 million threshold, (7) dissolution, subject to certain cure
130
Table of Contents
periods, (8) certain defaults under ERISA, (9) certain change of control events (as defined in the ABL Facility), (10) the subordination provisions contained in or governing any subordinated debt cease to be in full force and effect, (11) any default in excess of $2.0 million that remains outstanding beyond the applicable cure period and permits the holders of such indebtedness to accelerate the debt, (12) any guarantor revokes or terminates or purports to revoke or terminate its guaranty and (13) the invalidity or impairment of any loan document or any security interest.
Guarantee and Security
All obligations under the ABL Facility are guaranteed by certain of our domestic subsidiaries. The obligations are secured by a first priority lien on all revolving loan priority collateral, which consists of deposit accounts, inventory, accounts receivable and property related thereto (the “ABL Collateral”).
Term Loan Facility
On November 25, 2008, in connection with the Golden Gate Capital Acquisition, we entered into the Term Loan Facility with various banks and other financial institutions as lenders thereunder and BNP Paribas, as administrative agent. On May 7, 2010, the Term Loan Facility was amended and restated to, among other things, (1) increase the aggregate principal amount available thereunder from $102.0 million to $165.0 million and (2) add an incremental term loan facility in the maximum aggregate principal amount of $25.0 million for the purpose of (1) funding permitted acquisitions, (2) opening new sand processing and mining facilities and (3) financing the payment of related fees and expenses. On June 8, 2011, the Term Loan Facility was again amended and restated to, among other things, (1) further increase the aggregate principal amount available thereunder to $260.0 million and (2) increase the maximum aggregate principal amount under the incremental term loan facility to $50.0 million. The proceeds of this second amendment and restatement were used to prepay the pre-existing obligations outstanding under the Term Loan Facility, repay in full all obligations under the Mezzanine Loan Facility, pay a cash dividend of up to $25.0 million and pay transaction costs. We paid certain fees, which were separately agreed, to the administrative agent in connection with the amendment and restatement.
Interest
Loans under the Term Loan Facility bear interest at a base rate (as defined in the Term Loan Facility, with a floor of the greater of 1.00% and one-month adjusted LIBOR (as defined in the Term Loan Facility) plus 1.00%) plus 2.75% per annum or adjusted LIBOR (with a floor of 1.00%) plus 3.75% per annum, as selected by us; provided that we will no longer be able to elect a LIBOR loan after the occurrence or during the continuation of an event of default. Interest payments for base rate loans are due quarterly on the last day of each March, June, September and December, and interest payments for LIBOR loans are due on the last day of each interest period, which we may choose to be a one-, two-, three- or six-month period or (if available to all senior lenders) a nine- or twelve-month period; provided that for each interest period longer than three months, the payment date also shall include each date that is three months or a multiple thereof after the commencement of such interest period. Since August 5, 2010, we have been required to maintain in effect one or more interest rate agreements in an aggregate notional principal amount of not less than 50% of the principal amount of our funded debt, which accrues interest at a floating rate.
Principal payments under the Term Loan Facility are due quarterly on the last day of each September, December, March and June. Beginning September 30, 2011, payments are made in equal installments of 0.25% of the initial principal balance until payments of 23.75% of the initial principal amount become due on September 30, 2016, December 31, 2016, March 31, 2017 and June 8, 2017; provided, that the scheduled installments of principal shall be reduced in connection with voluntary and mandatory prepayments. The Term Loan Facility matures on June 8, 2017.
131
Table of Contents
Prepayments
Voluntary prepayments are permitted in whole or in part, without premium or penalty, subject to certain minimum prepayment requirements (i.e., $500,000 and multiples of $100,000 in excess thereof) and payment of costs and expenses incurred by the lenders in connection with prepayment of LIBOR-based borrowings prior to the end of the applicable interest period for such borrowings.
The Term Loan Facility requires prepayments of principal with respect to (1) 100% of net cash proceeds from asset sales and (2) 100% of net cash proceeds from casualty insurance and condemnation awards, in each case subject to exceptions and reinvestment rights. The Term Loan Facility also requires prepayments of principal with respect to (1) 100% of net cash proceeds from the issuance of capital stock or incurrence of indebtedness by us (in each case subject to exceptions and not including our issuance of common stock in this offering), and (2) beginning in 2012, 50% of our consolidated excess cash flow or, if the consolidated leverage ratio is less than 2.75 to 1.00, 25% of our consolidated excess cash flow.
We, Golden Gate Capital or any of our or its respective affiliates may repurchase the term loans pursuant to an open pro rata tender process so long as (1) no condition or event that would trigger an event of default and no event of default has occurred and is continuing, (2) requisite lenders have given prior written consent and (3) prior notice has been given to BNP Paribas and all lenders indicating (a) the last date on which such offer may be accepted, (b) the maximum amount of such offer, (c) the repurchase price per dollar of principal amount of term loans and (d) the instructions about the process by which a lender may have its loan repurchased.
Covenants
The Term Loan Facility contains customary covenants and restrictions on our activities related to, among other things: the incurrence of additional indebtedness; liens and negative pledges; dividends and distributions; investments and acquisitions; contingent obligations; transactions with shareholders (holders of at least 10% of the equity securities) and affiliates; fundamental changes to our business, property and assets; sale lease-backs; the ability to change the nature of our business, our fiscal year and our accounting policies; the ability to amend or waive any of the terms of the Management Agreement, the ABL Facility and other material agreements; designations of senior debt other than the Term Loan Facility obligations and the ABL Facility obligations; and the performance of material contracts, including real property leases and intellectual property licenses. The Term Loan Facility also requires compliance with certain financial covenants, including the maintenance of a maximum consolidated leverage ratio as of the last day of each fiscal quarter at levels set forth in the Term Loan Facility and a maximum capital expenditures covenant restricting our capital expenditures at times when our unrestricted cash (including availability under the ABL facility) is less than $40.0 million.
Events of Default
Events of default under the Term Loan Facility include, but are not limited to, (1) failure to pay principal, interest, fees or other amounts under the Term Loan Facility when due, taking into account any applicable grace period, (2) cross-default or failure to pay certain other debt, (3) failure to perform or observe covenants and other terms of the Term Loan Facility, subject to certain grace periods, (4) breach of warranty, (5) bankruptcy events, (6) unsatisfied final judgments (to the extent not covered by insurance) over a $10.0 million threshold, (7) dissolution, subject to certain cure periods, (8) certain defaults under ERISA, (9) certain change of control events (as defined in the Term Loan Facility) and (10) the invalidity or impairment of any loan document or any security interest.
Guarantee and Security
All obligations under the Term Loan Facility are guaranteed by certain of our domestic subsidiaries. The obligations are secured by a first priority lien on all fixed assets and intellectual property and a second priority lien on all ABL Collateral.
132
Table of Contents
Intercreditor Agreement
The priority of the security interests and related creditor rights between the ABL Facility and the Term Loan Facility is set forth in an Intercreditor Agreement (the “Intercreditor Agreement”) dated as of November 25, 2008, as reaffirmed by the Reaffirmation of ABL/Term Loan Intercreditor Agreement, dated as of June 8, 2011, among us, Wells Fargo and BNP Paribas.
Parent LLC Promissory Note
On December 22, 2010, we entered into a $15.0 million promissory note with our parent LLC to provide working capital for a new subsidiary. The note matures on December 22, 2015 and bears interest at 10%. The principal amount and interest under the note are payable on demand, but no later than the maturity date. Upon sole election by our parent LLC, any unpaid interest may be paid in cash on December 22 of each year until the maturity date. Upon effectiveness of this offering, this note will be contributed as a capital contribution by our parent LLC to us.
133
Table of Contents
The following is a description of the material terms of our amended and restated certificate of incorporation and amended and restated bylaws as will each be in effect at or prior to the completion of this offering. The following description may not contain all of the information that is important to you. To understand the material terms of our common stock, you should read our amended and restated certificate of incorporation and amended and restated bylaws, copies of which are or will be filed with the SEC as exhibits to the registration statement, of which this prospectus is a part.
Authorized Capitalization
Prior to the effectiveness of our amended and restated certificate of incorporation, our authorized capital stock consists of 100,000,000 shares of common stock, par value $0.01 per share, and no preferred stock. Upon effectiveness of our amended and restated certificate of incorporation, our authorized capital stock will consist of 500,000,000 shares of common stock, par value $0.01 per share, and 10,000,000 shares of preferred stock, par value $0.01 per share.
As of January 17, 2012, 50,000,000 shares of our common stock were issued and outstanding and were owned by one stockholder of record. In addition, as of January 17, 2012, there were 1,501,398 outstanding options to purchase shares of our common stock.
Common Stock
Voting Rights
Each share of common stock entitles the holder to one vote with respect to each matter presented to our stockholders on which the holders of common stock are entitled to vote. Subject to any rights that may be applicable to any then outstanding preferred stock, our common stock votes as a single class on all matters relating to the election and removal of directors on our board of directors and as provided by law. Holders of our common stock will not have cumulative voting rights. Except in respect of matters relating to the election and removal of directors on our board of directors and as otherwise provided in our amended and restated certificate of incorporation or required by law, all matters to be voted on by our stockholders must be approved by a majority of the shares present in person or by proxy at the meeting and entitled to vote on the subject matter. In the case of election of directors, all matters to be voted on by our stockholders must be approved by a plurality of the votes entitled to be cast by all shares of common stock.
Dividend Rights
Subject to preferences that may be applicable to any then outstanding preferred stock, the holders of our outstanding shares of common stock are entitled to receive dividends, if any, as may be declared from time to time by our board of directors out of legally available funds. Because we are a holding company, our ability to pay dividends on our common stock is limited by restrictions on the ability of our subsidiaries to pay dividends or make distributions to us, including restrictions under the terms of the agreements governing our indebtedness. See “Description of Certain Indebtedness.” See also “Dividend Policy.”
Liquidation Rights
In the event of any voluntary or involuntary liquidation, dissolution or winding up of our affairs, holders of our common stock would be entitled to share ratably in our assets that are legally available for distribution to stockholders after payment of our debts and other liabilities. If we have any preferred stock outstanding at such time, holders of the preferred stock may be entitled to distribution and/or liquidation preferences. In either such case, we must pay the applicable distribution to the holders of our preferred stock before we may pay distributions to the holders of our common stock.
134
Table of Contents
Other Rights
Our stockholders have no preemptive, conversion or other rights to subscribe for additional shares. All outstanding shares are, and all shares offered by this prospectus will be, when sold, validly issued, fully paid and nonassessable. The rights, preferences and privileges of the holders of our common stock are subject to, and may be adversely affected by, the rights of the holders of shares of any series of our preferred stock that we may designate and issue in the future.
Listing
Our common stock has been approved for listing on the NYSE under the symbol “SLCA.”
Transfer Agent and Registrar
The transfer agent and registrar for our common stock will be Broadridge Corporate Issuer Solutions, Inc.
Preferred Stock
Our amended and restated certificate of incorporation will authorize our board of directors to provide for the issuance of shares of preferred stock in one or more series and to fix the preferences, powers and relative, participating, optional or other special rights, and qualifications, limitations or restrictions thereof, including the dividend rate, conversion rights, voting rights, redemption rights and liquidation preference and to fix the number of shares to be included in any such series without any further vote or action by our stockholders. Any preferred stock so issued may rank senior to our common stock with respect to the payment of dividends or amounts upon liquidation, dissolution or winding up, or both. The issuance of preferred stock may have the effect of delaying, deferring or preventing a change in control of our company without further action by the stockholders and may adversely affect the voting and other rights of the holders of common stock. The issuance of preferred stock with voting and conversion rights may adversely affect the voting power of the holders of common stock, including the loss of voting control to others. At present, we have no plans to issue any preferred stock.
Corporate Opportunity
As permitted under the DGCL, in our amended and restated certificate of incorporation, we will renounce any interest or expectancy in, or any offer of an opportunity to participate in, specified business opportunities that are presented to us or one or more of our officers, directors or stockholders. In recognition that directors, officers and/or employees of Golden Gate Capital may serve as directors and/or officers of ours, and Golden Gate Capital and its affiliates, not including us (the “Golden Gate Capital Entities”), may engage in similar activities or lines of business that we do, our amended and restated certificate of incorporation provides for the allocation of certain corporate opportunities between us and the Golden Gate Capital Entities. Specifically, none of the Golden Gate Capital Entities have any duty to refrain from engaging directly or indirectly in the same or similar business activities or lines of business that we do. In the event that a director or officer of Golden Gate Capital who is also a director or officer of ours acquires knowledge of a potential transaction or matter which may be a corporate opportunity for any of the Golden Gate Capital Entities and us, we will not have any expectancy in such corporate opportunity, and the director or officer will not have any duty to present such corporate opportunity to us and may pursue or acquire such corporate opportunity for itself or direct such opportunity to another person. A corporate opportunity that an officer or director of ours who is also a director or officer of any of the Golden Gate Capital Entities acquires knowledge of will not belong to us unless the corporate opportunity at issue is expressly offered in writing to such person solely in his or her capacity as a director or officer of ours. In addition, even if a business opportunity is presented to an officer or director of any of the Golden Gate Capital Entities in his or her capacity as an officer or director of ours, the following corporate opportunities will not belong to us: (1) those we are not financially able, contractually permitted or legally able to undertake; (2) those
135
Table of Contents
not in our line of business; (3) those of no practical advantage to us; and (4) those in which we have no interest or reasonable expectancy. Our amended and restated certificate of incorporation will require the affirmative vote of at least 80% of the voting power of all then outstanding shares of common stock to alter, amend or repeal the provisions of our amended and restated certificate of incorporation related to corporate opportunities or to adopt any provisions inconsistent with such provisions. Except with respect to our directors and/or officers who are also directors and/or officers of any of the Golden Gate Capital Entities, the corporate opportunity doctrine applies as construed pursuant to applicable Delaware laws, without limitation.
Choice of Forum
Our amended and restated certificate of incorporation will provide that the Court of Chancery of the State of Delaware will be the exclusive forum for any derivative action or proceeding brought on our behalf; any action asserting a breach of fiduciary duty; any action asserting a claim against us arising pursuant to the DGCL; any action regarding our amended and restated certificate of incorporation or our amended and restated bylaws; or any action asserting a claim against us that is governed by the internal affairs doctrine.
Anti-takeover Effects of Delaware Law and Our Certificate of Incorporation and Bylaws
Our amended and restated certificate of incorporation and amended and restated bylaws will also contain provisions that may delay, defer or discourage another party from acquiring control of us. We expect that these provisions, which are summarized below, will discourage coercive takeover practices or inadequate takeover bids. These provisions are also designed to encourage persons seeking to acquire control of us to first negotiate with our board of directors, which we believe may result in an improvement of the terms of any such acquisition in favor of our stockholders. However, they also give our board of directors the power to discourage acquisitions that some stockholders may favor.
Undesignated Preferred Stock
The ability to authorize undesignated preferred stock will make it possible for our board of directors to issue preferred stock with super voting, special approval, dividend or other rights or preferences on a discriminatory basis that could impede the success of any attempt to acquire us. These and other provisions may have the effect of deferring, delaying or discouraging hostile takeovers, or changes in control or management of our company.
Requirements for Advance Notification of Stockholder Meetings, Nominations and Proposals
Our amended and restated certificate of incorporation will provide that special meetings of the stockholders may be called only by either a resolution adopted by the affirmative vote of the majority of the directors then in office or by our parent LLC at any time that our parent LLC owns at least 35% of our then outstanding common stock. Our amended and restated bylaws will prohibit the conduct of any business at a special meeting other than as specified in the notice for such meeting. In addition, any stockholder who wishes to bring business before an annual meeting or nominate directors must comply with the requirements that will be set forth in our amended and restated bylaws; however, at any time that our parent LLC owns at least 35% of our outstanding common stock, the foregoing procedures related to advance notice will not apply to it. At any time that our parent LLC does not own at least 35% of our then outstanding common stock, special meetings of the stockholders may not be called. These provisions may have the effect of deferring, delaying or discouraging hostile takeovers, or changes in control or management of our company.
Stockholder Action by Written Consent
Pursuant to Section 228 of the DGCL, any action required to be taken at any annual or special meeting of the stockholders may be taken without a meeting, without prior notice and without a vote if a consent or consents in writing, setting forth the action so taken, is signed by the holders of outstanding stock having not less than the minimum number of votes that would be necessary to authorize or take such action at a meeting at which all shares of stock entitled to vote thereon were present and voted, unless the company’s certificate of incorporation provides otherwise. Upon the completion of this offering, our amended and restated certificate of incorporation
136
Table of Contents
will provide that stockholder action may be taken by written consent at any time our parent LLC owns at least 35% of our then outstanding common stock. At any time our parent LLC does not own at least 35% of our then outstanding shares of common stock, stockholders may not act by written consent.
Business Combinations with Interested Stockholders
We will elect in our amended and restated certificate of incorporation not to be subject to Section 203 of the DGCL, an anti-takeover law. In general, Section 203 prohibits a publicly held Delaware corporation from engaging in a business combination, such as a merger, with a person or group owning 15% or more of the corporation’s voting stock for a period of three years following the date the person became an interested stockholder, unless (with certain exceptions) the business combination or the transaction in which the person became an interested stockholder is approved in a prescribed manner. Accordingly, we are not subject to any anti-takeover effects of Section 203. However, our amended and restated certificate of incorporation contains provisions that have the same effect as Section 203, except that they provide that our parent LLC (or its members) and any persons to whom our parent LLC (or its members) sells its common stock will be deemed to have been approved by our board of directors, and thereby not subject to the restrictions set forth in Section 203.
Amendments
Upon the completion of this offering, amendments to our amended and restated certificate of incorporation will require the affirmative vote of at least 66 2/3% of our then outstanding common stock; provided, however, that at such times as our parent LLC owns at least 35% of our then outstanding common stock and wants to amend our amended and restated certificate of incorporation, such amendment will require the affirmative vote of the holders of a majority of our then outstanding common stock.
Upon the completion of this offering, our amended and restated bylaws may be amended by the affirmative vote of our directors; provided that, at any time that our parent LLC owns at least 35% of our then outstanding common stock, the consent of the directors nominated by our parent LLC shall be required for any such amendment. Our amended and restated bylaws may also be amended by the affirmative vote of the holders of at least 66 2/3% of our then outstanding common stock; provided, however, that at such times as our parent LLC owns at least 35% of our then outstanding common stock and wants to amend our amended and restated bylaws, such amendment will require the affirmative vote of the holders of a majority of our then outstanding common stock.
For purposes hereof, our “parent LLC” shall include our parent LLC, any of its members and any member of a group with our parent LLC or its members that may exist from time to time.
137
Table of Contents
SHARES ELIGIBLE FOR FUTURE SALE
Prior to this offering, there has been no public market for our common stock. Future sales of substantial amounts of our common stock in the public market, or the perception that such sales may occur, could adversely affect the prevailing market price of our common stock. No prediction can be made as to the effect, if any, future sales of shares, or the availability of shares for future sales, will have on the market price of our common stock prevailing from time to time. The number of shares available for future sale in the public market is subject to legal and contractual restrictions, some of which are described below. The expiration of these restrictions will permit sales of substantial amounts of our common stock in the public market, or could create the perception that these sales may occur, which could adversely affect the prevailing market price of our common stock. These factors could also make it more difficult for us to raise funds through future offerings of common stock.
Sale of Restricted Shares
Upon completion of this offering, we will have 52,941,176 shares of common stock outstanding. Of these shares of common stock, the 11,764,705 shares of common stock being sold in this offering, plus any shares sold by the selling stockholder upon exercise of the underwriters’ option to purchase additional shares, will be freely tradable without restriction under the Securities Act of 1933, as amended (the “Securities Act”), except for any such shares which may be held or acquired by an “affiliate” of ours, as that term is defined in Rule 144 promulgated under the Securities Act (“Rule 144”), which shares will be subject to the volume limitations and other restrictions of Rule 144 described below. The remaining shares of common stock that will be outstanding upon completion of this offering will be “restricted securities,” as that phrase is defined in Rule 144, and may be resold only after registration under the Securities Act or pursuant to an exemption from such registration, including, among others, the exemptions provided by Rule 144 and 701 under the Securities Act, which rules are summarized below. These remaining shares of common stock that will be outstanding upon completion of this offering will be available for sale in the public market after the expiration of the lock-up agreements described in “Underwriters,” taking into account the provisions of Rules 144 and 701 under the Securities Act.
Rule 144
The SEC adopted amendments to Rule 144 which became effective on February 15, 2008. Under these amendments, persons who became the beneficial owner of shares of our common stock prior to the completion of this offering may not sell their shares until the earlier of (1) the expiration of a six-month holding period, if we have been subject to the reporting requirements of the Securities Exchange Act of 1934, as amended (the “Exchange Act”) and have filed all required reports for at least 90 days prior to the date of the sale, or (2) a one-year holding period.
At the expiration of the six-month holding period, a person who was not one of our affiliates at any time during the three months preceding a sale would be entitled to sell an unlimited number of shares of our common stock provided current public information about us is available, and a person who was one of our affiliates at any time during the three months preceding a sale would be entitled to sell within any three-month period only a number of shares of common stock that does not exceed the greater of either of the following:
| • | 1% of the number of shares of our common stock then outstanding, which will equal approximately 529,412 shares immediately after this offering, based on the number of shares of our common stock outstanding after completion of this offering; or |
| • | the average weekly trading volume of our common stock on the NYSE during the four calendar weeks preceding the filing of a notice on Form 144 with respect to the sale. |
At the expiration of the one-year holding period, a person who was not one of our affiliates at any time during the three months preceding a sale would be entitled to sell an unlimited number of shares of our common
138
Table of Contents
stock without restriction. A person who was one of our affiliates at any time during the three months preceding a sale would remain subject to the volume restrictions described above.
Sales under Rule 144 by our affiliates are also subject to manner of sale provisions and notice requirements and to the availability of current public information about us.
Rule 701
In general, under Rule 701, any of our employees, directors, officers, consultants or advisors who acquired shares from us in connection with a compensatory stock or option plan or other written agreement before the effective date of this offering are eligible to resell such shares in reliance upon Rule 144 beginning 90 days after the date of this prospectus. If such person is not an affiliate, the sale may be made subject only to the manner-of-sale restrictions of Rule 144. If such a person is an affiliate, the sale may be made under Rule 144 without compliance with its one-year minimum holding period, but subject to the other Rule 144 restrictions described above.
Stock Plans
We intend to file one or more registration statements on Form S-8 under the Securities Act to register shares of our common stock issued or reserved for issuance under the 2011 Plan. The first such registration statement is expected to be filed soon after the date of this prospectus and will automatically become effective upon filing with the SEC. Accordingly, shares registered under such registration statement will be available for sale in the open market following the effective date, unless such shares are subject to vesting restrictions with us, Rule 144 restrictions applicable to our affiliates or the lock-up restrictions described below.
Lock-Up Agreements
We, each of our officers and directors and the selling stockholder have agreed, subject to certain exceptions, with the underwriters not to dispose of or hedge any of the shares of common stock or securities convertible into or exchangeable for, or that represent the right to receive, shares of common stock during the period from the date of the underwriting agreement to be executed by us in connection with this offering continuing through the date that is 180 days after the date of the underwriting agreement, except with the prior written consent of Morgan Stanley & Co. LLC. See “Underwriters.”
Registration Rights Agreement
In connection with the Golden Gate Capital Acquisition, Golden Gate Capital entered into a registration rights agreement with us. Pursuant to the registration rights agreement, Golden Gate Capital has the right to request a long-form registration on not more than four occasions and a short-form registration on an unlimited number of occasions. In addition, Golden Gate Capital has piggyback registration rights in connection with offerings initiated by us. See “Certain Relationships and Related Party Transactions—Registration Rights Agreement.”
139
Table of Contents
MATERIAL U.S. FEDERAL INCOME TAX CONSIDERATIONS FOR NON-U.S. HOLDERS
The following is a summary of material U.S. federal income tax consequences of the ownership and disposition of our common stock to a non-U.S. holder that purchases shares of our common stock in this offering. For purposes of this summary, a “non-U.S. holder” means a beneficial owner of our common stock that is, for U.S. federal income tax purposes:
| • | a nonresident alien individual; |
| • | a foreign corporation (or entity treated as a foreign corporation for U.S. federal income tax purposes); or |
| • | a foreign estate or foreign trust. |
A “non-U.S. holder” does not include an individual who is present in the United States for 183 days or more in the taxable year of disposition and is not otherwise a resident of the United States for U.S. federal income tax purposes. Such an individual is urged to consult his or her own tax adviser regarding the U.S. federal income tax consequences of the sale, exchange or other disposition of common stock. In the case of a holder that is classified as a partnership for U.S. federal income tax purposes, the tax treatment of a partner in such partnership generally will depend on the status of the partner and the activities of the partner and the partnership. If you are a partner in a partnership holding our common stock, then you should consult your own tax adviser.
This summary is based upon the provisions of the Internal Revenue Code of 1986, as amended, the Treasury regulations promulgated thereunder and administrative and judicial interpretations thereof, all as of the date hereof. Those authorities may be changed, perhaps retroactively, so as to result in U.S. federal income tax consequences different from those summarized below. We cannot assure you that a change in law, possibly with retroactive application, will not alter significantly the tax considerations that we describe in this summary. We have not sought and do not plan to seek any ruling from the U.S. Internal Revenue Service (the “IRS”), with respect to statements made and the conclusions reached in the following summary, and there can be no assurance that the IRS or a court will agree with our statements and conclusions.
This summary does not address all aspects of U.S. federal income taxes that may be relevant to non-U.S. holders in light of their personal circumstances, and does not deal with federal taxes other than the U.S. federal income tax or with non-U.S., state or local tax considerations. Special rules, not discussed here, may apply to certain non-U.S. holders, including:
| • | U.S. expatriates; |
| • | controlled foreign corporations; |
| • | passive foreign investment companies; and |
| • | investors in pass-through entities that are subject to special treatment under the Code. |
Such non-U.S. holders should consult their own tax advisers to determine the U.S. federal, state, local and other tax consequences that may be relevant to them.
This summary applies only to a non-U.S. holder that holds our common stock as a capital asset (within the meaning of Section 1221 of the Code).
If you are considering the purchase of our common stock, you should consult your own tax adviser concerning the particular U.S. federal income tax consequences to you of the ownership and disposition of our common stock, as well as the consequences to you arising under U.S. tax laws other than the federal income tax law or under the laws of any other taxing jurisdiction.
140
Table of Contents
Dividends
As discussed under “Dividend Policy” above, we do not currently expect to pay dividends. In the event that we make a distribution of cash or property (other than certain stock distributions) with respect to our common stock (or certain redemptions that are treated as distributions with respect to common stock), any such distributions will be treated as a dividend for U.S. federal income tax purposes to the extent paid from our current or accumulated earnings and profits (as determined for U.S. federal income tax purposes). Dividends paid to you generally will be subject to withholding of U.S. federal income tax at a 30% rate or such lower rate as may be specified by an applicable income tax treaty. However, dividends that are effectively connected with the conduct of a trade or business by you within the United States and, where a tax treaty applies, are generally attributable to a U.S. permanent establishment, are not subject to the withholding tax, but instead are subject to U.S. federal income tax on a net income basis at applicable graduated individual or corporate rates. Certain certification and disclosure requirements including delivery of a properly executed IRS Form W-8ECI must be satisfied for effectively connected income to be exempt from withholding. Any such effectively connected dividends received by a foreign corporation may be subject to an additional “branch profits tax” at a 30% rate or such lower rate as may be specified by an applicable income tax treaty.
If the amount of a distribution paid on our common stock exceeds our current and accumulated earnings and profits, such excess will be allocated ratably among each share of common stock with respect to which the distribution is paid and treated first as a tax-free return of capital to the extent of your adjusted tax basis in each such share, and thereafter as capital gain from a sale or other disposition of such share of common stock treated as described below under the heading “Gain on Disposition of Common Stock.” Your adjusted tax basis is generally the purchase price of such shares, reduced by the amount of any such tax-free returns of capital.
If you wish to claim the benefit of an applicable treaty rate to avoid or reduce withholding of U.S. federal income tax for dividends, then you must (a) provide the withholding agent with a properly completed IRS Form W-8BEN (or other applicable form) and certify under penalties of perjury that you are not a U.S. person and are eligible for treaty benefits, or (b) if our common stock is held through certain foreign intermediaries, satisfy the relevant certification requirements of applicable U.S. Treasury regulations. Special certification and other requirements apply to certain non-U.S. holders that act as intermediaries (including partnerships).
You should consult your tax adviser regarding the certification requirements for non-U.S. persons.
If you are eligible for a reduced rate of U.S. federal income tax pursuant to an income tax treaty, then you may obtain a refund or credit of any excess amounts withheld by filing timely an appropriate claim with the IRS.
Gain on Disposition of Common Stock
You generally will not be subject to U.S. federal income tax with respect to gain realized on the sale or other taxable disposition of our common stock, unless:
| • | the gain is effectively connected with a trade or business you conduct in the United States, and, in cases in which certain tax treaties apply, is attributable to a U.S. permanent establishment; or |
| • | we are or have been during a specified testing period a “U.S. real property holding corporation” (“USRPHC”) for U.S. federal income tax purposes, and certain other conditions are met. |
If you are engaged in a trade or business in the United States and the gain on disposition of the common stock is effectively connected with the conduct of this trade or business, you will be subject to tax on the net gain derived from the sale under regular graduated U.S. federal income tax rates. In addition, if you are a foreign corporation, you may be subject to the branch profits tax equal to 30% of your effectively connected earnings and profits or at such lower rate as may be specified by an applicable income tax treaty.
141
Table of Contents
We believe we are not currently a USRPHC for U.S. federal income tax purposes. However, because the determination of whether we are a USRPHC depends on the fair market value of our U.S. real property interests relative to the fair market value of our other trade or business assets and our non-U.S. real property interests from time to time, there can be no assurance that we are not or will not become a USRPHC. Even if we are a USRPHC, a gain arising from the sale or other taxable disposition by you of our common stock will not be subject to tax if such class of stock is considered to be “regularly traded” on an established securities market, and you own, actually or constructively, 5% or less of such class of our stock throughout the shorter of the five-year period ending on the date of the sale or other taxable disposition of the stock or your holding period for such stock. We expect our common stock to be “regularly traded” on an established securities market, although we cannot guarantee it will be so traded. If a gain on the sale or other taxable disposition of our stock were subject to taxation due to USRPHC status, you would be subject to U.S. federal income tax with respect to such gain in the same manner as a U.S. person (subject to any applicable alternative minimum tax and a special alternative minimum tax in the case of nonresident alien individuals) and the person acquiring our stock from you generally would have to withhold 10% of the amount of the proceeds of the disposition. A non-U.S. holder subject to withholding under such circumstances should consult its tax adviser as to whether such non-U.S. holder can obtain a refund or credit for all or a portion of the withheld amounts.
Information Reporting and Backup Withholding
We must report annually to the IRS and to you the amount of dividends paid to you and the amount of tax, if any, withheld with respect to such dividends. The IRS may make this information available to the tax authorities in the country in which you are resident.
In addition, you may be subject to information reporting requirements and backup withholding with respect to dividends paid on, and the proceeds of disposition of, shares of our common stock, unless, generally, you certify under penalties of perjury (usually on IRS Form W-8BEN) that you are not a U.S. person or you otherwise establish an exemption. Additional rules relating to information reporting requirements and backup withholding with respect to payments of the proceeds from the disposition of shares of our common stock are as follows:
| • | If the proceeds are paid to or through the U.S. office of a broker, the proceeds generally will be subject to backup withholding and information reporting, unless you certify under penalties of perjury (usually on IRS Form W-8BEN) that you are not a U.S. person or you otherwise establish an exemption. |
| • | If the proceeds are paid to or through a non-U.S. office of a broker that is not a U.S. person and is not a foreign person with certain specified U.S. connections (a “U.S.-related person”), information reporting and backup withholding generally will not apply. |
| • | If the proceeds are paid to or through a non-U.S. office of a broker that is a U.S. person or a U.S.-related person, the proceeds generally will be subject to information reporting (but not to backup withholding), unless you certify under penalties of perjury (usually on IRS Form W-8BEN) that you are not a U.S. person or you otherwise establish an exemption. |
Any amounts withheld under the backup withholding rules may be allowed as a refund or a credit against your U.S. federal income tax liability, provided the required information is timely furnished by you to the IRS.
Legislation Affecting Taxation of Common Stock Held By or Through Foreign Entities
Legislation enacted March 18, 2010 generally will impose a withholding tax of 30% on dividend income from our common stock and the gross proceeds of a disposition of our common stock paid to a foreign financial institution, unless such institution enters into an agreement with the U.S. government to collect and provide to the U.S. tax authorities substantial information regarding U.S. account holders of such institution (which would include certain equity and debt holders of such institution, as well as certain account holders that are foreign entities with U.S. owners). Absent any applicable exception, this legislation also generally will impose a
142
Table of Contents
withholding tax of 30% on dividend income from our common stock and the gross proceeds of a disposition of our common stock paid to a foreign entity that is not a foreign financial institution unless such entity provides the withholding agent with a certification identifying the substantial U.S. owners of the entity, which generally includes any U.S. person who directly or indirectly own more than 10% of the entity. Under certain circumstances, a non-U.S. holder of our common stock might be eligible for refunds or credits of such taxes, and a non-U.S. holder might be required to file a U.S. federal income tax return or other documentation as required by the IRS to claim such refunds or credits. This legislation generally is effective for payments made after December 31, 2012. Investors are encouraged to consult with their own tax advisers regarding the implications of this legislation on their investment in our common stock.
THE SUMMARY OF MATERIAL U.S. FEDERAL INCOME TAX CONSEQUENCES ABOVE IS INCLUDED FOR GENERAL INFORMATION PURPOSES ONLY. POTENTIAL PURCHASERS OF OUR COMMON STOCK ARE URGED TO CONSULT THEIR OWN TAX ADVISERS TO DETERMINE THE U.S. FEDERAL, STATE, LOCAL AND NON-U.S. TAX CONSIDERATIONS OF OWNING AND DISPOSING OF OUR COMMON STOCK.
143
Table of Contents
Under the terms and subject to the conditions in an underwriting agreement dated the date of this prospectus, the underwriters named below, for whom Morgan Stanley & Co. LLC is acting as representative, have severally agreed to purchase, and we and the selling stockholder have agreed to sell to them, severally, the number of shares indicated below:
| Name |
Number of Shares |
|||
| Morgan Stanley & Co. LLC |
||||
| Merrill Lynch, Pierce, Fenner & Smith |
||||
| Jefferies & Company, Inc. |
||||
| Simmons & Company International |
||||
| Dahlman Rose & Company, LLC |
||||
| BB&T Capital Markets, a division of Scott & Stringfellow, LLC |
||||
| BNP Paribas Securities Corp. |
||||
| Lazard Capital Markets LLC |
||||
| Moelis & Company LLC |
||||
|
|
|
|||
| Total: |
11,764,705 | |||
|
|
|
|||
The underwriters and the representative are collectively referred to as the “underwriters” and the “representative,” respectively. The underwriters are offering the shares of common stock subject to their acceptance of the shares from us and subject to prior sale. The underwriting agreement provides that the obligations of the several underwriters to pay for and accept delivery of the shares of common stock offered by this prospectus are subject to the approval of certain legal matters by their counsel and to certain other conditions. The underwriting agreement provides for a firm commitment underwriting, and the underwriters are obligated to take and pay for all of the shares of common stock offered by this prospectus if any such shares are taken. However, the underwriters are not required to take or pay for the shares covered by the underwriters’ option to purchase additional shares described below.
The underwriters initially propose to offer part of the shares of common stock directly to the public at the offering price listed on the cover page of this prospectus and part to certain dealers at a price that represents a concession not in excess of $ per share. After the initial offering of the shares of common stock, the offering price and other selling terms may from time to time be varied by the representative.
The selling stockholder has granted to the underwriters an option, exercisable for 30 days from the date of this prospectus, to purchase up to 1,764,706 additional shares of common stock at the public offering price listed on the cover page of this prospectus, less underwriting discounts and commissions. The underwriters may exercise this option solely for the purpose of covering sales of shares in excess of 11,764,705 shares, if any, made in connection with the offering of the shares of common stock offered by this prospectus. To the extent the option is exercised, each underwriter will become obligated, subject to certain conditions, to purchase about the same percentage of the additional shares of common stock as the number listed next to the underwriter’s name in the preceding table bears to the total number of shares of common stock listed next to the names of all underwriters in the preceding table.
144
Table of Contents
The following table shows the per share and total public offering price, underwriting discounts and commissions, and proceeds before expenses to us and the selling stockholder. These amounts are shown assuming both no exercise and full exercise of the underwriters’ option to purchase up to additional shares of common stock.
| Total | ||||||
| Per Share | No Exercise | Full Exercise | ||||
| Public offering price |
$ | $ | $ | |||
| Underwriting discounts and commissions to be paid by: |
||||||
| Us |
||||||
| Selling stockholder |
||||||
| Proceeds, before expenses, to us |
||||||
| Proceeds, before expenses, to selling stockholder |
||||||
The estimated offering expenses payable by us, exclusive of the underwriting discounts and commissions, are approximately $4.0 million.
The underwriters have informed us that they do not intend sales to discretionary accounts to exceed 5% of the total number of shares of common stock offered by them.
Our common stock has been approved for listing on the NYSE under the symbol “SLCA.”
We and all directors and officers and the holders of all of our outstanding stock and stock options have agreed that, subject to certain exceptions or otherwise without the prior written consent of Morgan Stanley & Co. LLC on behalf of the underwriters, we and they will not, during the period ending 180 days after the date of this prospectus (the “restricted period”):
| • | offer, pledge, sell, contract to sell, sell any option or contract to purchase, purchase any option or contract to sell, grant any option, right or warrant to purchase, lend, or otherwise transfer or dispose of, directly or indirectly, any shares of common stock or any securities convertible into or exercisable or exchangeable for shares of common stock; |
| • | enter into any swap or other arrangement that transfers to another, in whole or in part, any of the economic consequences of ownership of the common stock; or |
| • | file any registration statement with the SEC relating to the offering of any shares of common stock or any securities convertible into or exercisable or exchangeable for common stock; |
whether any such transaction described in the first two bullet points above is to be settled by delivery of common stock or such other securities, in cash or otherwise.
The restrictions described in the immediately preceding paragraph do not apply to the sale of shares to the underwriters.
With respect to us, the restrictions described above do not apply to:
| • | issuances of shares of our common stock upon the exercise of any existing option or warrant or the conversion of any security currently outstanding that is disclosed in this prospectus; |
| • | issuances of options or other equity compensation relating to our common stock pursuant to our existing equity compensation plan that is described in this prospectus; |
145
Table of Contents
| • | repurchases of shares of our common stock or any security convertible into our common stock held by any of our directors or officers pursuant to any management equity plan, stock option plan, or other management or employee benefit plan or agreement in connection with the director’s or officer’s termination of employment with us, provided that the terms of any such plan or agreement require such repurchase; |
| • | issuances of shares of our common stock in connection with any bona fide acquisition, joint venture, strategic partnership or collaboration arrangement, provided that the aggregate number of shares of our common stock issued is not greater than 5% of the number of shares outstanding as of the date of this prospectus, as adjusted to include the shares offered in this offering, and the recipient of the common stock agrees to be bound by the restrictions described above; or |
| • | the filing of a registration statement on Form S-8 or other appropriate forms as required by the Securities Act, and any amendments thereto, relating to our common stock issued or issuable under our existing equity compensation plan. |
With respect to our directors, officers and the other holders of our outstanding stock, the restrictions described above do not apply to:
| • | transactions relating to shares of our common stock or other securities acquired in open market transactions after the completion of this offering, provided that no filing under Section 16(a) of the Exchange Act shall be required or shall be voluntarily made in connection with subsequent sales of our common stock or other securities acquired in such open market transactions; |
| • | transfers of shares of our common stock or any security convertible into our common stock as a bona fide gift or by will or intestacy; |
| • | transfers of shares of our common stock or any security convertible into our common stock to any trust for the direct or indirect benefit of the director, officer or such other holder of our outstanding stock or an immediate family member of such individual; |
| • | distributions of shares of our common stock or any security convertible into our common stock to affiliates of the director, officer or such other holder of our outstanding stock, including distributions to general or limited partners, members, stockholders or wholly owned subsidiaries; |
| • | the establishment or amendment of a trading plan pursuant to Rule 10b5-1 under the Exchange Act for the transfer of shares of our common stock, provided that such plan does not provide for the transfer of shares of our common stock during the restricted period and no public announcement or filing under the Exchange Act regarding the establishment or amendment of such plan shall be required of or voluntarily made by or on behalf of the director, officer, such other holder of our outstanding stock or us during the restricted period; |
| • | transfers of shares of our common stock or any security convertible into our common stock pursuant to a bona fide third-party tender offer, merger, consolidation or other similar transaction made to all holders of our common stock involving a change of control of us, provided that in the event that the tender offer, merger, consolidation or other such transaction is not completed, the shares of our common stock owned by the director, officer or such other holder of our outstanding stock will remain subject to the restrictions described above; |
| • | making any demand for, or exercising any right with respect to, the registration of any shares of our common stock or any security convertible into or exercisable or exchangeable for our common stock, provided that no registration statement shall be filed with the SEC pursuant to such demand or right during the restricted period; or |
146
Table of Contents
| • | the exercise of any options to purchase our common stock held by the director, officer or such other holder of our outstanding stock in accordance with their terms and described in this prospectus, provided that the shares of our common stock issued to the director, officer or such other holder of our outstanding stock pursuant to such exercise will remain subject to the restrictions described above; |
provided that, in the case of any transfer or distribution pursuant to the second, third or fourth bullets above, (w) each transferee or distributee shall sign and deliver a lock-up agreement substantially in the form of the lock-up agreement signed by the director, officer or other holder of our outstanding stock and (x) no filing under Section 16(a) of the Exchange Act, reporting a reduction in beneficial ownership of shares of our common stock, shall be required or shall be voluntarily made during the restricted period, except such a filing may be made in the case of a distribution pursuant to the fourth bullet above, provided that such filing clearly states that (y) the reduction in beneficial ownership of shares of our common stock is the result of a distribution to affiliates and (z) all such distributees signed and delivered a lock-up agreement substantially in the form of the lock-up agreement signed by the director, officer or other holder of our outstanding stock.
The restricted period will be extended if:
| • | during the last 17 days of the restricted period we issue an earnings release or material news or a material event relating to us occurs; or |
| • | prior to the expiration of the restricted period, we announce that we will release earnings results during the 16-day period beginning on the last day of the restricted period, |
in which case the restrictions described above will continue to apply until the expiration of the 18-day period beginning on the issuance of the earnings release or the occurrence of the material news or material event.
Morgan Stanley & Co. LLC, in their sole discretion, may release the common stock and other securities subject to the lock-up agreements described above in whole or in part at any time with or without notice. When determining whether or not to release common stock and other securities from lock-up agreements, Morgan Stanley & Co. LLC will consider, among other factors, the holder’s reasons for requesting the release, the number of shares of common stock and other securities for which the release is being requested and market conditions at the time. There are no agreements between us or, to our knowledge, any holders of our outstanding stock or stock options and Morgan Stanley & Co. LLC regarding the early release of common stock and other securities from lock-up agreements, and we are not aware of any intention of Morgan Stanley & Co. LLC to release any common stock or other securities from lock-up agreements during the restricted period. At least two business days before the effectiveness of any written consent of Morgan Stanley & Co. LLC during the restricted period, (1) Morgan Stanley & Co. LLC will notify U.S. Silica of the impending release or waiver of any restriction and (2) Morgan Stanley & Co. LLC will announce such release or waiver through a major news service (unless previously announced), except where the release or waiver is effected solely to permit a transfer of common stock that is not for consideration and where the transferee has agreed in writing to be bound by the terms of the lock-up agreement.
As described below under “Directed Share Program,” any participants in the Directed Share Program shall be subject to a 180-day lock up with respect to any shares sold to them pursuant to that program. This lock up will have similar restrictions and an identical extension provision as the lock-up agreement described above. Any shares sold in the Directed Share Program to our directors or officers shall be subject to the lock-up agreement described above.
In order to facilitate the offering of the common stock, the underwriters may engage in transactions that stabilize, maintain or otherwise affect the price of the common stock. Specifically, the underwriters may sell more shares than they are obligated to purchase under the underwriting agreement, creating a short position. A short sale is covered if the short position is no greater than the number of shares available for purchase by the underwriters under the option to purchase additional shares of common stock. The underwriters can close out a
147
Table of Contents
covered short sale by exercising the option to purchase additional shares of common stock or purchasing shares in the open market. In determining the source of shares to close out a covered short sale, the underwriters will consider, among other things, the open market price of shares compared to the price available under the option to purchase additional shares of common stock. The underwriters may also sell shares in excess of the option to purchase additional shares of common stock, creating a naked short position. The underwriters must close out any naked short position by purchasing shares in the open market. A naked short position is more likely to be created if the underwriters are concerned that there may be downward pressure on the price of the common stock in the open market after pricing that could adversely affect investors who purchase in this offering. As an additional means of facilitating the offering, the underwriters may bid for, and purchase, shares of common stock in the open market to stabilize the price of the common stock. These activities may raise or maintain the market price of the common stock above independent market levels or prevent or retard a decline in the market price of the common stock. The underwriters are not required to engage in these activities and may end any of these activities at any time.
The estimated offering expenses payable by us, in addition to the underwriting discounts and commissions, are approximately $4.0 million, which includes legal, accounting and printing costs and various other fees associated with registering and listing our common stock. The underwriters have agreed to reimburse us and the selling stockholder for certain of these expenses.
We, the selling stockholder and the underwriters have agreed to indemnify each other against certain liabilities, including liabilities under the Securities Act.
A prospectus in electronic format may be made available on websites maintained by one or more underwriters, or selling group members, if any, participating in this offering. The representative may agree to allocate a number of shares of common stock to underwriters for sale to their online brokerage account holders. Internet distributions will be allocated by the representative to underwriters that may make Internet distributions on the same basis as other allocations.
Other Relationships
Certain of the underwriters and their respective affiliates have, from time to time, performed, and may in the future perform, various financial advisory and investment banking services for us, for which they received or will receive customary fees and expenses. In addition, Lazard Fréres & Co. LLC referred this transaction to Lazard Capital Markets LLC and will receive a referral fee from Lazard Capital Markets LLC in connection therewith.
Pricing of the Offering
Prior to this offering, there has been no public market for our common stock. The initial public offering price was determined by negotiations between us and the representative. Among the factors considered in determining the initial public offering price were our future prospects and those of our industry in general, our sales, earnings and certain other financial and operating information in recent periods, and the price-earnings ratios, price-sales ratios, market prices of securities, and certain financial and operating information of companies engaged in activities similar to ours.
Directed Share Program
At our request, the underwriters have reserved up to five percent of the shares of common stock to be issued by us and offered by this prospectus for sale, at the initial public offering price, to directors, officers, employees, business associates and related persons of U.S. Silica. If purchased by these persons, these shares will be subject to a 180-day lock-up restriction. The number of shares of common stock available for sale to the general public
148
Table of Contents
will be reduced to the extent these individuals purchase such reserved shares. Any reserved shares that are not so purchased will be offered by the underwriters to the general public on the same basis as the other shares offered by this prospectus.
Selling Restrictions
European Economic Area
In relation to each Member State of the European Economic Area which has implemented the Prospectus Directive (each, a “Relevant Member State”) an offer to the public of any shares of our common stock may not be made in that Relevant Member State, except that an offer to the public in that Relevant Member State of any shares of our common stock may be made at any time under the following exemptions under the Prospectus Directive, if they have been implemented in that Relevant Member State:
| (a) | to any legal entity which is a qualified investor as defined in the Prospectus Directive; |
| (b) | to fewer than 100 or, if the Relevant Member State has implemented the relevant provision of the 2010 PD Amending Directive, 150, natural or legal persons (other than qualified investors as defined in the Prospectus Directive), as permitted under the Prospectus Directive, subject to obtaining the prior consent of the representative for any such offer; or |
| (c) | in any other circumstances falling within Article 3(2) of the Prospectus Directive, provided that no such offer of shares of our common stock shall result in a requirement for the publication by us or any underwriter of a prospectus pursuant to Article 3 of the Prospectus Directive. |
For the purposes of this provision, the expression an “offer to the public” in relation to any shares of our common stock in any Relevant Member State means the communication in any form and by any means of sufficient information on the terms of the offer and any shares of our common stock to be offered so as to enable an investor to decide to purchase any shares of our common stock, as the same may be varied in that Relevant Member State by any measure implementing the Prospectus Directive in that Relevant Member State, the expression “Prospectus Directive” means Directive 2003/71/EC (and amendments thereto, including the 2010 PD Amending Directive, to the extent implemented in the Relevant Member State), and includes any relevant implementing measure in the Relevant Member State, and the expression “2010 PD Amending Directive” means Directive 2010/73/EU.
United Kingdom
Each underwriter has represented and agreed that:
| (a) | it has only communicated or caused to be communicated and will only communicate or cause to be communicated an invitation or inducement to engage in investment activity (within the meaning of Section 21 of the FSMA) received by it in connection with the issue or sale of the shares of our common stock in circumstances in which Section 21(1) of the FSMA does not apply to us; and |
| (b) | it has complied and will comply with all applicable provisions of the FSMA with respect to anything done by it in relation to the shares of our common stock in, from or otherwise involving the United Kingdom. |
Notice to Prospective Investors in Switzerland
The shares may not be publicly offered in Switzerland and will not be listed on the SIX Swiss Exchange (“SIX”) or on any other stock exchange or regulated trading facility in Switzerland. This document has been prepared without regard to the disclosure standards for issuance prospectuses under art. 652a or art. 1156 of the Swiss Code of Obligations or the disclosure standards for listing prospectuses under art. 27 ff. of the SIX Listing
149
Table of Contents
Rules or the listing rules of any other stock exchange or regulated trading facility in Switzerland. Neither this document nor any other offering or marketing material relating to the shares or the offering may be publicly distributed or otherwise made publicly available in Switzerland.
Neither this document nor any other offering or marketing material relating to the offering, the company, the shares have been or will be filed with or approved by any Swiss regulatory authority. In particular, this document will not be filed with, and the offer of shares will not be supervised by, the Swiss Financial Market Supervisory Authority FINMA (FINMA), and the offer of shares has not been and will not be authorized under the Swiss Federal Act on Collective Investment Schemes (“CISA”). The investor protection afforded to acquirers of interests in collective investment schemes under the CISA does not extend to acquirers of shares.
Notice to Prospective Investors in the Dubai International Financial Centre
This prospectus relates to an Exempt Offer in accordance with the Offered Securities Rules of the Dubai Financial Services Authority (“DFSA”). This prospectus is intended for distribution only to persons of a type specified in the Offered Securities Rules of the DFSA. It must not be delivered to, or relied on by, any other person. The DFSA has no responsibility for reviewing or verifying any documents in connection with Exempt Offers. The DFSA has not approved this prospectus nor taken steps to verify the information set forth herein and has no responsibility for the prospectus. The shares to which this prospectus relates may be illiquid and/or subject to restrictions on their resale. Prospective purchasers of the shares offered should conduct their own due diligence on the shares. If you do not understand the contents of this prospectus you should consult an authorized financial advisor.
150
Table of Contents
The validity of the common stock offered hereby will be passed upon for us by Kirkland & Ellis LLP, Chicago, Illinois. Certain partners of Kirkland & Ellis LLP are members of a limited partnership that is an investor in one or more investment funds affiliated with Golden Gate Capital. Kirkland & Ellis LLP represents entities affiliated with Golden Gate Capital in connection with legal matters. Certain legal matters will be passed upon for the underwriters by Davis Polk & Wardwell LLP, New York, New York.
151
Table of Contents
The financial statements in this prospectus and elsewhere in the registration statement have been so included in reliance upon the report of Grant Thornton LLP, independent registered public accountants, upon the authority of said firm as experts in accounting and auditing in giving said reports.
The information appearing in this prospectus concerning estimates of our proven and probable mineral reserves was derived from the report of John T. Boyd Company, independent mining engineers and geologists, and has been included herein under the authority of John T. Boyd Company as experts with respect to the matters covered by such report and in giving such report.
152
Table of Contents
WHERE YOU CAN FIND MORE INFORMATION
We have filed with the SEC a registration statement on Form S-1 under the Securities Act to register our common stock being offered in this prospectus. This prospectus, which forms part of the registration statement, does not contain all of the information included in the registration statement and the attached exhibits. You will find additional information about us and our common stock in the registration statement. References in this prospectus to any of our contracts, agreements or other documents are not necessarily complete, and you should refer to the exhibits attached to the registration statement for copies of the actual contracts, agreements or documents.
You may read and copy the registration statement, the related exhibits and other information we file with the SEC at the SEC’s Public Reference Room at 100 F Street, N.E., Room 1580, Washington, D.C. 20549. You may also obtain copies of this information by mail from the Public Reference Room at prescribed rates. You may obtain information regarding the operation of the Public Reference Room by calling 1-800-SEC-0330. The SEC also maintains a website that contains reports, proxy statements and other information about companies like us, who file electronically with the SEC. The address of that website is http://www.sec.gov. This reference to the SEC’s website is an inactive textual reference only and is not a hyperlink.
Upon the effectiveness of the registration statement, we will be subject to the reporting, proxy and information requirements of the Exchange Act, and will be required to file periodic reports, proxy statements and other information with the SEC. These periodic reports, proxy statements and other information will be available for inspection and copying at the SEC’s Public Reference Room and the website of the SEC referred to above, as well as on our website, http://www.ussilica.com. This reference to our website is an inactive textual reference only and is not a hyperlink. The contents of our website are not part of this prospectus, and you should not consider the contents of our website in making an investment decision with respect to our common stock. We will furnish our stockholders with annual reports containing audited financial statements and quarterly reports containing unaudited interim financial statements for each of the first three quarters of each year.
153
Table of Contents
INDEX TO COMBINED FINANCIAL STATEMENTS
| Page Number |
||||
| Report of Grant Thornton LLP, an Independent Registered Public Accounting Firm |
F-2 | |||
| Audited Combined Financial Statements |
||||
| Combined Balance Sheets as of December 31, 2010 and December 31, 2009 |
F-3 | |||
| F-5 | ||||
| F-6 | ||||
| F-7 | ||||
| F-9 | ||||
| Unaudited Combined Financial Statements |
||||
| Condensed Combined Balance Sheets as of September 30, 2011 and December 31, 2010 |
F-37 | |||
| Condensed Combined Statements of Operations for the nine months ended September 30, 2011 and 2010 |
F-39 | |||
| F-40 | ||||
| Condensed Combined Statements of Cash Flows for the nine months ended September 30, 2011 and 2010 |
F-41 | |||
| Notes to Condensed Combined Financial Statements (Unaudited) |
F-42 | |||
F-1
Table of Contents
Report of Independent Registered Public Accounting Firm
Board of Directors and Stockholders
U.S. Silica Holdings, Inc. and Subsidiaries and GGC RCS Holdings, Inc.
We have audited the accompanying combined balance sheets of U.S. Silica Holdings, Inc. (a Delaware corporation) and Subsidiaries and GGC RCS Holdings, Inc. as of December 31, 2010 and 2009, and the related combined statements of operations, stockholders’ equity, and cash flows for the years then ended and for the periods from November 25, 2008 to December 31, 2008 (Successor) and January 1, 2008 to November 24, 2008 (Predecessor). These financial statements are the responsibility of the Company’s management. Our responsibility is to express an opinion on the financial statements and financial statement schedule based on our audits.
We conducted our audits in accordance with the standards of the Public Company Accounting Oversight Board (United States). Those standards require that we plan and perform the audit to obtain reasonable assurance about whether the financial statements and schedule are free of material misstatement. The Company is not required to have, nor were we engaged to perform, an audit of its internal control over financial reporting. Our audits included consideration of internal control over financial reporting as a basis for designing audit procedures that are appropriate in the circumstances, but not for the purpose of expressing an opinion on the effectiveness of the Company’s internal control over financial reporting. Accordingly, we express no such opinion. An audit also includes examining, on a test basis, evidence supporting the amounts and disclosures in the financial statements and schedule, assessing the accounting principles used and significant estimates made by management, as well as evaluating the overall presentation of the financial statements and schedule. We believe that our audits provide a reasonable basis for our opinion.
In our opinion, the combined financial statements referred to above present fairly, in all material respects, the financial position of U.S. Silica Holdings, Inc. and Subsidiaries and GGC RCS Holdings, Inc. as of December 31, 2010 and 2009, and the results of their operations and their cash flows for the years then ended and for the periods from November 25, 2008 to December 31, 2008 (Successor) and January 1, 2008 to November 24, 2008 (Predecessor), in conformity with accounting principles generally accepted in the United States of America.
/s/ Grant Thornton LLP
Baltimore, Maryland
July 18, 2011
F-2
Table of Contents
U.S. Silica Holdings, Inc. and Subsidiaries and GGC RCS Holdings, Inc.
COMBINED BALANCE SHEETS
December 31,
(Dollars in thousands, except per share amounts)
| 2010 | 2009 | |||||||
| ASSETS | ||||||||
| CURRENT ASSETS |
||||||||
| Cash and cash equivalents |
$ | 64,500 | $ | 14,474 | ||||
| Accounts receivable |
||||||||
| Trade, net |
29,265 | 25,707 | ||||||
| Other |
779 | 6,054 | ||||||
| Inventories, net |
22,418 | 23,287 | ||||||
| Prepaid expenses and other current assets |
3,191 | 3,385 | ||||||
| Deferred income taxes, net |
4,557 | 3,549 | ||||||
| Income tax receivable |
2,150 | — | ||||||
|
|
|
|
|
|||||
| Total current assets |
126,860 | 76,456 | ||||||
|
|
|
|
|
|||||
| PROPERTY, PLANT AND EQUIPMENT |
||||||||
| Mining property and mine development |
154,529 | 154,529 | ||||||
| Asset retirement cost |
5,620 | 5,620 | ||||||
| Land |
21,618 | 18,647 | ||||||
| Land improvements |
9,261 | 9,261 | ||||||
| Buildings |
17,204 | 14,897 | ||||||
| Machinery and equipment |
111,227 | 95,589 | ||||||
| Furniture and fixtures |
28 | 28 | ||||||
| Construction-in-progress |
4,739 | 10,987 | ||||||
|
|
|
|
|
|||||
| 324,226 | 309,558 | |||||||
| Less accumulated depletion, depreciation and amortization |
36,631 | 18,723 | ||||||
|
|
|
|
|
|||||
| Total property, plant and equipment, net |
287,595 | 290,835 | ||||||
|
|
|
|
|
|||||
| OTHER ASSETS |
||||||||
| Debt issuance costs, net |
1,322 | 3,773 | ||||||
| Goodwill |
68,403 | 68,403 | ||||||
| Trade names |
10,436 | 10,436 | ||||||
| Customer relationships, net |
7,353 | 7,763 | ||||||
| Other |
6,565 | 6,301 | ||||||
|
|
|
|
|
|||||
| Total other assets |
94,079 | 96,676 | ||||||
|
|
|
|
|
|||||
| Total assets |
$ | 508,534 | $ | 463,967 | ||||
|
|
|
|
|
|||||
The accompanying notes are an integral part of these financial statements.
F-3
Table of Contents
| 2010 | 2009 | |||||||
| LIABILITIES AND STOCKHOLDER’S EQUITY | ||||||||
| CURRENT LIABILITIES |
||||||||
| Current portion of long-term debt |
$ | 1,510 | $ | 1,485 | ||||
| Book overdraft |
3,727 | 1,229 | ||||||
| Accounts payable |
12,027 | 9,779 | ||||||
| Accrued liabilities |
8,949 | 6,918 | ||||||
| Accrued interest |
101 | 79 | ||||||
| Income taxes payable |
— | 191 | ||||||
| Current portion of deferred revenue |
6,512 | 3,802 | ||||||
|
|
|
|
|
|||||
| Total current liabilities |
32,826 | 23,483 | ||||||
|
|
|
|
|
|||||
| LONG-TERM OBLIGATIONS |
||||||||
| Deferred income taxes, net |
53,124 | 53,440 | ||||||
| Long-term debt |
236,932 | 177,622 | ||||||
| Note payable to parent |
15,000 | — | ||||||
| Deferred revenue |
13,077 | 21,599 | ||||||
| Liability for pension and other postretirement benefits |
49,460 | 51,669 | ||||||
| Other long-term obligations |
10,551 | 9,124 | ||||||
|
|
|
|
|
|||||
| Total long-term obligations |
378,144 | 313,454 | ||||||
|
|
|
|
|
|||||
| COMMITMENTS AND CONTINGENCIES |
— | — | ||||||
| STOCKHOLDER’S EQUITY |
||||||||
| Common stock: |
||||||||
| Par value $0.01, authorized 100,000,000 shares, issued 50,000,000 shares |
500 | 500 | ||||||
| Additional paid-in capital |
102,519 | 126,649 | ||||||
| (Accumulated deficit) retained earnings |
(215 | ) | 3,681 | |||||
| Accumulated other comprehensive loss |
(5,240 | ) | (3,800 | ) | ||||
|
|
|
|
|
|||||
| Total stockholder’s equity |
97,564 | 127,030 | ||||||
|
|
|
|
|
|||||
| Total liabilities and stockholder’s equity |
$ | 508,534 | $ | 463,967 | ||||
|
|
|
|
|
|||||
The accompanying notes are an integral part of these financial statements.
F-4
Table of Contents
U.S. Silica Holdings, Inc. and Subsidiaries and GGC RCS Holdings, Inc.
COMBINED STATEMENTS OF OPERATIONS
Years ended December 31,
(Dollars in thousands, except per share amounts)
| 2010 | 2009 | 2008 | ||||||||||||||||
| Successor | Successor | Successor | Predecessor | |||||||||||||||
| 1/1 - 12/31 | 1/1 - 12/31 | 11/25 - 12/31 | 1/1 - 11/24 | |||||||||||||||
| Sales |
$ | 244,953 | $ | 191,623 | $ | 17,197 | $ | 216,386 | ||||||||||
| Cost of goods sold (excluding depreciation, depletion, and amortization, shown separately) |
157,994 | 136,200 | 13,605 | 154,616 | ||||||||||||||
| Operating expenses |
||||||||||||||||||
| Selling, general and administrative |
21,663 | 11,922 | 2,122 | 19,600 | ||||||||||||||
| Depreciation, depletion and amortization |
19,305 | 17,887 | 1,803 | 15,264 | ||||||||||||||
|
|
|
|
|
|
|
|
|
|||||||||||
| 40,968 | 29,809 | 3,925 | 34,864 | |||||||||||||||
|
|
|
|
|
|
|
|
|
|||||||||||
| Operating income (loss) |
45,991 | 25,614 | (333 | ) | 26,906 | |||||||||||||
| Other (expense) income |
||||||||||||||||||
| Interest expense |
(23,034 | ) | (28,228 | ) | (3,343 | ) | (640 | ) | ||||||||||
| Early extinguishment of debt |
(10,195 | ) | — | — | — | |||||||||||||
| Other income, net, including interest income |
959 | 4,894 | 145 | 1,326 | ||||||||||||||
|
|
|
|
|
|
|
|
|
|||||||||||
| (32,270 | ) | (23,334 | ) | (3,198 | ) | 686 | ||||||||||||
|
|
|
|
|
|
|
|
|
|||||||||||
| Income (loss) before income taxes |
13,721 | 2,280 | (3,531 | ) | 27,592 | |||||||||||||
| Income tax (expense) benefit |
(2,329 | ) | 3,259 | 1,673 | (8,457 | ) | ||||||||||||
|
|
|
|
|
|
|
|
|
|||||||||||
| NET INCOME (LOSS) |
$ | 11,392 | $ | 5,539 | $ | (1,858 | ) | $ | 19,135 | |||||||||
|
|
|
|
|
|
|
|
|
|||||||||||
| Earnings per share |
||||||||||||||||||
| Earnings (loss) per share (basic and diluted) |
$ | 0.23 | $ | 0.11 | $ | (0.04 | ) | |||||||||||
| Weighted-average common shares outstanding |
50,000,000 | 50,000,000 | 50,000,000 | |||||||||||||||
The accompanying notes are an integral part of these financial statements.
F-5
Table of Contents
U.S. Silica Holdings, Inc. and Subsidiaries and GGC RCS Holdings, Inc.
COMBINED STATEMENTS OF STOCKHOLDER’S EQUITY
Years ended December 31,
(Dollars in thousands)
| Accumulated
Other Comprehensive Income (Loss) |
||||||||||||||||||||||||||||
| Common stock |
Additional paid-in capital |
Retained earnings (accumulated deficit) |
Unrealized (loss) gain on derivatives |
Pension and other postretirement benefits liability |
Total | Total Stockholders’ equity |
||||||||||||||||||||||
| Predecessor Balance at January 1, 2008 |
$ | — | $ | 289,172 | $ | 3,258 | $ | (61 | ) | $ | (267 | ) | $ | (328 | ) | $ | 292,102 | |||||||||||
| Comprehensive income, net of income taxes |
||||||||||||||||||||||||||||
| Net income |
— | — | 19,135 | — | — | — | 19,135 | |||||||||||||||||||||
| Unrealized loss on derivatives |
— | — | — | (1,336 | ) | — | (1,336 | ) | (1,336 | ) | ||||||||||||||||||
| Minimum pension liability |
— | — | — | — | (14,733 | ) | (14,733 | ) | (14,733 | ) | ||||||||||||||||||
|
|
|
|||||||||||||||||||||||||||
| Total comprehensive income |
— | — | — | — | — | — | 3,066 | |||||||||||||||||||||
| Dividend |
— | — | (20,200 | ) | — | — | — | (20,200 | ) | |||||||||||||||||||
| Acquisition of U.S. Silica Company |
— | (167,972 | ) | (2,193 | ) | 1,397 | 15,000 | 16,397 | (153,768 | ) | ||||||||||||||||||
|
|
|
|
|
|
|
|
|
|
|
|
|
|
|
|||||||||||||||
| Predecessor Balance at November 24, 2008 |
— | 121,200 | — | — | — | — | 121,200 | |||||||||||||||||||||
| Comprehensive loss, net of income taxes |
||||||||||||||||||||||||||||
| Net loss |
— | — | (1,858 | ) | — | — | — | (1,858 | ) | |||||||||||||||||||
| Unrealized loss on derivatives |
— | — | — | (1,688 | ) | — | (1,688 | ) | (1,688 | ) | ||||||||||||||||||
| Minimum pension liability |
— | — | — | — | (991 | ) | (991 | ) | (991 | ) | ||||||||||||||||||
|
|
|
|||||||||||||||||||||||||||
| Total comprehensive loss |
— | — | — | — | — | — | (4,537 | ) | ||||||||||||||||||||
| Stock split |
500 | (500 | ) | — | — | — | — | — | ||||||||||||||||||||
| Capital contributed by parent |
— | 5,000 | — | — | — | — | 5,000 | |||||||||||||||||||||
|
|
|
|
|
|
|
|
|
|
|
|
|
|
|
|||||||||||||||
| Successor Balance at December 31, 2008 |
500 | 125,700 | (1,858 | ) | (1,688 | ) | (991 | ) | (2,679 | ) | 121,663 | |||||||||||||||||
| Comprehensive income, net of income taxes |
||||||||||||||||||||||||||||
| Net income |
— | — | 5,539 | — | — | — | 5,539 | |||||||||||||||||||||
| Unrealized gain on derivatives |
— | — | — | 1,639 | — | 1,639 | 1,639 | |||||||||||||||||||||
| Minimum pension liability |
— | — | — | — | (2,760 | ) | (2,760 | ) | (2,760 | ) | ||||||||||||||||||
|
|
|
|||||||||||||||||||||||||||
| Total comprehensive income |
— | — | — | — | — | — | 4,418 | |||||||||||||||||||||
| Equity-based compensation |
— | 949 | — | — | — | — | 949 | |||||||||||||||||||||
|
|
|
|
|
|
|
|
|
|
|
|
|
|
|
|||||||||||||||
| Successor Balance at December 31, 2009 |
500 | 126,649 | 3,681 | (49 | ) | (3,751 | ) | (3,800 | ) | 127,030 | ||||||||||||||||||
| Comprehensive income, net of income taxes |
||||||||||||||||||||||||||||
| Net income |
— | — | 11,392 | — | — | — | 11,392 | |||||||||||||||||||||
| Unrealized loss on derivatives |
— | — | — | (483 | ) | — | (483 | ) | (483 | ) | ||||||||||||||||||
| Minimum pension liability |
— | — | — | — | (957 | ) | (957 | ) | (957 | ) | ||||||||||||||||||
|
|
|
|||||||||||||||||||||||||||
| Total comprehensive income |
— | — | — | — | — | — | 9,952 | |||||||||||||||||||||
| Capital contributed by parent |
— | 11,800 | — | — | — | — | 11,800 | |||||||||||||||||||||
| Equity-based compensation |
— | 383 | — | — | — | — | 383 | |||||||||||||||||||||
| Dividend |
— | (36,313 | ) | (15,288 | ) | — | — | — | (51,601 | ) | ||||||||||||||||||
|
|
|
|
|
|
|
|
|
|
|
|
|
|
|
|||||||||||||||
| Successor Balance at December 31, 2010 |
$ | 500 | $ | 102,519 | $ | (215 | ) | $ | (532 | ) | $ | (4,708 | ) | $ | (5,240 | ) | $ | 97,564 | ||||||||||
|
|
|
|
|
|
|
|
|
|
|
|
|
|
|
|||||||||||||||
The accompanying notes are an integral part of these financial statements.
F-6
Table of Contents
U.S. Silica Holdings, Inc. and Subsidiaries and GGC RCS Holdings, Inc.
COMBINED STATEMENTS OF CASH FLOWS
Years ended December 31,
(Dollars in thousands)
| 2010 | 2009 | 2008 | ||||||||||||||||
| Successor | Successor | Successor | Predecessor | |||||||||||||||
| 1/1 - 12/31 | 1/1 - 12/31 | 11/25 - 12/31 | 1/1 - 11/24 | |||||||||||||||
| Cash flows from operating activities |
||||||||||||||||||
| Net income (loss) |
$ | 11,392 | $ | 5,539 | $ | (1,858 | ) | $ | 19,135 | |||||||||
| Adjustments to reconcile net income (loss) to net cash provided by operating activities |
||||||||||||||||||
| Depreciation, depletion and amortization |
19,305 | 17,887 | 1,803 | 15,264 | ||||||||||||||
| Debt issuance amortization |
450 | 853 | 474 | 28 | ||||||||||||||
| Original issue discount amortization |
383 | 830 | 83 | — | ||||||||||||||
| Early extinguishment of debt |
10,195 | — | — | — | ||||||||||||||
| Deferred income taxes |
(1,324 | ) | (4,236 | ) | (3,422 | ) | (6,746 | ) | ||||||||||
| Loss on disposal of property, plant and equipment |
2 | 8 | 9 | 1,777 | ||||||||||||||
| Deferred revenue |
(5,812 | ) | (1,693 | ) | 94 | — | ||||||||||||
| Liability for pension and other postretirement benefits |
(2,209 | ) | 3,757 | 1,801 | 20,644 | |||||||||||||
| Equity-based compensation |
383 | 949 | — | — | ||||||||||||||
| Other |
(770 | ) | (6,497 | ) | 11,741 | (19,053 | ) | |||||||||||
| Changes in assets and liabilities |
||||||||||||||||||
| Trade receivables |
(3,558 | ) | 1,102 | 5,435 | (2,863 | ) | ||||||||||||
| Other receivables |
5,275 | (1,391 | ) | (2,901 | ) | (49 | ) | |||||||||||
| Inventories |
869 | (225 | ) | (233 | ) | (2,112 | ) | |||||||||||
| Prepaid expenses and other current assets |
194 | 1,521 | 114 | (884 | ) | |||||||||||||
| Income taxes |
(2,341 | ) | 840 | (640 | ) | 167 | ||||||||||||
| Accounts payable and accrued liabilities |
4,282 | (5,293 | ) | (2,320 | ) | 2,606 | ||||||||||||
| Accrued interest |
22 | (88 | ) | 163 | (1 | ) | ||||||||||||
|
|
|
|
|
|
|
|
|
|||||||||||
| Net cash provided by operating activities |
36,738 | 13,863 | 10,343 | 27,913 | ||||||||||||||
| Cash flows from investing activities |
||||||||||||||||||
| Capital expenditures |
(15,241 | ) | (13,350 | ) | (2,224 | ) | (7,818 | ) | ||||||||||
| Asset acquisition |
— | — | (322,939 | ) | — | |||||||||||||
| Proceeds from sale of property, plant and equipment |
78 | 42 | — | 775 | ||||||||||||||
|
|
|
|
|
|
|
|
|
|||||||||||
| Net cash used in investing activities |
(15,163 | ) | (13,308 | ) | (325,163 | ) | (7,043 | ) | ||||||||||
F-7
Table of Contents
| 2010 | 2009 | 2008 | ||||||||||||||||
| Successor | Successor | Successor | Predecessor | |||||||||||||||
| 1/1 -12/31 | 1/1 - 12/31 | 11/25 - 12/31 | 1/1 - 11/24 | |||||||||||||||
| Cash flows from financing activities |
||||||||||||||||||
| Change in book overdraft |
2,497 | (1,488 | ) | (2,628 | ) | 1,435 | ||||||||||||
| Issuance of common stock |
— | — | 121,200 | — | ||||||||||||||
| Capital contributed by parent |
11,800 | — | 5,000 | — | ||||||||||||||
| Proceeds from issuance of note to parent |
15,000 | — | — | — | ||||||||||||||
| Dividends paid |
(51,601 | ) | — | — | (20,200 | ) | ||||||||||||
| Advances from customers |
— | — | 27,000 | — | ||||||||||||||
| Issuance of long-term debt |
65,909 | 3,307 | 176,860 | — | ||||||||||||||
| Repayment of long-term debt |
(11,214 | ) | (2,048 | ) | (1 | ) | (35 | ) | ||||||||||
| Principal payments on capital lease obligations |
(5 | ) | (4 | ) | (1 | ) | (3 | ) | ||||||||||
| Prepayment penalties on long-term debt |
(392 | ) | — | — | — | |||||||||||||
| Financing fees |
(3,543 | ) | (55 | ) | (4,908 | ) | — | |||||||||||
|
|
|
|
|
|
|
|
|
|||||||||||
| Net cash provided by (used in) financing activities |
28,451 | (288 | ) | 322,522 | (18,803 | ) | ||||||||||||
|
|
|
|
|
|
|
|
|
|||||||||||
| NET INCREASE IN CASH AND CASH EQUIVALENTS |
50,026 | 267 | 7,702 | 2,067 | ||||||||||||||
| Cash and cash equivalents at beginning of period |
$ | 14,474 | $ | 14,207 | 6,505 | 4,438 | ||||||||||||
|
|
|
|
|
|
|
|
|
|||||||||||
| Cash and cash equivalents at end of period |
$ | 64,500 | $ | 14,474 | $ | 14,207 | $ | 6,505 | ||||||||||
|
|
|
|
|
|
|
|
|
|||||||||||
| Supplemental disclosure of cash flow information: |
||||||||||||||||||
| Cash paid during the period for: |
||||||||||||||||||
| Interest |
$ | 20,108 | $ | 22,103 | $ | 2,152 | $ | 609 | ||||||||||
| Income taxes |
4,246 | 301 | 656 | 3,928 | ||||||||||||||
The accompanying notes are an integral part of these financial statements.
F-8
Table of Contents
U.S. Silica Holdings, Inc. and Subsidiaries and GGC RCS Holdings, Inc.
NOTES TO COMBINED FINANCIAL STATEMENTS
December 31, 2010 and 2009
(Dollars in thousands, except per share amounts)
NOTE A—ORGANIZATION
U.S. Silica Holdings, Inc. (“Holdings”), formerly GGC USS Holdings, Inc., was organized November 14, 2008 and is a wholly-owned subsidiary of GGC USS Holdings, LLC. On November 25, 2008, U.S. Silica Holdings, Inc. acquired Hourglass Acquisition I, LLC, whose only operating subsidiary was U.S. Silica Company (“U.S. Silica”). Holdings also owns Preferred Rocks USS, Inc (Preferred Rocks). In addition, effective with the offering of securities under Form S-1 to be filed with the Securities and Exchange Commission, GGC USS Holdings, LLC will contribute to Holdings all of the stock of its wholly-owned subsidiary, GGC RCS Holdings, Inc., whose operating subsidiary is Coated Sand Solutions, LLC. U.S. Silica produces industrial minerals and Preferred Rocks maintains supply agreements with certain customers in the oil and gas market. Coated Sand Solutions is developing resin-coated sand products for sale into the oil and gas market.
Holdings and its subsidiaries are presented on a combined basis with GGC RCS Holdings, Inc. and are collectively referred to as the “Company” in the accompanying financial statements and footnotes.
On November 25, 2008, U.S. Silica Holdings, Inc. acquired Hourglass Acquisition I, LLC by purchasing 100% of its member units for approximately $310.4 million. The acquisition was financed as follows:
| Equity contribution |
$ | 121,200 | ||
| Senior term loan (net of original issue discount of $3,060) |
98,940 | |||
| Subordinated promissory notes (net of original issue discount of $2,400) |
77,600 | |||
| Customer advances |
27,000 | |||
| Debt assumed |
86 | |||
|
|
|
|||
| Total consideration |
324,826 | |||
| Less cash received |
(14,440 | ) | ||
| Purchase price, net of cash received |
$ | 310,386 | ||
|
|
|
The equity was contributed by GGC USS Holdings, LLC through the purchase of 50,000,000 shares of U.S. Silica Holdings, Inc. common stock. The senior term loan, subordinated promissory notes, customer advances, and debt assumed were incurred by the Company’s subsidiary, U.S. Silica Company.
In December, the Company’s parent made an additional $5 million capital contribution in cash. The acquisition was accounted for under the purchase method and the purchase price was allocated to the assets acquired and liabilities assumed based on their fair values at the date of acquisition. The results of operations for the acquisition have been included since the date of acquisition in the accompanying financial statements. The excess purchase price over the fair value of the net assets acquired of approximately $68.4 million has been allocated to goodwill. The allocation of the purchase price was as follows:
| Working capital, other than cash |
$ | 38,963 | ||
| Property, plant and equipment |
139,645 | |||
| Mining property and reserves |
154,423 | |||
| Goodwill |
68,403 | |||
| Other intangibles |
18,651 | |||
| Other assets |
11,297 | |||
| Other liabilities |
(60,077 | ) | ||
| Deferred income taxes |
(60,919 | ) | ||
|
|
|
|||
| Purchase price, net of cash received |
$ | 310,386 | ||
|
|
|
F-9
Table of Contents
U.S. Silica Holdings, Inc. and Subsidiaries and GGC RCS Holdings, Inc.
NOTES TO COMBINED FINANCIAL STATEMENTS
December 31, 2010 and 2009
(Dollars in thousands, except per share amounts)
NOTE A—ORGANIZATION—Continued
The following unaudited supplemental pro forma financial information reflects the combined results of operations as if the acquisition had occurred at the beginning of 2008. The supplemental pro forma information includes adjustments primarily for interest expense as well as additional depreciation, depletion and amortization based upon the fair values of property, plant and equipment and intangible assets.
| For the Year Ended December 31, 2008 (unaudited) |
||||
| Revenue |
$ | 233,583 | ||
| Net loss |
$ | (1,581 | ) | |
NOTE B—SUMMARY OF SIGNIFICANT ACCOUNTING POLICIES
Principles of Combination
The combined financial statements include the accounts of Holdings and its direct and indirect wholly-owned subsidiaries and GGC RCS Holdings, Inc. (formed in 2010). All significant intercompany balances and transactions have been eliminated in combination.
Use of Estimates and Assumptions
The preparation of financial statements in conformity with accounting principles generally accepted in the United States of America requires management to make estimates and assumptions that affect the reported amounts of assets and liabilities and the disclosure of contingent assets and liabilities at the dates of the financial statements and the reported amounts of revenues and expenses during the reporting periods. Significant estimates include allowance for doubtful accounts, inventory obsolescence, amortization, depreciation and depletion, income taxes, environmental and product liabilities, mine reclamation and employee benefit costs. Actual results could differ from those estimates.
Cash and Cash Equivalents
All highly liquid investments with a maturity of three months or less when purchased are considered cash equivalents. The Company places its cash in high quality institutions. Accounts at each institution are insured by Federal Deposit Insurance Corporation. Cash balances at times may exceed federally-insured limits. The Company has not experienced any losses in such accounts and believes it is not exposed to any significant credit risk on cash.
Accounts Receivable
The majority of the Company’s accounts receivable are due from companies in the glass, oil and natural gas drilling, building products, filler and extenders, foundries and other major industries. Credit is extended based on evaluation of a customers’ financial condition and, generally, collateral is not required. Accounts receivable are generally due within 30 days and are stated at amounts due from customers net of an allowance for doubtful accounts. Accounts outstanding longer than the payment terms are considered past due. The Company determines its allowance by considering a number of factors, including the length of time trade accounts receivable are past due, the Company’s previous loss history, the customer’s current ability to pay its obligation
F-10
Table of Contents
U.S. Silica Holdings, Inc. and Subsidiaries and GGC RCS Holdings, Inc.
NOTES TO COMBINED FINANCIAL STATEMENTS
December 31, 2010 and 2009
(Dollars in thousands, except per share amounts)
NOTE B—SUMMARY OF SIGNIFICANT ACCOUNTING POLICIES—Continued
Accounts Receivable—continued
to the Company, and the condition of the general economy and the industry as a whole. The Company writes-off accounts receivable when they are deemed uncollectible, and payments subsequently received on such receivables are credited to the allowance for doubtful accounts.
Inventories
Inventories are stated at the lower of cost or market. Cost is determined using the first-in, first-out and average cost methods.
Revenue Recognition
Revenue is recorded when legal title passes at the time of shipment to the customer and all of the following four criteria are met: pervasive evidence of an exchange arrangement exists, delivery has occurred, the selling price is fixed or determinable, and collectability is reasonably assured. Amounts received from customers in advance of revenue recognition are deferred as liabilities.
The Company derives its sales by mining and processing minerals that its customers purchase for various uses. Its sales are primarily a function of the price per ton realized and the volumes sold. In some instances, its sales also include a charge for transportation services it provides to its customers. The Company’s transportation revenue fluctuates based on a number of factors, including the volume of product it transports under contract, service agreements with its customers, the mode of transportation utilized and the distance between its plants and customers.
The Company primarily sells its products under short-term price agreements or at prevailing market rates. For a limited number of customers, the Company sells under long-term, competitively-bid supply agreements. The Company has take-or-pay supply agreements with three of its customers in the oil & gas proppants segment with initial terms expiring between 2014 and 2016. These agreements define, among other commitments, the volume of product that its customers must purchase, the volume of product that it must provide and the price that it will charge and that its customers will pay for each product. Prices under these agreements are generally fixed and subject to upward adjustment in response to certain cost increases. As a result, the Company’s realized prices may not grow at rates consistent with broader industry pricing. For example, during periods of rapid price growth, its realized prices may grow more slowly than those of competitors, and during periods of price decline, its realized prices may outperform industry averages.
The Company invoices the majority of its clients on a per shipment basis, although for some larger customers, the Company consolidates invoices weekly or monthly. Standard terms are net 30 days, although extended terms are offered in competitive situations. The amounts invoiced include the amount charged for the product, transportation costs (if paid by the Company) and costs for additional services as applicable, such as costs related to transload the product from railcars to trucks for delivery to the customer site.
F-11
Table of Contents
U.S. Silica Holdings, Inc. and Subsidiaries and GGC RCS Holdings, Inc.
NOTES TO COMBINED FINANCIAL STATEMENTS
December 31, 2010 and 2009
(Dollars in thousands, except per share amounts)
NOTE B—SUMMARY OF SIGNIFICANT ACCOUNTING POLICIES—Continued
Earnings Per Share
Basic earnings per share excludes dilution and is computed using the weighted average number of shares of common stock outstanding. Diluted earnings per share reflects the potential dilution that could occur if securities or other contracts to issue common stock were exercised or converted into common stock or resulted in the issuance of common stock that then shared in the earnings. The Company has no potentially dilutive securities outstanding.
Transportation Revenue and Expense
Transportation revenue is the revenue the Company receives from charging its customers to deliver product to their locations or to a transload site from which customers are able to take possession and is included in revenue. Transportation expense is the cost the Company pays to ship product from its production facilities to customer facilities or to a transload site from which customers can take possession and is included in cost of goods sold.
Debt Issuance Costs
Debt issuance costs consist of loan origination costs, which are being amortized using the effective interest method over the term of the related debt principal. Amortization included in interest expense was $447 for the year ended December 31, 2010, $853 for the year ended December 31, 2009, and $28 and $471 for the 2008 predecessor and successor periods, respectively.
Property, Plant and Equipment
Depreciable properties, mining properties, and mineral deposits acquired in connection with business acquisitions are recorded at fair market value as of the date of acquisition. Additions and improvements occurring through the normal course of business are capitalized at cost.
Upon retirement or disposal of assets, the cost and accumulated depreciation or amortization are eliminated from the accounts and any gain or loss is reflected in the statement of operations. Expenditures for normal repairs and maintenance are expensed as incurred. Construction-in-progress is primarily comprised of machinery and equipment, which has not yet been placed in service.
Depreciation is computed using the straight-line method over the estimated useful lives of the assets, ranging from 1 to 15 years. Leasehold improvements are amortized over the shorter of the useful lives of the asset or the lease term.
Depletion and amortization of mineral deposits are provided, as the minerals are extracted, based on units of production and engineering estimates of mineable reserves. The impact of revisions to reserve estimates is recognized on a prospective basis.
The amount of interest costs capitalized in property, plant and equipment was $456 for the year ended December 31, 2010, $185 for the year ended December 31, 2009, and $0 for both the predecessor and successor 2008 reporting periods.
F-12
Table of Contents
U.S. Silica Holdings, Inc. and Subsidiaries and GGC RCS Holdings, Inc.
NOTES TO COMBINED FINANCIAL STATEMENTS
December 31, 2010 and 2009
(Dollars in thousands, except per share amounts)
NOTE B—SUMMARY OF SIGNIFICANT ACCOUNTING POLICIES—Continued
Goodwill and Other Intangible Assets and Related Impairment
The Company’s intangible assets consist of goodwill, which is not being amortized; indefinite lived intangibles, which consist of certain trade names that are not subject to amortization; and customer relationships, which are being amortized on a straight-line basis over their useful life of 20 years. Goodwill represents the excess of purchase price over the fair value of net assets from the business acquisition. As of December 31, 2010, the gross carrying amount of the customer relationships intangible asset was $8.2 million with accumulated amortization of $817. The estimated annual amortization in each of the next five years is $406.
Goodwill and other intangible assets with indefinite lives are reviewed for impairment annually as of October 31 or more frequently whenever events or circumstances change that would more likely than not reduce the fair value of those assets. The impairment test for goodwill requires a comparison of the fair value with the carrying amount, including goodwill. If this comparison reflects impairment, then the loss would be measured as the excess of recorded goodwill over its implied fair value. Implied fair value is the excess of the fair value of the Company over the fair value of all recognized and unrecognized assets and liabilities.
The evaluation of goodwill for possible impairment includes estimating the fair value of the Company using discounted cash flows and multiples of cash earnings valuation techniques, plus valuation comparisons to similar businesses. These valuations require the Company to make estimates and assumptions regarding future operating results, cash flows, changes in working capital and capital expenditures, selling prices, profitability, and the cost of capital. Although the Company believes that the estimates and assumptions used were reasonable, actual results could differ from those estimates and assumptions.
Impairment of Long-Lived Assets Excluding Goodwill
The Company periodically evaluates whether current events or circumstances indicate that the carrying value of its long-lived assets to be held and used may not be recoverable. If such circumstances are determined to exist, an estimate of future cash flows produced by the long-lived assets, or the appropriate grouping of assets, is compared to the carrying value to determine whether an impairment exists. If an asset is determined to be impaired, the loss is measured based on quoted market prices in active markets, if available. If quoted market prices are not available, the estimate of fair value is based on various valuation techniques, including a discounted value of estimated future cash flows. A detailed determination of the fair value may be carried forward from one year to the next if certain criteria have been met. The Company reports an asset to be disposed of at the lower of its carrying value or its estimated net realizable value.
Mine Exploration and Development
Costs to develop new mining properties and expand existing properties are capitalized and amortized based on units of production.
F-13
Table of Contents
U.S. Silica Holdings, Inc. and Subsidiaries and GGC RCS Holdings, Inc.
NOTES TO COMBINED FINANCIAL STATEMENTS
December 31, 2010 and 2009
(Dollars in thousands, except per share amounts)
NOTE B—SUMMARY OF SIGNIFICANT ACCOUNTING POLICIES—Continued
Mine Reclamation Costs
The estimated net future costs of dismantling, restoring and reclaiming operating mines and related mine sites, in accordance with federal, state and local regulatory requirements, are accrued in the period in which the liability is incurred at the estimated fair value. The associated asset retirement costs are capitalized as part of the carrying amount of the underlying asset and depreciated over the estimated useful life of the asset. The liability is accreted through charges to operating expenses. If the asset retirement obligation is settled for other than the carrying amount of the liability, a gain or loss is recognized on settlement. The Company reported a liability of $6.4 million and $5.9 million in other long-term obligations related to this obligation as of December 31, 2010 and 2009, respectively. Changes in the asset retirement obligation are as follows:
| 2010 | 2009 | |||||||
| Beginning balance |
$ | 5,905 | $ | 5,639 | ||||
| Payments |
— | (192 | ) | |||||
| Accretion |
496 | 458 | ||||||
|
|
|
|
|
|||||
| Ending balance |
$ | 6,401 | $ | 5,905 | ||||
|
|
|
|
|
|||||
Income Taxes
Deferred taxes are provided on the liability method whereby deferred tax assets are recognized for deductible temporary differences and operating loss and tax credit carryforwards and deferred tax liabilities are recognized for taxable temporary differences. This approach requires recognition of deferred tax liabilities and assets for the expected future tax consequences of events that have been included in the financial statements or tax returns. Under this method, deferred tax liabilities and assets are determined based upon the difference between the financial statement and tax basis of assets and liabilities using enacted tax rates in effect for the year in which the expenses are expected to reverse. Valuation allowances are provided if, based on the weight of available evidence, it is more likely than not that some or all of the deferred tax assets will not be realized.
The Company recognizes a tax benefit associated with an uncertain tax position when, in management’s judgment, it is more likely than not that the position will be sustained upon examination by a taxing authority. For a tax position that meets the more-likely-than-not recognition threshold, the Company initially and subsequently measures the tax benefit as the largest amount that it judges to have a greater than 50% likelihood of being realized upon ultimate settlement with a taxing authority. The liability associated with unrecognized tax benefits is adjusted periodically due to changing circumstances, such as the progress of tax audits, case law developments and new or emerging legislation. Such adjustments are recognized entirely in the period in which they are identified. The effective tax rate includes the net impact of changes in the liability for unrecognized tax benefits and subsequent adjustments as considered appropriate by management.
The largest permanent item in computing both the Company’s effective tax rate and taxable income is the deduction allowed for statutory depletion. The impact of statutory depletion on the effective tax rate is presented in Note N to these financial statements. The deduction for statutory depletion does not necessarily change proportionately to changes in income before income taxes.
F-14
Table of Contents
U.S. Silica Holdings, Inc. and Subsidiaries and GGC RCS Holdings, Inc.
NOTES TO COMBINED FINANCIAL STATEMENTS
December 31, 2010 and 2009
(Dollars in thousands, except per share amounts)
NOTE B—SUMMARY OF SIGNIFICANT ACCOUNTING POLICIES—Continued
Equity-based Compensation
The Company recognizes the cost of employee services rendered in exchange for awards of equity instruments, such as stock options and restricted stock, based on the fair value of those awards at the date of the grant. Compensation expense for equity units is recognized, on a straight-line basis, net of forfeitures, over the requisite service period for the fair value of the awards that actually vest.
Concentration of Credit Risk
The Company’s five largest customers accounted for approximately 29%, 23% and 22% of sales in the years ended December 31, 2010, December 31, 2009, and for the predecessor and successor periods ended for 2008, respectively. Management believes it maintains adequate reserves for potential credit losses; ongoing credit evaluations are performed and collateral is generally not required.
Financial Instruments
The Company uses interest rate and natural gas hedge agreements to manage interest and energy costs and the risk associated with changing interest rates and natural gas prices. Amounts to be paid or received under these hedge agreements are accrued as interest rates or natural gas prices change and are recognized over the life of the hedge agreements as an adjustment to interest expense or, in the case of natural gas, cost of goods sold. The Company’s policy is to not hold or issue derivative financial instruments for trading or speculative purposes. When entered into, these financial instruments are designated as hedges of underlying exposures, associated with the Company’s long-term debt and energy costs, and are monitored to determine if they remain effective hedges. Gains and losses on derivatives designated as cash flow hedges are recorded in other comprehensive income net of tax and reclassified to earnings in a manner that matches the timing of the earnings impact of the hedged transactions. The ineffective portion of all hedges, if any, is recognized currently in income. Additional disclosures for derivative instruments are presented in Note J to these financial statements.
Fair Value of Financial Instruments
The fair value of financial instruments classified as current assets or liabilities, including cash and cash equivalents, accounts receivable, inventory and accounts payable, approximate carrying value due to the short-term maturity of the instruments. The fair value of short-term and long-term debt amounts approximates their carrying values and are based on their effective interest rates compared to current market rates.
The accounting guidance for fair value measurements defines fair value as the price that would be received to sell an asset or paid to transfer a liability in an orderly transaction between market participants at the measurement date. This accounting guidance also establishes a fair value hierarchy that prioritizes the inputs to valuation techniques used to measure fair value into three broad levels. Level 1 inputs are unadjusted quoted prices in active markets for identical assets and liabilities and have the highest priority. Level 2 inputs are inputs other than quoted prices within Level 1 that are observable for the asset or liability, either directly or indirectly. Level 3 inputs are unobservable inputs for the financial asset or liability.
F-15
Table of Contents
U.S. Silica Holdings, Inc. and Subsidiaries and GGC RCS Holdings, Inc.
NOTES TO COMBINED FINANCIAL STATEMENTS
December 31, 2010 and 2009
(Dollars in thousands, except per share amounts)
NOTE B—SUMMARY OF SIGNIFICANT ACCOUNTING POLICIES—Continued
Fair Value of Financial Instruments—continued
The following table sets forth by level, within the fair value hierarchy, the Company’s assets and liabilities at fair value as of December 31, 2010:
| Level 1 | Level 2 | Level 3 | Total | |||||||||||||
| Money market funds |
$ | 34,769 | $ | — | $ | — | $ | 34,769 | ||||||||
| Natural gas derivatives |
— | (109 | ) | — | (109 | ) | ||||||||||
| Interest rate derivative |
— | 257 | — | 257 | ||||||||||||
|
|
|
|
|
|
|
|
|
|||||||||
| Net asset (liability) |
$ | 34,769 | $ | 148 | $ | — | $ | 34,917 | ||||||||
|
|
|
|
|
|
|
|
|
|||||||||
The Level 2 natural gas and interest rate derivatives are measured by the spot rates from actively quoted markets using the income approach.
Environmental Costs
Environmental costs, other than qualifying capital expenditures, are accrued at the time the exposure becomes known and costs can be reasonably estimated. Costs are accrued based upon management’s estimates of all direct costs, after taking into account expected reimbursement by third parties (primarily the sellers of acquired businesses), and are reviewed by outside consultants. Environmental costs are charged to expense unless a settlement with an indemnifying party has been reached.
F-16
Table of Contents
U.S. Silica Holdings, Inc. and Subsidiaries and GGC RCS Holdings, Inc.
NOTES TO COMBINED FINANCIAL STATEMENTS
December 31, 2010 and 2009
(Dollars in thousands, except per share amounts)
NOTE B—SUMMARY OF SIGNIFICANT ACCOUNTING POLICIES—Continued
Comprehensive Income (Loss)
Comprehensive income (loss) is defined as the change in equity from transactions and other events from nonowner sources and consists of net income (loss) and other comprehensive income (loss). The Company includes changes in the fair value of cash flow hedge derivative instruments in other comprehensive income (loss). Other comprehensive income (loss) also includes any portion of the funded status of pension and other postretirement defined benefit plans that has not been recognized as an expense. At December 31, 2010, 2009 and 2008 and November 24, 2008, other comprehensive income included in stockholders’ equity consisted of the following:
| Gross | Tax | Net | ||||||||||
| Unrealized loss on derivatives |
$ | (871 | ) | $ | 339 | $ | (532 | ) | ||||
| Pension and other postretirement benefits liability |
(7,689 | ) | 2,981 | (4,708 | ) | |||||||
|
|
|
|
|
|
|
|||||||
| Total at December 31, 2010 |
$ | (8,560 | ) | $ | 3,320 | $ | (5,240 | ) | ||||
|
|
|
|
|
|
|
|||||||
| Unrealized loss on derivatives |
$ | (80 | ) | $ | 31 | $ | (49 | ) | ||||
| Pension and other postretirement benefits liability |
(5,393 | ) | 1,642 | (3,751 | ) | |||||||
|
|
|
|
|
|
|
|||||||
| Total at December 31, 2009 |
$ | (5,473 | ) | $ | 1,673 | $ | (3,800 | ) | ||||
|
|
|
|
|
|
|
|||||||
| Unrealized loss on derivatives |
$ | (2,763 | ) | $ | 1,075 | $ | (1,688 | ) | ||||
| Pension and other postretirement benefits liability |
(1,667 | ) | 676 | (991 | ) | |||||||
|
|
|
|
|
|
|
|||||||
| Total at December 31, 2008 |
$ | (4,430 | ) | $ | 1,751 | $ | (2,679 | ) | ||||
|
|
|
|
|
|
|
|||||||
| Unrealized loss on derivatives |
$ | — | $ | — | $ | — | ||||||
| Pension and other postretirement benefits liability |
— | — | — | |||||||||
|
|
|
|
|
|
|
|||||||
| Total at November 24, 2008 |
$ | — | $ | — | $ | — | ||||||
|
|
|
|
|
|
|
|||||||
Impact of Recent Accounting Standards/Pronouncements
In June 2009, the FASB issued accounting guidance which requires entities to provide greater transparency about transfers of financial assets and a company’s continuing involvement in those transferred financial assets. The accounting guidance also removes the concept of a qualifying special-purpose entity. The adoption of this accounting guidance effective January 1, 2010 did not have a material impact on the Company’s combined financial condition or results of operations.
In June 2009, the FASB issued accounting guidance which changes the existing consolidation model for variable interest entities to a new model based on a qualitative assessment of power and economics. The adoption of this accounting guidance effective January 1, 2010 did not have an impact on the Company’s combined financial condition or results of operations.
In January 2010, the FASB issued guidance that amends existing disclosure requirements of fair value measurements adding required disclosures about items transferring into and out of Levels 1 and 2 in the fair value hierarchy; adding separate disclosures about purchases, sales, issuances, and settlements relative to Level 3 measurements; and clarifying, among other things, the existing fair value disclosures about the level of disaggregation. The adoption of this guidance effective January 1, 2010 did not have a material impact on the Company’s combined financial condition or results of operations.
F-17
Table of Contents
U.S. Silica Holdings, Inc. and Subsidiaries and GGC RCS Holdings, Inc.
NOTES TO COMBINED FINANCIAL STATEMENTS
December 31, 2010 and 2009
(Dollars in thousands, except per share amounts)
NOTE B—SUMMARY OF SIGNIFICANT ACCOUNTING POLICIES—Continued
Impact of Recent Accounting Standards/Pronouncements—continued
In July 2010, new guidance was introduced which would increase disclosures regarding the credit quality of an entity’s financing receivables and its allowance for credit losses. In addition, the guidance requires an entity to disclose credit quality indicators, past due information, and modifications of its financing receivables. The adoption of this guidance effective January 1, 2010 did not have a material impact on the Company’s combined financial condition or results of operations.
Accounting Guidance Pending Adoption
In October 2009, the FASB issued accounting guidance that sets forth the requirements that must be met for a company to recognize revenue from the sale of a delivered item that is part of a multiple-element arrangement when other items have not yet been delivered. The adoption of this guidance effective January 1, 2011 did not have a material impact on the Company’s combined financial condition or results of operations.
NOTE C—ACCOUNTS RECEIVABLE
At December 31, 2010 and 2009, receivables consisted of the following:
| 2010 | 2009 | |||||||
| Trade receivables |
$ | 30,097 | $ | 26,436 | ||||
| Less allowance for doubtful accounts |
(832 | ) | (729 | ) | ||||
|
|
|
|
|
|||||
| Net trade receivables |
29,265 | 25,707 | ||||||
| Other receivables |
779 | 6,054 | ||||||
|
|
|
|
|
|||||
| Total |
$ | 30,044 | $ | 31,761 | ||||
|
|
|
|
|
|||||
Trade receivables relate to sales of commercial silica, for which credit is extended based on the customer’s credit history. Other receivables primarily represent amounts due from insurance claims under an indemnity (Note M) and taxes.
Changes in the Company’s allowance for doubtful accounts are as follows:
| 2010 | 2009 | |||||||
| Beginning balance |
$ | 729 | $ | 804 | ||||
| Bad debt provision |
270 | 180 | ||||||
| Accounts written off |
(167 | ) | (255 | ) | ||||
|
|
|
|
|
|||||
| Ending balance |
$ | 832 | $ | 729 | ||||
|
|
|
|
|
|||||
F-18
Table of Contents
U.S. Silica Holdings, Inc. and Subsidiaries and GGC RCS Holdings, Inc.
NOTES TO COMBINED FINANCIAL STATEMENTS
December 31, 2010 and 2009
(Dollars in thousands, except per share amounts)
NOTE D—INVENTORIES
At December 31, 2010 and 2009, inventories consisted of the following:
| 2010 | 2009 | |||||||
| Supplies |
$ | 11,475 | $ | 11,716 | ||||
| Raw materials and work in process |
6,208 | 5,538 | ||||||
| Finished goods |
4,735 | 6,033 | ||||||
|
|
|
|
|
|||||
| $ | 22,418 | $ | 23,287 | |||||
|
|
|
|
|
|||||
NOTE E—ACCRUED LIABILITIES
At December 31, 2010 and 2009, accrued liabilities consisted of the following:
| 2010 | 2009 | |||||||
| Accrued vacation liability |
$ | 2,469 | $ | 2,268 | ||||
| Current portion of liability for pension and postretirement benefits |
1,420 | 1,274 | ||||||
| Accrued healthcare liability |
1,017 | 911 | ||||||
| Other accrued liabilities |
4,043 | 2,465 | ||||||
|
|
|
|
|
|||||
| $ | 8,949 | $ | 6,918 | |||||
|
|
|
|
|
|||||
The Company is self-insured for health care claims for eligible participating employees and qualified dependent medical claims, subject to deductibles and limitations. The Company’s liabilities for claims incurred but not reported are determined based on an estimate of the ultimate aggregate liability for claims incurred. The estimate is calculated from actual claim rates and reviewed and adjusted periodically as necessary.
NOTE F—LEASE COMMITMENTS
The Company is obligated under certain operating leases for railroad cars, office space, mining property, mining/processing equipment and transportation and other equipment. Certain operating lease agreements include options to purchase the equipment for fair market value at the end of the original lease term. Future minimum annual commitments under such operating leases at December 31, 2010 are as follows:
| Year ending December 31, |
||||
| 2011 |
$ | 5,054 | ||
| 2012 |
4,394 | |||
| 2013 |
2,900 | |||
| 2014 |
983 | |||
| 2015 |
661 | |||
| Thereafter |
2,707 | |||
|
|
|
|||
| $ | 16,699 | |||
|
|
|
|||
Rental expense for operating leases for the years ended December 31, 2010 and December 31, 2009 totaled approximately $4.3 million and $3.8 million, respectively, and $3.4 million and $143 for the 2008 predecessor and successor periods, respectively.
In general, the above leases include renewal options and provide that the Company pays for all utilities, insurance, taxes and maintenance.
F-19
Table of Contents
U.S. Silica Holdings, Inc. and Subsidiaries and GGC RCS Holdings, Inc.
NOTES TO COMBINED FINANCIAL STATEMENTS
December 31, 2010 and 2009
(Dollars in thousands, except per share amounts)
NOTE G—SHORT-TERM DEBT
The Company has a $35.0 million, asset-based revolving line-of-credit agreement with Wachovia Bank, National Association (“Wachovia”). Under the terms of the revolving credit agreement, which expires October 31, 2015, the Company has pledged all of its inventory and accounts receivable as collateral for the loan. The revolving credit agreement includes certain conditions to borrowings, representations, and covenants, including required minimum fixed charge coverage and maximum leverage ratios that are measured quarterly, other covenants that impose restrictions on the Company, and certain events of default including an event of default upon the occurrence of a material adverse change, as defined in the agreement. Advances under the credit agreement bear interest at either LIBOR plus 275 basis points, or prime plus 175 basis points, at the Company’s option. The interest rate is reduced by 25 basis points when availability under the credit agreement is greater than $10 million. The interest rate on the line-of-credit was 5.0% at December 31, 2010 and 2009. The fixed charge coverage and leverage ratios are not applicable when availability is above $7.5 million.
Monthly borrowing availability (the borrowing base) is determined by a formula, taking into consideration eligible accounts receivable and inventory, reduced by any outstanding letters of credit and a provision based on the market value of any derivatives in place with Wachovia. Each day, all cash receipts are automatically applied as a reduction against any advances made by Wachovia to the Company, and subject to the satisfaction or waiver of the conditions to borrowings to meet its daily cash requirements, up to the amount available under the borrowing base. If the monthly borrowing base is less than the $35.0 million total line-of-credit, then, at Wachovia’s sole discretion, advances in excess of the borrowing base may be made up to the full amount of the $35.0 million line-of-credit.
U.S. Silica’s obligations under the revolving credit agreement are unconditionally and irrevocably guaranteed, jointly and severally, by the Company’s domestic subsidiaries.
As of December 31, 2010, the available borrowing base was $25.5 million, with nothing drawn as of that date and $9.2 million allocated for letters of credit and $1.2 million reserved for derivatives, leaving $15.1 million available for general corporate use under this revolving credit agreement.
NOTE H—LONG-TERM OBLIGATIONS
At December 31, 2010 and 2009, long-term debt consisted of the following:
| 2010 | 2009 | |||||||
| Senior Secured Credit Facility: |
||||||||
| Term Loan Facility (final maturity May 7, 2016) (5.75% and 8.75% at December 31, 2010 and 2009, respectively), net of unamortized original issue discount of $733 and $2,429 |
$ | 163,442 | $ | 97,531 | ||||
| Subordinated Notes: |
||||||||
|
Promissory Notes (final maturity May 7, 2017) (12.00% and 18.50% at December 31, 2010 and 2009 ), net of unamortized original issue discount of $0 and $2,118 |
75,000 | 81,509 | ||||||
| Mortgage Notes: |
||||||||
| 4.0% note (due June 8, 2016) |
— | 67 | ||||||
|
|
|
|
|
|||||
| 238,442 | 179,107 | |||||||
| Less current portion |
(1,510 | ) | (1,485 | ) | ||||
|
|
|
|
|
|||||
| $ | 236,932 | $ | 177,622 | |||||
|
|
|
|
|
|||||
F-20
Table of Contents
U.S. Silica Holdings, Inc. and Subsidiaries and GGC RCS Holdings, Inc.
NOTES TO COMBINED FINANCIAL STATEMENTS
December 31, 2010 and 2009
(Dollars in thousands, except per share amounts)
NOTE H—LONG-TERM OBLIGATIONS—Continued
At December 31, 2010, contractual maturities of long-term debt are as follows:
| Year ending December 31, |
||||
| 2011 |
$ | 1,510 | ||
| 2012 |
1,512 | |||
| 2013 |
1,513 | |||
| 2014 |
1,514 | |||
| 2015 |
79,065 | |||
| Thereafter |
153,328 | |||
|
|
|
|||
| $ | 238,442 | |||
|
|
|
|||
Debt Agreements
The Company entered into a $102 million Term Loan under the conditions set forth in a credit agreement dated November 25, 2008 (the “Term Loan Agreement”). On May 7, 2010 the Term Loan Agreement was amended in several ways including an increase in the principal, a reduction in the interest rate, and an extension of the expiration date to May 7, 2016. The Term Loan Agreement is collateralized by substantially all of the assets of the Company except accounts receivable and inventory. Advances under the modified Term Loan Agreement bear interest at either LIBOR plus 400 basis points, or prime plus 300 basis points, at the Company’s option, with a minimum interest rate of 5.75%. The amended Term Loan was issued at a 0.5% original issue discount of $825 which is being amortized as additional interest expense over the life of the loan based on the effective interest method.
Under the terms of a Note Purchase Agreement dated November 25, 2008, the Company issued $80 million of unsecured notes (the “Notes”). On May 7, 2010, the Note Purchase Agreement was amended to decrease the principal and interest rate and now matures on May 7, 2017. The Notes as amended bear interest at LIBOR plus 1025 basis points, payable quarterly, with a minimum rate of 12.00%.
As a result of the refinancing that occurred May 7, 2010 the Company recorded a charge to the Statement of Operations of $10.2 million for early debt extinguishment. This charge includes the write-off of the debt issuance cost and the original issue discount associated with the original term loan and note purchase agreements as well as lenders fees incurred as a result of the modification of these agreements.
The above agreements contain various restrictive covenants that, among other things, limit the ability of the Company to engage in certain transactions with affiliates, incur additional indebtedness, repay other indebtedness or amend other debt instruments, create liens on assets, make investments or acquisitions, engage in mergers or consolidations, dispose of assets, or pay dividends. In addition, the agreements require the Company to maintain certain financial covenants, annually and quarterly, including a leverage ratio, a fixed charge coverage ratio and a capital expenditures covenant. The Company was in compliance with these covenants as of December 31, 2010.
F-21
Table of Contents
U.S. Silica Holdings, Inc. and Subsidiaries and GGC RCS Holdings, Inc.
NOTES TO COMBINED FINANCIAL STATEMENTS
December 31, 2010 and 2009
(Dollars in thousands, except per share amounts)
NOTE I—DEFERRED REVENUE
On November 25, 2008, the Company, through an affiliate, received advances from two customers totaling $27 million. The deposits give these customers the right to purchase certain products for a fixed price at certain minimum volumes. In addition, the customers have security on their deposit in the form of promissory notes with an affiliate collateralized by undivided mineral interests in the Company’s mineral deposits. These notes originally bore interest at 10% compounded quarterly, to the extent any interest is unpaid. The obligations and related interest are reduced as shipments occur with a portion of the sales price being received in cash and a smaller noncash portion reducing first any accrued interest and then, to the extent available, any outstanding principal. As such, the notes do not require any payments in cash. The notes mature on December 31, 2015 and November 25, 2016. In December 2009, $12 million of the notes were amended to reduce the interest rate to 5%, retroactive to November 25, 2008. Effective January 1, 2010, the remaining $15 million was amended to reduce the interest rate to 6%, prospectively.
NOTE J—FINANCIAL INSTRUMENTS
Interest rate and natural gas hedge agreements are utilized in the normal course of business to manage the Company’s interest and energy costs and the risk associated with changing interest rates and natural gas prices. These hedge agreements are used to exchange the difference between fixed and variable-rate interest amounts or natural gas prices calculated by reference to an agreed-upon notional principal amount or natural gas quantity. The Company does not use derivative financial instruments for trading or speculative purposes. By their nature, all such instruments involve risk, including the possibility that a loss may occur from the failure of another party to perform according to the terms of a contract (credit risk) or the possibility that future changes in market price may make a financial instrument less valuable or more onerous (market risk). As is customary for these types of instruments, the Company does not require collateral or other security from other parties to these instruments. In management’s opinion, there is no significant risk of loss in the event of nonperformance of the counterparties to these financial instruments.
The fair value of the hedge agreements represents the estimated receipts or payments that would be required to settle the agreements at year-end. Quoted market prices of similar instruments were used to estimate the fair values of the interest rate and natural gas hedge agreements. The notional amount represents agreed upon amounts on which calculations of dollars to be exchanged are based. They do not represent amounts exchanged by the parties and, therefore, are not a measure of the Company’s exposure. The Company’s credit exposure is limited to the fair value of the contracts with a positive fair value plus interest receivable, if any, at the reporting date.
| Maturity Date |
December 31, 2010 | December 31, 2009 | ||||||||||||||||||||||||||||||||||
| Contract/ Notional Amount |
Carrying Amount |
Fair Value |
Contract/ Notional Amount |
Carrying Amount |
Fair Value |
|||||||||||||||||||||||||||||||
| Natural gas rate swap agreements |
2010 | 926,029 | MMBTU | $ | 68 | $ | 68 | |||||||||||||||||||||||||||||
| Natural gas rate cap agreement |
2010 | 60,000 | MMBTU | $ | 11 | $ | 11 | |||||||||||||||||||||||||||||
| Natural gas rate swap agreements |
2011 | 420,000 | MMBTU | $ | (109 | ) | $ | (109 | ) | |||||||||||||||||||||||||||
| Interest rate cap agreement |
2012 | $ | 100 million | (1) | $ | 13 | $ | 13 | $ | 100 million | (1) | $ | 412 | $ | 412 | |||||||||||||||||||||
| Interest rate cap agreement |
2013 | $ | 20 million | (1) | $ | 244 | $ | 244 | ||||||||||||||||||||||||||||
| (1) | Agreement limits the LIBOR floating interest rate base to 4%. |
F-22
Table of Contents
U.S. Silica Holdings, Inc. and Subsidiaries and GGC RCS Holdings, Inc.
NOTES TO COMBINED FINANCIAL STATEMENTS
December 31, 2010 and 2009
(Dollars in thousands, except per share amounts)
NOTE J—FINANCIAL INSTRUMENTS—Continued
The Company has designated these contracts as qualified cash flow hedges. Accordingly, the effective portion of the gain or loss on the derivative instrument is reported as a component of other comprehensive income and recognized in earnings in the same period or periods during which the hedged transaction affects earnings. The Company had no ineffectiveness for such contracts in any of the reporting periods.
NOTE K—ACQUISITION OF U.S. SILICA COMPANY
On November 25, 2008, the Company acquired 100% of U.S. Silica Company through the acquisition of Hourglass Acquisition I, LLC, an affiliate of our former parent company. As a result of the Company’s 100% ownership interest, the Company pushed down its basis in the underlying assets and liabilities based on the estimated fair values. These fair values were determined by management with input from an independent appraisal firm.
NOTE L—EQUITY-BASED COMPENSATION
During 2009, the board of directors of the Company’s parent company, GGC USS Holdings, LLC, approved, and the parent company implemented, a management equity program (the “Equity Program”). The Equity Program granted Class C and Class D member units in the parent company, GGC USS Holdings, LLC, to three members of executive management. As of December 31, 2010, approximately 1,358,410 Class C and 3,680,855 Class D equity units were vested. Under the Equity Program, as of December 31, 2010, approximately 3,680,855 and 3,680,855 Class C and Class D equity incentive units, respectively, were authorized to be granted.
The Class C units vest ratably over five years. These units have no exercise price and as such the fair value of the incentive units is equal to the fair value of the underlying equity units. The Class D units were fully vested upon grant.
Even though the equity was granted at the parent company, the Company recognized compensation expense related to Class C and D equity incentive units of $383 and $949 in the years ended December 31, 2010 and 2009, respectively. As of December 31, 2010, there was approximately $1.2 million of total unrecognized compensation expense related to unvested Class C equity incentive units. That cost is expected to be recognized over a weighted-average period of 3.20 years. The grant date fair value of Class C and D equity incentive units was $.52 and $.17, respectively.
The Company’s activity with respect to Class C and D equity incentive units for 2010 was as follows:
| (in thousands, except per unit amounts) | Number of Class C Units |
Class C Unit Grant Date Weighted Average Fair Value |
Number of Class D Units |
Class D Unit Grant Date Weighted Average Fair Value |
||||||||||||
| Unvested, December 31, 2009 |
3,058,616 | $ | 0.52 | — | $ | 0.17 | ||||||||||
| Granted |
— | — | — | — | ||||||||||||
| Vested |
(736,171 | ) | 0.52 | — | 0.17 | |||||||||||
| Forfeited |
— | — | — | — | ||||||||||||
|
|
|
|
|
|
|
|
|
|||||||||
| Unvested, December 31, 2010 |
2,322,445 | $ | 0.52 | — | $ | 0.17 | ||||||||||
|
|
|
|
|
|
|
|
|
|||||||||
F-23
Table of Contents
U.S. Silica Holdings, Inc. and Subsidiaries and GGC RCS Holdings, Inc.
NOTES TO COMBINED FINANCIAL STATEMENTS
December 31, 2010 and 2009
(Dollars in thousands, except per share amounts)
NOTE L—EQUITY-BASED COMPENSATION—Continued
The total fair value of equity incentive units vested for the years ended December 31, 2010 and 2009 was $383 and $949, respectively. No equity incentive units were issued in the predecessor and successor periods in 2008.
Fair value of the underlying equity units is determined by utilizing the Black-Scholes pricing model and taking into consideration the rights and preferences of the underlying equity units.
The following table illustrates the assumptions used in the Black-Scholes pricing model:
| Risk-free interest rate |
1.87 | % | ||
| Expected volatility |
50.0 | % | ||
| Time to liquidity event |
4.0 |
Risk-free interest rate – This is an interpolated rate from the U.S. constant maturity treasury rate for a term corresponding to the time to liquidity event, as described below. An increase in the risk-free rate will increase compensation expense.
Expected volatility – This is a measure of the amount by which the price of various comparable companies common stock has fluctuated or is expected to fluctuate, as the Company’s common stock is not publicly-traded. The comparable companies were selected by analyzing public companies in the industry based on various factors including, but not limited to, company size, financial data availability, active trading volume, and capital structure. An increase in the expected volatility will increase compensation expense.
Time to liquidity event – This is the period of time over which the underlying equity units are expected to remain outstanding. An increase in the expected term will increase compensation expense.
NOTE M—COMMITMENTS AND CONTINGENCIES
The Company’s operating subsidiary, U.S. Silica, has been named as a defendant in 10 product liability claims alleging silica exposure causing silicosis filed in the period January 1, 2010 to December 31, 2010. U.S. Silica was named as defendant in 2 claims filed in 2009, and 18 filed in 2008. U.S. Silica has been named as a defendant in similar suits since 1975. As of December 31, 2010, there were 146 active silica-related products liability claims pending in which U.S. Silica is a defendant.
Prior to 1986, U.S. Silica had numerous insurance policies and an indemnity from a former owner that cover silicosis claims. Some of those coverages are currently being litigated, however the Company believes the policies and indemnity will remain in force.
The Company has recorded estimated liabilities for these claims in other long-term obligations as well as estimated recoveries under the indemnity agreement and an estimate of future recoveries under insurance in other assets on the Company’s combined balance sheets. As of December 31, 2010, other noncurrent assets included $764 for insurance for third-party products liability claims and other long-term obligations included $2.4 million in third-party products claims liability. Based on decreases in the actual claims filed during the periods along with decreases in the estimated future product liability claims and their related costs, the Company recorded
F-24
Table of Contents
U.S. Silica Holdings, Inc. and Subsidiaries and GGC RCS Holdings, Inc.
NOTES TO COMBINED FINANCIAL STATEMENTS
December 31, 2010 and 2009
(Dollars in thousands, except per share amounts)
NOTE M—COMMITMENTS AND CONTINGENCIES—Continued
pre-tax adjustments to selling, general and administrative expenses related to silica claims (including a $762 loss in 2010, a $3.3 million gain in 2009, and $0 and $898 gains for the 2008 predecessor and successor periods, respectively).
NOTE N—INCOME TAXES
The (expense) benefit for income taxes consisted of the following for the years ended December 31, 2010 and December 31, 2009 and for the predecessor and successor periods in 2008:
| 2010 | 2009 | 2008 | ||||||||||||||||
| Successor | Successor | Successor | Predecessor | |||||||||||||||
| 1/1 12/31 | 1/1 12/31 | 11/25 - 12/31 | 1/1 - 11/24 | |||||||||||||||
| Current |
||||||||||||||||||
| Federal |
$ | (1,951 | ) | $ | (663 | ) | $ | — | $ | (3,744 | ) | |||||||
| State |
(55 | ) | (392 | ) | — | (352 | ) | |||||||||||
|
|
|
|
|
|
|
|
|
|||||||||||
| (2,006 | ) | (1,055 | ) | — | (4,096 | ) | ||||||||||||
| Deferred |
||||||||||||||||||
| Federal |
563 | 3,733 | 1,394 | (3,597 | ) | |||||||||||||
| State |
(886 | ) | 581 | 279 | (764 | ) | ||||||||||||
|
|
|
|
|
|
|
|
|
|||||||||||
| (323 | ) | 4,314 | 1,673 | (4,361 | ) | |||||||||||||
|
|
|
|
|
|
|
|
|
|||||||||||
| Income tax (expense) benefit |
$ | (2,329 | ) | $ | 3,259 | $ | 1,673 | $ | (8,457 | ) | ||||||||
|
|
|
|
|
|
|
|
|
|||||||||||
Deferred tax assets and liabilities are recognized for the estimated future tax effects, based on enacted tax laws, of temporary differences between the values of assets and liabilities recorded for financial reporting and for tax purposes and of net operating loss and other carry-forwards.
F-25
Table of Contents
U.S. Silica Holdings, Inc. and Subsidiaries and GGC RCS Holdings, Inc.
NOTES TO COMBINED FINANCIAL STATEMENTS
December 31, 2010 and 2009
(Dollars in thousands, except per share amounts)
NOTE N—INCOME TAXES—Continued
The tax effects of the types of temporary differences and carry-forwards that gave rise to deferred tax assets and liabilities at December 31, 2010 and 2009 consisted of the following:
| 2010 | 2009 | |||||||
| Gross deferred tax liabilities |
||||||||
| Land and mineral property basis difference |
$ | (65,003 | ) | $ | (66,524 | ) | ||
| Fixed assets and depreciation |
(38,678 | ) | (39,117 | ) | ||||
| Intangible assets |
(7,293 | ) | (7,461 | ) | ||||
| Other |
(682 | ) | (536 | ) | ||||
|
|
|
|
|
|||||
| Total deferred tax liabilities |
(111,656 | ) | (113,638 | ) | ||||
| Gross deferred tax assets |
||||||||
| Net operating loss carry-forward |
20,849 | 20,526 | ||||||
| Pension and postretirement benefit costs |
18,201 | 21,829 | ||||||
| Alternative minimum tax credit carry-forward |
8,655 | 6,699 | ||||||
| Property, plant and equipment |
5,212 | 5,124 | ||||||
| Accrued expenses |
1,939 | 1,943 | ||||||
| Inventories |
1,858 | 1,373 | ||||||
| Third-party products liability |
970 | 696 | ||||||
| Other |
5,405 | 5,557 | ||||||
|
|
|
|
|
|||||
| Total deferred tax assets |
63,089 | 63,747 | ||||||
| Net deferred tax liabilities |
(48,567 | ) | (49,891 | ) | ||||
| Less net current deferred tax assets |
(4,557 | ) | (3,549 | ) | ||||
|
|
|
|
|
|||||
| Net long-term deferred tax liabilities |
$ | (53,124 | ) | $ | (53,440 | ) | ||
|
|
|
|
|
|||||
At December 31, 2010 and 2009, the Company had federal net operating loss carry-forwards of $56.6 million and $55.8 million, respectively, which begin to expire in 2021.
In addition, the Company has an alternative minimum tax credit carry-forward at December 31, 2010 and 2009 of approximately $8.7 million and $6.4 million, respectively. The credit carry-forward may be carried forward indefinitely to offset any excess of regular tax liability over alternative minimum tax liability subject to certain limitations.
Ultimately, the realization of deferred tax assets is dependent upon generation of future taxable income during those periods in which temporary differences become deductible and/or credits can be utilized. To this end, management considers the level of historical taxable income, the scheduled reversal of deferred tax liabilities, tax-planning strategies and projected future taxable income. Based on these considerations, and the carry-forward availability of a portion of the deferred tax assets, management believes it is more likely than not that the Company will realize the benefit of the deferred tax assets.
At the end of each reporting period as presented, there were no material amounts of interest and penalties recognized in the statement of operations or balance sheets. The Company has no material unrecognized tax benefits or any known material tax contingencies at December 31, 2010 or December 31, 2009 and does not
F-26
Table of Contents
U.S. Silica Holdings, Inc. and Subsidiaries and GGC RCS Holdings, Inc.
NOTES TO COMBINED FINANCIAL STATEMENTS
December 31, 2010 and 2009
(Dollars in thousands, except per share amounts)
NOTE N—INCOME TAXES—Continued
expect this to change significantly within the next twelve months. Tax returns filed with the IRS for the years 2006 through 2010 along with tax returns filed with numerous state entities remain subject to examination.
The effective income tax rate on pretax earnings differed from the U.S. federal statutory rate for the predecessor and successor periods in 2008 and for the years ended December 31, 2009 and December 31, 2010 for the following reasons:
| 2010 | 2009 | 2008 | ||||||||||||||||
| Successor | Successor | Successor | Predecessor | |||||||||||||||
| 11/25 - 12/31 | 1/1 - 11/24 | |||||||||||||||||
| (Expense) benefit computed at U.S. federal statutory rate |
(35.0 | )% | (35.0 | )% | 35.0 | % | (35.0 | )% | ||||||||||
| Decrease (increase) resulting from: |
||||||||||||||||||
| Percentage depletion |
31.5 | 149.8 | 7.2 | 11.6 | ||||||||||||||
| Prior year tax return reconciliation |
(3.4 | ) | 34.4 | — | (5.9 | ) | ||||||||||||
| State income taxes, net of federal benefit |
(0.4 | ) | 13.1 | 5.1 | (2.0 | ) | ||||||||||||
| Valuation allowance |
— | — | — | 0.6 | ||||||||||||||
| Medicare Part D subsidy |
(8.7 | ) | (3.8 | ) | 0.2 | 0.2 | ||||||||||||
| Equity-based compensation |
(1.0 | ) | (14.6 | ) | — | — | ||||||||||||
| Other, net |
(0.2 | ) | (0.9 | ) | (0.1 | ) | (0.2 | ) | ||||||||||
|
|
|
|
|
|
|
|
|
|||||||||||
| Income tax (expense) benefit |
(17.2 | )% | 143.0 | % | 47.4 | % | (30.7 | )% | ||||||||||
|
|
|
|
|
|
|
|
|
|||||||||||
The largest permanent item in computing both the Company’s effective tax rate and taxable income is the deduction allowed for statutory depletion. The deduction for statutory depletion does not necessarily change proportionately to changes in income before income taxes.
NOTE O—PENSION AND POSTRETIREMENT BENEFITS
The Company maintains a single-employer noncontributory defined benefit pension plan covering certain employees. The plan provides benefits based on each covered employee’s years of qualifying service. The Company’s funding policy is to contribute amounts within the range of the minimum required and maximum deductible contributions for the plan consistent with a goal of appropriate minimization of the unfunded projected benefit obligation. The pension plan uses a benefit level per year of service for covered hourly employees and a final average pay method for covered salaried employees. The plan uses the projected unit credit cost method to determine the actuarial valuation.
The Company employs a total rate of return investment approach whereby a mix of equities and fixed income investments are used to maximize the long-term return of plan assets for a prudent level of risk. Risk tolerance is established through careful consideration of plan liabilities, plan funded status, and corporate financial condition. The investment portfolio contains a diversified blend of equity and fixed-income investments. Furthermore, equity investments are diversified across U.S. and non-U.S. stocks, as well as growth, value and small and large capitalizations. Investment risk is measured and monitored on an ongoing basis through quarterly investment portfolio reviews, annual liability measurements, and periodic asset/liability studies.
F-27
Table of Contents
U.S. Silica Holdings, Inc. and Subsidiaries and GGC RCS Holdings, Inc.
NOTES TO COMBINED FINANCIAL STATEMENTS
December 31, 2010 and 2009
(Dollars in thousands, except per share amounts)
NOTE O—PENSION AND POSTRETIREMENT BENEFITS—Continued
The Company employs a building block approach in determining the long-term rate of return for plan assets. Historical markets are studied and long-term historical relationships between equities and fixed-income are preserved consistent with the widely accepted capital market principle that assets with higher volatility generate a greater return over the long run. Current market factors such as inflation and interest rates are evaluated before long-term capital market assumptions are determined. The long-term portfolio return is established via a building block approach with proper consideration of diversification and rebalancing. Peer data and historical returns are reviewed to check for reasonability and appropriateness.
In addition, the Company provides defined benefit postretirement healthcare and life insurance benefits to some employees. Covered employees become eligible for these benefits at retirement after meeting minimum age and service requirements. The projected future cost of providing postretirement benefits, such as healthcare and life insurance, is recognized as an expense as employees render services.
The Company contributes to a Voluntary Employees’ Beneficiary Association trust that will be used to partially fund health care benefits for future retirees. Benefits are funded to the extent contributions are tax deductible, which under current legislation is limited. In general, retiree health benefits are paid as covered expenses are incurred.
Net pension cost consisted of the following for the years ended December 31, 2010 and December 31, 2009, and for the predecessor and successor periods in 2008:
| 2010 | 2009 | 2008 | ||||||||||||||||
| Successor | Successor | Successor | Predecessor | |||||||||||||||
| 1/1 - 12/31 | 1/1 - 12/31 | 11/25 - 12/31 | 1/1 - 11/24 | |||||||||||||||
| Service cost—benefits earned during the period |
$ | 993 | $ | 1,034 | $ | 88 | $ | 952 | ||||||||||
| Interest cost |
4,780 | 5,103 | 417 | 4,407 | ||||||||||||||
| Expected return on plan assets |
(4,048 | ) | (3,918 | ) | (332 | ) | (5,567 | ) | ||||||||||
| Special termination benefit |
30 | — | — | — | ||||||||||||||
| Net amortization and deferral |
146 | — | — | 17 | ||||||||||||||
|
|
|
|
|
|
|
|
|
|||||||||||
| Net pension costs |
$ | 1,901 | $ | 2,219 | $ | 173 | $ | (191 | ) | |||||||||
|
|
|
|
|
|
|
|
|
|||||||||||
Net postretirement cost consisted of the following for the years ended December 31, 2010 and December 31, 2009, and for the predecessor and successor periods in 2008:
| 2010 | 2009 | 2008 | ||||||||||||||||
| Successor | Successor | Successor | Predecessor | |||||||||||||||
| 1/1 - 12/31 | 1/1 - 12/31 | 11/25 - 12/31 | 1/1 - 11/24 | |||||||||||||||
| Service cost—benefits earned during the period |
$ | 177 | $ | 163 | $ | 16 | $ | 200 | ||||||||||
| Interest cost |
1,210 | 1,164 | 114 | 1,258 | ||||||||||||||
| Expected return on plan assets |
(5 | ) | (4 | ) | — | (5 | ) | |||||||||||
| Special termination benefit |
— | 53 | — | — | ||||||||||||||
| Net amortization and deferral |
— | (121 | ) | — | 41 | |||||||||||||
|
|
|
|
|
|
|
|
|
|||||||||||
| Net postretirement costs |
$ | 1,382 | $ | 1,255 | $ | 130 | $ | 1,494 | ||||||||||
|
|
|
|
|
|
|
|
|
|||||||||||
F-28
Table of Contents
U.S. Silica Holdings, Inc. and Subsidiaries and GGC RCS Holdings, Inc.
NOTES TO COMBINED FINANCIAL STATEMENTS
December 31, 2010 and 2009
(Dollars in thousands, except per share amounts)
NOTE O—PENSION AND POSTRETIREMENT BENEFITS—Continued
The changes in benefit obligations and plan assets, as well as the funded status of the Company’s pension and postretirement plans at December 31, 2010 and 2009 were as follows:
| Pension Benefits | Postretirement Benefits | |||||||||||||||
| 2010 | 2009 | 2010 | 2009 | |||||||||||||
| Benefit obligation at January 1 |
$ | 86,783 | $ | 76,552 | $ | 20,582 | $ | 20,849 | ||||||||
| Service cost |
993 | 1,034 | 177 | 163 | ||||||||||||
| Interest cost |
4,780 | 5,103 | 1,210 | 1,164 | ||||||||||||
| Actuarial (gain) loss |
3,229 | 9,487 | 1,795 | (461 | ) | |||||||||||
| Benefits paid |
(4,956 | ) | (4,903 | ) | (1,658 | ) | (1,589 | ) | ||||||||
| Amendments |
1,195 | (490 | ) | — | — | |||||||||||
| Other |
30 | — | 416 | 456 | ||||||||||||
|
|
|
|
|
|
|
|
|
|||||||||
| Benefit obligation at December 31 |
92,054 | 86,783 | 22,522 | 20,582 | ||||||||||||
| Fair value of plan assets at January 1 |
55,880 | 49,547 | 56 | 51 | ||||||||||||
| Actual return on plan assets |
7,896 | 9,003 | 3 | 5 | ||||||||||||
| Employer contributions |
6,371 | 2,233 | 1,242 | 1,186 | ||||||||||||
| Benefits paid |
(4,956 | ) | (4,903 | ) | (1,658 | ) | (1,589 | ) | ||||||||
| Other |
— | — | 416 | 403 | ||||||||||||
|
|
|
|
|
|
|
|
|
|||||||||
| Fair value of plan assets at December 31 |
65,191 | 55,880 | 59 | 56 | ||||||||||||
|
|
|
|
|
|
|
|
|
|||||||||
| Plan assets less than benefit obligations at December 31 recognized as liability for pension and other postretirement benefits |
$ | (26,863 | ) | $ | (30,903 | ) | $ | (22,463 | ) | $ | (20,526 | ) | ||||
|
|
|
|
|
|
|
|
|
|||||||||
The accumulated benefit obligation for the defined benefit pension plans totaled $91.4 million and $85.4 million at December 31, 2010 and 2009, respectively.
The amendments in 2010 reflect plan changes including increased monthly benefit levels for flat-benefit plans as well as a limit of 35 years of service for participants with benefits based on final average earnings. The amendments in 2009 include increases in flat-benefit plan monthly benefits and increases in annual benefits and pay limits under the internal revenue service code.
The Company also sponsors unfunded, nonqualified pension plans. The projected benefit obligation, accumulated benefit obligation and fair value of plan assets for these plans were $1.5 million, $1.5 million and $0 at both December 31, 2010 and December 31, 2009, respectively.
F-29
Table of Contents
U.S. Silica Holdings, Inc. and Subsidiaries and GGC RCS Holdings, Inc.
NOTES TO COMBINED FINANCIAL STATEMENTS
December 31, 2010 and 2009
(Dollars in thousands, except per share amounts)
NOTE O—PENSION AND POSTRETIREMENT BENEFITS—Continued
Future estimated annual benefit payments for pension and postretirement benefit obligations as of December 31, 2010 are as follows:
| Benefits | ||||||||||||
| Year |
Pension | Postretirement | ||||||||||
| Before Medicare Subsidy |
After Medicare Subsidy |
|||||||||||
| 2011 |
$ | 5,571 | $ | 1,497 | $ | 1,355 | ||||||
| 2012 |
5,848 | 1,575 | 1,421 | |||||||||
| 2013 |
6,024 | 1,488 | 1,488 | |||||||||
| 2014 |
6,176 | 1,548 | 1,548 | |||||||||
| 2015 |
6,310 | 1,557 | 1,557 | |||||||||
| 2016 - 2019 |
34,144 | 8,254 | 8,254 | |||||||||
The Company’s best estimate of expected contributions to the pension and postretirement medical benefit plans for the 2011 fiscal year are $11.0 million and $1.4 million, respectively.
The amounts in accumulated other comprehensive income expected to be recognized as components of net periodic benefit cost during the 2011 fiscal year are as follows:
| Benefits | ||||||||||||
| Pension | Postretirement | Total | ||||||||||
| Net actuarial loss |
$ | 610 | $ | — | $ | 610 | ||||||
| Prior service cost |
10 | — | 10 | |||||||||
|
|
|
|
|
|
|
|||||||
| $ | 620 | $ | — | $ | 620 | |||||||
|
|
|
|
|
|
|
|||||||
The total amounts in accumulated other comprehensive income related to net actuarial loss and prior service costs, net of tax, as of December 31, 2010 were $4.2 million and $499, respectively.
The following weighted-average assumptions were used to determine the Company’s obligations under the plans:
| Pension Benefits |
Postretirement Benefits | |||||||||||||||
| 2010 | 2009 | 2010 | 2009 | |||||||||||||
| Discount rate |
5.30 | % | 5.75 | % | 5.30% | 5.75% | ||||||||||
| Long-term rate of compensation increase |
3.50 | % | 3.50 | % | — | — | ||||||||||
| Long-term rate of return on plan assets |
8.00 | % | 8.25 | % | 8.00% | 8.25% | ||||||||||
| Health care cost trend rate: |
||||||||||||||||
| Pre-65 initial rate/ultimate rate |
— | — | 9%/5% | 9%/5% | ||||||||||||
| Pre-65 ultimate year |
— | — | 2017 | 2016 | ||||||||||||
| Post-65 initial rate/ultimate rate |
— | — | 8.5%/5% | 10%/5% | ||||||||||||
| Post-65 ultimate year |
— | — | 2016 | 2018 | ||||||||||||
F-30
Table of Contents
U.S. Silica Holdings, Inc. and Subsidiaries and GGC RCS Holdings, Inc.
NOTES TO COMBINED FINANCIAL STATEMENTS
December 31, 2010 and 2009
(Dollars in thousands, except per share amounts)
NOTE O—PENSION AND POSTRETIREMENT BENEFITS—Continued
The discount rate reflects the expected long-term rates of return with maturities comparable to payments for the plan obligations utilizing Hewitt’s Top Quartile Curve rounded down to the next 0.05%.
Assumed heath care cost trend rates have a significant effect on the amounts reported for the health care plans. A one-percentage-point change in assumed health care cost trend rates would have the following effects:
| One-Percentage-Point | ||||||||
| Increase | Decrease | |||||||
| Effect on total of service and interest cost |
$ | 161 | $ | (137 | ) | |||
| Effect on postretirement benefit obligation |
2,567 | (2,189 | ) | |||||
The major investment categories and their relative percentage of the fair value of total plan assets as invested at December 31, 2010 and 2009 were as follows:
| Pension Benefits |
Postretirement Benefits |
|||||||||||||||
| 2010 | 2009 | 2010 | 2009 | |||||||||||||
| Equity securities |
58.7 | % | 59.6 | % | 57.7 | % | 52.6 | % | ||||||||
| Debt securities |
37.1 | % | 37.8 | % | 37.9 | % | 37.4 | % | ||||||||
| Cash |
4.2 | % | 2.6 | % | 4.4 | % | 10.0 | % | ||||||||
The fair values of the pension plan assets at December 31, 2010 by asset category are as follows:
| Level 1 | Level 2 | Level 3 | Total | |||||||||||||
| Cash and cash equivalents |
$ | 2,709 | $ | — | $ | — | $ | 2,709 | ||||||||
| Mutual funds: |
||||||||||||||||
| Diversified emerging markets |
3,148 | — | — | 3,148 | ||||||||||||
| Foreign large blend |
8,031 | — | — | 8,031 | ||||||||||||
| Large-cap blend |
15,336 | — | — | 15,336 | ||||||||||||
| Long-term bonds |
24,151 | — | — | 24,151 | ||||||||||||
| Mid-cap blend |
8,505 | — | — | 8,505 | ||||||||||||
| Real estate |
3,196 | — | — | 3,196 | ||||||||||||
| Insurance policies |
— | — | 115 | 115 | ||||||||||||
|
|
|
|
|
|
|
|
|
|||||||||
| Net asset |
$ | 65,076 | $ | — | $ | 115 | $ | 65,191 | ||||||||
|
|
|
|
|
|
|
|
|
|||||||||
F-31
Table of Contents
U.S. Silica Holdings, Inc. and Subsidiaries and GGC RCS Holdings, Inc.
NOTES TO COMBINED FINANCIAL STATEMENTS
December 31, 2010 and 2009
(Dollars in thousands, except per share amounts)
NOTE O—PENSION AND POSTRETIREMENT BENEFITS—Continued
The fair values of the pension plan assets at December 31, 2009 by asset category are as follows:
| Level 1 | Level 2 | Level 3 | Total | |||||||||||||
| Cash and cash equivalents |
$ | 1,274 | $ | — | $ | — | $ | 1,274 | ||||||||
| Common/collective trusts |
— | 208 | — | 208 | ||||||||||||
| Mutual funds: |
||||||||||||||||
| Diversified emerging markets |
2,744 | — | — | 2,744 | ||||||||||||
| Foreign large blend |
7,057 | — | — | 7,057 | ||||||||||||
| Large-cap blend |
13,155 | — | — | 13,155 | ||||||||||||
| Long-term bonds |
21,042 | — | — | 21,042 | ||||||||||||
| Mid-cap blend |
7,387 | — | — | 7,387 | ||||||||||||
| Real estate |
2,895 | — | — | 2,895 | ||||||||||||
| Insurance policies |
— | — | 115 | 115 | ||||||||||||
| SL-Core USA Sub Fund |
— | 3 | — | 3 | ||||||||||||
|
|
|
|
|
|
|
|
|
|||||||||
| Net asset |
$ | 55,554 | $ | 211 | $ | 115 | $ | 55,880 | ||||||||
|
|
|
|
|
|
|
|
|
|||||||||
Certain hourly employees are covered under a multi-employer defined benefit plan. The pension cost recognized for these plans were $771 for the year ended December 31, 2010, $316 for the year ended December 31, 2009 and $274 and $82 for the 2008 predecessor and successor periods, respectively. In 2010, the Company exited one of these plans and, as a result, recorded a $603 provision for an estimated withdrawal liability.
The Company also sponsors a defined contribution plan covering certain employees. The Company contributes to the plan in two ways. For certain employees not covered by the defined benefit plan, the Company makes a contribution equal to 4% of their salary. The Company also contributes an employee match of 25 cents, based on financial performance, for each dollar contributed by an employee, up to 8% of their earnings. For certain employees, the Company makes a profit sharing match up to 75 cents, based on financial performance, for each dollar contributed up to 8% of their earnings. Finally, for some employees, the Company makes a catch-up match of 25 cents for each dollar of catch-up contributions. Contributions were $802 for the year ended December, 31, 2010, $550 for the year ended December 31, 2009, and $628 and $59 for the 2008 predecessor and successor periods, respectively.
NOTE P—OBLIGATIONS UNDER GUARANTEES
The Company has indemnified St. Paul Travelers (“Travelers”) against any loss Travelers may incur in the event that holders of surety bonds, issued on behalf of the Company by Travelers, execute the bonds. As of December 31, 2010, Travelers had $4.1 million in bonds outstanding for the Company. The majority of these bonds ($4.0 million) relate to reclamation requirements issued by various governmental authorities. Reclamation bonds remain outstanding until the mining area is reclaimed and the authority issues a formal release. The remaining bonds relate to such indefinite purposes as licenses, permits, and tax collection.
The Company has indemnified Safeco Insurance Company of America (“Safeco”) against any loss Safeco may incur in the event that holders of surety bonds, issued on behalf of the Company by Safeco, execute the bonds. As of December 31, 2010, Safeco had $513 in bonds outstanding for the Company. These are all reclamation bonds.
F-32
Table of Contents
U.S. Silica Holdings, Inc. and Subsidiaries and GGC RCS Holdings, Inc.
NOTES TO COMBINED FINANCIAL STATEMENTS
December 31, 2010 and 2009
(Dollars in thousands, except per share amounts)
NOTE P—OBLIGATIONS UNDER GUARANTEES—Continued
U.S. Silica is the contingent guarantor of Kanawha Rail Corporation’s (“KRC”) obligations as lessee of 200 covered hopper railroad cars, which are used by U.S. Silica to ship sand to its customers. KRC’s obligation as lessee includes paying monthly rent of $66 until June 30, 2013, maintaining the cars, paying for any cars damaged or destroyed, and indemnifying all other parties to the lease transaction against liabilities including any loss of certain tax benefits. By separate agreement between U.S. Silica and KRC, KRC may, upon the occurrence of certain events, assign the lease obligations to U.S. Silica, but none of these events have occurred.
NOTE Q—RELATED PARTY TRANSACTIONS
The Company has a $15 million promissory note with its parent, GGC USS Holdings, LLC. The note matures on December 22, 2015 and bears interest at 10%. The principal amount and interest under the note are payable upon demand, but no later than the maturity date. Upon sole election by the parent, any unpaid interest may be paid in cash on each December 22nd until the maturity date. Interest on the note is recorded in interest expense in the combined statement of operations and any unpaid interest is included in accrued interest on the balance sheet.
NOTE R—SEGMENT REPORTING
In the second quarter of 2011, the new chief executive officer completed the reorganization of the Company’s management structure in order to manage and evaluate the Company’s operations from an end market perspective. The Company has changed the segment reporting structure for the period presented to reflect these changes. Previously, the Company operated and was managed as a single operating unit.
The Company organizes its business into two reportable segments, oil & gas proppants and industrial & specialty products, based on end markets. The reportable segments are consistent with how management views the markets served by the Company and the financial information reviewed by the chief operating decision maker. The Company manages its oil & gas proppants and industrial & specialty products businesses as components of an enterprise for which separate information is available and is evaluated regularly by the chief operating decision maker in deciding how to allocate resources and assess performance.
An operating segment’s performance is primarily evaluated based on segment contribution margin, which excludes certain corporate costs not associated with the operations of the segment. These corporate costs are separately stated below and include costs that are related to functional areas such as operations management, corporate purchasing, accounting, treasury, information technology, legal and human resources. The Company believes that segment contribution margin, as defined above, is an appropriate measure for evaluating the operating performance of its segments. However, this measure should be considered in addition to, not a substitute for, or superior to, income from operations or other measures of financial performance prepared in accordance with generally accepted accounting principles. The other accounting policies of each of the two reporting segments are the same as those in the summary of significant accounting policies included in Note B.
In the oil & gas proppants segment, the Company serves the oil and gas recovery market providing fracturing sand, or “frac sand,” which is pumped down oil and natural gas wells to prop open rock fissures and increase the flow rate of natural gas and oil from the wells.
F-33
Table of Contents
U.S. Silica Holdings, Inc. and Subsidiaries and GGC RCS Holdings, Inc.
NOTES TO COMBINED FINANCIAL STATEMENTS
December 31, 2010 and 2009
(Dollars in thousands, except per share amounts)
NOTE R—SEGMENT REPORTING—Continued
A variety of client needs are met in the products in the industrial & specialty products segment including supplying materials used in container glass, fiberglass, specialty glass, flat glass, building products, fillers and extenders, foundry products, chemicals, recreation products and filtration products.
Financial information for all the periods presented reflects the new segment reporting structure.
The following table presents sales and segment contribution margin for the reporting segments and other operating results not allocated to the reported segments for the years ended December 31, 2010 and December 31, 2009, and for the predecessor and successor periods in 2008:
| 2010 | 2009 | 2008 | ||||||||||||||||
| Successor | Successor | Successor | Predecessor | |||||||||||||||
| 1/1 - 12/31 | 1/1 - 12/31 | 11/25 - 12/31 | 1/1 - 11/24 | |||||||||||||||
| Sales |
||||||||||||||||||
| Oil & gas proppants |
$ | 69,556 | $ | 35,836 | $ | 3,191 | $ | 34,684 | ||||||||||
| Industrial & specialty products |
175,397 | 155,787 | 14,006 | 181,702 | ||||||||||||||
|
|
|
|
|
|
|
|
|
|||||||||||
| Total sales |
$ | 244,953 | $ | 191,623 | $ | 17,197 | $ | 216,386 | ||||||||||
|
|
|
|
|
|
|
|
|
|||||||||||
| Segment contribution margin |
||||||||||||||||||
| Oil & gas proppants |
$ | 43,118 | $ | 23,515 | $ | 1,908 | $ | 21,649 | ||||||||||
| Industrial & specialty products |
46,031 | 37,419 | 22 | 41,666 | ||||||||||||||
|
|
|
|
|
|
|
|
|
|||||||||||
| Total segment contribution margin |
89,149 | 60,934 | 1,930 | 63,315 | ||||||||||||||
| Operating activities excluded from segment cost of goods sold |
(2,190 | ) | (5,511 | ) | 1,662 | (1,545 | ) | |||||||||||
| Selling, general and administrative |
(21,663 | ) | (11,922 | ) | (2,122 | ) | (19,600 | ) | ||||||||||
| Depreciation, depletion and amortization |
(19,305 | ) | (17,887 | ) | (1,803 | ) | (15,264 | ) | ||||||||||
| Interest expense |
(23,034 | ) | (28,228 | ) | (3,343 | ) | (640 | ) | ||||||||||
| Early extinguishment of debt |
(10,195 | ) | — | — | — | |||||||||||||
| Other income, net, including interest income |
959 | 4,894 | 145 | 1,326 | ||||||||||||||
|
|
|
|
|
|
|
|
|
|
||||||||||
| Income (loss) before income taxes |
$ | 13,721 | $ | 2,280 | $ | (3,531 | ) | $ | 27,592 | |||||||||
|
|
|
|
|
|
|
|
|
|
||||||||||
Asset information, including capital expenditures and depreciation, depletion, and amortization, by segment is not included in reports used by management in its monitoring of performance and, therefore, is not reported by segment. Goodwill of $68.4 million has been allocated to these segments with $33.3 million assigned to oil & gas proppants and $35.1 million to industrial and specialty products. No customer exceeded 10% or more of net sales in any of the periods presented.
NOTE S—SUBSEQUENT EVENTS
In connection with the preparation of its financial statements for the year ended December 31, 2010, the Company has evaluated events that occurred subsequent to December 31, 2010 and to determine whether any of these events required recognition or disclosure in the 2010 financial statements. The Company is not aware of any subsequent events which would require recognition or disclosure in the financial statements except as
F-34
Table of Contents
U.S. Silica Holdings, Inc. and Subsidiaries and GGC RCS Holdings, Inc.
NOTES TO COMBINED FINANCIAL STATEMENTS
December 31, 2010 and 2009
(Dollars in thousands, except per share amounts)
NOTE S—SUBSEQUENT EVENTS—Continued
discussed below. On June 8, 2011, the Company refinanced its senior secured term loan facility. Significant changes to the credit agreement included an increase in principal to $260 million from $165 million, a reduction in the interest rate to either LIBOR plus 375 basis points (previously 400) or prime plus 275 basis points (previously 300) and an extension in the maturity date from May 7, 2016 to June 8, 2017. A large portion of the proceeds was used to prepay the $75 million in subordinated notes in full.
In July 2011, the Company adopted the 2011 Plan. The 2011 Plan provides for grants of stock options, stock appreciation rights, restricted stock and other incentive-based awards. On July 8, 2011, the Company granted options to employees under the 2011 Plan to acquire up to 1,285,965 shares of our common stock at a weighted-average exercise price of $13.94. Excluding Directors’ plans, on average 100% of the options vest over 3.5 years. In conjunction with the implementation of the 2011 Plan the Company filed an amended and restated certificate of incorporation which, among other things, increased the authorized shares of common stock to 100 million and changed its name from GGC USS Holdings, Inc. to U.S. Silica Holdings, Inc. The amended and restated certificate of incorporation also created a 50,000-for-one split of the Company’s common stock. All common stock share and per share data of the Company contained in the financial statements have been retroactively adjusted to reflect this stock split for all periods presented.
F-35
Table of Contents
U.S. Silica Holdings, Inc. and Subsidiaries and GGC RCS Holdings, Inc.
NOTES TO COMBINED FINANCIAL STATEMENTS
December 31, 2010 and 2009
(Dollars in thousands, except per share amounts)
NOTE T—UNAUDITED SUPPLEMENTARY DATA
The following table sets forth the Company’s unaudited quarterly combined statements of operations for each of the last four quarters ended December 31, 2010. This unaudited quarterly information has been prepared on the same basis as the Company’s annual audited financial statements and includes all adjustments, consisting only of normal recurring adjustments, that are necessary to present fairly the financial information for the fiscal quarters presented.
| First Quarter |
Second Quarter |
Third Quarter |
Fourth Quarter |
|||||||||||||
| Sales |
$ | 55,311 | $ | 64,135 | $ | 66,036 | $ | 59,471 | ||||||||
| Cost of goods sold (excluding depreciation, depletion and amortization) |
37,699 | 40,087 | 41,215 | 38,993 | ||||||||||||
| Operating expenses |
||||||||||||||||
| Selling, general and administrative |
4,685 | 5,711 | 4,973 | 6,294 | ||||||||||||
| Depreciation, depletion and amortization |
4,720 | 4,773 | 4,772 | 5,040 | ||||||||||||
|
|
|
|
|
|
|
|
|
|||||||||
| 9,405 | 10,484 | 9,745 | 11,334 | |||||||||||||
|
|
|
|
|
|
|
|
|
|||||||||
| Operating income |
8,207 | 13,564 | 15,076 | 9,144 | ||||||||||||
| Other (expense) income |
||||||||||||||||
| Interest expense |
(6,774 | ) | (5,844 | ) | (5,090 | ) | (5,326 | ) | ||||||||
| Early extinguishment of debt |
— | (10,195 | ) | — | — | |||||||||||
| Other income, net, including interest income |
183 | 312 | 359 | 105 | ||||||||||||
|
|
|
|
|
|
|
|
|
|||||||||
| (6,591 | ) | (15,727 | ) | (4,731 | ) | (5,221 | ) | |||||||||
|
|
|
|
|
|
|
|
|
|||||||||
| Income (loss) before income taxes |
1,616 | (2,163 | ) | 10,345 | 3,923 | |||||||||||
| Income tax (expense) benefit |
(1,275 | ) | 107 | (1,010 | ) | (151 | ) | |||||||||
|
|
|
|
|
|
|
|
|
|||||||||
| NET INCOME (LOSS) |
$ | 341 | $ | (2,056 | ) | $ | 9,335 | $ | 3,772 | |||||||
|
|
|
|
|
|
|
|
|
|||||||||
| Earnings (loss) per share (basic and diluted) |
$ | 0.01 | $ | (0.04 | ) | $ | 0.19 | $ | 0.08 | |||||||
| Weighted-average common shares outstanding (in thousands) |
50,000 | 50,000 | 50,000 | 50,000 | ||||||||||||
F-36
Table of Contents
U.S. Silica Holdings, Inc. and Subsidiaries and GGC RCS Holdings, Inc.
UNAUDITED CONDENSED COMBINED BALANCE SHEETS
September 30, 2011 and December 31, 2010
(Dollars in thousands, except per share amounts)
| September 30, 2011 |
December 31, 2010 |
|||||||
| (unaudited) | ||||||||
| ASSETS | ||||||||
| CURRENT ASSETS |
||||||||
| Cash and cash equivalents |
$ | 73,809 | $ | 64,500 | ||||
| Accounts receivable |
||||||||
| Trade, net |
38,040 | 29,265 | ||||||
| Other |
770 | 779 | ||||||
| Inventories |
25,881 | 22,418 | ||||||
| Prepaid expenses and other current assets |
4,452 | 3,191 | ||||||
| Deferred income taxes, net |
4,618 | 4,557 | ||||||
| Income tax receivable |
1,089 | 2,150 | ||||||
|
|
|
|
|
|||||
| Total current assets |
148,659 | 126,860 | ||||||
|
|
|
|
|
|||||
| PROPERTY, PLANT AND EQUIPMENT |
||||||||
| Mining property and mine development |
155,769 | 154,529 | ||||||
| Asset retirement cost |
5,620 | 5,620 | ||||||
| Land |
21,618 | 21,618 | ||||||
| Land improvements |
9,444 | 9,261 | ||||||
| Buildings |
17,204 | 17,204 | ||||||
| Machinery and equipment |
114,599 | 111,227 | ||||||
| Furniture and fixtures |
398 | 28 | ||||||
| Construction-in-progress |
28,139 | 4,739 | ||||||
|
|
|
|
|
|||||
| 352,791 | 324,226 | |||||||
| Less accumulated depletion, depreciation and amortization |
51,432 | 36,631 | ||||||
|
|
|
|
|
|||||
| Total property, plant and equipment, net |
301,359 | 287,595 | ||||||
|
|
|
|
|
|||||
| OTHER ASSETS |
||||||||
| Debt issuance costs, net |
1,228 | 1,322 | ||||||
| Goodwill |
68,403 | 68,403 | ||||||
| Trade Names |
10,436 | 10,436 | ||||||
| Customer relationships, net |
7,045 | 7,353 | ||||||
| Other |
6,374 | 6,565 | ||||||
|
|
|
|
|
|||||
| Total other assets |
93,486 | 94,079 | ||||||
|
|
|
|
|
|||||
| Total assets |
$ | 543,504 | $ | 508,534 | ||||
|
|
|
|
|
|||||
F-37
Table of Contents
| September 30, 2011 |
December 31, 2010 |
|||||||
| (unaudited) | ||||||||
| LIABILITIES AND STOCKHOLDER’S EQUITY |
||||||||
| CURRENT LIABILITIES |
||||||||
| Book overdraft |
$ | 5,563 | $ | 3,727 | ||||
| Accounts payable |
13,859 | 12,027 | ||||||
| Accrued liabilities |
9,604 | 8,949 | ||||||
| Accrued interest |
1,221 | 101 | ||||||
| Current portion of deferred revenue |
6,512 | 6,512 | ||||||
| Current portion of long-term debt |
2,431 | 1,510 | ||||||
|
|
|
|
|
|||||
| Total current liabilities |
39,190 | 32,826 | ||||||
|
|
|
|
|
|||||
| LONG-TERM OBLIGATIONS |
||||||||
| Deferred income taxes, net |
55,604 | 53,124 | ||||||
| Long-term debt |
256,033 | 236,932 | ||||||
| Note to parent |
15,000 | 15,000 | ||||||
| Deferred revenue |
8,323 | 13,077 | ||||||
| Liability for pension and other postretirement benefits |
39,848 | 49,460 | ||||||
| Other long-term obligations |
11,054 | 10,551 | ||||||
|
|
|
|
|
|||||
| Total long-term obligations |
385,862 | 378,144 | ||||||
|
|
|
|
|
|||||
| COMMITMENTS AND CONTINGENCIES |
||||||||
| STOCKHOLDER’S EQUITY |
||||||||
| Common stock: |
||||||||
| Par value $0.01, authorized 100,000,000 shares, issued 50,000,000 shares |
500 | 500 | ||||||
| Additional paid-in capital |
103,201 | 102,519 | ||||||
| Retained earnings (accumulated deficit) |
19,993 | (215 | ) | |||||
| Accumulated other comprehensive loss |
(5,242 | ) | (5,240 | ) | ||||
|
|
|
|
|
|||||
| Total stockholder’s equity |
118,452 | 97,564 | ||||||
|
|
|
|
|
|||||
| Total liabilities and stockholder’s equity |
$ | 543,504 | $ | 508,534 | ||||
|
|
|
|
|
|||||
The accompanying notes are an integral part of these financial statements.
F-38
Table of Contents
U.S. Silica Holdings, Inc. and Subsidiaries and GGC RCS Holdings, Inc.
UNAUDITED CONDENSED COMBINED STATEMENTS OF OPERATIONS
Three and nine months ended September 30,
(Dollars in thousands, except per share amounts)
| Three months ended September 30, |
Nine months ended September 30, |
|||||||||||||||
| 2011 | 2010 | 2011 | 2010 | |||||||||||||
| Sales |
$ | 73,453 | $ | 66,036 | $ | 211,965 | $ | 185,482 | ||||||||
| Cost of goods sold (excluding depreciation, depletion and amortization, shown separately) |
|
45,241 |
|
|
41,215 |
|
131,145 | 119,001 | ||||||||
| Operating expenses |
||||||||||||||||
| Selling, general and administrative |
5,528 | 4,973 | 17,429 | 15,369 | ||||||||||||
| Depreciation, depletion and amortization |
5,295 | 4,772 | 15,636 | 14,265 | ||||||||||||
|
|
|
|
|
|
|
|
|
|||||||||
| 10,823 | 9,745 | 33,065 | 29,634 | |||||||||||||
|
|
|
|
|
|
|
|
|
|||||||||
| Operating income |
17,389 | 15,076 | 47,755 | 36,847 | ||||||||||||
| Other (expense) income |
||||||||||||||||
| Interest expense |
(3,832 | ) | (5,090 | ) | (14,505 | ) | (17,708 | ) | ||||||||
| Early extinguishment of debt |
— | — | (6,043 | ) | (10,195 | ) | ||||||||||
| Other income, net, including interest income |
197 | 359 | 534 | 854 | ||||||||||||
|
|
|
|
|
|
|
|
|
|||||||||
| (3,635 | ) | (4,731 | ) | (20,014 | ) | (27,049 | ) | |||||||||
|
|
|
|
|
|
|
|
|
|||||||||
| Income before income taxes |
13,754 | 10,345 | 27,741 | 9,798 | ||||||||||||
| Income tax expense |
(3,412 | ) | (1,010 | ) | (7,533 | ) | (2,178 | ) | ||||||||
|
|
|
|
|
|
|
|
|
|||||||||
| NET INCOME |
10,342 | 9,335 | $ | 20,208 | $ | 7,620 | ||||||||||
|
|
|
|
|
|
|
|
|
|||||||||
| Earnings per share |
||||||||||||||||
| Earnings per share (basic and diluted) |
$ | 0.21 | $ | 0.19 | $ | 0.40 | $ | 0.16 | ||||||||
| Weighted-average common shares outstanding |
||||||||||||||||
| Basic |
50,000,000 | 50,000,000 | 50,000,000 | 50,000,000 | ||||||||||||
| Diluted |
50,000,000 | 50,000,000 | 50,030,736 | 50,000,000 | ||||||||||||
The accompanying notes are an integral part of these financial statements.
F-39
Table of Contents
U.S. Silica Holdings, Inc. and Subsidiaries and GGC RCS Holdings, Inc.
UNAUDITED CONDENSED COMBINED STATEMENTS
OF STOCKHOLDER’S EQUITY
Nine months ended September 30,
(Dollars in thousands)
| Accumulated Other Comprehensive Income (Loss) |
||||||||||||||||||||||||||||
| Common stock |
Additional paid-in capital |
Retained earnings (accumulated deficit) |
Unrealized (loss) gain on derivatives |
Pension and other postretirement benefits liability |
Total | Total Stockholders’ (deficit) equity |
||||||||||||||||||||||
| Balance at January 1, 2010 |
$ | 500 | $ | 126,649 | $ | 3,681 | $ | (49 | ) | $ | (3,751 | ) | $ | (3,800 | ) | $ | 127,030 | |||||||||||
| Comprehensive income, net of income taxes |
||||||||||||||||||||||||||||
| Net loss |
— | — | 7,620 | — | — | — | 7,620 | |||||||||||||||||||||
| Unrealized gain on derivatives |
— | — | — | (716 | ) | — | (716 | ) | (716 | ) | ||||||||||||||||||
| Minimum pension liability |
— | — | — | — | 1,186 | 1,186 | 1,186 | |||||||||||||||||||||
|
|
|
|||||||||||||||||||||||||||
| Total comprehensive income |
— | — | — | — | — | — | 8,090 | |||||||||||||||||||||
| Equity-based compensation |
— | 287 | — | — | — | — | 287 | |||||||||||||||||||||
| Dividend |
— | (25,000 | ) | — | — | — | — | (25,000 | ) | |||||||||||||||||||
|
|
|
|
|
|
|
|
|
|
|
|
|
|
|
|||||||||||||||
| Balance at September 30, 2010 |
$ | 500 | $ | 101,936 | $ | 11,301 | $ | (765 | ) | $ | (2,565 | ) | $ | (3,330 | ) | $ | 110,407 | |||||||||||
|
|
|
|
|
|
|
|
|
|
|
|
|
|
|
|||||||||||||||
| Balance at January 1, 2011 |
$ | 500 | $ | 102,519 | $ | (215 | ) | $ | (532 | ) | $ | (4,708 | ) | $ | (5,240 | ) | $ | 97,564 | ||||||||||
| Comprehensive income, net of income taxes |
— | |||||||||||||||||||||||||||
| Net income |
— | — | 20,208 | — | — | — | 20,208 | |||||||||||||||||||||
| Unrealized loss on derivatives |
— | — | — | (2 | ) | — | (2 | ) | (2 | ) | ||||||||||||||||||
|
|
|
|||||||||||||||||||||||||||
| Total comprehensive income |
— | — | — | — | — | — | 20,206 | |||||||||||||||||||||
| Equity-based compensation |
— | 682 | — | — | — | — | 682 | |||||||||||||||||||||
|
|
|
|
|
|
|
|
|
|
|
|
|
|
|
|||||||||||||||
| Balance at September 30, 2011 |
$ | 500 | $ | 103,201 | $ | 19,993 | $ | (534 | ) | $ | (4,708 | ) | $ | (5,242 | ) | $ | 118,452 | |||||||||||
|
|
|
|
|
|
|
|
|
|
|
|
|
|
|
|||||||||||||||
The accompanying notes are an integral part of these financial statements.
F-40
Table of Contents
U.S. Silica Holdings, Inc. and Subsidiaries and GGC RCS Holdings, Inc.
UNAUDITED CONDENSED COMBINED STATEMENTS OF CASH FLOWS
Nine months ended September 30,
(Dollars in thousands)
| 2011 | 2010 | |||||||
| Cash flows from operating activities |
||||||||
| Net income |
$ | 20,208 | $ | 7,620 | ||||
| Adjustments to reconcile net income to net cash (used in) provided by operating activities |
||||||||
| Depreciation, depletion and amortization |
15,636 | 14,265 | ||||||
| Debt issuance amortization |
188 | 381 | ||||||
| Original issue discount amortization |
115 | 348 | ||||||
| Early extinguishment of debt |
6,043 | 10,195 | ||||||
| Deferred income taxes |
2,419 | (812 | ) | |||||
| Loss on disposal of property, plant and equipment |
6 | 4 | ||||||
| Deferred revenue |
(4,754 | ) | (4,273 | ) | ||||
| Liability for pension and other postretirement benefits |
(9,612 | ) | (3,923 | ) | ||||
| Equity-based compensation |
682 | 287 | ||||||
| Other |
286 | 1,679 | ||||||
| Changes in assets and liabilities: |
||||||||
| Trade receivables |
(8,775 | ) | (7,705 | ) | ||||
| Other receivables |
1 | 4,374 | ||||||
| Inventories |
(3,462 | ) | 485 | |||||
| Prepaid expenses and other current assets |
(1,261 | ) | (358 | ) | ||||
| Income taxes |
1,061 | (2,490 | ) | |||||
| Accounts payable and accrued liabilities |
2,493 | 4,391 | ||||||
| Accrued interest |
1,121 | (69 | ) | |||||
|
|
|
|
|
|||||
| Net cash provided by operating activities |
22,395 | 24,399 | ||||||
| Cash flows from investing activities |
||||||||
| Capital expenditures |
(28,753 | ) | (10,355 | ) | ||||
| Proceeds from sale of property, plant and equipment |
61 | 76 | ||||||
|
|
|
|
|
|||||
| Net cash used in investing activities |
(28,692 | ) | (10,279 | ) | ||||
| Cash flows from financing activities |
||||||||
| Change in book overdraft |
1,836 | 330 | ||||||
| Issuance of long-term debt |
259,061 | 65,909 | ||||||
| Repayment of long-term debt |
(239,826 | ) | (10,801 | ) | ||||
| Principal payments on capital lease obligations |
— | (3 | ) | |||||
| Dividends paid |
— | (25,000 | ) | |||||
| Prepayment penalties |
(1,500 | ) | (392 | ) | ||||
| Financing fees |
(3,965 | ) | (3,450 | ) | ||||
|
|
|
|
|
|||||
| Net cash provided by financing activities |
15,606 | 26,593 | ||||||
| NET DECREASE IN CASH AND CASH EQUIVALENTS |
9,309 | 40,713 | ||||||
| Cash and cash equivalents at beginning of period |
$ | 64,500 | $ | 14,474 | ||||
|
|
|
|
|
|||||
| Cash and cash equivalents at end of period |
$ | 73,809 | $ | 55,187 | ||||
|
|
|
|
|
|||||
| Supplemental disclosure of cash flow information: |
||||||||
| Cash paid during the period for: |
||||||||
| Interest |
$ | 12,440 | $ | 15,138 | ||||
| Income taxes |
4,034 | 3,748 | ||||||
The accompanying notes are an integral part of these financial statements.
F-41
Table of Contents
U.S. Silica Holdings, Inc. and Subsidiaries and GGC RCS Holdings, Inc.
NOTES TO UNAUDITED CONDENSED COMBINED FINANCIAL STATEMENTS
September 30, 2011 and December 31, 2010
(Dollars in thousands, except per share amounts)
NOTE A—ACCOUNTING POLICIES
The unaudited condensed combined financial statements of U.S. Silica Holdings, Inc. and Subsidiaries and GGC RCS Holdings, Inc. (the “Company”) have been prepared in accordance with accounting principles generally accepted in the United States of America (“GAAP”) for interim financial information. Accordingly, they do not include all of the information and footnotes required by GAAP for complete financial statements. The year-end balance sheet data was derived from audited financial statements but does not include disclosures required by GAAP for annual periods. In the opinion of management, the unaudited combined financial statements for the nine months ended September 30, 2010 and 2011 reflect all adjustments and disclosures necessary for a fair presentation of the results of the reported interim periods.
Operating results are not necessarily indicative of the results to be expected for the full year or any other interim period, due to the seasonal, weather-related conditions in certain aspects of the Company’s business. These unaudited condensed financial statements should be read in conjunction with the Company’s combined financial statements and notes thereto included elsewhere in this registration statement.
Earnings Per Share
Basic earnings per share excludes dilution and is computed using the weighted average number of shares of common stock outstanding. Diluted earnings per share reflects the potential dilution that could occur if securities or other contracts to issue common stock were exercised or converted into common stock or resulted in the issuance of common stock that then shared in the earnings.
NOTE B—ACCOUNTS RECEIVABLE
At September 30, 2011 and December 31, 2010, receivables consisted of the following:
| September 30, 2011 |
December 31, 2010 |
|||||||
| (unaudited) | ||||||||
| Trade receivables |
$ | 38,811 | $ | 30,097 | ||||
| Less allowance for doubtful accounts |
(771 | ) | (832 | ) | ||||
|
|
|
|
|
|||||
| Net trade receivables |
38,040 | 29,265 | ||||||
| Other receivables |
770 | 779 | ||||||
|
|
|
|
|
|||||
| Total |
$ | 38,810 | $ | 30,044 | ||||
|
|
|
|
|
|||||
Trade receivables relate to sales of commercial silica, for which credit is extended based on the customer’s credit history.
NOTE C—INVENTORIES
At September 30, 2011 and December 31, 2010, inventory consisted of the following:
| September 30, 2011 |
December 31, 2010 |
|||||||
| Supplies |
$ | 12,377 | $ | 11,475 | ||||
| Raw materials and work in process |
7,451 | 6,208 | ||||||
| Finished goods |
6,053 | 4,735 | ||||||
|
|
|
|
|
|||||
| $ | 25,881 | $ | 22,418 | |||||
|
|
|
|
|
|||||
F-42
Table of Contents
U.S. Silica Holdings, Inc. and Subsidiaries and GGC RCS Holdings, Inc.
NOTES TO UNAUDITED CONDENSED COMBINED FINANCIAL STATEMENTS—CONTINUED
September 30, 2011 and December 31, 2010
(Dollars in thousands, except per share amounts)
NOTE D—FAIR VALUE OF FINANCIAL INSTRUMENTS
Interest rate and natural gas hedge agreements are utilized in the normal course of business to manage the Company’s interest and energy costs and the risk associated with changing interest rates and natural gas prices. These hedge agreements are used to exchange the difference between fixed and variable-rate interest amounts or natural gas prices calculated by reference to an agreed-upon notional principal amount or natural gas quantity. The Company does not use derivative financial instruments for trading or speculative purposes.
The fair value of the hedge agreements represents the estimated receipts or payments that would be required to settle the agreements at period-end. Quoted market prices of similar instruments were used to estimate the fair values of the interest rate and natural gas hedge agreements. The notional amount represents agreed upon amounts on which calculations of dollars to be exchanged are based. They do not represent amounts exchanged by the parties and, therefore, are not a measure of the Company’s exposure. The Company’s credit exposure is limited to the fair value of the contracts with a positive fair value plus interest receivable, if any, at the reporting date.
| September 30, 2011 | December 31, 2010 | |||||||||||||||||||||||||||||||
| Maturity Date |
Contract/ Notional Amount |
Carrying Amount |
Fair Value |
Contract/ Notional Amount |
Carrying Amount |
Fair Value |
||||||||||||||||||||||||||
| Natural gas rate swap agreements |
2011 | 420,000 | MMBTU | $ | (102 | ) | $ | (102 | ) | 420,000 | MMBTU | $ | (109 | ) | $ | (109 | ) | |||||||||||||||
| Interest rate cap agreement |
2012 | $ | 100 million | (1) | $ | 1 | $ | 1 | $ | 100 million | (1) | $ | 13 | $ | 13 | |||||||||||||||||
| Interest rate cap agreement |
2013 | $ | 20 million | (1) | $ | 20 | $ | 20 | $ | 20 million | (1) | $ | 244 | $ | 244 | |||||||||||||||||
| (1) | Agreement limits the LIBOR floating interest rate base to 4%. |
The Company has designated these contracts as qualified cash flow hedges. Accordingly, the effective portion of the gain or loss on the derivative instrument is reported as a component of other comprehensive income and recognized in earnings in the same period or periods during which the hedged transaction affects earnings. The Company had no ineffective contracts in any of the reporting periods.
The fair value of financial instruments classified as current assets or liabilities, including cash and cash equivalents, accounts receivable, inventory and accounts payable, approximate carrying value due to the short-term maturity of the instruments. The fair value of short-term and long-term debt amounts approximates their carrying values and are based on their effective interest rates compared to current market rates.
The accounting guidance for fair value measurements defines fair value as the price that would be received to sell an asset or paid to transfer a liability in an orderly transaction between market participants at the measurement date. This accounting guidance also establishes a fair value hierarchy that prioritizes the inputs to valuation techniques used to measure fair value into three broad levels. Level 1 inputs are unadjusted quoted prices in active markets for identical assets and liabilities and have the highest priority. Level 2 inputs are inputs other than quoted prices within Level 1 that are observable for the asset or liability, either directly or indirectly. Level 3 inputs are unobservable inputs for the financial asset or liability.
F-43
Table of Contents
U.S. Silica Holdings, Inc. and Subsidiaries and GGC RCS Holdings, Inc.
NOTES TO UNAUDITED CONDENSED COMBINED FINANCIAL STATEMENTS—CONTINUED
September 30, 2011 and December 31, 2010
(Dollars in thousands, except per share amounts)
NOTE D—FAIR VALUE OF FINANCIAL INSTRUMENTS—Continued
The following table sets forth by level, within the fair value hierarchy, the Company’s assets and liabilities at fair value as of September 30, 2011:
| Level 1 | Level 2 | Level 3 | Total | |||||||||||||
| Money market funds |
$ | 72,515 | $ | — | $ | — | $ | 72,515 | ||||||||
| Natural gas derivatives |
— | (102 | ) | — | (102 | ) | ||||||||||
| Interest rate derivative |
— | 20 | — | 20 | ||||||||||||
|
|
|
|
|
|
|
|
|
|||||||||
| Net asset (liability) |
$ | 72,515 | $ | (82 | ) | $ | — | $ | 72,433 | |||||||
|
|
|
|
|
|
|
|
|
|||||||||
The Level 2 natural gas and interest rate derivatives are measured by the spot rates from actively quoted markets using the income approach.
NOTE E—LONG TERM OBLIGATIONS
On June 8, 2011, the Company refinanced its senior secured term loan facility. Significant changes to the credit agreement included an increase in principal to $260 million from $165 million, a reduction in the interest rate to either LIBOR plus 375 basis points (previously 400) or prime plus 275 basis points (previously 300) and an extension in the maturity date from May 7, 2016 to June 8, 2017. A large portion of the proceeds was used to prepay the $75 million in subordinated notes in full. The Company was in compliance with its debt covenants at September 30, 2011.
NOTE F—EQUITY-BASED COMPENSATION
In July 2011, the Company adopted the 2011 Plan. The GGC USS Holdings, Inc. 2011 Incentive Compensation Plan provides for grants of stock options, stock appreciation rights, restricted stock and other incentive-based awards. On July 8, 2011, the Company granted options to employees under the 2011 Plan to acquire up to 1,285,965 shares of our common stock at a weighted-average exercise price of $13.94. On July 25, 2011 the Company granted additional options to an employee to acquire 128,470 shares of its common stock at a weighted-average exercise price of $14.30. On September 6, 2011, the Company granted options to an employee to acquire 51,293 shares of its common stock at a weighted-average price of $13.65. Likewise, on September 16, 2011, additional options were granted to an employee to acquire 51,293 shares of common stock at a weighted average price of $13.65. There were also 20,518 forfeitures during the period. As of September 30, 2011 there were a total of 1,496,503 options outstanding, none of which are exercisable, at a weighted-average exercise price of $13.96. The options vest on a graded vesting schedule and the related compensation expense is recognized over the vesting period of each separately vesting portion. The Company recognized $477 of equity-based compensation expense related to these options during the three and nine month periods ended September 30, 2011. As of September 30, 2011, there was $5.7 million of total unrecognized compensation expense related to these options, which is expected to be recognized over a weighted-average period of approximately 3.28 years. Excluding Directors’ plans, on average 100% of the options vest over 3.5 years. In conjunction with the implementation of the 2011 Plan the Company filed an amended and restated certificate of incorporation which, among other things, increased the authorized shares of common stock to 100 million and changed its name from GGC USS Holdings, Inc. to U.S. Silica Holdings, Inc. The amended and restated certificate of incorporation also created a 50,000-for-one split of the Company’s common stock. All common stock share and per share data of the Company contained in the financial statements have been retroactively adjusted to reflect this stock split for all periods presented.
F-44
Table of Contents
U.S. Silica Holdings, Inc. and Subsidiaries and GGC RCS Holdings, Inc.
NOTES TO UNAUDITED CONDENSED COMBINED FINANCIAL STATEMENTS—CONTINUED
September 30, 2011 and December 31, 2010
(Dollars in thousands, except per share amounts)
The Company’s activity with respect to stock options for the nine months ended September 30, 2011 was as follows:
| Number of Shares |
Range of Exercise Prices |
Weighted Average Exercise Price |
Fair Value |
|||||||||||||
| Unvested, December 31, 2010 |
— | — | — | — | ||||||||||||
| Granted |
1,517,021 | $ | 10.33 - $16.90 | $ | 13.95 | $ | 4.11 | |||||||||
| Exercised |
— | — | — | — | ||||||||||||
| Vested |
— | — | — | — | ||||||||||||
| Forfeited |
(20,518 | ) | — | $ | 13.65 | $ | 3.94 | |||||||||
|
|
|
|||||||||||||||
| Unvested, September 30, 2011 |
1,496,503 | $ | 10.33 - $16.90 | $ | 13.96 | $ | 4.11 | |||||||||
|
|
|
|||||||||||||||
The Company recognized $55 and $96 of equity-based compensation expense related to the Class C and D equity incentive units during the three months ended September 30, 2011 and 2010, respectively, and $205 and $287 of compensation expense during the nine months ended September 30, 2011 and 2010, respectively. As of September 30, 2011, there was $565 of total unrecognized compensation expense related to equity incentive shares, which is expected to be recognized over a weighted-average period of approximately 2.65 years.
Fair value of the options is determined by utilizing the Black-Scholes pricing model and taking into consideration the rights and preferences of the options.
The following table illustrates the assumptions used in the Black-Scholes pricing model:
| Risk-free interest rate |
1.21% -2.01% | |
| Expected volatility |
45% | |
| Expected term |
5.48 - 6.25 |
Risk-free interest rate - This is an interpolated rate from the U.S. constant maturity treasury rate for a term corresponding to the expected term, as described below. An increase in the risk-free rate will increase compensation expense.
Expected volatility - This is a measure of the amount by which the price of various comparable companies common stock has fluctuated or is expected to fluctuate, as the Company’s common stock is not publicly-traded. The comparable companies were selected by analyzing public companies in the industry based on various factors including, but not limited to, company size, financial data availability, active trading volume, and capital structure. An increase in the expected volatility will increase compensation expense.
Expected term - This is the period of time over which the options are expected to remain outstanding. An increase in the expected term will increase compensation expense. The computation of the expected term is based on the simplified method as the Company’s stock options are “plain vanilla” options and the Company has no recent history of exercise data. Under the simplified method, the expected term is presumed to be the mid-point between the vesting date and the end of the contractual term.
F-45
NOTE F—EQUITY-BASED COMPENSATION—Continued
Table of Contents
U.S. Silica Holdings, Inc. and Subsidiaries and GGC RCS Holdings, Inc.
NOTES TO UNAUDITED CONDENSED COMBINED FINANCIAL STATEMENTS—CONTINUED
September 30, 2011 and December 31, 2010
(Dollars in thousands, except per share amounts)
NOTE G—INCOME TAXES
In accordance with generally accepted accounting principles, it is the Company’s practice at the end of each interim reporting period to make its best estimate of the effective tax rate expected to be applicable for the full fiscal year. Estimates are revised as additional information becomes available.
NOTE H—PENSION AND POSTRETIREMENT BENEFITS
Net periodic pension benefit cost for the three and nine months ended September 30, 2011 and 2010 was as follows:
| Three months ended September 30, |
Nine months ended September 30, |
|||||||||||||||
| 2011 | 2010 | 2011 | 2010 | |||||||||||||
| Service cost |
$ | 287 | $ | 249 | $ | 770 | $ | 707 | ||||||||
| Interest cost |
1,189 | 1,195 | 2,927 | 3,584 | ||||||||||||
| Expected return on plan assets |
(1,204 | ) | (1,012 | ) | (2,883 | ) | (2,947 | ) | ||||||||
| Amortization of prior service cost |
(3 | ) | (28 | ) | (22 | ) | (67 | ) | ||||||||
| Amortization of net (gain) loss |
151 | 64 | 467 | 126 | ||||||||||||
|
|
|
|
|
|
|
|
|
|||||||||
| Net periodic benefit cost |
$ | 420 | $ | 468 | $ | 1,259 | $ | 1,403 | ||||||||
|
|
|
|
|
|
|
|
|
|||||||||
Net periodic postretirement benefit cost for the three and nine months ended September 30, 2011 and 2010 was as follows:
| Three months ended September 30, |
Nine months ended September 30, |
|||||||||||||||
| 2011 | 2010 | 2011 | 2010 | |||||||||||||
| Service cost |
$ | 32 | $ | 47 | $ | 130 | $ | 127 | ||||||||
| Interest cost |
197 | |
318 |
|
792 | 913 | ||||||||||
| Expected return on plan assets |
(1 | ) | (1 | ) | (3 | ) | (3 | ) | ||||||||
| Amortization of net (gain) loss |
— | — | 87 | — | ||||||||||||
|
|
|
|
|
|
|
|
|
|||||||||
| Net periodic benefit cost |
$ | 228 | $ | 364 | $ | 1,006 | $ | 1,037 | ||||||||
|
|
|
|
|
|
|
|
|
|||||||||
The Company contributed $2.1 million and $11.0 million to the qualified pension plan during the three and nine months ended September 30, 2011, respectively. Total expected employer funding contributions during the fiscal year ending December 31, 2011 are $11.0 million for the pension plan, and $1.4 million for the postretirement medical and life plan.
NOTE I—SEGMENT REPORTING
The Company organizes its business into two reportable segments, oil & gas proppants and industrial & specialty products, based on end markets. The reportable segments are consistent with how management views the markets served by the Company and the financial information reviewed by the chief operating decision maker. The Company manages its oil & gas proppants and industrial & specialty products businesses as components of an enterprise for which separate information is available and is evaluated regularly by the chief operating decision maker in deciding how to allocate resources and assess performance.
F-46
Table of Contents
U.S. Silica Holdings, Inc. and Subsidiaries and GGC RCS Holdings, Inc.
NOTES TO UNAUDITED CONDENSED COMBINED FINANCIAL STATEMENTS—CONTINUED
September 30, 2011 and December 31, 2010
(Dollars in thousands, except per share amounts)
An operating segment’s performance is primarily evaluated based on segment contribution margin, which excludes certain corporate costs not associated with the operations of the segment. These corporate costs are separately stated below and include costs that are related to functional areas such as operations management, corporate purchasing, accounting, treasury, information technology, legal and human resources. The Company believes that segment contribution margin, as defined above, is an appropriate measure for evaluating the operating performance of its segments. However, this measure should be considered in addition to, not a substitute for, or superior to, income from operations or other measures of financial performance prepared in accordance with generally accepted accounting principles. The other accounting policies of each of the two reporting segments are the same as those in the summary of significant accounting policies included in Note A.
In the oil & gas proppants segment, the Company serves the oil and gas recovery market providing fracturing sand, or “frac sand,” which is pumped down oil and natural gas wells to prop open rock fissures and increase the flow rate of natural gas and oil from the wells.
A variety of client needs are met in the products in the industrial & specialty products segment including supplying materials used in container glass, fiberglass, specialty glass, flat glass, building products, fillers and extenders, foundry products, chemicals, recreation products and filtration products.
The following table presents sales and segment contribution margin for the reporting segments and other operating results not allocated to the reported segments for the three and nine months ended September 30, 2011 and September 30, 2010:
| Three months ended September 30, |
Nine months ended September 30, |
|||||||||||||||
| 2011 | 2010 | 2011 | 2010 | |||||||||||||
| Sales |
||||||||||||||||
| Oil & gas proppants |
$ | 24,246 | $ | 19,417 | $ | 69,322 | $ | 51,185 | ||||||||
| Industrial & specialty products |
49,207 | 46,619 | 142,643 | 134,297 | ||||||||||||
|
|
|
|
|
|
|
|
|
|||||||||
| Total sales |
$ | 73,453 | $ | 66,036 | $ | 211,965 | $ | 185,482 | ||||||||
|
|
|
|
|
|
|
|
|
|||||||||
| Segment contribution margin |
||||||||||||||||
| Oil & gas proppants |
$ | 15,633 | $ | 12,558 | $ | 43,828 | $ | 31,896 | ||||||||
| Industrial & specialty products |
13,730 | 13,310 | 38,495 | 37,018 | ||||||||||||
|
|
|
|
|
|
|
|
|
|||||||||
| Total segment contribution margin |
29,363 | 25,868 | 82,323 | 68,914 | ||||||||||||
| Operating costs excluded from segment cost of goods sold |
(1,151 | ) | (1,047 | ) | (1,503 | ) | (2,433 | ) | ||||||||
| Selling, general and administrative |
(5,528 | ) | (4,973 | ) | (17,429 | ) | (15,369 | ) | ||||||||
| Depreciation, depletion and amortization |
(5,295 | ) | (4,772 | ) | (15,636 | ) | (14,265 | ) | ||||||||
| Interest expense |
(3,832 | ) | (5,090 | ) | (14,505 | ) | (17,708 | ) | ||||||||
| Early extinguishment of debt |
— | — | (6,043 | ) | (10,195 | ) | ||||||||||
| Other income, net, including interest income |
197 | 359 | 534 | 854 | ||||||||||||
|
|
|
|
|
|
|
|
|
|||||||||
| Income before income taxes |
$ | 13,754 | $ | 10,345 | $ | 27,741 | $ | 9,798 | ||||||||
|
|
|
|
|
|
|
|
|
|||||||||
Asset information, including capital expenditures and depreciation, depletion, and amortization, by segment is not included in reports used by management in its monitoring of performance and, therefore, is not reported by segment. Goodwill of $68.4 million has been allocated to these segments with $33.3 million assigned to oil &
F-47
NOTE I—SEGMENT REPORTING—Continued
Table of Contents
U.S. Silica Holdings, Inc. and Subsidiaries and GGC RCS Holdings, Inc.
NOTES TO UNAUDITED CONDENSED COMBINED FINANCIAL STATEMENTS—CONTINUED
September 30, 2011 and December 31, 2010
(Dollars in thousands, except per share amounts)
gas proppants and $35.1 million to industrial & specialty products. No customer exceeded 10% or more of net sales in any of the periods presented.
NOTE J—SUBSEQUENT EVENTS
The Company evaluated all events or transactions occurring after September 30, 2011 through November 7, 2011, the date the financial statements were issued.
F-48
NOTE I—SEGMENT REPORTING—Continued
Table of Contents

8490 Progress Drive Suite 300, Frederice, MD 21701 ‰ phone 1 (800) 345-6170 ‰ fax (304) 258-8295 ‰ WWW.ussilica.com
US SILICA
Table of Contents
Table of Contents
PART II
INFORMATION NOT REQUIRED IN PROSPECTUS
| Item 13. | Other Expenses of Issuance and Distribution. |
The following table sets forth all costs and expenses, other than the underwriting discounts and commissions payable by us, in connection with the offer and sale of the securities being registered. All amounts shown are estimates except for the SEC registration fee and the Financial Industry Regulatory Authority, Inc., (“FINRA”), filing fee.
| SEC registration fee |
$ | 27,909 | ||
| FINRA filing fee |
24,853 | |||
| NYSE listing fee |
210,000 | |||
| Printing expenses |
400,000 | |||
| Legal fees and expenses |
2,500,000 | |||
| Accounting fees and expenses |
750,000 | |||
| Miscellaneous expenses |
65,000 | |||
|
|
|
|||
| Total expenses |
$ | 3,977,762 | ||
|
|
|
| Item 14. | Indemnification of Directors and Officers. |
Section 102(b)(7) of the General Corporation Law of the State of Delaware (the “DGCL”) allows a corporation to provide in its certificate of incorporation that a director of the corporation will not be personally liable to the corporation or its stockholders for monetary damages for breach of fiduciary duty as a director, except where the director breached the duty of loyalty, failed to act in good faith, engaged in intentional misconduct or knowingly violated a law, authorized the payment of a dividend or approved a stock repurchase in violation of Delaware corporate law or obtained an improper personal benefit. Our certificate of incorporation will provide for this limitation of liability.
Section 145 of the DGCL (“Section 145”) provides that a Delaware corporation may indemnify any person who was, is or is threatened to be made, party to any threatened, pending or completed action, suit or proceeding, whether civil, criminal, administrative or investigative (other than an action by or in the right of such corporation), by reason of the fact that such person is or was an officer, director, employee or agent of such corporation or is or was serving at the request of such corporation as a director, officer, employee or agent of another corporation or enterprise. The indemnity may include expenses (including attorneys’ fees), judgments, fines and amounts paid in settlement actually and reasonably incurred by such person in connection with such action, suit or proceeding, provided such person acted in good faith and in a manner he reasonably believed to be in or not opposed to the corporation’s best interests and, with respect to any criminal action or proceeding, had no reasonable cause to believe that his conduct was illegal. A Delaware corporation may indemnify any persons who are, were or are a party to any threatened, pending or completed action or suit by or in the right of the corporation by reason of the fact that such person is or was a director, officer, employee or agent of another corporation or enterprise. The indemnity may include expenses (including attorneys’ fees) actually and reasonably incurred by such person in connection with the defense or settlement of such action or suit, provided such person acted in good faith and in a manner he reasonably believed to be in or not opposed to the corporation’s best interests, provided that no indemnification is permitted without judicial approval if the officer, director, employee or agent is adjudged to be liable to the corporation. Where an officer or director is successful on the merits or otherwise in the defense of any action referred to above, the corporation must indemnify him against the expenses which such officer or director has actually and reasonably incurred.
Section 145 further authorizes a corporation to purchase and maintain insurance on behalf of any person who is or was a director, officer, employee or agent of the corporation or is or was serving at the request of the
II-1
Table of Contents
corporation as a director, officer, employee or agent of another corporation or enterprise, against any liability asserted against him and incurred by him in any such capacity, or arising out of his status as such, whether or not the corporation would otherwise have the power to indemnify him under Section 145.
Our bylaws will provide that we will indemnify our directors and officers to the fullest extent authorized by the DGCL and must also pay expenses incurred in defending any such proceeding in advance of its final disposition upon delivery of an undertaking, by or on behalf of an indemnified person, to repay all amounts so advanced if it should be determined ultimately that such person is not entitled to be indemnified under this section or otherwise.
We intend to enter into indemnification agreements with each of our executive officers and directors. The indemnification agreements will provide the executive officers and directors with contractual rights to indemnification, expense advancement and reimbursement, to the fullest extent permitted under the DGCL. We also intend to enter into an indemnification priority agreement with Golden Gate Private Equity, Inc. to clarify the priority of advancement of expenses and indemnification obligations among us, our subsidiaries and any of our directors appointed by Golden Gate Private Equity, Inc. or its affiliates and other related matters.
The indemnification rights set forth above shall not be exclusive of any other right which an indemnified person may have or hereafter acquire under any statute, provision of our certificate of incorporation or bylaws, agreement, vote of stockholders or disinterested directors or otherwise.
We will maintain standard policies of insurance that provide coverage (1) to our directors and officers against loss arising from claims made by reason of breach of duty or other wrongful act and (2) to us with respect to indemnification payments that we may make to such directors and officers. The proposed form of Underwriting Agreement to be filed as Exhibit 1.1 to this Registration Statement provides for indemnification of our directors and officers by the underwriters party thereto against certain liabilities.
| Item 15. | Recent Sales of Unregistered Securities. |
Set forth below is information regarding securities sold by us within the past three years that were not registered under the Securities Act. Also included is the consideration, if any, received by us for such securities and information relating to the section of the Securities Act, or rule of the SEC, under which exemption from registration was claimed.
On November 25, 2008, we issued 1,000 shares of our common stock to our parent company and sole stockholder, GGC USS Holdings, LLC, for an aggregate purchase price of $10.00. The shares were issued in reliance on Section 4(2) of the Securities Act as the sale of the securities did not involve a public offering. Appropriate legends were affixed to the securities issued in this transaction. On July 8, 2011, our board of directors approved a 50,000 to 1 stock split.
| Item 16. | Exhibits and Financial Statement Schedules. |
| (a) | Exhibits |
The exhibit index attached hereto is incorporated herein by reference.
| (b) | Financial Statement Schedules |
No financial statement schedules are provided because the information called for is not applicable or is shown in the financial statements or notes.
| Item 17. | Undertakings. |
The undersigned registrant hereby undertakes to provide to the underwriter at the closing specified in the underwriting agreement certificates in such denominations and registered in such names as required by the underwriter to permit prompt delivery to each purchaser.
II-2
Table of Contents
Insofar as indemnification for liabilities arising under the Securities Act may be permitted to directors, officers and controlling persons of the registrant pursuant to the provisions referenced in Item 14 of this Registration Statement, or otherwise, the registrant has been advised that in the opinion of the SEC such indemnification is against public policy as expressed in the Securities Act and is, therefore, unenforceable. In the event that a claim for indemnification against such liabilities (other than the payment by the registrant of expenses incurred or paid by a director, officer or controlling person of the registrant in the successful defense of any action, suit or proceeding) is asserted by such director, officer or controlling person in connection with the securities being registered hereunder, the registrant will, unless in the opinion of its counsel the matter has been settled by controlling precedent, submit to a court of appropriate jurisdiction the question whether such indemnification by it is against public policy as expressed in the Securities Act and will be governed by the final adjudication of such issue.
The undersigned registrant hereby undertakes that:
| (1) | For purposes of determining any liability under the Securities Act, the information omitted from the form of prospectus filed as part of this Registration Statement in reliance upon Rule 430A and contained in the form of prospectus filed by the registrant pursuant to Rule 424(b)(1) or (4) or 497(h) under the Securities Act shall be deemed to be part of this Registration Statement as of the time it was declared effective; and |
| (2) | For the purpose of determining any liability under the Securities Act, each post-effective amendment that contains a form of prospectus shall be deemed to be a new registration statement relating to the securities offered therein, and the offering of such securities at the time shall be deemed to be the initial bona fide offering thereof. |
II-3
Table of Contents
SIGNATURES
Pursuant to the requirements of the Securities Act of 1933, the registrant has duly caused this Registration Statement to be signed on its behalf by the undersigned, thereunto duly authorized, in the City of Frederick, State of Maryland, on January 17, 2012.
| U.S. Silica Holdings, Inc. | ||
| By: |
/s/ Bryan A. Shinn | |
| Name: Bryan A. Shinn | ||
| Title: President and Chief Executive Officer | ||
* * *
Pursuant to the requirements of the Securities Act of 1933, this Registration Statement has been signed by the following persons in the capacities indicated on January 17, 2012.
| Signature |
Title | |
| /s/ Bryan A. Shinn Bryan A. Shinn |
President, Chief Executive Officer and Director (Principal Executive Officer) | |
| /s/ William A. White William A. White |
Chief Financial Officer and Vice President of Finance (Principal Financial and Accounting Officer) | |
| * Rajeev Amara |
Director | |
| * Prescott H. Ashe |
Director | |
| * Charles Shaver |
Chairman of the Board | |
| * Brian Slobodow |
Chief Administrative Officer and Director | |
| *By: | /s/ William A. White | |
| William A. White, as Attorney-in-Fact |
II-4
Table of Contents
EXHIBIT INDEX
| Exhibit Number |
Description | |
| 1.1‡‡ | Form of Underwriting Agreement. | |
| 2.1† | Acquisition Agreement, dated as of June 27, 2008, by and among Harbinger Capital Partners Master Fund I, Ltd., Hourglass Acquisition I, LLC, Preferred Unlimited Inc. and Preferred Rocks USS, Inc. | |
| 2.2† | Amendment One to Acquisition Agreement, dated as of November 4, 2008. | |
| 2.3† | Amendment Two to Acquisition Agreement, dated as of November 10, 2008. | |
| 3.1‡‡ | Form of Amended and Restated Certificate of Incorporation of U.S. Silica Holdings, Inc., to be effective upon completion of this offering. | |
| 3.2‡‡ | Form of Second Amended and Restated Bylaws of U.S. Silica Holdings, Inc., to be effective upon completion of this offering. | |
| 4.1†† | Specimen Common Stock Certificate. | |
| 4.2‡‡ | Form of Registration Rights Agreement, by and between GGC USS Holdings, LLC and U.S. Silica Holdings, Inc. | |
| 5.1‡ | Opinion of Kirkland & Ellis LLP. | |
| 10.1† | ABL Loan and Security Agreement, dated as of August 9, 2007, by and among Wachovia Bank, National Association in its capacity as agent for the Lenders, the parties to the agreement as lenders, U.S. Silica Company, Hourglass Holdings, LLC, the subsidiaries of U.S. Silica Company from time to time party to the agreement as borrowers and certain subsidiaries of USS Holdings, Inc. from time to time party to the agreement as Guarantors. | |
| 10.2† | Amendment No. 1 and Consent to Loan and Security Agreement, dated as of November 25, 2008. | |
| 10.3† | Amendment No. 2 to Loan and Security Agreement, dated as of May 7, 2010. | |
| 10.4† | Amendment No. 3 to Loan and Security Agreement, dated as of June 8, 2011. | |
| 10.5† | Second Amended and Restated Credit Agreement, dated as of June 8, 2011, by and among USS Holdings, Inc. as Parent, U.S. Silica Company as Company, the Subsidiary Guarantors listed therein as Subsidiary Guarantors, the Lenders listed therein as Lenders and BNP Paribas as Sole Lead Arranger, Sole Book Runner and Administrative Agent. | |
| 10.6† | ABL/Term Loan Intercreditor Agreement, dated as of November 25, 2008, by and among GGC USS Acquisition Sub, Inc., GCC USS Borrower Co., Inc., U.S. Silica Company, USS Holdings, Inc., BMAC Holdings, Inc., Better Minerals & Aggregates Company, BMAC Services Co., Inc., The Fulton Land and Timber Company, George F. Pettinos, LLC, Pennsylvania Glass Sand Corporation and Ottawa Silica Company as Grantors, Wachovia Bank, National Association as the ABL Agent and BNP Paribas as Term Loan Agent. | |
| 10.7† | Reaffirmation of ABL/Term Loan Intercreditor Agreement, dated as of June 8, 2011. | |
| 10.8† | Amended and Restated Note Purchase Agreement, dated as of May 7, 2010, by and among USS Holdings, Inc., U.S. Silica Company, the subsidiary guarantors listed therein and GGC Finance Partnership, L.P. | |
| 10.9† | Subordination Agreement, dated as of November 28, 2008, by and among Wachovia Bank, National Association, BNP Paribas and GGC Finance Partnership, L.P. | |
| 10.10† | Amendment No. 1 to Subordination Agreement, dated as of May 7, 2010. | |
| 10.11+† | Employment Agreement, dated as of September 25, 2009, by and between U.S. Silica Company and Bryan A. Shinn. | |
II-5
Table of Contents
| Exhibit Number |
Description | |
| 10.12+† | Consulting Agreement, dated as of April 1, 2011, by and between U.S. Silica Company and John A. Ulizio. | |
| 10.13+† | Employment Agreement, dated as of June 1, 2011, by and between U.S. Silica Company and Brian Slobodow. | |
| 10.14+‡ | 2011 Incentive Compensation Plan. | |
| 10.15+‡ | Form of Incentive Stock Option Agreement. | |
| 10.16+‡ | Form of Restricted Stock Agreement. | |
| 10.17+‡ | Form of Nonqualified Stock Option Agreement. | |
| 10.18+‡ | Form of Stock Appreciation Rights Agreement. | |
| 10.19+‡ | Form of Restricted Stock Unit Agreement. | |
| 10.20‡‡ | Form of Indemnification Agreement. | |
| 10.21‡‡ | Form of Letter Agreement, by and between Golden Gate Private Equity, Inc. and U.S. Silica Holdings, Inc. | |
| 10.22‡‡ | Form of Director Designation Agreement, by and between U.S. Silica Holdings, Inc. and GGC USS Holdings, LLC. | |
| 10.23+ | Employment Agreement, dated as of December 21, 2011, by and between U.S. Silica Company and William A. White. | |
| 10.24‡‡ | Letter Agreement, dated as of December 27, 2011, by and between William J. Kacal and U.S. Silica Holdings, Inc. | |
| 21.1† | List of subsidiaries of U.S. Silica Holdings, Inc. | |
| 23.1 | Consent of Grant Thornton LLP, independent registered public accounting firm. | |
| 23.2† | Consent of John T. Boyd Company, mining consultants. | |
| 23.3‡ | Consent of Kirkland & Ellis LLP (included in Exhibit 5.1). | |
| 24.1† | Powers of Attorney (included on signature page). | |
| 99.1† | Consent of The Freedonia Group, Inc. | |
| 99.2‡‡ | Consent of the Director Designee. | |
| + | Indicates a management contract or compensatory plan or arrangement. |
| † | Previously filed on July 18, 2011 with the Registration Statement on Form S-1. |
| ‡ | Previously filed on August 29, 2011 with Amendment No. 1 to the Registration Statement on Form S-1. |
| †† | Previously filed on December 7, 2011 with Amendment No. 4 to the Registration Statement on Form S-1. |
| ‡‡ | Previously filed on December 29, 2011 with Amendment No. 5 to the Registration Statement on Form S-1. |
II-6