Attached files
| file | filename |
|---|---|
| EX-99.1 - RAYMOND JAMES FINANCIAL INC | v245286_ex99-1.htm |
| 8-K - RAYMOND JAMES FINANCIAL INC | v245286_8k.htm |
RAYMOND JAMES + MORGAN KEEGAN ACQUISITION SUMMARY January 12, 2012 1 © 2012 Raymond James & Associates, Inc., member New York Stock Exchange/SIPC © 2012 Raymond James Financial Services, Inc., member FINRA/SIPC Raymond James® is a registered trademark of Raymond James Financial, Inc. Paul Reilly Raymond James Financial CEO Jeff Julien Raymond James Financial CFO
SAFE HARBOR DISCLOSURE This presentation contains forward looking statements within the meaning of the Private Securities Litigation Reform Act. You are cautioned not to place undue reliance on forward - looking statements that speak only as of the date on which they are made. Forward - looking statements reflect management’s current estimates, projections, expectations and beliefs, and are subject to risks and uncertainties outside of our control that may cause actual results to differ materially from what is indicated in those forward - looking statements. We assume no duty to update the forward - looking statements. For a discussion of the risks that may affect the future results of Raymond James, please see the risk factors in our annual report on Form 10 - K for the fiscal year ended September 30, 2011, filed with the U.S. Securities and Exchange Commission and available on raymondjames.com and sec.gov. In addition to those factors, the following factors, among others, could cause actual results to differ materially from forward - looking or historical performance: the possibility that regulatory and other approvals and conditions to the transaction are not received or satisfied on a timely basis or at all; the possibility that modifications to the terms of the transaction may be required to obtain or satisfy such approvals or conditions; changes in the anticipated timing for closing the transaction; difficulty integrating Raymond James’ and Morgan Keegan’s businesses or realizing the projected benefits of the transaction; the inability to sustain revenue and earnings growth; changes in the capital markets; and diversion of management time on transaction related issues. Annualized, pro forma, projected and estimated numbers used in this presentation are used only for illustrative purposes and are not forecasts and may not reflect actual results. 2
3 STRATEGIC RATIONALE This transaction represents a combination of two powerhouse regional firms with consistent performance and shared values. • We believe the combination creates enhanced earnings power. • Strong cultural fit: both companies have a conservative, client - centric focus. • The combined firm creates one of the largest private client franchises in North America with more than 6,000 financial advisors. • Combining two outstanding Fixed Income franchises with complementary products, services and client relationships: • Top 10 combined ranking in Public Finance • Increased stature in the middle market client segment • Raymond James’ Capital Markets franchise will be enhanced by top talent in key investment banking sectors and research excellence.
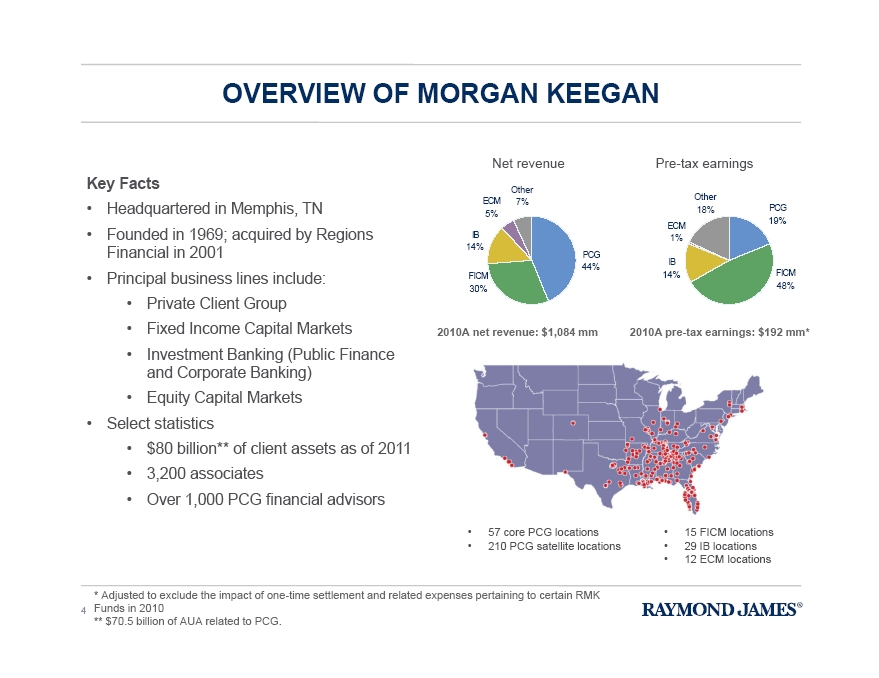
Key Facts • Headquartered in Memphis, TN • Founded in 1969; acquired by Regions Financial in 2001 • Principal business lines include: • Private Client Group • Fixed Income Capital Markets • Investment Banking (Public Finance and Corporate Banking) • Equity Capital Markets • Select statistics • $80 billion** of client assets as of 2011 • 3,200 associates • Over 1,000 PCG financial advisors FICM 48% PCG 19% Other 18% IB 14% ECM 1% FICM 30% PCG 44% Other 7% IB 14% ECM 5% 4 OVERVIEW OF MORGAN KEEGAN 2010A net revenue: $1,084 mm 2010A pre - tax earnings: $192 mm * Net revenue Pre - tax earnings * Adjusted to exclude the impact of one - time settlement and related expenses pertaining to certain RMK Funds in 2010 ** $70.5 billion of AUA related to PCG. • 57 core PCG locations • 210 PCG satellite locations • 15 FICM locations • 29 IB locations • 12 ECM locations
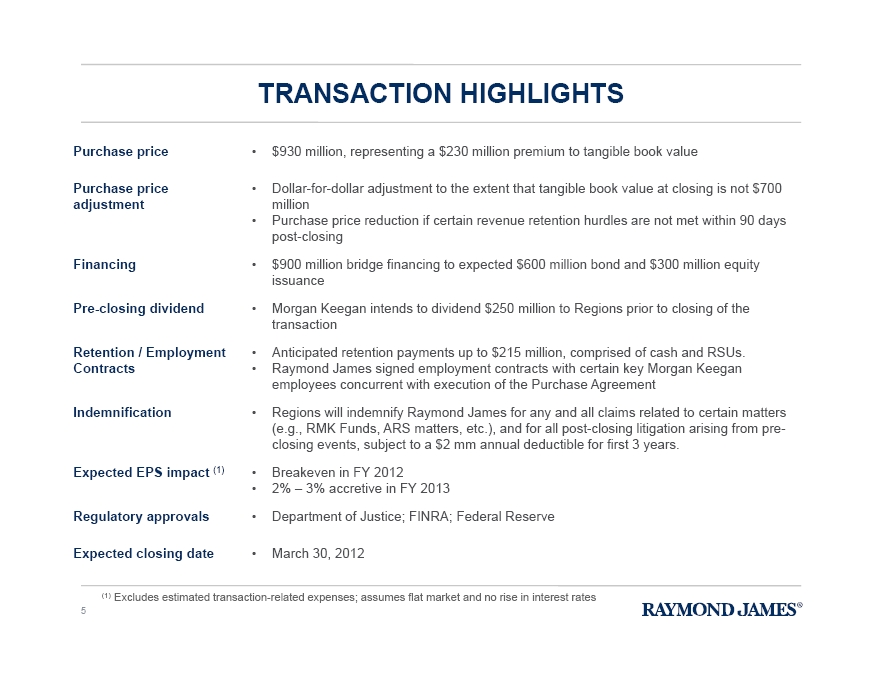
5 TRANSACTION HIGHLIGHTS Purchase price • $930 million, representing a $230 million premium to tangible book value Purchase price adjustment • Dollar - for - dollar adjustment to the extent that tangible book value at closing is not $700 million • Purchase price reduction if certain revenue retention hurdles are not met within 90 days post - closing Financing • $900 million bridge financing to expected $600 million bond and $300 million equity issuance Pre - closing dividend • Morgan Keegan intends to dividend $250 million to Regions prior to closing of the transaction Retention / Employment Contracts • Anticipated retention payments up to $215 million, comprised of cash and RSUs. • Raymond James signed employment contracts with certain key Morgan Keegan employees concurrent with execution of the Purchase Agreement Indemnification • Regions will indemnify Raymond James for any and all claims related to certain matters (e.g., RMK Funds, ARS matters, etc. ), and for all post - closing litigation arising from pre - closing events, subject to a $2 mm annual deductible for first 3 years. Expected EPS impact (1) • Breakeven in FY 2012 • 2% – 3% accretive in FY 2013 Regulatory approvals • Department of Justice; FINRA; Federal Reserve Expected closing date • March 30 , 2012 (1) Excludes estimated transaction - related expenses; assumes flat market and no rise in interest rates
6 STRATEGIC RATIONALE: STRONG CULTURAL FIT Both Raymond James and Morgan Keegan Share Core Values : • Conservative, long - term focus • Client centric • Financial advisor based • Open architecture with broad product offerings • Cost - conscious culture • Above - industry average associate tenures
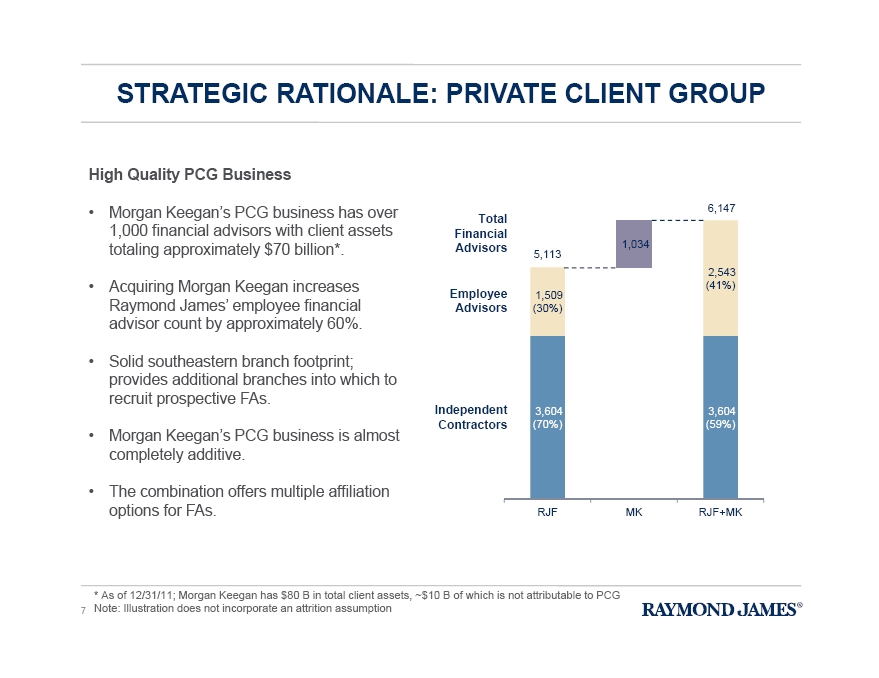
7 STRATEGIC RATIONALE: PRIVATE CLIENT GROUP High Quality PCG Business • Morgan Keegan’s PCG business has over 1,000 financial advisors with client assets totaling approximately $70 billion*. • Acquiring Morgan Keegan increases Raymond James’ employee financial advisor count by approximately 60%. • Solid southeastern branch footprint; provides additional branches into which to recruit prospective FAs. • Morgan Keegan’s PCG business is almost completely additive. • The combination offers multiple affiliation options for FAs. Independent Contractors Employee Advisors Total Financial Advisors * As of 12/31/11; Morgan Keegan has $80 B in total client assets, ~$10 B of which is not attributable to PCG Note: Illustration does not incorporate an attrition assumption 3,604 (70%) 3,604 (59%) 1,509 (30%) 2,543 (41%) 1,034 RJF MK RJF+MK 5,113 6,147
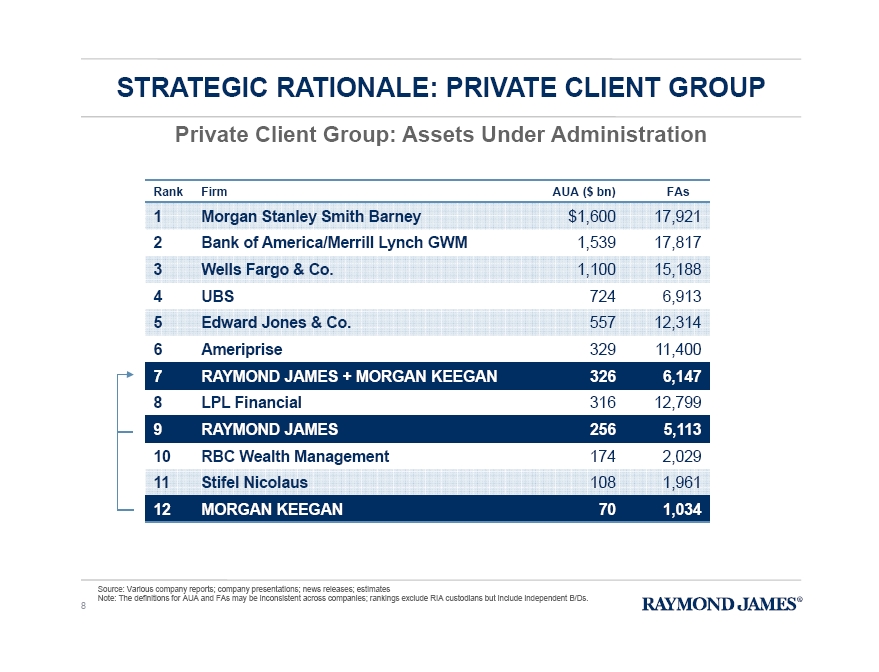
Private Client Group: Assets Under Administration 8 STRATEGIC RATIONALE: PRIVATE CLIENT GROUP Rank Firm AUA ($ bn) FAs 1 Morgan Stanley Smith Barney $1,600 17,921 2 Bank of America/Merrill Lynch GWM 1,539 17,817 3 Wells Fargo & Co. 1,100 15,188 4 UBS 724 6,913 5 Edward Jones & Co. 557 12,314 6 Ameriprise 329 11,400 7 RAYMOND JAMES + MORGAN KEEGAN 326 6,147 8 LPL Financial 316 12,799 9 RAYMOND JAMES 256 5,113 10 RBC Wealth Management 174 2,029 11 Stifel Nicolaus 108 1,961 12 MORGAN KEEGAN 70 1,034 Source: Various company reports; company presentations; news releases; estimates Note: The definitions for AUA and FAs may be inconsistent across companies; rankings exclude RIA custodians but include indep end ent B/Ds.
9 STRATEGIC RATIONALE: FIXED INCOME Premier Complementary Fixed Income Franchises The combined firm is expected to: • Be a leading fixed income capital markets franchise in Municipal and Taxable Sales & Trading with a focus on middle market depository clients and other institutional investors. • Be a leader in sales, trading and portfolio analysis of mortgage - backed product, agencies, governmental securities, and corporates. • Leverage the eFolio™ platform, a proprietary online portfolio management system, to enhance its product offering and strengthen client relationships. • Bring improved margins and sustainable profitability, even under varying market conditions. *As ranked by issuance value; Source: Thomson Reuters 1/1/10 – 1/10/12
10 STRATEGIC RATIONALE: FIXED INCOME Premier Complementary Fixed Income Franchises In Public Finance: • Morgan Keegan was the 9 th ranked* municipal bond underwriter for the two years ended 2011, and 5 th ranked in the southeast. • The combined pro forma league table ranking would be 8 th (ranked by issuance value) and 1 st (ranked by number of issues). • Morgan Keegan’s business represents almost no overlap with Raymond James’ existing business. *As ranked by issuance value; Source: Thomson Reuters 1/1/10 – 1/10/12
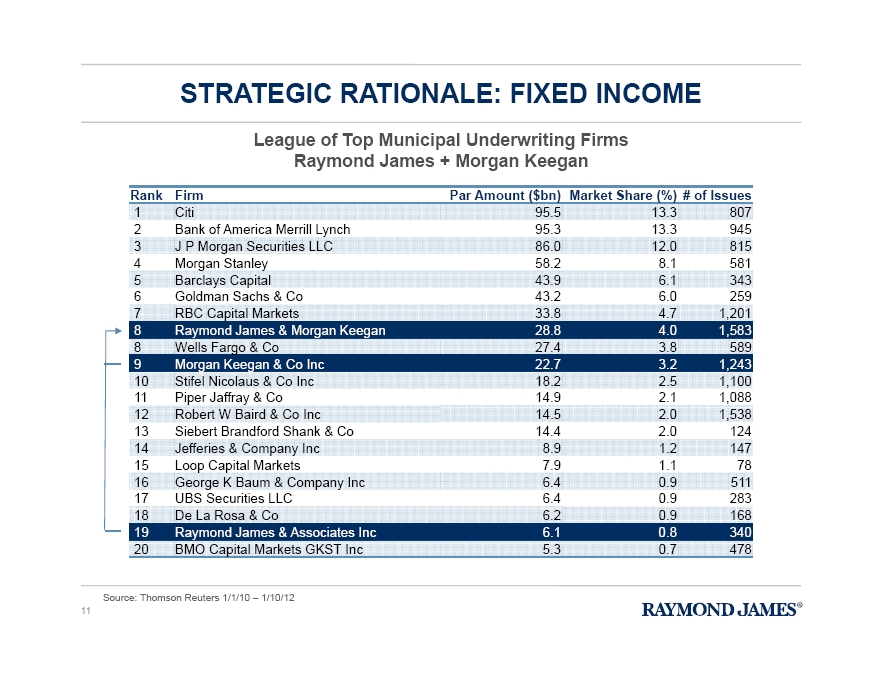
11 STRATEGIC RATIONALE: FIXED INCOME League of Top Municipal Underwriting Firms Raymond James + Morgan Keegan Source: Thomson Reuters 1/1/10 – 1/10/12 Rank Firm Par Amount ($ bn ) Market Share (%) # of Issues 1 Citi 95.5 13.3 807 2 Bank of America Merrill Lynch 95.3 13.3 945 3 J P Morgan Securities LLC 86.0 12.0 815 4 Morgan Stanley 58.2 8.1 581 5 Barclays Capital 43.9 6.1 343 6 Goldman Sachs & Co 43.2 6.0 259 7 RBC Capital Markets 33.8 4.7 1,201 8 Raymond James & Morgan Keegan 28.8 4.0 1,583 8 Wells Fargo & Co 27.4 3.8 589 9 Morgan Keegan & Co Inc 22.7 3.2 1,243 10 Stifel Nicolaus & Co Inc 18.2 2.5 1,100 11 Piper Jaffray & Co 14.9 2.1 1,088 12 Robert W Baird & Co Inc 14.5 2.0 1,538 13 Siebert Brandford Shank & Co 14.4 2.0 124 14 Jefferies & Company Inc 8.9 1.2 147 15 Loop Capital Markets 7.9 1.1 78 16 George K Baum & Company Inc 6.4 0.9 511 17 UBS Securities LLC 6.4 0.9 283 18 De La Rosa & Co 6.2 0.9 168 19 Raymond James & Associates Inc 6.1 0.8 340 20 BMO Capital Markets GKST Inc 5.3 0.7 478
12 STRATEGIC RATIONALE: ECM Strong Investment Banking and Equity Research Franchise • Both firms possess award - winning research departments, which focus on small and mid - cap companies. • Joint underwriting distribution capability is strengthened by a larger combined institutional and PCG franchise. • The combined investment banking unit will have deepened capabilities in multiple industry sectors, including: Real Estate, Energy, Business Services, Transportation & Industrial Services, Financial Services, Healthcare, Technology, Communications, Consumer, Industrial Growth, Homeland Security, among others. • The larger fixed income and commercial banking platform will enable more fixed income financing for equity investment banking clients.
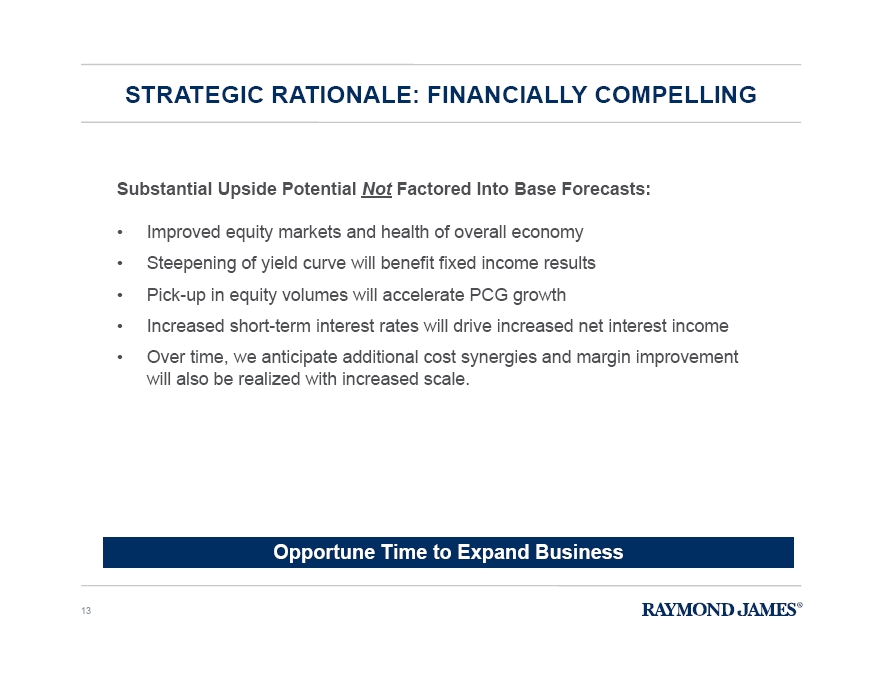
13 STRATEGIC RATIONALE: FINANCIALLY COMPELLING Substantial Upside Potential Not Factored Into Base Forecasts: • Improved equity markets and health of overall economy • Steepening of yield curve will benefit fixed income results • Pick - up in equity volumes will accelerate PCG growth • Increased short - term interest rates will drive increased net interest income • Over time, we anticipate additional cost synergies and margin improvement will also be realized with increased scale. Opportune Time to Expand Business
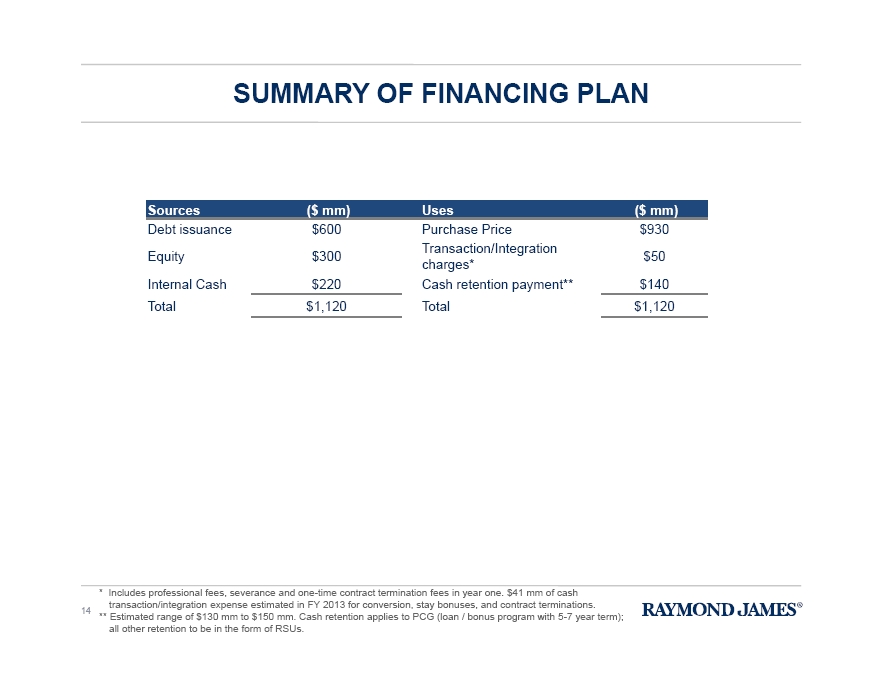
14 SUMMARY OF FINANCING PLAN Sources ($ mm) Uses ($ mm) Debt issuance $600 Purchase Price $ 930 Equity $300 Transaction/Integration charges* $50 Internal Cash $ 220 Cash retention payment** $140 Total $ 1,120 Total $ 1,120 * Includes professional fees, severance and one - time contract termination fees in year one. $41 mm of cash transaction/integration expense estimated in FY 2013 for conversion, stay bonuses, and contract terminations. ** Estimated range of $130 mm to $150 mm. Cash retention applies to PCG (loan / bonus program with 5 - 7 year term); all other retention to be in the form of RSUs.
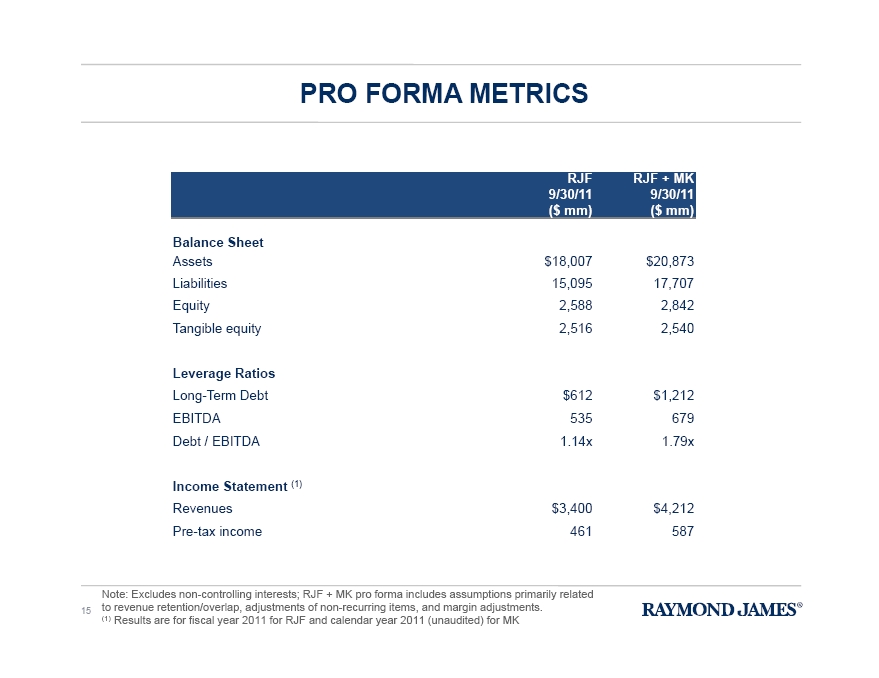
PRO FORMA METRICS 15 RJF 9/30/11 ($ mm) RJF + MK 9/30/11 ($ mm) Balance Sheet Assets $18,007 $20,873 Liabilities 15,095 17,707 Equity 2,588 2,842 Tangible equity 2,516 2,540 Leverage Ratios Long - Term Debt $612 $1,212 EBITDA 535 679 Debt / EBITDA 1.14x 1.79x Income Statement ( 1 ) Revenues $3,400 $4,212 Pre - tax income 461 587 Note: Excludes non - controlling interests; RJF + MK pro forma includes assumptions primarily related to revenue retention/overlap, adjustments of non - recurring items, and margin adjustments. (1) Results are for fiscal year 2011 for RJF and calendar year 2011 (unaudited) for MK
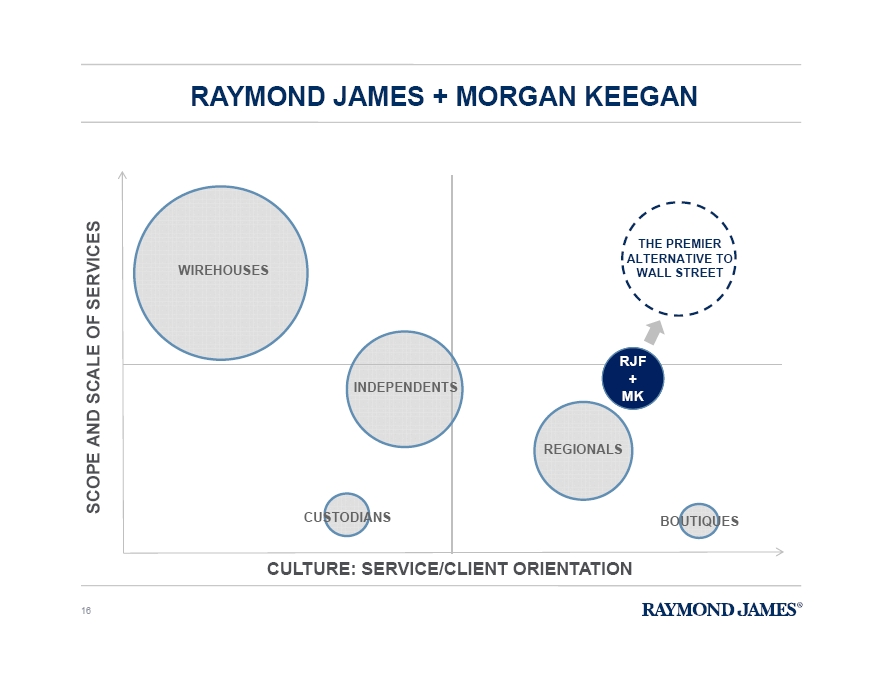
RAYMOND JAMES + MORGAN KEEGAN 16 SCOPE AND SCALE OF SERVICES CULTURE: SERVICE/CLIENT ORIENTATION WIREHOUSES BOUTIQUES REGIONALS CUSTODIANS THE PREMIER ALTERNATIVE TO WALL STREET RJF + MK INDEPENDENTS

RAYMOND JAMES + MORGAN KEEGAN ACQUISITION SUMMARY January 12, 2012 17 © 2012 Raymond James & Associates, Inc., member New York Stock Exchange/SIPC © 2012 Raymond James Financial Services, Inc., member FINRA/SIPC Raymond James® is a registered trademark of Raymond James Financial, Inc. Paul Reilly Raymond James Financial CEO Jeff Julien Raymond James Financial CFO