Attached files
| file | filename |
|---|---|
| 8-K - JAN 2012 ICR PRESENTATION - JONES SODA CO | a8-kjan2012icrconference.htm |
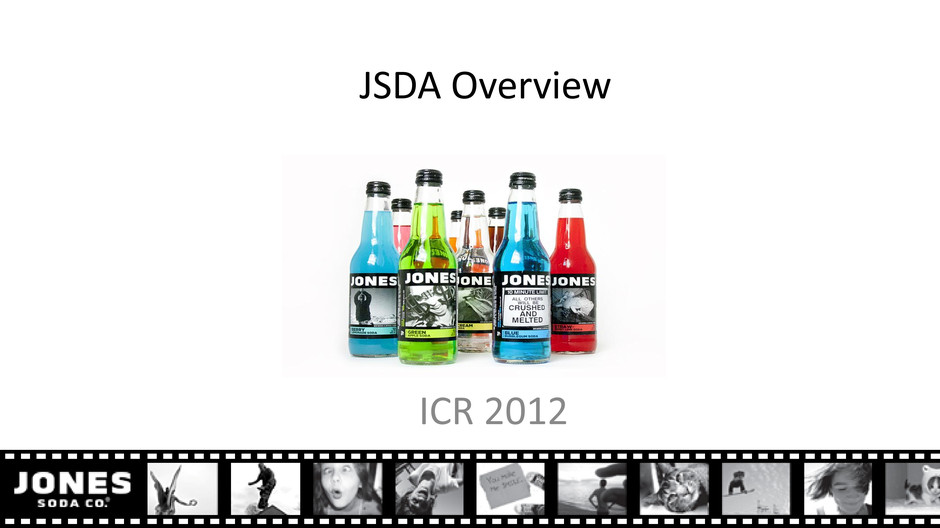
JSDA Overview ICR 2012
Safe Harbor Disclosure Certain statements in this presentation are "forward-looking statements" within the meaning of the Private Securities Litigation Reform Act of 1995. Forward-looking statements include all passages containing words such as "aims," "anticipates," "becoming," "believes," "continue," "estimates," "expects," "future," "intends," "plans," "predicts," "projects," "targets," or "upcoming". The forward-looking statements in this presentation include, among other things, statements regarding Jones Soda's expected 2011 fourth quarter results and future growth and operating results. Forward-looking statements also include any other passages that are primarily relevant to expected future events or that can only be evaluated by events that will occur in the future. Forward-looking statements are based on the opinions and estimates of management at the time the statements are made and are subject to certain risks and uncertainties that could cause actual results to differ materially from those anticipated or implied in the forward-looking statements. Factors that could affect Jones Soda's actual results include, among others, its ability to maintain compliance with the continued listing requirements of The Nasdaq Capital Market, its ability to successfully execute on its operating plan; its ability to secure additional financing; its ability to use the net proceeds from any financings to improve its financial condition or market value; its ability to increase demand and points of distribution for its products or to successfully innovate new products and product extensions; its ability to establish distribution arrangements with distributors, retailers or national retail accounts; its ability to maintain relationships with co-packers; its ability to maintain a consistent and cost-effective supply of raw materials; its ability to receive returns on its trade spending and slotting fee expenditures; its ability to maintain brand image and product quality; its ability to protect its intellectual property; the impact of current and future litigation; its ability to develop new products to satisfy customer preferences; and the impact of intense competition from other beverage suppliers. More information about factors that potentially could affect Jones Soda's financial results is included in Jones Soda's most recent annual report on Form 10-K for the year ended December 31, 2010 and in the Company’s quarterly reports on Form 10-Q filed with the Securities and Exchange Commission in 2011. Readers are cautioned not to place undue reliance upon these forward-looking statements that speak only as to the date of this release. Except as required by law, Jones Soda undertakes no obligation to update any forward-looking or other statements in this presentation, whether as a result of new information, future events or otherwise.
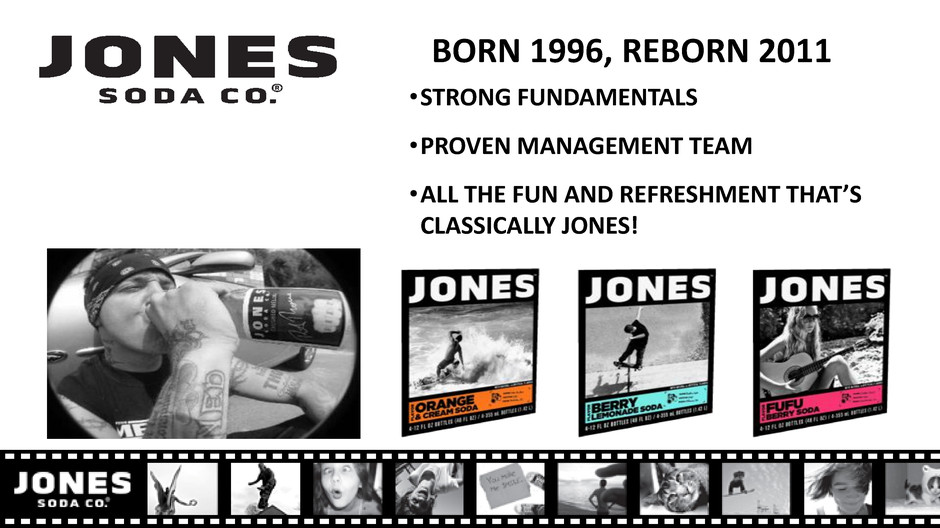
•STRONG FUNDAMENTALS •PROVEN MANAGEMENT TEAM •ALL THE FUN AND REFRESHMENT THAT’S CLASSICALLY JONES! BORN 1996, REBORN 2011
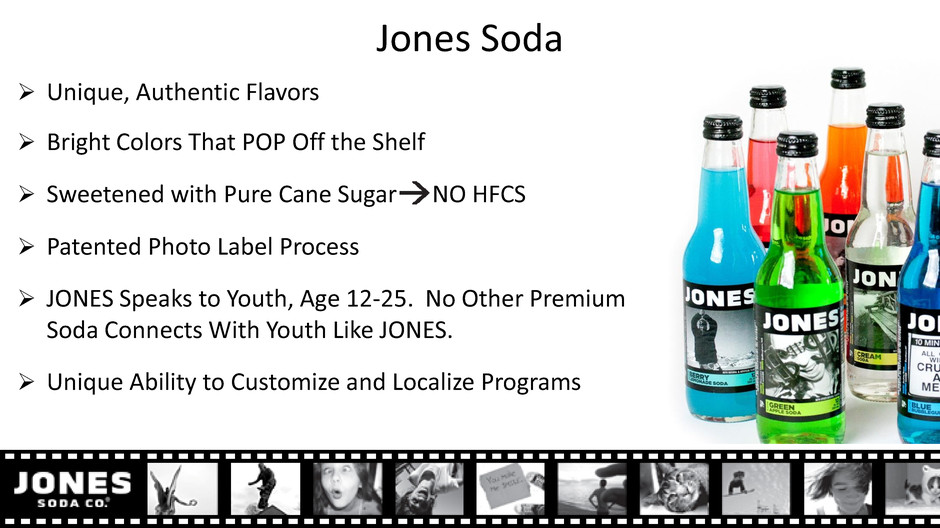
Jones Soda Unique, Authentic Flavors Bright Colors That POP Off the Shelf Sweetened with Pure Cane Sugar NO HFCS Patented Photo Label Process JONES Speaks to Youth, Age 12-25. No Other Premium Soda Connects With Youth Like JONES. Unique Ability to Customize and Localize Programs

2011 Update Reversed three-year revenue slide Overall Q4 revenue increased 9% to $3.4 million* Drove North American core brand’s revenue increases of 12% FY and 16 % in Q4* Built distribution network to cover multiple channels of trade and covering the great majority of the US population base Grew distribution in US Grocery stores by 51% based on US covered counties Created new price package plan for all-important Convenience and Gas (C&G) channel *Preliminary results
1. Growing our core business - 12 oz Cane Soda 2. Participating at a high-level in 2 to 3 other product lines that are in high- growth categories 3. Building a great management team 4. Establish stable financials with a profit plan designed to increase long- term sustained shareholder value Turnaround Strategic Imperatives From The Beginning

1035 1425 2148 0 500 1000 1500 2000 2500 Apr 2010 Dec 2010 Dec 2011 Counties US Distributor Coverage Improvement Turnaround Imperative #1 Grow Core Soda • On quarterly calls and investor presentations JONES has used “counties of coverage” as our metric for US distribution growth • Counties with coverage have grown rapidly since April 2010 regime change

West Virginia Washington Oregon California Nevada Idaho Montana Wyoming Utah Colorado Kansas Oklahoma Missouri Arkansas Louisiana Mississippi Alabama Georgia Florida Tennessee Kentucky Virginia MD DE North Carolina South Carolina Texas New Mexico Arizona Nebraska Iowa South Dakota North Dakota Minnesota Wisconsin Michigan Illinois Indiana Ohio Pennsylvania NJ New York Maine MA CT VT NH RI Alaska Hawaii 0-25% Distributor Coverage 25-50% Distributor Coverage 50-75% Distributor Coverage 75-100% Distributor Coverage US Distributor Coverage as of April 2010 Turnaround Imperative #1 Grow Core Soda
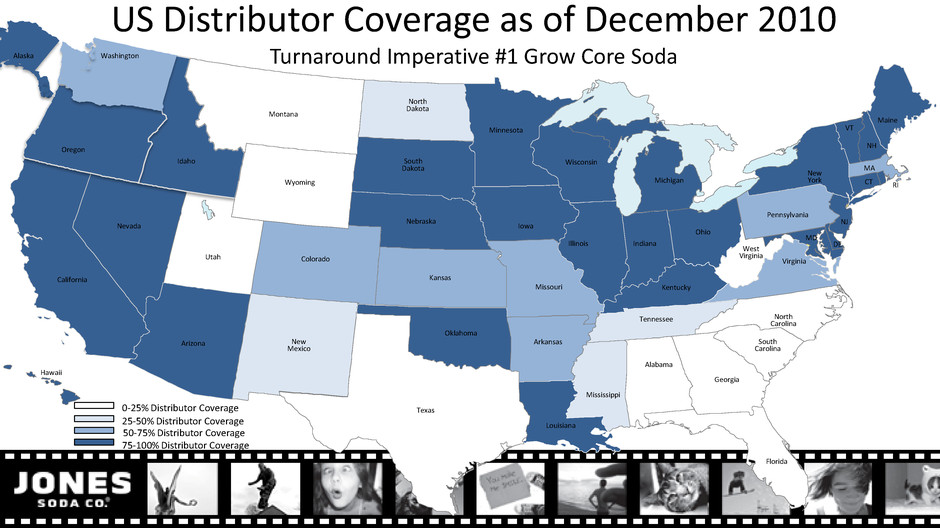
West Virginia Washington Oregon California Nevada Idaho Montana Wyoming Utah Colorado Kansas Oklahoma Missouri Arkansas Louisiana Mississippi Alabama Georgia Florida Tennessee Kentucky Virginia MD DE North Carolina South Carolina Texas New Mexico Arizona Nebraska Iowa South Dakota North Dakota Minnesota Wisconsin Michigan Illinois Indiana Ohio Pennsylvania NJ New York Maine MA CT VT NH RI Alaska Hawaii 0-25% Distributor Coverage 25-50% Distributor Coverage 50-75% Distributor Coverage 75-100% Distributor Coverage US Distributor Coverage as of December 2010 Turnaround Imperative #1 Grow Core Soda

West Virginia Washington Oregon California Nevada Idaho Montana Wyoming Utah Colorado Kansas Oklahoma Missouri Arkansas Louisiana Mississippi Alabama Georgia Florida Tennessee Kentucky Virginia MD DE North Carolina South Carolina Texas New Mexico Arizona Nebraska Iowa South Dakota North Dakota Minnesota Wisconsin Michigan Illinois Indiana Ohio Pennsylvania NJ New York Maine MA CT VT NH RI Alaska Hawaii 0-25% Distributor Coverage 25-50% Distributor Coverage 50-75% Distributor Coverage 75-100% Distributor Coverage US Distributor Coverage as of December 2011 Turnaround Imperative #1 Grow Core Soda
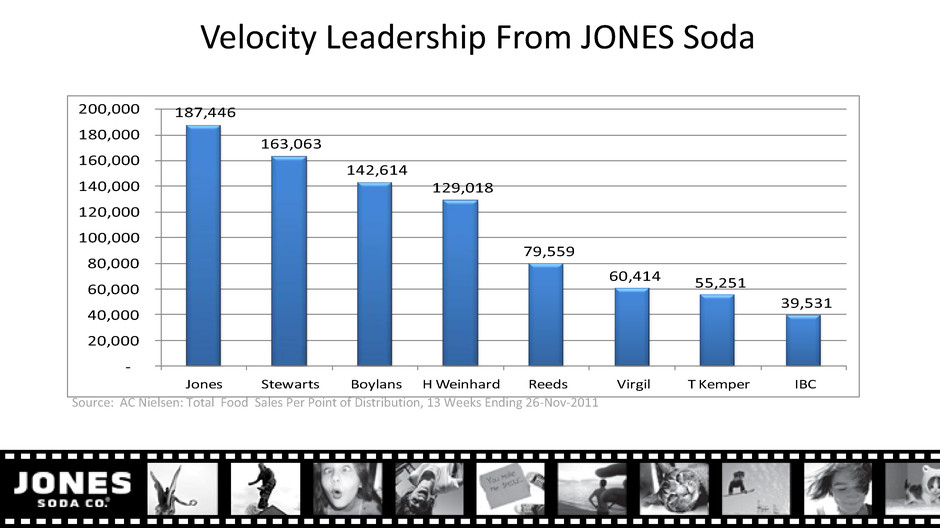
Source: AC Nielsen: Total Food Sales Per Point of Distribution, 13 Weeks Ending 26-Nov-2011 187,446 163,063 142,614 129,018 79,559 60,414 55,251 39,531 - 20,000 40,000 60,000 80,000 100,000 120,000 140,000 160,000 180,000 200,000 Jones Stewarts Boylans H Weinhard Reeds Virgil T Kemper IBC Velocity Leadership From JONES Soda
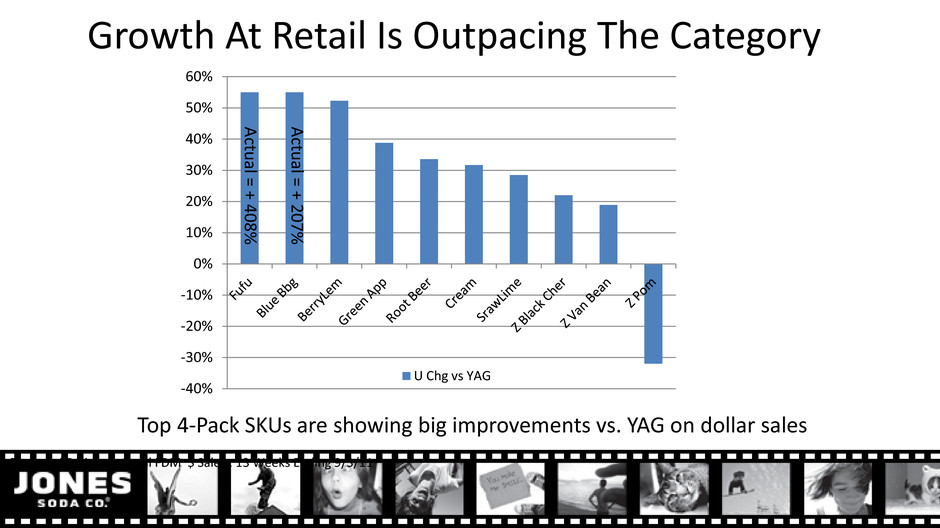
Source: AC Nielsen: Total FDM $ Sales , 13 Weeks Ending 9/3/11 Top 4-Pack SKUs are showing big improvements vs. YAG on dollar sales Growth At Retail Is Outpacing The Category -40% -30% -20% -10% 0% 10% 20% 30% 40% 50% 60% U Chg vs YAG Ac tu al = + 40 8 % Ac tu al = + 20 7 %
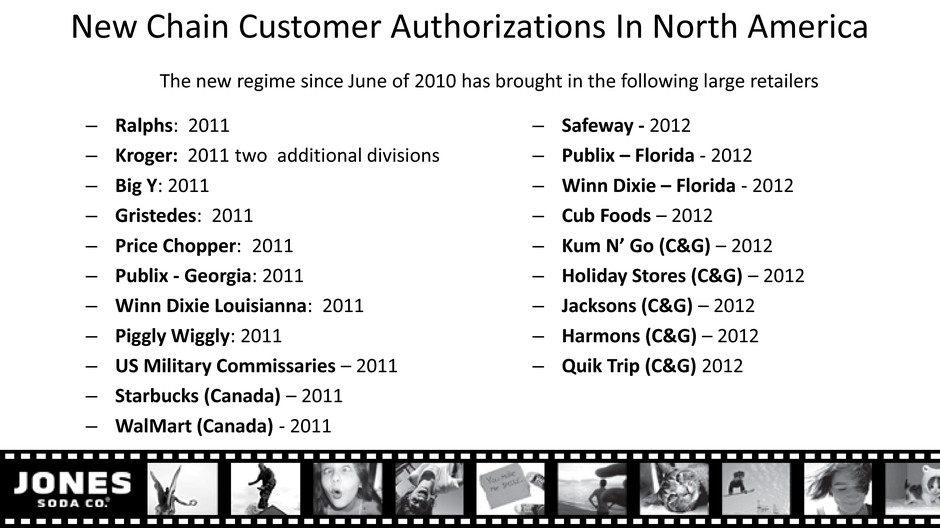
– Ralphs: 2011 – Kroger: 2011 two additional divisions – Big Y: 2011 – Gristedes: 2011 – Price Chopper: 2011 – Publix - Georgia: 2011 – Winn Dixie Louisianna: 2011 – Piggly Wiggly: 2011 – US Military Commissaries – 2011 – Starbucks (Canada) – 2011 – WalMart (Canada) - 2011 New Chain Customer Authorizations In North America – Safeway - 2012 – Publix – Florida - 2012 – Winn Dixie – Florida - 2012 – Cub Foods – 2012 – Kum N’ Go (C&G) – 2012 – Holiday Stores (C&G) – 2012 – Jacksons (C&G) – 2012 – Harmons (C&G) – 2012 – Quik Trip (C&G) 2012 The new regime since June of 2010 has brought in the following large retailers
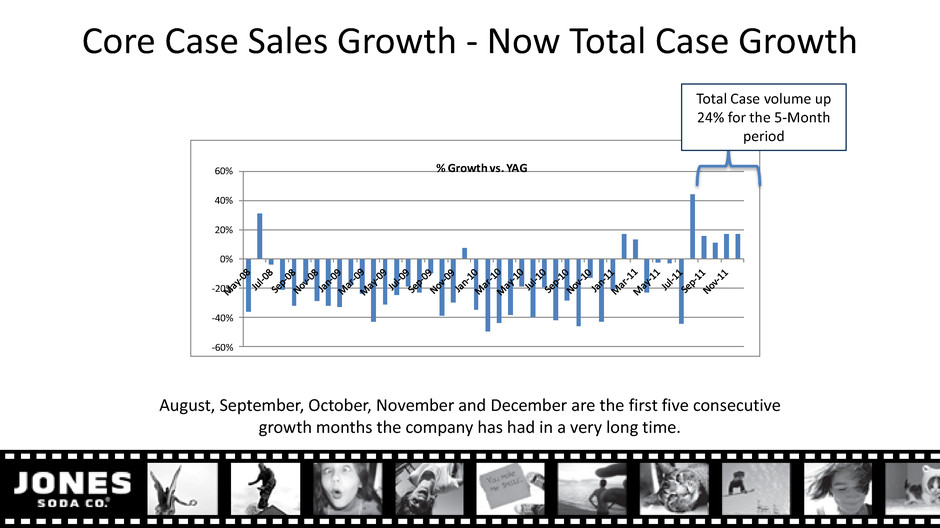
-60% -40% -20% 0% 20% 40% 60% % Growth vs. YAG August, September, October, November and December are the first five consecutive growth months the company has had in a very long time. Total Case volume up 24% for the 5-Month period Core Case Sales Growth - Now Total Case Growth

OUT WITH THE OLD… Improved Branding and Price Package Planning
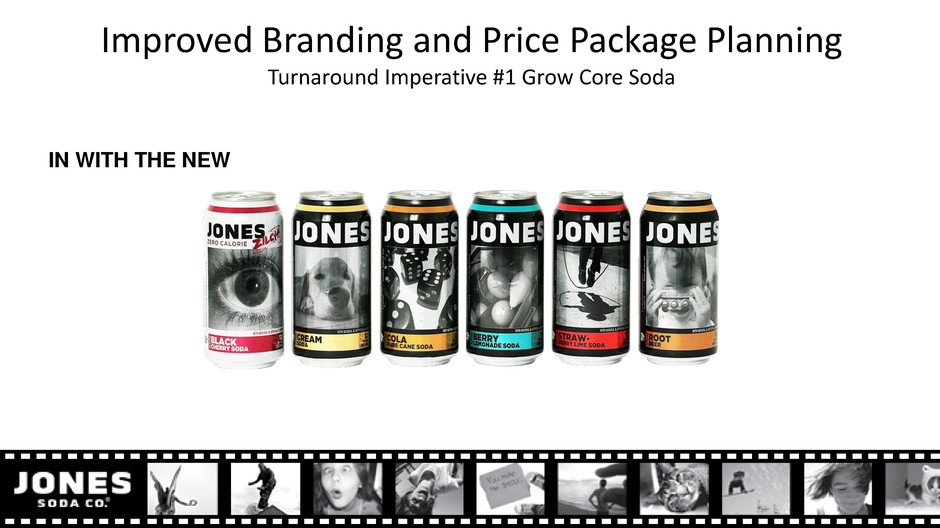
IN WITH THE NEW Improved Branding and Price Package Planning Turnaround Imperative #1 Grow Core Soda
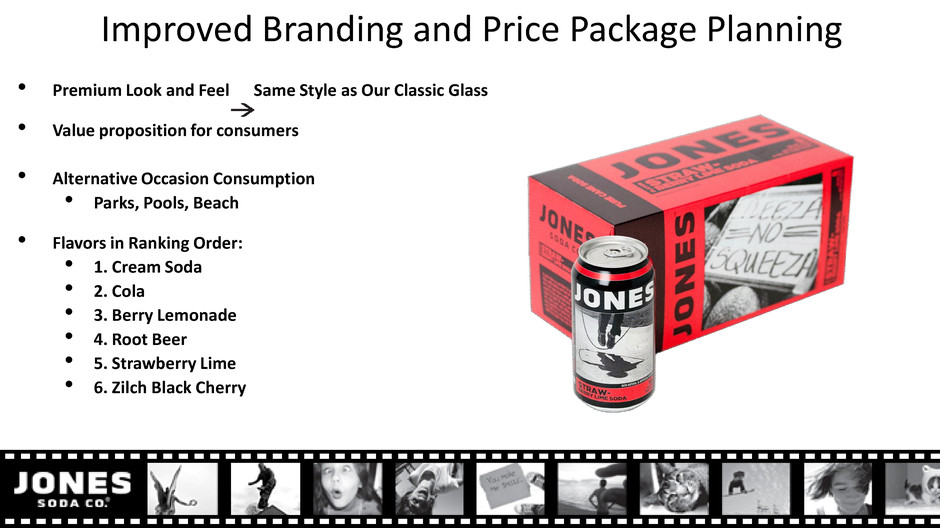
• Premium Look and Feel Same Style as Our Classic Glass • Value proposition for consumers • Alternative Occasion Consumption • Parks, Pools, Beach • Flavors in Ranking Order: • 1. Cream Soda • 2. Cola • 3. Berry Lemonade • 4. Root Beer • 5. Strawberry Lime • 6. Zilch Black Cherry Improved Branding and Price Package Planning
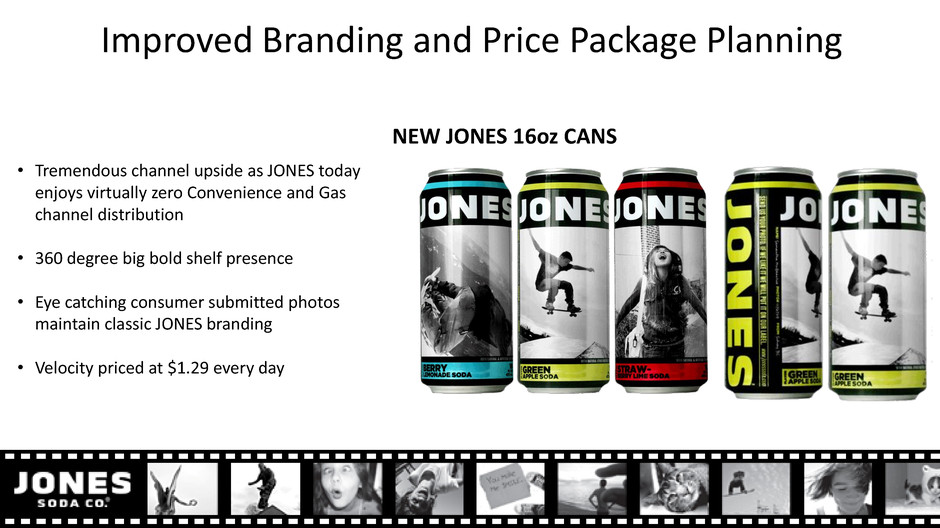
NEW JONES 16oz CANS • Tremendous channel upside as JONES today enjoys virtually zero Convenience and Gas channel distribution • 360 degree big bold shelf presence • Eye catching consumer submitted photos maintain classic JONES branding • Velocity priced at $1.29 every day Improved Branding and Price Package Planning

Value Creation Leverage Soda to Build National Distribution Leverage JONES Soda’s sales leadership in current distribution to build out national footprint that can handle a larger product portfolio Gain Fair-share of ACV With distribution growth take fair-share of the premium category. Dollar share leadership is fair share based on current velocity Invest Behind Energy Aggressively pursue lagging leaders with spot investments as brand shows strength in individual markets Launch Natural Bet Incubate JONES Au Naturel’ in the natural foods channel for 12 to 18 months

Projecting Our “Fair Share” Of Distribution Jones’ growing distribution network provides access to these channel retailers. Jones’ sell-through rates create interest from the retail decision makers. 0% 10% 20% 30% 40% 50% 60% 70% US Food $2MM and above - 4 packs US Food $2MM and above - Singles US Convenience North American Sam's North American Costco US Mass Merchant US Drug 23% 3% 0% 0% 0% 6% 0% 58% 26% 13% 50% 40% 60% 40% 2011 2012 2013 2014 2015 2016

If We’re Successful The Size Of The Prize Is +$100MM We believe the opportunity of meeting our channel penetration goals is greater than +$110MM in revenue by year end 2016. Canada US $- $10,000,000 $20,000,000 $30,000,000 $40,000,000 $50,000,000 $60,000,000 $70,000,000 $80,000,000 $90,000,000 $100,000,000 2011 2012 2013 2014 2015 2016 $14,307,657 $91,851,879 US and Canada Combined Jones Soda Revenue
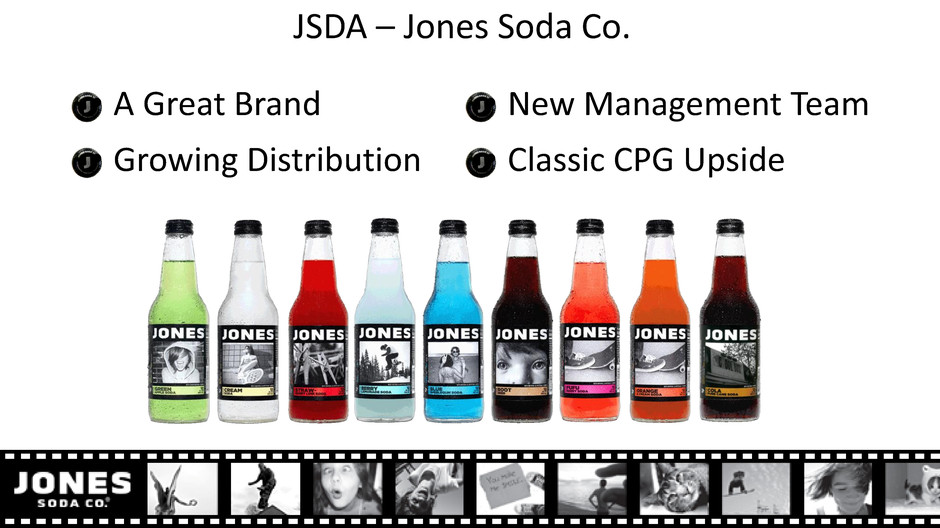
JSDA – Jones Soda Co. • A Great Brand • Growing Distribution • New Management Team • Classic CPG Upside
