Attached files
| file | filename |
|---|---|
| EX-99.1 - TRANSCRIPT OF CONFERENCE CALL - MOSAIC CO | d280778dex991.htm |
| 8-K - FORM 8-K - MOSAIC CO | d280778d8k.htm |
 The Mosaic Company
Jim Prokopanko, President and Chief Executive Officer
Laura Gagnon, Vice President Investor Relations
Earnings
Conference
Call
–
2
nd
Quarter
Fiscal
2012
Thursday, January 5, 2012 |
 This presentation contains forward-looking statements within the meaning of
the Private Securities Litigation Reform Act of 1995. Such statements
include, but are not limited to, statements about future financial and operating results. Such statements are based upon the
current beliefs and expectations of The Mosaic Company’s management and are
subject to significant risks and uncertainties. These risks and
uncertainties include but are not limited to the predictability and volatility of, and customer expectations about, agriculture,
fertilizer,
raw
material,
energy
and
transportation
markets
that
are
subject
to
competitive
and
other
pressures
and
economic
and
credit
market conditions; the level of inventories in the distribution channels for crop
nutrients; changes in foreign currency and exchange rates; international
trade risks; changes in government policy; changes in environmental and other governmental regulation, including
greenhouse gas regulation, implementation of the U.S. Environmental Protection
Agency’s numeric water quality standards for the discharge of
nutrients into Florida lakes and streams or possible efforts to reduce the flow of excess nutrients into the Gulf of Mexico;
further developments in the lawsuit involving the federal wetlands permit for the
extension of the Company’s South Fort Meade, Florida, mine into Hardee
County, including orders, rulings, injunctions or other actions by the court or actions by the plaintiffs, the
Army
Corps
of
Engineers
or
others
in
relation
to
the
lawsuit,
or
any
actions
the
Company
may
identify
and
implement
in
an
effort
to
mitigate the effects of the lawsuit; other difficulties or delays in receiving, or
increased costs of, necessary governmental permits or approvals; the
effectiveness of the Company’s processes for managing its strategic priorities; adverse weather conditions affecting
operations in Central Florida or the Gulf Coast of the United States, including
potential hurricanes or excess rainfall; actual costs of various items
differing from management’s current estimates, including, among others, asset retirement, environmental remediation,
reclamation or other environmental regulation, or Canadian resources taxes and
royalties; accidents and other disruptions involving Mosaic’s
operations, including brine inflows at its Esterhazy, Saskatchewan potash mine and other potential mine fires, floods,
explosions, seismic events or releases of hazardous or volatile chemicals, as well
as other risks and uncertainties reported from time to time in The Mosaic
Company’s reports filed with the Securities and Exchange Commission. Actual results may differ from those set
forth in the forward-looking statements.
Safe Harbor Statement
2 |
 Another Quarter of Strong Results
Revenue
$3.0 billion
+13%
Net Earnings
$624 million
+37%
EPS
$1.40
+37%
3
(1)
Excluding net gain of $570.1 million, or $1.27 per share, from sale of Fosfertil
in Q2 FY11. (1)
(1) |
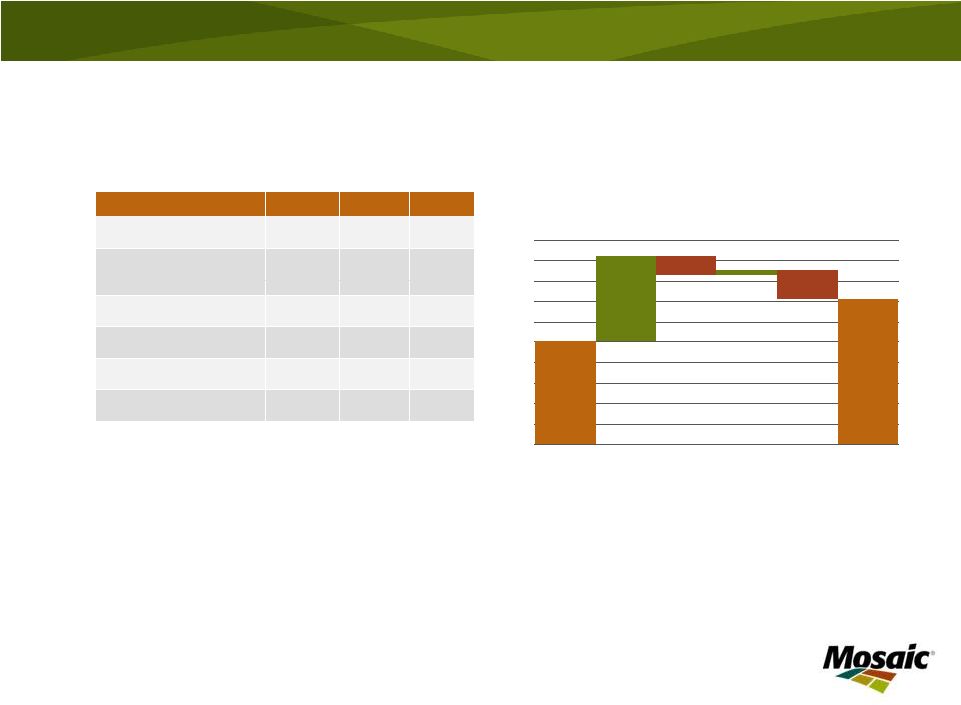 Potash Segment Highlights
4
In millions, except MOP price
Q2 FY12
Q1 FY12
Q2 FY11
Net sales
$839
$873
$699
Gross Margin
$394
$444
$285
% of net sales
47%
51%
41%
Operating earnings
$358
$402
$252
Sales volumes
1.8
1.8
1.8
Production volume
1.8
1.9
1.7
Avg MOP selling price
$440
$446
$331
Second quarter year over year highlights:
•
Operating earnings up 42% due to increased selling prices and higher operating
rates •
Operating rate of 78% vs. 74% a year ago
•
Average selling price driven by international mix
0
50
100
150
200
250
300
350
400
450
500
Q2 FY11 OE
Sales
price
Sales volumes
Resource
taxes
Other
Q2 FY12 OE
OPERATING EARNINGS BRIDGE
$ IN MILLIONS |
 Potash Expansion on Track
Over 60% capacity increase expected by 2019
5
10
12
14
16
18
2012
2013
2014
2015
2016
2017
2018
2019
2020
2021
FISCAL YEAR
CUMULATIVE PEAKING CAPACITY ADDITIONS
MILLION TONNES
EXISTING
TOLLING
IN PROGRESS
FUTURE |
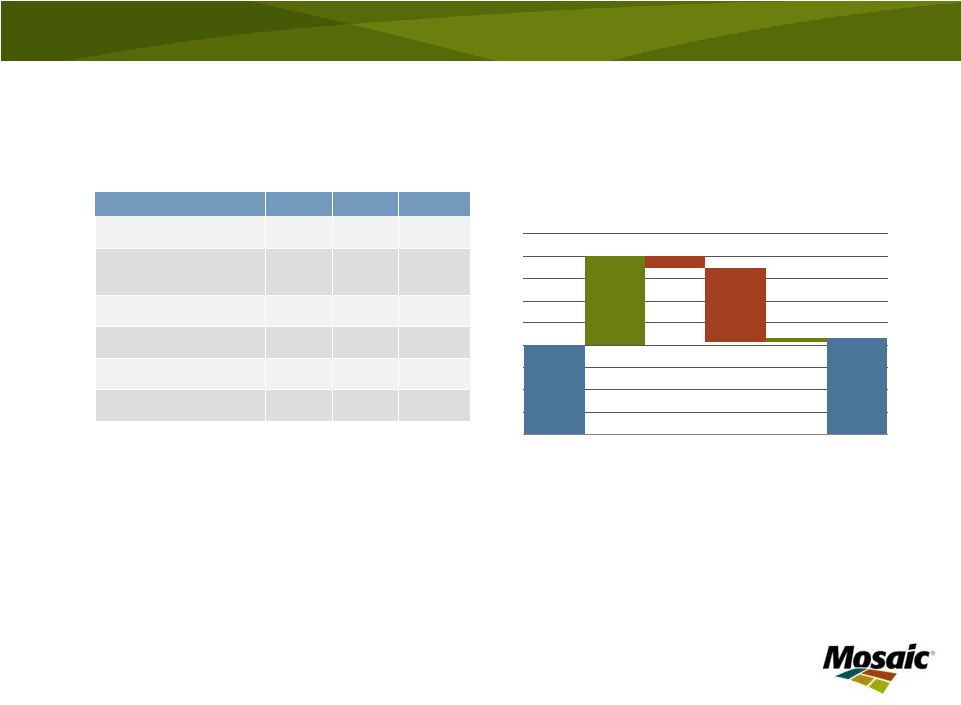 Phosphates Segment Highlights
6
In millions, except DAP price
Q2 FY12
Q1 FY12
Q2 FY11
Net sales
$2,179
$2,220
$1,974
Gross Margin
$476
$410
$476
% of net sales
22%
18%
24%
Operating earnings
$432
$333
$402
Sales volumes
3.2
3.2
3.7
NA production volume
(a)
2.1
2.2
2.1
Avg DAP selling price
$611
$576
$461
(a)
Includes crop nutrient dry concentrates and animal feed ingredients
Second quarter year over year highlights:
•
Operating
earnings
up
7%
due
to
higher
selling
prices,
partially
offset
by
higher
raw
material
costs
and
lower
volumes
•
Finished product operating rate of 86% down slightly from 88% a year ago
•
Sequential improvement in gross margins to 22% reflect price offsetting higher raw
material costs •
Faustina fully operational by November
0
100
200
300
400
500
600
700
800
900
Q2 FY11
OE
Sales
price
Sales
volumes
Raw
materials
Other
Q2 FY12
OE
OPERATING EARNINGS BRIDGE
$ IN MILLIONS |
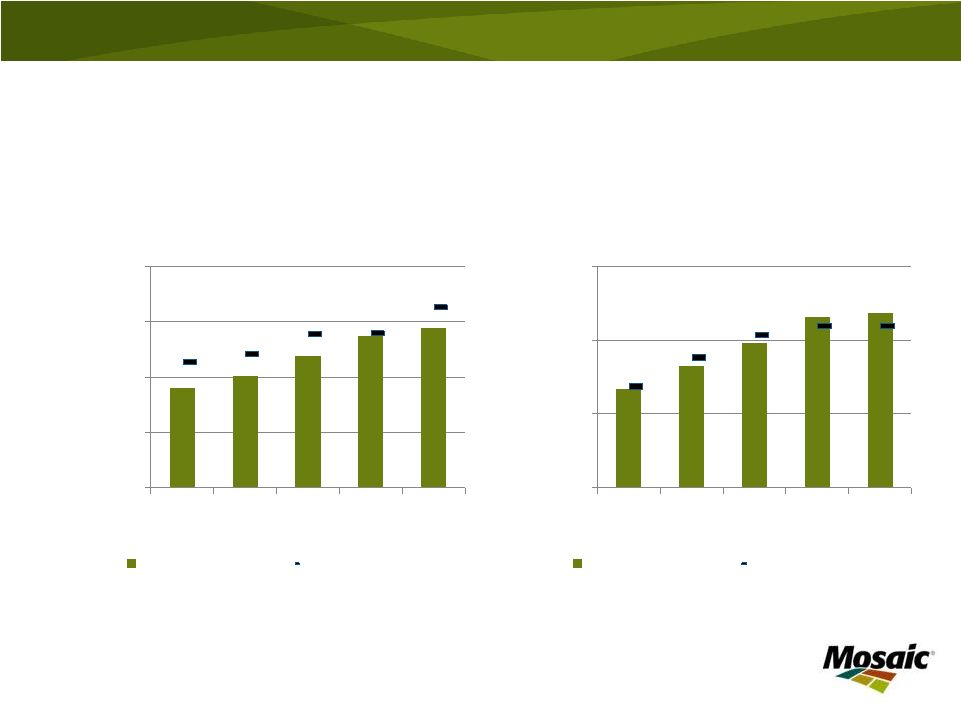 Phosphate Raw Material Costs
7
Ammonia
$/tonne
Sulfur Costs
$/long ton
Realized costs of raw materials in COGS lag spot prices by approximately 3 months.
Realized ammonia costs, in most periods shown, include a benefit of our
manufacture of ammonia at Faustina. In addition, sulfur realized prices include
storage,
conversion
and
transformation
costs
of
$10
-
$15
/
ton.
$0
$200
$400
$600
$800
2Q
2011
3Q
2011
4Q
2011
1Q
2012
2Q
2012
Realized in COGS
Ave Purchase Price
$0
$100
$200
$300
2Q
2011
3Q
2011
4Q
2011
1Q
2012
2Q
2012
Realized in COGS
Ave Purchase Price |
 Phosphate Rock Sourcing
8
Rock Mix used in U.S. Operations
$-
$25
$50
$75
$100
-
500
1,000
1,500
2,000
2,500
3,000
3,500
4,000
4,500
Q2 FY11
Q3 FY11
Q4 FY11
Q1 FY12
Q2 FY12
US mined rock
Purchased Miski Mayo rock
Other purchased rock |
 9
Affordability has improved due to higher grain
prices and lower crop nutrient costs
0.00
0.25
0.50
0.75
1.00
1.25
1.50
1.75
2.00
2.25
2.50
2.75
00
01
02
03
04
05
06
07
08
09
10
11
Crop Nutrient Price Index/Crop Price Index Ratio
Ratio
Average |
 Markets are signaling to farmers to keep
the foot on the gas and not the brake
10
3.50
4.00
4.50
5.00
5.50
6.00
6.50
7.00
7.50
8.00
O
N
D
J
F
M
A
M
J
J
US$ BU
New Crop Corn Prices
Daily Close of the New Crop Option October 1 to June 30
2008
2009
2010
2011
2012
Source: CBOT |
 Near term market forecast
The issue is timing, not tonnes
11
0
1
2
3
4
5
6
7
8
Jun-Nov
Dec-May
NORTH AMERICAN MOP SHIPMENTS
MILLION TONS
0
1
2
3
4
5
6
7
8
Jun-Nov
Dec-May
NORTH AMERICAN PHOSPHATE SHIPMENTS
MILLION TONS
5 yr range
2011/12F
5 yr average |
 Category
Guidance
Potash
Q3
Sales
volume
1.2
–
1.5
million
tonnes
Q3
MOP
selling
price
$430
–
$460
per
tonne
Q3 Operating rate above 80%
Phosphates
Q3
Sales
volume
2.2
–
2.6
million
tonnes
Q3 DAP selling price $530 -
$560 per tonne
Q3
Operating
rate
range
of
70%
-
80%
Capital Expenditures
$1.6
-
$1.9
billion
Canadian Resource Taxes and Royalties
$420
–
$470
million
SG&A
$400
–
$430
million
Effective Tax Rate
Upper 20 percent range
Financial Guidance –
Fiscal 2012
12 |
 Record Phosphate Shipments
In both 2011 and 2012
13
Phosphate shipments are expected to climb to record levels driven by high
agricultural commodity prices and profitable farm economics
Source: Fertecon, IFA and Mosaic estimates
52
47
58
60
62-64
30
40
50
60
70
00
01
02
03
04
05
06
07
08
09
10
11F
12F
CALENDAR YEAR
WORLD PHOSPHATE SHIPMENTS
MILLION TONNES DAP/MAP/TSP |
 Record Potash Demand
In both 2011 and 2012
14
Source: Fertecon, IFA and Mosaic estimates
Muriate
of
Potash
shipments
also
are
expected
to
climb
to
record
levels
driven
by
high agricultural commodity prices and profitable farm economics
51
31
53
56
57-59
25
35
45
55
65
00
01
02
03
04
05
06
07
08
09
10
11F
12F
CALENDAR YEAR
WORLD POTASH SHIPMENTS
MILLION TONNES KCl |
 The Mosaic Company
Thank you |
 Earnings
Sensitivity
to
Key
Drivers
(a)
Change
Estimated Change in
Pre-Tax Earnings
($ in millions)
Estimated
Change in Annual
EPS
MOP Price ($/tonne)
$50
$354
$0.59
Potash Volume (000 tonnes)
500
$160
$0.27
DAP Price ($/tonne)
$50
$416
$0.69
Phosphates Volume (000 tonnes)
500
$111
$0.18
Sulfur ($/lt)
$25
$175
$0.29
Ammonia ($/tonne)
$25
$78
$0.13
Natural Gas ($/mmbtu)
$1.00
$36
$0.06
(a)
These factors do not change in isolation; actual results could vary from the above
estimates 16 |
 Three Months Ended
November
30, ,
2011 –
2010 . (in millions, except per share amounts)
2011
2010
Change
Percent
Net earnings attributable to Mosaic
$623.6
$1,025.6
$(402.0)
(39%)
After-tax gain from sale of Fosfertil
-
$(570.1)
$570.1
-
Adjusted net earnings attributable to Mosaic
$623.6
$455.5
$168.1
37%
Diluted net earnings per share attributable to Mosaic
$1.40
$1.02
$0.38
37%
Diluted weighted average number of shares outstanding
444.7
447.3
17
Adjusted Net Earnings Attributable to Mosaic
The Company has presented above adjusted net earnings attributable to Mosaic which
is a non-GAAP financial measure. Generally, a non-GAAP
financial measure is a supplemental numerical measure of a company's performance,
financial position or cash flows that either excludes or includes amounts
that are not normally excluded or included in the most directly comparable measure calculated and presented in accordance with
U.S. generally accepted accounting principles ("GAAP"). Adjusted net
earnings attributable to Mosaic is not a measure of financial performance
under GAAP. Because not all companies use identical calculations, investors
should consider that Mosaic’s calculation may not be comparable to
other similarly titled measures presented by other companies.
Adjusted net earnings attributable to Mosaic provides a metric that the Company
believes is helpful to investors in evaluating the Company’s
performance as it excludes the one-time gain from the sale of Mosaic’s
equity investment in Fosfertil. Adjusted net earnings attributable to Mosaic
should not be considered as a substitute for, or superior to, measures of financial
performance prepared in accordance with GAAP. |