Attached files
| file | filename |
|---|---|
| 8-K - SUN HEALTHCARE GROUP INC | form8k.htm |
EXHIBIT 99.1

J.P. Morgan Healthcare Conference
San Francisco, CA
January 10, 2012

1
Statements made in this presentation that are not historical facts are "forward-looking" statements (as defined in the Private
Securities Litigation Reform Act of 1995) that involve risks and uncertainties and are subject to change at any time. These
forward-looking statements may include, but are not limited to, statements containing words such as "anticipate," "believe,"
"plan," "estimate,” "expect,” "hope,” "intend,” "may” and similar expressions. Forward-looking statements in this presentation
also include all statements regarding the estimated impact of the CMS Rule, planned capital expenditures, expected
financial position, results of operations, cash flows, liquidity, business strategy, growth opportunities, plans and objectives of
management for future operations, the impact of reductions in reimbursements and other changes in government
reimbursement programs and the timing and impact of the proposed restructuring transactions. Factors that could cause
actual results to differ are identified in the public filings made by Sun with the Securities and Exchange Commission and
include changes in Medicare and Medicaid reimbursements and Sun’s ability to mitigate such changes; the impact that
healthcare reform legislation will have on Sun’s business; Sun’s ability to maintain the occupancy rates and payor mix at
Sun’s healthcare centers; potential liability for losses not covered by, or in excess of, Sun’s insurance; the effects of
government regulations and investigations; the significant amount of Sun’s indebtedness, covenants in Sun’s debt
agreements that may restrict Sun’s activities and Sun’s ability to make acquisitions, incur more indebtedness; the impact of
the current economic downturn on Sun’s business; the ability of Sun to collect its accounts receivable on a timely basis;
increasing labor costs and the shortage of qualified healthcare personnel; and Sun’s ability to receive increases in
reimbursement rates from government payors to cover increased costs. More information on factors that could affect Sun’s
business and financial results are included in Sun’s public filings made with the Securities and Exchange Commission,
including Sun’s Annual Report on Form 10-K and Quarterly Reports on Form 10-Q, copies of which are available on Sun’s
web site, www.sunh.com. There may be additional risks of which Sun is presently unaware or that Sun currently deems
immaterial.
The forward-looking statements involve known and unknown risks, uncertainties and other factors that are, in some cases,
beyond Sun’s control. Sun cautions that any forward-looking statements made by Sun are not guarantees of future
performance. Sun disclaims any obligation to update any such factors or to announce publicly the results of any revisions to
any of the forward-looking statements to reflect future events or developments.
References to “Sun” refer to Sun Healthcare Group, Inc. and its subsidiaries
Forward-Looking Statements

2
References are made in this presentation to EBITDA, EBITDA margin, EBITDAR and EBITDAR margin, which are non-
GAAP financial measures.
GAAP financial measures.
EBITDA is defined as net income before loss (gain) on discontinued operations, interest expense (net of interest income),
income tax expense (benefit) and depreciation and amortization. EBITDA margin is EBITDA as a percentage of revenue.
EBITDAR is EBITDA before rent expense and EBITDAR margin is EBITDAR as a percentage of revenue. Sun believes
that EBITDA, EBITDA margin, EBITDAR and EBITDAR margin provide useful information regarding Sun’s operational
performance because these financial measures enhance the overall understanding of the financial performance and
prospects for the future of Sun’s core business activities, provide consistency in Sun’s financial reporting and provide a
basis for the comparison of results of core business operations between current, past and future periods. These
measures are also some of the primary indicators Sun uses for planning and forecasting in future periods, including
trending and analyzing the core operating performance of its business from period to period without the effect of GAAP
expenses, revenues and gains that are unrelated to day-to-day performance.
Non-GAAP Financial Measures

3
Investment Considerations
Weather challenges
and adapt to change
and adapt to change
Experienced
management team
management team
National platform
with four
complementary
business
with four
complementary
business
lines
Focus on high-acuity,
clinically
clinically
complex
patients

4
Proven Track Record
(1)
(2)
Focused on admitting patients in nine new RUG
categories
categories
Exceeded the average acuity projected by CMS
Increased average Medicare rates by $9.85 in 2006
Achieved synergies ahead of schedule at high-end
of $12 to $15 million range
of $12 to $15 million range
Achieved targeted cost savings of $10 million
Successfully implemented new assessment tool (MDS
3.0) and clinical protocols
3.0) and clinical protocols
Reduced concurrent utilization to <5% to minimize
impact of change in concurrent therapy
impact of change in concurrent therapy
Continued to grow Medicare rate via acuity shift beyond
market basket increase
market basket increase
Medicare Forecast
Medicare Forecast
Error Correction
Error Correction
RUGs IV & MDS 3.0
RUGs IV & MDS 3.0
Harborside Acquisition
Harborside Acquisition
RUGs III Refinement
RUGs III Refinement
2006
2006
2007
2007
2009
2009
2010
2010
Event
Event
Year
Year
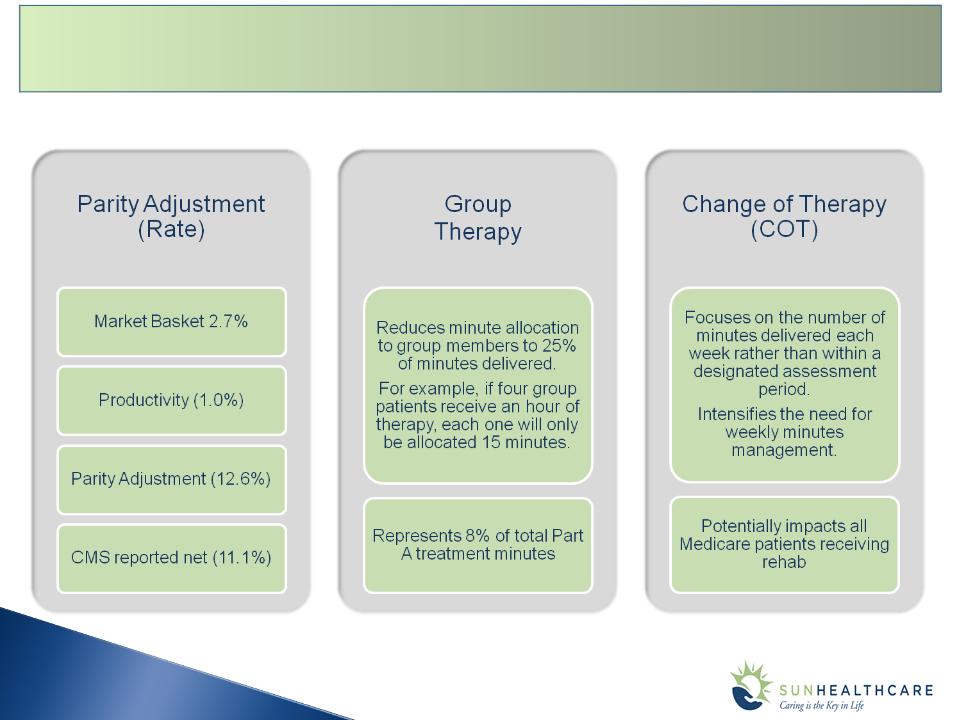
CMS Final Rule - 3 Components
5
Annual Update For Fiscal Year 10/1/11 to 9/30/12 (Released July 29, 2011)

6
Mitigation Approach to CMS Final Rule
Estimated Impact of
Final Rule
to 2012 EBITDAR:
$40 to $45 million

7
Net Revenue by Line of Business
Sun Healthcare Today

8
Complementary Lines of Business
Skilled Nursing Services
Rehabilitation Therapy Services
Hospice Services

9
Key Strategic Initiatives
Focus on delivering quality care services to medically-complex,
high-acuity patients.
Specialize and differentiate our clinical product on a
market-by-market basis to gain market share.
Seek partnerships, not just relationships (hospitals,
physicians, managed care providers, etc.).
Continue modernizing the portfolio to include
discrete environments for both long-term and short stay
patients.
Continue upgrading our technology systems.
Continue hospice and SNF growth that
strengthens or creates market density in priority
markets.

10
Examples of Strategic Initiatives In Action
Expansion of Product
and Service Offering
and Service Offering
• Expand clinical capabilities
to improve ability to capture
more clinically complex
patients
to improve ability to capture
more clinically complex
patients
• Augment existing rehab
capability with focus on
cardiac, pulmonary and
infectious disease
capability with focus on
cardiac, pulmonary and
infectious disease
Long-term Asset
Modernization
Modernization
• Upgrade, fully renovate or
replace centers:
replace centers:
Focus on privacy;
Enhance amenities; and
Designate unique space
for short and longer-
term customers
for short and longer-
term customers
Grow Short-Term
Specialty Unit Capacity
Specialty Unit Capacity
• Build-out Rehab Recovery
Suite (RRS) capacity within
targeted urban markets:
Suite (RRS) capacity within
targeted urban markets:
Distinct and separate
units;
units;
Enhanced product; and
Dedicated concierge
service
service
Ø 2,185 designated RRS
beds in 80% of urban
centers
beds in 80% of urban
centers
Ø Centers with RRS units run
600 bps higher skilled mix
than those without
600 bps higher skilled mix
than those without
OUTCOME
OUTCOME
OUTCOME

11
Track Record of Operational Growth
Acquired Harborside in April 2007
+33%
+120bps
9.3%
margin
margin
22.8%
margin
margin
+670bps
12.0%
margin
margin
13.5%
margin
margin

2012 Guidance
12

2012 Guidance Parameters
13
No acquisitions contemplated
Excludes the results of operations of assets that Sun expects to
transition to held for sale in 2012, which generated revenues of
approximately $49 million and an EBITDA loss of approximately
$4.6 million in 2011
transition to held for sale in 2012, which generated revenues of
approximately $49 million and an EBITDA loss of approximately
$4.6 million in 2011
Organic consolidated revenue growth would be 4.1% primarily
based on:
based on:
§ Organic growth opportunities in volume, acuity and a moderate
Medicare market basket increase in Q4 2012; and
Medicare market basket increase in Q4 2012; and
§ Medicaid rates, net of provider taxes, which are expected to be
flat in 2012
flat in 2012
Revenue and EBITDA will be impacted by the CMS Final Rule
offset by mitigation activities
offset by mitigation activities
An increase in center lease costs of 2.7%
Capital expenditures in the range of $35 to $40 million
2012 interest expense of approximately $17.5 million reflecting an
average debt balance of $87 million plus a $75 million funded letter
of credit balance at a blended interest rate of approximately 11%
which includes $2.9 million of non-cash amortization of financing
costs
average debt balance of $87 million plus a $75 million funded letter
of credit balance at a blended interest rate of approximately 11%
which includes $2.9 million of non-cash amortization of financing
costs
Effective tax rate of 39% and 2012 cash income taxes paid between
$4 million and $6 million as a result of net operating loss
carryforwards
$4 million and $6 million as a result of net operating loss
carryforwards
Guidance Parameters:

14
Capital Structure & Bank Covenants (1)
(1) In December 2011, Sun amended its Credit Facility and made a voluntary debt pay-down of $50 million and increased its interest
rate by 1.25% in return for greater flexibility to financial covenants
(2) Based upon 2012 guidance
(3) $60 million of capacity of which $0.4 million issued for letters of credit
(4) Assumes add-back to EBITDA for non-cash stock compensation in 2012 of approximately $6 million
(5) Excludes non-cash interest expense of $2.9 million in 2012 related to amortization of financing costs
incurred in connection with our Credit Facility

15
Capital Investment
2011 is an estimate and 2012 is based on guidance
$20 funded to-date
$8 under construction in 2012
$22 available for additional projects

2012 Cash Flows
16
*Based upon 2012 Guidance

17
Investment Highlights

18