Attached files
| file | filename |
|---|---|
| EX-23.1 - CONSENT OF DELOITTE & TOUCHE LLP - Synacor, Inc. | d253349dex231.htm |
| EX-10.5.2 - SEVERANCE AGREEMENT WITH RONALD N. FRANKEL - Synacor, Inc. | d253349dex1052.htm |
| EX-23.2 - CONSENT OF ANVIL ADVISORS, LLC - Synacor, Inc. | d253349dex232.htm |
| EX-10.7.2 - SEVERANCE AGREEMENT WITH GEORGE G. CHAMOUN - Synacor, Inc. | d253349dex1072.htm |
Table of Contents
As filed with the Securities and Exchange Commission on December 22, 2011.
Registration No. 333-178049
UNITED STATES
SECURITIES AND EXCHANGE COMMISSION
Washington, D.C. 20549
AMENDMENT NO. 1
TO
Form S-1
REGISTRATION STATEMENT
UNDER
THE SECURITIES ACT OF 1933
SYNACOR, INC.
(Exact Name of Registrant as Specified in its Charter)
| Delaware | 7370 | 16-1542712 | ||
| (State or Other Jurisdiction of | (Primary Standard Industrial | (I.R.S. Employer | ||
| Incorporation or Organization) | Classification Code Number) | Identification Number) |
40 La Riviere Drive, Suite 300
Buffalo, NY 14202
(716) 853-1362
(Address, including zip code and telephone number, including area code, of registrant’s principal executive offices)
Ronald N. Frankel
President and Chief Executive Officer
Synacor, Inc.
40 La Riviere Drive, Suite 300
Buffalo, NY 14202
(716) 853-1362
(Name, address, including zip code and telephone number, including area code, of agent for service)
Copies to:
| Scott Dettmer, Esq. | Steven L. Grossman, Esq. | |
| Brian Hutchings, Esq. | O’Melveny & Myers, LLP | |
| Gunderson Dettmer Stough | 1999 Avenue of the Stars, 7th Floor | |
| Villeneuve Franklin & Hachigian, LLP | Los Angeles, California 90067 | |
| 220 West 42nd Street, 21st Floor | (310) 553-6700 | |
| New York, New York 10036 | ||
| (212) 730-8133 |
Approximate date of commencement of proposed sale to the public: As soon as practicable after the effective date of this Registration Statement.
If any of the securities being registered on this Form are to be offered on a delayed or continuous basis pursuant to Rule 415 under the Securities Act of 1933, as amended, check the following box. ¨
If this Form is filed to register additional securities for an offering pursuant to Rule 462(b) under the Securities Act, check the following box and list the Securities Act registration statement number of earlier effective registration statement for the same offering. ¨
If this Form is a post-effective amendment filed pursuant to Rule 462(c) under the Securities Act, check the following box and list the Securities Act registration statement number of the earlier effective registration statement for the same offering. ¨
If this Form is a post-effective amendment filed pursuant to Rule 462(d) under the Securities Act, check the following box and list the Securities Act registration statement number of the earlier effective registration statement for the same offering. ¨
Indicate by check mark whether the registrant is a large accelerated filer, an accelerated filer, a non-accelerated filer, or a smaller reporting company. See definitions of “large accelerated filer,” “accelerated filer,” and “smaller reporting company” in Rule 12b-2 of the Exchange Act. (Check one):
| Large accelerated filer | ¨ | Accelerated filer | ¨ | |||
| Non-accelerated filer | x (Do not check if a smaller reporting company) | Smaller reporting company | ¨ | |||
CALCULATION OF REGISTRATION FEE
|
| ||||
| Title of Each Class of Securities to be Registered |
Proposed Aggregate |
Amount of Registration Fee (1)(3) | ||
| Common stock, par value $0.01 per share |
$75,000,000 | $8,595 | ||
|
| ||||
|
| ||||
| (1) | Includes offering price of shares of common stock that may be purchased by the underwriters to cover over-allotments, if any. |
| (2) | Estimated solely for the purpose of computing the amount of the registration fee pursuant to Rule 457(o) under the Securities Act. |
| (3) | Of the total fee, $5,947 was paid concurrently with the initial filing of this registration statement. Pursuant to Rule 457(p) under the Securities Act, the registration fee was offset by the $2,648 registration fee previously paid by the registrant, Synacor, Inc., in connection with the registration statement on Form S-1 (File No. 333-145077) initially filed by the registrant on August 2, 2007 and subsequently withdrawn. |
The Registrant hereby amends this Registration Statement on such date or dates as may be necessary to delay its effective date until the Registrant shall file a further amendment which specifically states that this Registration Statement shall thereafter become effective in accordance with Section 8(a) of the Securities Act of 1933, or until the Registration Statement shall become effective on such date as the Commission, acting pursuant to said Section 8(a), may determine.
Table of Contents
The information in this prospectus is not complete and may be changed. We may not sell these securities until the registration statement filed with the Securities and Exchange Commission is effective. This prospectus is not an offer to sell these securities and it is not soliciting an offer to buy these securities in any state where the offer or sale is not permitted.
Subject to Completion
Preliminary Prospectus dated December 22, 2011
PROSPECTUS
Shares

Common Stock
This is Synacor, Inc.’s initial public offering. We are selling shares of our common stock.
We expect the public offering price to be between $ and $ per share. Currently, no public market exists for the shares. After pricing of the offering, we expect that the shares will trade on The NASDAQ Global Market under the symbol “SYNC.”
Investing in the common stock involves risks that are described in the “Risk Factors” section beginning on page 11 of this prospectus.
| Per Share | Total | |||||||
| Public offering price |
$ | $ | ||||||
| Underwriting discount |
$ | $ | ||||||
| Proceeds, before expenses, to us |
$ | $ | ||||||
The underwriters may also exercise their option to purchase up to an additional shares from us, at the public offering price less the underwriting discount, for 30 days after the date of this prospectus.
Neither the Securities and Exchange Commission nor any state securities commission has approved or disapproved of these securities or determined if this prospectus is truthful or complete. Any representation to the contrary is a criminal offense.
The shares will be ready for delivery on or about , .
| BofA Merrill Lynch | Citigroup | Stifel Nicolaus Weisel |
| BMO Capital Markets | Needham & Company, LLC | Oppenheimer & Co. |
The date of this prospectus is , .
Table of Contents
| Page | ||||
| 1 | ||||
| 11 | ||||
| 31 | ||||
| 33 | ||||
| 33 | ||||
| 34 | ||||
| 36 | ||||
| 38 | ||||
| Management’s Discussion and Analysis of Financial Condition and Results of Operations |
42 | |||
| 70 | ||||
| 84 | ||||
| Transactions with Related Persons, Promoters and Certain Control Persons |
114 | |||
| 117 | ||||
| 121 | ||||
| 125 | ||||
| 132 | ||||
| 138 | ||||
| 138 | ||||
| 138 | ||||
| F-1 | ||||
i
Table of Contents
This summary highlights selected information contained in greater detail elsewhere in this prospectus. This summary does not contain all the information you should consider before investing in our common stock. You should carefully read the entire prospectus, including “Risk Factors” and our financial statements and related notes, before making an investment decision. Unless the context otherwise requires, we use the terms “Synacor,” the “company,” “we,” “us” and “our” in this prospectus to refer to Synacor, Inc.
Our Business
We are a leading provider of authentication and aggregation solutions for delivery of online content and services. We deliver our solutions as a set of services through our hosted and managed platform, enabling cable and telecom service providers and consumer electronics manufacturers to provide the online content and services that their consumers increasingly demand. Our platform allows our customers to package a wide array of online content and services with their high-speed Internet, communications, television and other offerings. Our customers offer our services under their own brands on Internet-enabled devices such as PCs, tablets, smartphones and connected TVs. As of September 30, 2011, our high-speed Internet service provider customers used our platform to offer an engaging Internet experience to over 25% of the estimated 79 million United States high-speed Internet households.
Our hosted and managed platform allows our customers to enhance their consumers’ online experience. Individuals are spending more time consuming online content at home and on the go, and as a result, it has become increasingly important for our customers to provide consumers with choice, a personalized experience and seamless, single sign-on, access to online content and services. We believe the increased functionality we offer through our platform results in an enhanced experience for consumers and a broadened relationship between our customers and their consumers, both of which increase the traffic associated with our platform. This increased traffic creates an opportunity, through our revenue-share agreements, for increased monetization for both us and our customers.
Our platform provides single sign-on capability, enabling consumers to seamlessly sign in and consume packaged online content and services from numerous programmers and content providers. These services include e-mail, security, online games, music and authentication of TV Everywhere, a technology enabling consumers with applicable rights to access on-demand television online via multiple devices including PCs, tablets, smartphones and connected TVs. We enable our customers to up-sell a menu of content and services to their consumers either on a pay-per-view basis or as a new service tier added to their existing subscription relationship.
Our customers direct consumers to their branded websites, which comprise the consumer-facing components of our platform, where consumers have access to the online content and services available to them at their respective subscription levels. We monetize the online traffic generated by these consumers through search and display advertising. We also charge fees for value added services delivered through our platform. Our business model creates deep customer relationships: as we monetize our customers’ online traffic, we share a portion of this revenue with our customers, resulting in a mutually beneficial partnership.
We have historically experienced growth in the number of consumers whose online traffic can generate search and display advertising revenues through our platform. The number of these consumers who are subscribers through our high-speed Internet customers has increased from 5.2 million in December 2006 to 9.5 million in December 2009 to 21.1 million in September 2011. These subscribers, along with other consumers, such as those attributable to our consumer electronics manufacturer customer, have driven a 71% increase in average monthly unique visitors to our customers’ websites, an 81% increase in average monthly search queries by consumers on our platform and a 64% increase in average monthly advertising impressions, each on a comparative quarterly basis since the first quarter of 2010.
1
Table of Contents
For the nine months ended September 30, 2011, our revenue was $62.1 million, which represented a 29.3% increase over $48.0 million in the same period in 2010. For the nine months ended September 30, 2011, our net income was $2.2 million, compared to a net loss of $3.2 million in the same period in 2010. For the nine months ended September 30, 2011, adjusted EBITDA was $4.9 million compared to $(0.5) million over the same period in 2010. Adjusted EBITDA is a non-GAAP financial measure, and thus should be considered in addition to, not as substitute for, or superior to, measures of financial performance prepared in accordance with GAAP. For additional information on adjusted EBITDA, including its limitations, and for a reconciliation of adjusted EBITDA to net income (loss), the most directly comparable financial measure calculated and presented in accordance with GAAP, for each of these periods, see “Selected Financial Data.”
Market Overview
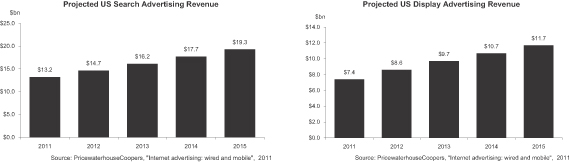
According to a June 2011 report published by PricewaterhouseCoopers LLP, or PwC, from 2006 through 2010, high-speed Internet penetration (measured on a household basis) has increased substantially both within the United States and globally, from 46% and 18% to 69% and 34%, respectively. This represents an increase from 50 million subscribers with high-speed Internet to 79 million subscribers in the United States, and from 248 million subscribers to 490 million subscribers globally. Individuals are spending more time online driven by a growing selection of online services, higher bandwidth speeds, the increased amount of content available online and the societal shift towards virtual socialization. According to a report published by Forrester Research, Inc., or Forrester, in May 2011, in 2010, people consumed 36% of their media on the Internet compared with only 19% in 2005. This growth in Internet usage has driven advertisers to expand their reach and market to these consumers who are increasingly spending their time online. According to the PwC report, Internet advertising is expected to continue to grow rapidly, with United States search advertising revenue growing at an average rate of approximately 10% per annum from 2011 to 2015, and United States display advertising revenue growing at an average rate of approximately 12% per annum over the same period. Taken together, the market for search and display advertising in the United States is expected to grow from $21 billion in 2011 to $31 billion in 2015.
High-speed Internet service providers have continuously upgraded their networks in recent years, providing users with significantly faster connection speeds and enabling online access through multiple types of devices, thus reinforcing and enabling the growth in Internet usage. These higher speeds and increased number of platforms have resulted in an increased number of services available online. In addition, the proliferation of new types of connected mobile devices, such as smartphones and tablets, has enabled consumers to increase the amount and type of content they consume online. Rapid innovations in technology have made it possible for users to easily transition between smartphones, tablets, laptops and desktops, thereby significantly increasing the total amount of time spent online and the quality of the viewing experience.
The rapid growth of online content offerings across a multitude of websites and applications, while embraced by consumers, has also created a new challenge, as consumers sometimes find it difficult to ascertain
2
Table of Contents
which online content they already have rights to access. Furthermore, the disaggregation of content forces consumers to sign on across multiple online platforms, making it cumbersome for them to access authorized content. Consumers want a simplified solution that allows them to sign on once and view all of their content in a seamless manner.
Increasingly available Internet connectivity, increases in high-speed Internet penetration and speed, and the expansion of online video content services, have driven explosive growth in consumption of video content delivered over the Internet to televisions, computers, tablets and smartphones, more commonly referred to as “over-the-top” (OTT). Nevertheless, the OTT landscape remains highly fragmented, making specific content often difficult to find or consume. We believe high-speed Internet providers that also provide television services face a growing threat of disintermediation from these OTT providers, and are increasingly seeking compelling solutions to help them compete.
The Synacor Solution
Our customers face a number of challenges, including responding to changing consumer preferences, maintaining relevance in the face of increasing competitive pressure, addressing OTT and finding new ways to increase their average revenue per subscriber. We tailored our platform to provide solutions to these challenges and to enable our customers to:
| • | Deliver a compelling consumer experience. Our platform simplifies the consumer Internet experience by packaging online content and services with the goal of providing consumers easy access to the content they are entitled to receive – anytime, anywhere, on any device. |
| • | Broaden relationships with consumers. We provide our customers with a platform that enables multiple touch points with consumers and increases engagement through an extensive offering of online content and services across multiple devices. |
| • | Increase monetization. We enable our customers to generate additional revenue by monetizing their consumer Internet traffic and packaging value added services which we partner with them to provide. |
Our Strengths
| • | Robust platform at scale. We benefit from scalable technology, our customers’ large subscriber base and extensive relationships with content providers. By applying our proprietary platform and investment in research and development, we are able to offer our services to new and existing customers on what we believe are highly competitive terms. As a result, we believe our customers benefit from the decrease in capital expenditures and ongoing maintenance expense required to implement and operate their own platform. In addition, we believe that our scale enables us to obtain more favorable terms from third parties (such as search and display advertising partners) than our customers could obtain on their own. Finally, our customers’ large subscriber base draws many programmers and content providers with whom we have content licensing agreements. We believe that our economies of scale make it difficult for our customers to cost-effectively develop comparable solutions in-house or for a competitor to replicate our comprehensive suite of solutions. |
| • | Flexible and easily integrated solution. Our flexible platform allows our customers to package content that meets the specific requirements of their consumers. We designed our platform to fully integrate with our customers’ billing and subscriber management systems, enabling consumers to access content and services that they are authorized to receive across multiple devices. Our |
3
Table of Contents
| integration also provides our customers with an opportunity to package, cross-sell and up-sell premium content and additional tiers of service to their consumers. |
| • | Large and engaged consumer base. Over the three months ended September 30, 2011, we had an average of 14.1 million unique visitors per month, as measured by comScore. These unique visitor levels represent a large and engaged consumer base that has developed as we have attracted new customers and added more content and services to our platform. We have the ability to target specific consumer segments, enabling us to attract advertisers seeking to target specific local and national audiences. |
| • | Established customer relationships. We have long-term relationships with many of our customers which, together with what we believe is a high cost of switching (from our platform to another solution), have resulted in very low levels of customer turnover over time. While we derive a substantial majority of our revenue from a small number of customers, the majority of our revenue attributable to our established customers is generated through search and display advertising. Consumer search and page view behavior patterns on our platform have historically followed consistent patterns as our customers have made our offerings available to their consumers. The combination of established customer relationships, low customer turnover and historically consistent search and page view behavior patterns has generally provided us with a high level of visibility on our search and display advertising revenue once a new customer is brought online. |
| • | Well positioned in large and growing market. The market for Internet-delivered content has grown rapidly over the past several years. We believe we are one of the only companies that has a platform solution with the scale and functionality to allow the largest high-speed Internet service providers and consumer electronics manufacturers to develop or expand their online video or other online content offerings. |
Our Strategy
We intend to:
| • | Increase penetration and monetization of existing customers. |
| • | Acquire new customers. |
| • | Continue to invest in platform enhancements and technology solutions. |
| • | Expand internationally. |
Risks Related to Our Business
Our business is subject to a number of risks that you should be aware of before making an investment decision. These risks are discussed more fully in “Risk Factors” beginning on page 11.
Some of these risks are:
| • | We have a history of significant net losses and may not be profitable in future periods. |
4
Table of Contents
| • | Google Inc., or Google, accounts for a significant portion of our revenue, and any loss of, or diminution in, our business relationship with Google would materially and adversely affect our financial performance. |
| • | We derive a substantial portion of our revenue from a small number of customers, and a loss of any of these customers would likely negatively affect our financial performance. |
| • | Our sales growth will be adversely affected if we are unable to expand the breadth of our services and products or to introduce new services and products on a timely basis. |
| • | The market for Internet-based services and products in which we operate is highly competitive, and if we cannot compete effectively, our business may be harmed. |
Our History and Corporate Information
Synacor was originally formed as a New York corporation in January 1998 with the name Chek, Inc., or Chek. Chek, an Internet messaging technology provider, designed and managed a proprietary messaging platform that supported the hosting of branded e-mail and time management applications. In December 2000, Chek acquired MyPersonal.com, Inc., or MyPersonal, through a recapitalization and stock swap and changed its name to CKMP, Inc. MyPersonal developed white-label Internet community portals and built and managed a flexible platform for delivering content-rich, branded portals to affinity groups with a focus on the educational marketplace. In July 2001, CKMP, Inc. changed its name to Synacor, Inc., and in November 2002, Synacor re-incorporated under the laws of the State of Delaware. MyPersonal remained a subsidiary of Synacor until May 2007 when it was dissolved. As of the date of this prospectus, Synacor has no subsidiaries.
Our corporate headquarters are located at 40 La Riviere Drive, Suite 300, Buffalo, New York 14202. Our telephone number is (716) 853-1362. Our website address is www.synacor.com. Information contained on our website is not incorporated by reference into this prospectus, and you should not consider information contained on our website to be part of this prospectus or in deciding whether to invest in our common stock.
Synacor® and other trademarks of Synacor appearing in this prospectus are the property of Synacor. All other service marks, trademarks and trade names appearing in this prospectus are the property of their respective holders. We do not intend our use or display of other companies’ trade names or trademarks to imply a relationship with, or endorsement or sponsorship of us by, these other companies.
Industry Data
We make statements in this prospectus about our industry, including statements about historical and projected future high-speed Internet subscribers and usage and online advertising expenditures. We have derived this information from reports and analyses prepared by third-party market research firms, including the following: PwC, Cisco Systems, Inc., or Cisco, Forrester, Google AdSense, DoubleClick, comScore and Veronis Suhler Stevenson, or VSS.
Key Business Metrics
In addition to the line items in our financial statements, we regularly review a number of business metrics related to Internet traffic and search and display advertising to evaluate our business, determine the allocation of resources and make decisions regarding business strategies. Specifically, we measure our business by using the following key business metrics: unique visitors, search queries and advertising impressions. We believe information on these metrics is useful for investors and analysts to understand the underlying trends in our business. For a description of how our key business metrics are defined and measured, see the section titled “Management’s Discussion and Analysis of Financial Condition and Results of Operations—Key Business Metrics.”
5
Table of Contents
The Offering
| Common stock offered by Synacor |
shares |
| Common stock to be outstanding after this offering |
shares |
| Use of proceeds |
We intend to use the net proceeds from this offering for working capital and other general corporate purposes. We may also use a portion of the net proceeds to acquire other businesses, products or technologies. We do not have agreements or commitments for any specific acquisitions at this time. See “Use of Proceeds.” |
| Dividend policy |
We do not anticipate paying cash dividends for the foreseeable future. See “Dividend Policy.” |
| Proposed trading symbol |
SYNC |
The number of shares of our common stock to be outstanding following this offering is based on 39,990,379 shares of our common stock outstanding as of September 30, 2011, which assumes the conversion of all outstanding shares of our preferred stock, but excludes:
| • | 9,929,693 shares of common stock issuable upon exercise of options outstanding as of September 30, 2011 at a weighted average exercise price of $0.93 per share; and |
| • | shares of common stock reserved for future issuance under our 2012 Equity Incentive Plan, which will become effective on the effective date of the registration statement of which this prospectus is a part. |
Unless otherwise indicated, this prospectus reflects and assumes the following:
| • | a 3-for-1 forward split of our common stock that became effective July 31, 2008; |
| • | the automatic conversion of all outstanding shares of our preferred stock into 34,790,277 shares of common stock concurrently with the closing of the offering; |
| • | the filing of our amended and restated certificate of incorporation and the adoption of our amended and restated bylaws immediately prior to the closing of this offering; and |
| • | no exercise by the underwriters of their option to purchase up to an additional shares from Synacor in the offering. |
In addition, we anticipate effecting a -for- stock split prior to the completion of this offering. This prospectus does not reflect the effects of this stock split.
6
Table of Contents
Summary Financial and Other Data
The following tables summarize the financial and other data for our business for the periods presented. You should read this summary financial data in conjunction with “Selected Financial Data,” “Management’s Discussion and Analysis of Financial Condition and Results of Operations” and our financial statements and related notes, all included elsewhere in this prospectus.
We derived the summary financial data for the years ended December 31, 2008, 2009 and 2010 and as of December 31, 2009 and 2010 from our audited financial statements and related notes, which are included in this prospectus. The summary financial data for the nine months ended September 30, 2010 and 2011 and as of September 30, 2011 are derived from our unaudited condensed financial statements appearing elsewhere in this prospectus. We have prepared the unaudited financial data on the same basis as the audited financial statements. We have included, in our opinion, all adjustments, consisting only of normal recurring adjustments, that we consider necessary for a fair presentation of the financial information set forth in those statements. Our historical results are not necessarily indicative of the results that should be expected in the future, and our interim results are not necessarily indicative of the results that should be expected for the full year.
The pro forma basic and diluted net income (loss) per share attributable to common stockholders data for the year ended December 31, 2010 and for the nine months ended September 30, 2011 reflect the conversion of all of our outstanding shares of preferred stock into 34,790,277 shares of common stock in connection with this offering. See Note 1 of Notes to the Financial Statements and Note 1 of Notes to the Condensed Financial Statements—Unaudited for an explanation of the method used to determine the number of shares used in computing pro forma basic and diluted net income (loss) per share.
7
Table of Contents
| Year Ended December 31, | Nine Months Ended September 30, |
|||||||||||||||||||
| 2008 | 2009 | 2010 | 2010 | 2011 | ||||||||||||||||
| Statements of Operations Data: | (in thousands except share and per-share data) | |||||||||||||||||||
| Revenue |
$ | 52,571 | $ | 60,798 | $ | 66,232 | $ | 48,041 | $ | 62,115 | ||||||||||
| Costs and operating expenses: |
||||||||||||||||||||
| Cost of revenue (1) |
28,575 | 34,074 | 36,703 | 26,907 | 32,872 | |||||||||||||||
| Research and development (1)(2) |
12,783 | 13,627 | 18,494 | 13,710 | 14,270 | |||||||||||||||
| Sales and marketing (2) |
5,732 | 5,591 | 6,211 | 4,597 | 5,811 | |||||||||||||||
| General and administrative (1)(2) |
4,997 | 4,966 | 5,656 | 3,941 | 4,887 | |||||||||||||||
| Withdrawn initial public offering expenses |
3,405 | — | — | — | — | |||||||||||||||
| Depreciation |
1,574 | 2,005 | 2,506 | 1,884 | 1,950 | |||||||||||||||
| Other operating expenses |
1,121 | — | — | — | — | |||||||||||||||
|
|
|
|
|
|
|
|
|
|
|
|||||||||||
| Total costs and operating expenses |
58,187 | 60,263 | 69,570 | 51,039 | 59,790 | |||||||||||||||
|
|
|
|
|
|
|
|
|
|
|
|||||||||||
| Income (loss) from operations |
(5,616 | ) | 535 | (3,338 | ) | (2,998 | ) | 2,325 | ||||||||||||
|
|
|
|
|
|
|
|
|
|
|
|||||||||||
| Other income (expense) |
156 | 69 | (2 | ) | (17 | ) | (18 | ) | ||||||||||||
| Interest expense |
294 | 285 | 240 | 189 | 64 | |||||||||||||||
|
|
|
|
|
|
|
|
|
|
|
|||||||||||
| Income (loss) before income taxes |
(5,754 | ) | 319 | (3,580 | ) | (3,204 | ) | 2,243 | ||||||||||||
| Provision for income taxes |
10 | 15 | 11 | 18 | 55 | |||||||||||||||
|
|
|
|
|
|
|
|
|
|
|
|||||||||||
| Net income (loss) |
(5,764 | ) | 304 | (3,591 | ) | (3,222 | ) | 2,188 | ||||||||||||
|
|
|
|
|
|
|
|
|
|
|
|||||||||||
| Undistributed earnings allocated to preferred stockholders |
— | 279 | — | — | 1,903 | |||||||||||||||
|
|
|
|
|
|
|
|
|
|
|
|||||||||||
| Net income (loss) attributable to common stockholders |
$ | (5,764 | ) | $ | 25 | $ | (3,591 | ) | $ | (3,222 | ) | $ | 285 | |||||||
|
|
|
|
|
|
|
|
|
|
|
|||||||||||
| Net income (loss) per share attributable to common stockholders: |
||||||||||||||||||||
| Basic |
$ | (1.70 | ) | $ | 0.01 | $ | (0.96 | ) | $ | (0.87 | ) | $ | 0.07 | |||||||
|
|
|
|
|
|
|
|
|
|
|
|||||||||||
| Diluted |
$ | (1.70 | ) | $ | 0.01 | $ | (0.96 | ) | $ | (0.87 | ) | $ | 0.05 | |||||||
|
|
|
|
|
|
|
|
|
|
|
|||||||||||
| Weighted average shares used to compute net income (loss) per share attributable to common stockholders: |
||||||||||||||||||||
| Basic |
3,380,917 | 3,628,058 | 3,730,588 | 3,711,130 | 4,013,478 | |||||||||||||||
|
|
|
|
|
|
|
|
|
|
|
|||||||||||
| Diluted |
3,380,917 | 44,586,142 | 3,730,588 | 3,711,130 | 44,866,723 | |||||||||||||||
|
|
|
|
|
|
|
|
|
|
|
|||||||||||
| Pro forma net income (loss) per share attributable to common stockholders: |
||||||||||||||||||||
| Basic |
$ | (0.09 | ) | $ | 0.06 | |||||||||||||||
|
|
|
|
|
|||||||||||||||||
| Diluted |
$ | (0.09 | ) | $ | 0.05 | |||||||||||||||
|
|
|
|
|
|||||||||||||||||
| Pro forma weighted average shares used to compute net income (loss) per share attributable to common stockholders: |
||||||||||||||||||||
| Basic |
38,520,865 | 38,803,755 | ||||||||||||||||||
|
|
|
|
|
|||||||||||||||||
| Diluted |
38,520,865 | 44,866,723 | ||||||||||||||||||
|
|
|
|
|
|||||||||||||||||
Notes:
| (1) | Exclusive of depreciation shown separately. |
| (2) | Includes stock-based compensation as follows: |
| Year Ended December 31, | Nine Months Ended September 30, |
|||||||||||||||||||
| 2008 | 2009 | 2010 | 2010 | 2011 | ||||||||||||||||
| (in thousands) | ||||||||||||||||||||
| Research and development |
$ | 221 | $ | 252 | $ | 398 | $ | 278 | $ | 205 | ||||||||||
| Sales and marketing |
142 | 189 | 202 | 140 | 141 | |||||||||||||||
| General and administrative |
305 | 460 | 268 | 187 | 294 | |||||||||||||||
8
Table of Contents
| Years Ended December 31, | Nine Months Ended September 30, |
|||||||||||||||||||
| 2008 | 2009 | 2010 | 2010 | 2011 | ||||||||||||||||
| Other Data: |
||||||||||||||||||||
| Adjusted EBITDA (1) (2) |
$ | (3,374 | ) | $ | 3,441 | $ | 36 | $ | (509 | ) | $ | 4,915 | ||||||||
| Unique Visitors (3) (4) |
7,647,917 | 8,320,500 | 8,235,583 | 8,551,444 | 13,250,013 | |||||||||||||||
| Search Queries (3) (5) |
314,039,915 | 383,871,812 | 453,687,989 | 326,658,368 | 503,476,341 | |||||||||||||||
| Advertising Impressions (3) (6) |
9,432,921,273 | 16,549,485,330 | 18,832,969,669 | 13,769,460,560 | 19,461,422,855 | |||||||||||||||
Notes:
| (1) | We define adjusted EBITDA as net income (loss), plus: provision for income taxes, interest expense, other (income) expense, depreciation, and stock-based compensation. Please see “Adjusted EBITDA” below for more information and for a reconciliation of adjusted EBITDA to net income (loss), the most directly comparable financial measure calculated and presented in accordance with GAAP. |
| (2) | In thousands. |
| (3) | Please see the section titled “Management’s Discussion and Analysis of Financial Condition and Results of Operations—Key Business Metrics” for additional information on unique visitors, search queries and advertising impressions, including how we define and measure these key business metrics. |
| (4) | Reflects the number of unique visitors to our customers’ websites computed on an average monthly basis during the applicable period. |
| (5) | Reflects the total number of search queries during the applicable period. |
| (6) | Reflects the total number of advertising impressions during the applicable period. |
The following table sets forth balance sheet data as of December 31, 2009 and 2010 on an actual basis and as of September 30, 2011:
| • | on an actual basis; |
| • | on a pro forma basis to give effect to the automatic conversion of all outstanding shares of preferred stock into common stock concurrently with the closing of this offering; and |
| • | on a pro forma as adjusted basis to give effect to (i) the conversion of all outstanding shares of preferred stock into common stock concurrently with the closing of this offering and (ii) the receipt of the estimated net proceeds from the sale of shares of common stock offered by us in this offering at an assumed initial public offering price of $ , which is the midpoint of the range of the initial public offering price listed on the cover page of this prospectus, after deducting the estimated underwriting discounts and commissions and estimated offering expenses payable by us, and the filing of our amended and restated certificate of incorporation immediately prior to the closing of this offering. |
| As of December 31, |
As of September 30, 2011 | |||||||||||||||||
| 2009 | 2010 | Actual | Pro Forma |
Pro Forma As Adjusted | ||||||||||||||
| (in thousands) | ||||||||||||||||||
| Balance Sheet Data: |
||||||||||||||||||
| Cash and cash equivalents |
$ | 10,462 | $ | 5,412 | $ | 7,253 | $ | 7,253 | ||||||||||
| Trade receivables, net |
7,773 | 9,654 | 12,004 | 12,004 | ||||||||||||||
| Property and equipment, net |
6,631 | 7,110 | 7,377 | 7,377 | ||||||||||||||
| Total assets |
26,004 | 24,327 | 28,801 | 28,801 | ||||||||||||||
| Long-term bank financing and capital lease obligations |
1,247 | 1,203 | 1,501 | 1,501 | ||||||||||||||
| Convertible preferred stock |
28,432 | 28,432 | 28,432 | — | ||||||||||||||
| Total stockholders’ equity |
13,053 | 10,156 | 13,278 | 13,278 | ||||||||||||||
9
Table of Contents
Adjusted EBITDA
To provide investors with additional information regarding our financial results, we have disclosed within this prospectus adjusted EBITDA, a non-GAAP financial measure. We have provided a reconciliation below of adjusted EBITDA to net income (loss), the most directly comparable GAAP financial measure.
We have included adjusted EBITDA in this prospectus because it is a key measure used by our management and board of directors to understand and evaluate our core operating performance and trends, to prepare and approve our annual budget and to develop short- and long-term operational plans. In particular, the exclusion of certain expenses in calculating adjusted EBITDA can provide a useful measure for period-to-period comparisons of our core business. Additionally, adjusted EBITDA is a key financial measure used by the compensation committee of our board of directors in connection with the payment of bonuses to our executive officers. Accordingly, we believe that adjusted EBITDA provides useful information to investors and others in understanding and evaluating our operating results in the same manner as our management and board of directors.
Our use of adjusted EBITDA has limitations as an analytical tool, and you should not consider it in isolation or as a substitute for analysis of our results as reported under GAAP. Some of these limitations are:
| • | although depreciation is a non-cash charge, the assets being depreciated may have to be replaced in the future, and adjusted EBITDA does not reflect capital expenditure requirements for such replacements or for new capital expenditure requirements; |
| • | adjusted EBITDA does not reflect changes in, or cash requirements for, our working capital needs; |
| • | adjusted EBITDA does not consider the potentially dilutive impact of equity-based compensation; |
| • | adjusted EBITDA does not reflect tax payments that may represent a reduction in cash available to us; and |
| • | other companies, including companies in our industry, may calculate adjusted EBITDA differently, which reduces its usefulness as a comparative measure. |
Because of these limitations, you should consider adjusted EBITDA alongside other financial performance measures, including various cash flow metrics, net income (loss) and our other GAAP results. The following table presents a reconciliation of adjusted EBITDA to net income (loss) for each of the periods indicated:
| Year Ended December 31, | Nine Months Ended September 30, |
|||||||||||||||||||
| 2008 | 2009 | 2010 | 2010 | 2011 | ||||||||||||||||
| (in thousands) | ||||||||||||||||||||
| Reconciliation of Adjusted EBITDA: |
||||||||||||||||||||
| Net income (loss) |
$ | (5,764 | ) | $ | 304 | $ | (3,591 | ) | $ | (3,222 | ) | $ | 2,188 | |||||||
| Provision for income taxes |
10 | 15 | 11 | 18 | 55 | |||||||||||||||
| Interest expense |
294 | 285 | 240 | 189 | 64 | |||||||||||||||
| Other (income) expense (1) |
(156 | ) | (69 | ) | 2 | 17 | 18 | |||||||||||||
| Depreciation |
1,574 | 2,005 | 2,506 | 1,884 | 1,950 | |||||||||||||||
| Stock-based compensation |
668 | 901 | 868 | 605 | 640 | |||||||||||||||
|
|
|
|
|
|
|
|
|
|
|
|||||||||||
| Adjusted EBITDA |
$ | (3,374 | ) | $ | 3,441 | $ | 36 | $ | (509 | ) | $ | 4,915 | ||||||||
|
|
|
|
|
|
|
|
|
|
|
|||||||||||
Note:
| (1) | Other (income) expense consists primarily of interest income earned and foreign exchange gains and losses. |
10
Table of Contents
Investing in our common stock involves a high degree of risk. You should carefully consider the following risk factors and all other information contained in this prospectus before deciding to invest in our common stock. If any of the following events actually occur or risks actually materialize, our business, financial condition or results of operations could be materially and adversely affected. In that case, the trading price of our common stock could decline, and you might lose some or all of your investment.
Risks Related to Our Business
We have a history of significant net losses and may not be profitable in future periods.
We have incurred significant losses in each year of operation other than 2009, including a net loss of $5.8 million in 2008 and a net loss of $3.6 million in 2010. Our net income in 2009 was $0.3 million, and our net income in the nine months ended September 30, 2011 was $2.2 million. We expect that our expenses will increase in future periods as we implement initiatives designed to grow our business including, among other things, the development and marketing of new services and products, licensing of content, expansion of our infrastructure, international expansion and general and administrative expenses associated with being a public company. If our revenue does not sufficiently increase to offset these expected increases in operating expenses, we may incur significant losses and may not be profitable. Our revenue growth in recent periods may not be indicative of our future performance. In fact, in future periods, our revenue could decline. Accordingly, we may not be able to achieve profitability in the future. Any failure to achieve profitability may materially and adversely affect our business, financial condition and results of operations, as well as the trading price of our common stock.
Our search advertising partner, Google, accounts for a significant portion of our revenue, and any loss of, or diminution in, our business relationship with Google would materially and adversely affect our financial performance.
We rely on traffic on our platform to generate search and display advertising revenue, a substantial portion of which is derived from text-based links to advertisers’ websites as a result of Internet searches. We have a revenue-sharing relationship with Google under which we include a Google-branded search tool on our customers’ websites. When a consumer makes a search request using this tool, we deliver it to Google, and Google returns search results to us that include advertiser-sponsored links. If the consumer clicks on a sponsored link, Google receives payment from the sponsor of that link and shares a portion of that payment with us. We then typically share a portion of that payment with the applicable customer. Our Google-related search advertising revenue attributable to our customers, which consists of the portion of the payment from the sponsor that Google shares with us, accounted for approximately 48%, 45% and 49% of our revenue in 2008, 2009 and 2010, or $25.0 million, $27.7 million and $32.6 million, respectively, and approximately 55% of our revenue for the nine months ended September 30, 2011, or $34.0 million. Our agreement with Google expires in February 2014 unless we and Google mutually elect to renew it. Additionally, Google may terminate our agreement if we experience a change in control or enter into an agreement providing for a change in control, if we do not maintain certain search and display advertising revenue levels, or upon the two-year anniversary of the agreement, in February 2013. The consummation of this offering will not constitute a change in control for this purpose. If advertisers were to discontinue their advertising via Internet searches, if Google’s revenue from search-based advertising were to decrease, if Google’s share of the search revenue were to be increased or if our agreement with Google were to be terminated for any reason or renewed on less favorable terms, our business, financial condition and results of operations would be materially and adversely affected.
A loss of any significant customer could negatively affect our financial performance.
We derive a substantial portion of our revenue from a small number of customers. For example, revenue attributable to two customers, Charter Communications Inc., or Charter, and CenturyLink, Inc., or CenturyLink (including our revenue attributable to Qwest Communications International, Inc., or Qwest, which merged with
11
Table of Contents
CenturyLink in April 2011), together accounted for approximately 65%, 62% and 60% of our revenue for the years ended December 31, 2008, 2009 and 2010, or $34.3 million, $37.8 million and $39.8 million, respectively. Revenue attributable to each of these customers accounted for 20% or more in each such period. In addition, revenue attributable to Charter, CenturyLink (including revenue attributable to Qwest) and Toshiba America Information Systems, Inc., or Toshiba, together accounted for approximately 63% of our revenue for the nine months ended September 30, 2011, or $39.1 million, with revenue attributable to two of these customers each accounting for 20% or more in such period and revenue attributable to the third customer accounting for more than 10% in such period. Revenue attributable to these customers includes the subscriber-based revenue earned directly from them, as well as the search and display advertising revenue earned through our relationships with our advertising partners, such as Google, based on traffic generated from our customers’ websites.
Our contracts with our customers generally have an initial term of approximately two to three years from the launch of their websites and frequently provide for one or more automatic renewal terms of one to two years each. Our agreements with both Charter and CenturyLink are currently in such a renewal term. If any one of these key contracts is not renewed or is otherwise terminated, or if revenue from these significant customers declines because of competitive or other reasons, our revenue would decline and our ability to achieve or sustain profitability would be impaired. In addition to loss of subscriber-based revenue, including website and paid content sales, we would also lose significant revenue from the related search and display advertising services that we provide.
Many individuals are using devices other than personal computers and software applications other than Internet browsers to access the Internet. If users of these devices and software applications do not widely adopt the applications and other solutions we develop for them, our business could be adversely affected.
The number of people who access the Internet through devices other than PCs, including tablets, smartphones and connected TVs, has increased dramatically in the past few years and is projected to continue to increase. Similarly, individuals are increasingly accessing the Internet through applications, or apps, other than Internet browsers, such as those available for download through Apple Inc.’s App Store and the Android Market. While we are developing solutions to these alternative means of accessing the Internet, we do not currently offer our customers and their subscribers a wide variety of apps and other non-browser solutions. Additionally, as new devices and new apps are continually being released, it is difficult to predict the problems we may encounter in developing new versions of our apps and other solutions for use on these alternative devices and apps, and we may need to devote significant resources to the creation, support and maintenance of such applications and solutions. If users of these devices and apps do not widely adopt the apps and other solutions we develop, our business, financial condition and results of operations could be adversely affected.
Consumer tastes continually change and are unpredictable, and our sales may decline if we fail to enhance our service and content offerings to achieve continued subscriber acceptance.
Our business depends on aggregating and providing services and content that our customers will place on their websites, including television programming, news, entertainment, sports and other content that their subscribers find engaging, and value added services and paid content that their subscribers will buy. Accordingly, we must continue to invest significant resources in licensing efforts, research and development and marketing to enhance our service and content offerings, and we must make decisions about these matters well in advance of product releases to implement them in a timely manner. Our success depends, in part, on unpredictable and volatile factors beyond our control, including consumer preferences, competing content providers and websites and the availability of other news, entertainment, sports and other services and content. While each consumer’s homepage is set to our applicable customer’s website upon the installation of our customer’s services or the sale of our customer’s product, a consumer may easily change that setting, which would likely decrease the use of our platform. If our services are not responsive to the requirements of our customers or the preferences of their consumers, or the services are not brought to market in a timely and effective manner, our business, financial condition and results of operations would be harmed. Even if our services and content are successfully introduced
12
Table of Contents
and initially adopted, a subsequent shift in the preferences of our customers or their consumers could cause a decline in the popularity of our services and content that could materially reduce our revenue and harm our business, financial condition and results of operations.
Our sales growth will be adversely affected if we are unable to expand the breadth of our services and products or to introduce new services and products on a timely basis.
To retain our existing customers, attract new customers and increase revenue, we must continue to develop and introduce new services and products on a timely basis and continue to develop additional features to our existing product base. If our existing and prospective customers do not perceive that we will deliver our services and products on schedule, and if they do not perceive our services and products to be of sufficient value and quality, we may lose the confidence of our existing customers and fail to increase sales to these existing customers, and we may not be able to attract new customers, each of which would adversely affect our operating results.
Our sales cycles and the contracting process with new customers are long and unpredictable and may require us to incur expenses before executing a customer agreement, which makes it difficult to project when, if at all, we will obtain new customers and when we will generate additional revenue and cash flows from those customers.
We market our services and products directly to high-speed Internet service providers and consumer electronics manufacturers. New customer relationships typically take time to obtain and finalize. Due to operating procedures in many organizations, a significant time period may pass between selection of our services and products by key decision-makers and the signing of a contract. The length of time between the initial customer sales call and the realization of significant sales is difficult to predict and can range from several months to several years. As a result, it is difficult to predict when we will obtain new customers and when we will begin to generate revenue and cash flows from these potential new customers.
As part of our sales cycle, we may incur significant expenses in the form of compensation and related expenses and equipment acquisition before executing a definitive agreement with a prospective customer so that we may be ready to launch shortly following execution of a definitive agreement. If conditions in the marketplace generally or with a specific prospective customer change negatively, it is possible that no definitive agreement will be executed, and we will be unable to recover any expenses incurred before a definitive agreement is executed, which would in turn have an adverse effect on our business, financial condition and results of operations.
Most of our customers are high-speed Internet service providers, and consolidation within the cable and telecommunications industries could adversely affect our business, financial condition and results of operations.
Our revenue from high-speed Internet service providers, including our search and display advertising revenue generated by online consumer traffic on our platform, accounted for more than 95% of our revenue in each of 2008, 2009 and 2010 and nearly 90% in the nine months ended September 30, 2011. The cable and telecommunications industries have experienced consolidation over the past several years, and we expect that this trend will continue. As a result of consolidation, some of our customers may be acquired by companies with which we do not have existing relationships and which may have relationships with one of our competitors or may have the in-house capacity to perform the services we provide. As a result, such acquisitions could cause us to lose customers and the associated subscriber-based and search and display advertising revenue. Additionally, under certain of our customer agreements, including our agreement with CenturyLink, the customer has a right to terminate the agreement if it experiences a change in control.
Consolidation may also require us to renegotiate our agreements with our customers as a result of enhanced customer leverage. We may not be able to offset the effects of any such renegotiations, and we may not be able to attract new customers to counter any revenue declines resulting from the loss of customers or their subscribers.
13
Table of Contents
As technology continues to evolve, the use of our products by our current and prospective consumer electronics manufacturer customers may decrease and our business could be adversely affected.
The consumer electronics industry is subject to rapid change, and our contract with our one current consumer electronics manufacturer customer is not exclusive. As consumer electronics manufacturers continue to develop new technologies and introduce new models and devices, there can be no assurance that we will be able to develop solutions that will persuade consumer electronics manufacturers that are our customers at such time to utilize our platform for those new devices. If our current and prospective consumer electronics manufacturer customers elect not to integrate our solutions into their new products, our business, financial condition and results of operations could be adversely affected.
We invest in features and functionality designed to increase consumer engagement with our customers’ websites; however, these investments may not lead to increased revenue.
Our future growth and profitability will depend in large part on the effectiveness and efficiency of our efforts to provide a compelling consumer experience that increases consumer engagement with our platform. We have made and will continue to make substantial investments in features and functionality for our platform that are designed to drive consumer engagement. Not all of these activities directly generate revenue, and we cannot assure you that we will reap sufficient rewards from these investments to make them worthwhile. If the expenses that we incur in connection with these activities do not result in increased consumer engagement that in turn results in revenue increases that exceed these expenses, our business, financial condition and results of operations will be adversely affected.
Our services and products may become less competitive or even obsolete if we fail to respond to technological developments.
Our future success will depend, in part, on our ability to modify or enhance our services and products to meet customer and consumer needs, to add functionality and to address technological advancements that would improve their performance. For example, if our services and products do not adapt to the increasing video usage on the Internet or to take into account evolving developments in social networking, then they could begin to appear obsolete. Similarly, if we fail to develop new ways to deliver content and services through apps other than traditional Internet browsers, consumers could seek alternative means of accessing content and services.
To remain competitive, we will need to develop new services and products and adapt our existing ones to address these and other evolving technologies and standards. However, we may be unsuccessful in identifying new opportunities or in developing or marketing new services and products in a timely or cost-effective manner. In addition, our product innovations may not achieve the market penetration or price levels necessary for profitability. If we are unable to develop enhancements to, and new features for, our existing services and products or if we are unable to develop new services and products that keep pace with rapid technological developments or changing industry standards, our services and products may become obsolete, less marketable and less competitive, and our business will be harmed.
We depend on third parties for content that is critical to our business, and our business could suffer if we do not continue to obtain high-quality content at a reasonable cost.
We license the content that we aggregate on our platform from numerous third-party content providers, and our future success is highly dependent upon our ability to maintain and enter into new relationships with these and other content providers. In the future, some of our content providers may not give us access to high-quality content, may fail to adapt to changes in consumer tastes or may increase the royalties, fees or percentages that they charge us for their content, any of which could have a material negative effect on our operating results. Our rights to the content that we offer to our customers and their consumers are not exclusive, and the content providers could license their content to our competitors. Our content providers could even grant our competitors
14
Table of Contents
exclusive licenses. In addition, our customers are not prohibited from entering into content deals directly with our content providers. Any failure to enter into or maintain satisfactory arrangements with content providers would adversely affect our ability to provide a variety of attractive services and products to our customers. Our reputation and operating results could suffer as a result, and it may be more difficult for us to develop new relationships with potential customers. Our costs as a percentage of revenue may also increase due to price competition.
Our quarterly revenue and operating results can fluctuate, and if we fail to meet or exceed the expectations of securities analysts or investors, our stock price and the value of your investment could decline substantially.
As a result of the rapidly changing nature of the markets in which we compete, our quarterly revenue and operating results are likely to fluctuate from period to period. These fluctuations may be caused by a number of factors, many of which are beyond our control, including:
| • | any failure to maintain strong relationships and favorable revenue-sharing arrangements with our search and display advertising partners, in particular Google, including a reduction in the quantity or pricing of sponsored links that consumers click on or a reduction in the pricing of display advertisements by advertisers; |
| • | any failure of significant customers to renew their agreements with us; |
| • | our ability to attract new customers; |
| • | our ability to increase sales of value added services and paid content to existing subscribers; |
| • | the timing and success of new service and product introductions by us, our customers or our competitors; |
| • | variations in the demand for our services and products and the implementation cycles of our services and products by our customers; |
| • | changes in our pricing policies or those of our competitors; |
| • | changes in the prices our customers charge for value added services and paid content; |
| • | service outages, other technical difficulties or security breaches; |
| • | limitations relating to the capacity of our networks, systems and processes; |
| • | our failure to accurately estimate or control costs, including costs related to the initial launch of new customers on our platform; |
| • | maintaining appropriate staffing levels and capabilities relative to projected growth; |
| • | the timing of costs related to the development or acquisition of technologies, services or businesses to support our existing customers and potential growth opportunities; and |
| • | general economic, industry and market conditions and those conditions specific to Internet usage and online businesses. |
Because the market for our services and products is relatively new and rapidly changing, it is difficult to predict future financial results. For these reasons, you should not rely on period-to-period comparisons of our financial results, if any, as indications of future results. Our future operating results could fall below the expectations of securities analysts or investors and significantly reduce the trading price of our common stock. Fluctuations in our operating results will likely increase the volatility of our stock price.
15
Table of Contents
Expansion into international markets, which is an important part of our strategy, but where we have limited experience, will subject us to risks associated with international operations.
We plan to expand our product offerings internationally, particularly in Europe and, over the long term, in Asia and Latin America. We have limited experience in marketing and operating our services and products in international markets, and we may not be able to successfully develop our business in these markets. Our success in these markets will be directly linked to the success of relationships with potential customers, content partners and other third parties.
As the international markets in which we plan to operate continue to grow, we expect that competition in these markets will intensify. Local companies may have a substantial competitive advantage because of their greater understanding of, and focus on, the local markets. Some of our domestic competitors who have substantially greater resources than we do may be able to more quickly and comprehensively develop and grow in international markets. International expansion may also require significant financial investment including, among other things, the expense of developing localized products, the costs of acquiring foreign companies and the integration of such companies with our operations, expenditure of resources in developing customer and content relationships and the increased costs of supporting remote operations.
Other risks of doing business in international markets include the increased risks and burdens of complying with different legal and regulatory standards, difficulties in managing and staffing foreign operations, recruiting and retaining talented direct sales personnel, limitations on the repatriation of funds and fluctuations of foreign exchange rates, varying levels of Internet technology adoption and infrastructure, and our ability to enforce contracts in foreign jurisdictions. In addition, our success in international expansion could be limited by barriers to international expansion such as tariffs, adverse tax consequences and technology export controls. If we cannot manage these risks effectively, the costs of doing business in some international markets may be prohibitive or our costs may increase disproportionately to our revenue.
Our agreements with some of our customers and content providers require fixed payments, which could adversely affect our financial performance.
Certain of our agreements with customers and content providers require us to make fixed payments to them. As of September 30, 2011, the aggregate amount of such fixed payments for the years ending December 31, 2011 and 2012 are approximately $6.9 million and $4.3 million, respectively. We are required to make these fixed payments regardless of the achievement of any revenue objectives or subscriber or usage levels. If we do not achieve our financial objectives, these contractual commitments would constitute a greater percentage of our revenue than originally anticipated and would adversely affect our profitability.
Our agreements with some of our customers and content providers contain penalties for non-performance, which could adversely affect our financial performance.
We have entered into service level agreements with most of our customers. These agreements generally call for specific system “up times” and 24 hours per day, seven days per week support and include penalties for non-performance. We may be unable to fulfill these commitments due to circumstances beyond our control, which could subject us to substantial penalties under those agreements, harm our reputation and result in a reduction of revenue or the loss of customers, which would in turn have an adverse effect on our business, financial condition and results of operations. To date, we have never incurred any material penalties.
System failures or capacity constraints could harm our business and financial performance.
The provision of our services and products depends on the continuing operation of our information technology and communications systems. Any damage to or failure of our systems could result in interruptions in our service. Such interruptions could harm our business, financial condition and results of operations, and our
16
Table of Contents
reputation could be damaged if people believe our systems are unreliable. Our systems are vulnerable to damage or interruption from snow storms, terrorist attacks, floods, fires, power loss, telecommunications failures, security breaches, computer malware, computer hacking attacks, computer viruses, computer denial of service attacks or other attempts to, or events that, harm our systems. Our data center is also subject to break-ins, sabotage and intentional acts of vandalism and to potential disruptions if the operators of the facility have financial difficulties. Although we maintain insurance to cover a variety of risks, the scope and amount of our insurance coverage may not be sufficient to cover our losses resulting from system failures or other disruptions to our online operations. For example, the limit on our business interruption insurance is approximately $5.0 million. Any system failure or disruption and any resulting losses that are not recoverable under our insurance policies may materially harm our business, financial condition and results of operations. To date, we have never experienced any material losses.
Although we regularly back-up our systems and store the system back-ups in Atlanta, Georgia and Buffalo, New York, we do not have full second-site redundancy. If we were forced to relocate to an alternate site and to rely on our system back-ups to restore the systems, we would experience significant delays in restoring the functionality of our platform and could experience loss of data, which could materially harm our business and our operating results.
Security breaches, computer viruses and computer hacking attacks could harm our business, financial condition and results of operations.
Security breaches, computer malware and computer hacking attacks are prevalent in the technology industry. Any security breach caused by hacking, which involves efforts to gain unauthorized access to information or systems, or to cause intentional malfunctions or loss or corruption of data, software, hardware or other computer equipment, and the inadvertent transmission of computer viruses could harm our business, financial condition and results of operations. We have previously experienced hacking attacks on our systems, and may in the future experience hacking attacks. Though it is difficult to determine what harm may directly result from any specific interruption or breach, any failure to maintain performance, reliability, security and availability of our platform infrastructure to the satisfaction of our customers and their subscribers may harm our reputation and our ability to retain existing customers and attract new customers.
We may not maintain acceptable website performance for all of our customers’ consumers, which may negatively impact our relationships with our customers and harm our business, financial condition and results of operations.
A key element to our continued growth is the ability of our customers’ consumers in all geographies to access our platform within acceptable load times. We refer to this as website performance. We may in the future experience platform disruptions, outages and other performance problems due to a variety of factors, including infrastructure changes, human or software errors, capacity constraints due to an overwhelming number of users accessing our platform simultaneously, and denial of service or fraud or security attacks. In some instances, we may not be able to identify the cause or causes of these website performance problems within an acceptable period of time. It may become increasingly difficult to maintain and improve website performance, especially during peak usage times, and as our solutions become more complex and our user traffic increases. If our customers’ websites are unavailable when consumers attempt to access them or do not load as quickly as they expect, consumers may seek other websites to obtain the information for which they are looking, and may not return to our customers’ websites as often in the future, or at all. This would negatively impact our relationships with our customers. We expect to continue to make significant investments to maintain and improve website performance. To the extent that we do not effectively address capacity constraints, upgrade our systems as needed and continually develop our technology and network architecture to accommodate actual and anticipated changes in technology, our business and operating results may be harmed.
17
Table of Contents
We rely on our management team and need additional personnel to expand our business, and the loss of key officers or an inability to attract and retain qualified personnel could harm our business, financial condition and results of operations.
We depend on the continued contributions of our senior management and other key personnel, especially Ronald N. Frankel, our chief executive officer, George G. Chamoun, our executive vice president of sales and marketing, Scott A. Bailey, our chief operating officer, and William J. Stuart, our chief financial officer. The loss of the services of any of our executive officers or other key employees could harm our business and our prospects. All of our executive officers and key employees are at-will employees, which means they may terminate their employment relationship with us at any time.
Our future success also depends on our ability to identify, attract and retain highly skilled technical, managerial, finance, marketing and creative personnel. For example, we will need to hire personnel outside the United States to pursue an international expansion strategy, and we will need to hire additional advertising salespeople in connection with our own plans to sell more advertisements directly. We face intense competition for qualified individuals from numerous technology, marketing and media companies, and we may incur significant costs to attract them. We may be unable to attract and retain suitably qualified individuals, or we may be required to pay increased compensation in order to do so. If we were to be unable unable to attract and retain the qualified personnel we need to succeed, our business could suffer.
Volatility or lack of performance in the trading price of our common stock following the consummation of this offering may also affect our ability to attract and retain qualified personnel. Many of our senior management personnel and other key employees have become, or will become, vested in a substantial amount of stock or stock options. Employees may be more likely to leave us if the shares they own or the shares underlying their options have significantly appreciated in value relative to the original purchase prices of the shares or the exercise prices of the options or if the exercise prices of the options that they hold are significantly above the trading price of our common stock. If we are unable to retain our employees, our business, financial condition and results of operations would be harmed.
If we fail to manage our growth effectively, our business, financial condition and results of operations may suffer.
Following the merger of our predecessor companies, Chek and MyPersonal, to form Synacor, we have expanded our business through organic growth. We expect to continue to grow organically, and we may choose to grow through strategic acquisitions in the future. This growth has placed, and may continue to place, significant demands on our management and our operational and financial infrastructure. Our ability to manage our growth effectively and to integrate new technologies and acquisitions into our existing business will require us to continue to expand our operational, financial and management information systems and to continue to retain, attract, train, motivate and manage key employees. Continued growth could strain our ability to:
| • | develop and improve our operational, financial and management controls; |
| • | enhance our reporting systems and procedures; |
| • | recruit, train and retain highly skilled personnel; |
| • | maintain our quality standards; and |
| • | maintain customer and content owner satisfaction. |
Managing our growth will require significant expenditures and allocation of valuable management resources. If we fail to achieve the necessary level of efficiency in our organization as it grows, our business, financial condition and results of operations would be harmed.
18
Table of Contents
We may expand our business through acquisitions of, or investments in, other companies or new technologies, which may divert our management’s attention or prove not to be successful.
We may decide to pursue acquisitions of other businesses in the future. Such acquisitions could divert our management’s time and focus from operating our business. In addition, integrating an acquired company, business or technology is risky and may result in unforeseen operating difficulties and expenditures, including, among other things, with respect to:
| • | incorporating new technologies into our existing business infrastructure; |
| • | consolidating corporate and administrative functions; |
| • | coordinating our sales and marketing functions to incorporate the new business or technology; |
| • | maintaining morale, retaining and integrating key employees to support the new business or technology and managing our expansion in capacity; and |
| • | maintaining standards, controls, procedures and policies (including effective internal controls over financial reporting and disclosure controls and procedures). |
In addition, a significant portion of the purchase price of companies we may acquire may be allocated to acquired goodwill and other intangible assets, which must be assessed for impairment at least annually. In the future, if our acquisitions do not yield expected returns, we may be required to take charges to our earnings based on this impairment assessment process, which could harm our operating results.
Future acquisitions could result in potentially dilutive issuances of our equity securities, including our common stock, or the incurrence of debt, contingent liabilities, amortization expenses or acquired in-process research and development expenses, any of which could harm our business, financial condition and results of operations. Future acquisitions may also require us to obtain additional financing, which may not be available on favorable terms or at all.
We may require additional capital to grow our business, and this capital may not be available on acceptable terms or at all.
We have historically relied on outside financing, principally equity investments by venture capital investors, which comprise a substantial majority of our existing stockholders and, to a lesser degree, cash flows from operations, to fund our operations, capital expenditures and expansion. In the future, the operation of our business and our growth strategy may require significant additional capital, especially if we were to accelerate our expansion and acquisition plans. If the cash generated from operations and from this offering are not sufficient to meet our capital requirements, we will need to seek additional capital, potentially through debt or equity financings, to fund our growth. We may not be able to raise needed capital on terms acceptable to us or at all. Financings, if available, may be on terms that are dilutive or potentially dilutive to our stockholders, and the prices at which new investors would be willing to purchase our securities may be lower than the initial public offering price, in which case our existing stockholders may suffer substantial dilution. The holders of new securities may also receive rights, preferences or privileges that are senior to those of existing holders of our common stock. Any debt financing obtained by us in the future could contain restrictive covenants that may potentially restrict our operations, and if we do not effectively manage our business to comply with those covenants, our business, financial condition and results of operations could be adversely affected. If new sources of financing are required but are insufficient or unavailable, we could be required to delay, abandon or otherwise modify our growth and operating plans to the extent of available funding, which would harm our ability to grow our business.
Our business depends, in part, on our ability to protect and enforce our intellectual property rights.
The protection of our intellectual property is critical to our success. We rely on copyright and service mark enforcement, contractual restrictions and trade secret laws to protect our proprietary rights. We have
19
Table of Contents
entered into confidentiality and invention assignment agreements with our employees and contractors, and nondisclosure agreements with certain parties with whom we conduct business to limit access to and disclosure of our proprietary information. However, if we are unable to adequately protect our intellectual property, our business may suffer from the piracy of our technology and the associated loss in revenue.
Protecting against the unauthorized use of our intellectual property and other proprietary rights is expensive, difficult and, in some cases, impossible. Litigation may be necessary in the future to enforce or defend our intellectual property rights, to protect our trade secrets or to determine the validity and scope of the proprietary rights of others. Such litigation could be costly and divert management resources, either of which could harm our business. Furthermore, many of our current and potential competitors have the ability to dedicate substantially greater resources to enforce their intellectual property rights than we do. Accordingly, despite our efforts, we may not be able to prevent third parties from infringing upon or misappropriating our intellectual property.
We are not currently involved in any legal proceedings with respect to protecting our intellectual property; however, we may from time to time become a party to various legal proceedings with respect to protecting our intellectual property arising in the ordinary course of our business.
Any claims from a third party that we are infringing upon its intellectual property, whether valid or not, could subject us to costly and time-consuming litigation or expensive licenses or force us to curtail some services or products.
Companies in the Internet and technology industries tend to own large numbers of patents, copyrights, trademarks and trade secrets, and frequently enter into litigation based on allegations of infringement or other violations of intellectual property rights. We have been subject to claims that the presentation of certain licensed content on our customer’s websites infringes certain patents of a third party, none of which have resulted in direct settlement or payments by us or any determination of infringement by us, and as we face increasing competition, the possibility of further intellectual property rights claims against us grows. Our technologies may not be able to withstand any third party claims or rights against their use. Any intellectual property claims, with or without merit, could be time-consuming, expensive to litigate or settle and could divert management resources and attention. An adverse determination also could prevent us from offering our services and products to others and may require that we procure substitute products or services for our customers.
In the case of any intellectual property rights claim, we may have to pay damages or stop using technology found to be in violation of a third party’s rights. We may have to seek a license for the technology, which may not be available to us on reasonable terms and may significantly increase our operating expenses. The technology also may not be available for license to us at all. As a result, we may also be required to develop alternative non-infringing technology, which could require significant effort and expense. If we cannot license or develop technology for the infringing aspects of our business, we may be forced to limit our service and product offerings and may be unable to compete effectively. Any of these consequences could harm our operating results.
In addition, we typically have contractual obligations to our customers to indemnify and defend them with respect to third-party intellectual property infringement claims that arise from our customers’ use of our products or services. Such claims, whether valid or not, could harm our relationships with our customers, have resulted and could result in the future in us or our customers having to enter into licenses with the claimants and have caused and could cause us in the future to incur additional costs or reduced revenues. Such claims could also subject us to costly and time-consuming litigation as well as diverting management attention and resources. Satisfying our contractual indemnification obligations could also give rise to significant liability, and thus harm our business and our operating results.
We are not currently subject to any legal proceedings with respect to third party claims that we or our customers’ use of our products and services are infringing upon their intellectual property; however, we may from time to time become a party to various legal proceedings with respect to such claims arising in the ordinary course of our business.
20
Table of Contents
Any unauthorized disclosure or theft of personal information we gather could harm our reputation and subject us to claims or litigation.
We collect, and have access to, personal information of subscribers, including names, addresses, account numbers, credit card numbers and e-mail addresses. Unauthorized disclosure of personal information regarding website visitors, whether through breach of our systems by an unauthorized party, employee theft or misuse, or otherwise, could harm our business. If there were an inadvertent disclosure of personal information, or if a third party were to gain unauthorized access to the personal information we possess, our operations could be seriously disrupted and we could be subject to claims or litigation arising from damages suffered by subscribers or our customers. In addition, we could incur significant costs in complying with the multitude of state, federal and foreign laws regarding the unauthorized disclosure of personal information. Finally, any perceived or actual unauthorized disclosure of the information we collect could harm our reputation, substantially impair our ability to attract and retain customers and have an adverse impact on our business.
We collect and may access personal information and other data, which subjects us to governmental regulation and other legal obligations related to privacy, and our actual or perceived failure to comply with such obligations could harm our business.
We collect, and have access to, personal information of subscribers, including names, addresses, account numbers, credit card numbers and e-mail addresses. There are numerous federal, state and local laws around the world regarding privacy and the storing, sharing, use, processing, disclosure and protection of personal information and other subscriber data, the scope of which are changing, subject to differing interpretations, and may be inconsistent between countries or conflict with other rules. We generally comply with industry standards and are subject to the terms of our privacy policies and privacy-related obligations to third parties (including voluntary third-party certification bodies such as TRUSTe). We strive to comply with all applicable laws, policies, legal obligations and industry codes of conduct relating to privacy and data protection to the extent possible. However, it is possible that these obligations may be interpreted and applied in a manner that is inconsistent from one jurisdiction to another and may conflict with other rules or our practices. Any failure or perceived failure by us to comply with our privacy policies, our privacy-related obligations to users or other third parties, or our privacy-related legal obligations, or any compromise of security that results in the unauthorized release or transfer of personal information or other subscriber data, may result in governmental enforcement actions, litigation or public statements against us by consumer advocacy groups or others and could cause our customers to lose trust in us, which could have an adverse effect on our business. Additionally, if third parties we work with, such as customers, vendors or developers, violate applicable laws or our policies, such violations may also put subscriber information at risk and could in turn have an adverse effect on our business.
Any failure to convince advertisers of the benefits of advertising with us would harm our business, financial condition and results of operations.
We have derived and expect to continue to derive a substantial portion of our revenue from display advertising on our platform. Such advertising accounted for approximately 14%, 19% and 20% of our revenue for the years ended December 31, 2008, 2009 and 2010, respectively, and approximately 23% of our revenue for the nine months ended September 30, 2011. Our ability to attract and retain advertisers and, ultimately, to generate advertising revenue depends on a number of factors, including:
| • | increasing the numbers of consumers using our platform; |
| • | maintaining consumer engagement on those websites; |
| • | competing effectively for advertising spending with other online and offline advertising providers; and |
| • | continuing to grow our direct advertising sales force and develop and diversify our advertising platform. |
21
Table of Contents
If we are unable to provide high-quality advertising opportunities and convince advertisers and agencies of our value proposition, we may not be able to retain existing advertisers or attract new ones, which would harm our business, financial condition and results of operations.
Migration of high-speed Internet service providers’ subscribers from one high-speed Internet service provider to another could adversely affect our business, financial condition and results of operations.
Our high-speed Internet service provider customers’ subscribers may become dissatisfied with their current high-speed Internet service provider and may switch to another provider. In the event that there is substantial subscriber migration from our existing customers to service providers with which we do not have relationships, the fees that we receive on a per-subscriber basis, and the related search and display advertising revenue, could decline.
Investors could lose confidence in our financial reports and the trading price of our common stock may be adversely affected if our internal controls over financial reporting are found by management or by our independent registered public accounting firm not to be adequate.
Effective internal controls are necessary for us to provide reliable financial reports and prevent fraud. In addition, Section 404 of the Sarbanes-Oxley Act of 2002, or the Sarbanes-Oxley Act, will require us to evaluate and report on our internal control over financial reporting beginning with our Annual Report on Form 10-K for the year ending December 31, 2012. We have begun the process of preparing an internal plan for compliance with Section 404 and strengthening and testing our system of internal controls to provide the basis for our report. The process of implementing our internal controls and complying with Section 404 will be expensive and time-consuming, and will require significant attention of management. We cannot be certain that these measures will ensure that we implement and maintain adequate controls over our financial processes and reporting in the future. Even if we conclude our internal control over financial reporting provides reasonable assurance regarding the reliability of financial reporting and the preparation of financial statements for external purposes in accordance with GAAP, because of its inherent limitations, internal control over financial reporting may not prevent or detect fraud or misstatements. Failure to implement required new or improved controls, or difficulties encountered in their implementation, could harm our operating results or cause us to fail to meet our reporting obligations.
In addition, a delay in compliance with Section 404 could subject us to a variety of administrative sanctions, including ineligibility for short-form resale registration, action by the SEC, the suspension or delisting of our common stock from and the inability of registered broker-dealers to make a market in our common stock, which would further reduce the trading price of our common stock and could harm our business.
Our ability to use our net operating loss carryforwards and certain other tax attributes may be limited.
As of September 30, 2011, we had substantial federal and state net operating loss carryforwards. Under Sections 382 and 383 of the Internal Revenue Code of 1986, as amended, or the Code, if a corporation undergoes an “ownership change,” the corporation’s ability to use its pre-change net operating loss carryforwards to offset its post-change income and taxes may be limited. In general, an “ownership change” generally occurs if there is a cumulative change in our ownership by “five-percent stockholders” that exceeds 50 percentage points over a rolling three-year period. For these purposes, a five-percent stockholder is generally any person or group of persons that at any time during the applicable testing period has owned 5% or more of our outstanding stock. In addition, persons who own less than 5% of the outstanding stock are grouped together as one or more “public groups,” which are also treated as five-percent stockholders. Similar rules may apply under state tax laws. We may experience ownership changes in the future as a result of this issuance or future transactions in our stock, some of which may be outside our control. As a result, our ability to use our pre-change net operating loss carryforwards to offset United States federal and state taxable income and taxes may be subject to limitations.
22
Table of Contents
Risks Related to Our Industry
The growth of the market for our services and products depends on the continued growth of the Internet as a medium for content, advertising, commerce and communications.
Expansion in the sales of our services and products depends on the continued acceptance of the Internet as a platform for content, advertising, commerce and communications. The acceptance of the Internet as a medium for such uses could be adversely impacted by delays in the development or adoption of new standards and protocols to handle increased demands of Internet activity, security, privacy protection, reliability, cost, ease of use, accessibility and quality of service. The performance of the Internet and its acceptance as such a medium has been harmed by viruses, worms, and similar malicious programs, and the Internet has experienced a variety of outages and other delays as a result of damage to portions of its infrastructure. If for any reason the Internet does not remain a medium for widespread content, advertising, commerce and communications, the demand for our services and products would be significantly reduced, which would harm our business.
The growth of the market for our services and products depends on the development and maintenance of the Internet infrastructure.
Our business strategy depends on continued Internet and high-speed Internet access growth. Any downturn in the use or growth rate of the Internet or high-speed Internet access would be detrimental to our business. If the Internet continues to experience significant growth in number of users, frequency of use and amount of data transmitted, the Internet infrastructure might not be able to support the demands placed on it and the performance or reliability of the Internet may be adversely affected. The success of our business therefore depends on the development and maintenance of a sound Internet infrastructure. This includes maintenance of a reliable network backbone with the necessary speed, data capacity and security, as well as timely development of complementary products, such as routers, for providing reliable Internet access and services. Consequently, as Internet usage increases, the growth of the market for our products depends upon improvements made to the Internet as well as to individual customers’ networking infrastructures to alleviate overloading and congestion. In addition, any delays in the adoption of new standards and protocols required to govern increased levels of Internet activity or increased governmental regulation may have a detrimental effect on the Internet infrastructure.
A substantial majority of our revenue is derived from search and display advertising; our revenue would decline if advertisers do not continue their usage of the Internet as an advertising medium.
We have derived and expect to continue to derive a substantial majority of our revenue from search and display advertising on our platform. Such search and display advertising revenue accounted for approximately 61%, 65% and 69% of our revenue for the years ended December 31, 2008, 2009 and 2010, or $32.2 million, $39.3 million and $45.9 million, respectively, and approximately 77% of our revenue for the nine months ended September 30, 2011, or $48.0 million. However, the prospects for continued demand and market acceptance for Internet advertising are uncertain. If advertisers do not continue to increase their usage of the Internet as an advertising medium, our revenue would decline. Advertisers that have traditionally relied on other advertising media may not advertise on the Internet. Most advertising agencies and potential advertisers, particularly local advertisers, have only limited experience advertising on the Internet and devote only a small portion of their advertising expenditures to online advertising. As the Internet evolves, advertisers may find online advertising to be a less attractive or less effective means of promoting their services and products than traditional methods of advertising and may not continue to allocate funds for Internet advertising. Many historical predictions by industry analysts and others concerning the growth of the Internet as a commercial medium have overstated the growth of the Internet and you should not rely upon them. This growth may not occur or may occur more slowly than estimated.
Most of our search revenue is based on the number of paid “clicks” on sponsored links that are included in search results generated from our platform. Generally, each time a consumer clicks on a sponsored link, the
23
Table of Contents
search provider that provided the commercial search result receives a fee from the advertiser who paid for such commercial click and the search provider pays us a portion of that fee. We, in turn, typically share a portion of the fee we receive with our customer. If an advertiser receives what it perceives to be a large number of clicks for which it needs to pay, but that do not result in a desired activity or an increase in sales, the advertiser may reduce or eliminate its advertisements through the search provider that provided the commercial search result to us. This reaction would lead to a loss of revenue to our search providers and consequently to lesser fees paid to us, which would have a material negative effect on our financial results.
Market prices for online advertising may decrease due to competitive or other factors. In addition, if a large number of Internet users use filtering software programs that limit or remove advertising from the users’ view, advertisers may perceive that Internet advertising is not effective and may choose not to advertise on the Internet.
The market for Internet-based services and products in which we operate is highly competitive, and if we cannot compete effectively, our sales may decline and our business may be harmed.
Competition in the market for Internet-based services and products in which we operate is intense and involves rapidly changing technologies and customer and subscriber requirements, as well as evolving industry standards and frequent product introductions. Our competitors may develop solutions that are similar or superior to our technology. Our primary competitors include high-speed Internet service providers with internal information technology staff capable of developing solutions similar to our technology. Other competitors include Yahoo! Inc., or Yahoo!, Google, AOL LLC, or AOL, and MSN, a division of Microsoft Corporation, or Microsoft. Advantages some of our existing and potential competitors hold over us include the following:
| • | significantly greater revenue and financial resources; |
| • | stronger brand and consumer recognition; |
| • | the capacity to leverage their marketing expenditures across a broader portfolio of services and products; |
| • | more extensive proprietary intellectual property from which they can develop or aggregate content without having to pay fees or paying significantly lower fees than we do; |
| • | pre-existing relationships with content providers that afford them access to content while blocking the access of competitors to that same content; |
| • | pre-existing relationships with high-speed Internet service providers that afford them the opportunity to convert such providers to competing services and products; |
| • | lower labor and development costs; and |
| • | broader global distribution and presence. |
If we are unable to compete effectively or we are not as successful as our competitors in our target markets, our sales could decline, our margins could decline and we could lose market share, any of which would materially harm our business, financial condition and results of operations.
Government regulation of the Internet continues to evolve, and new laws and regulations could significantly harm our financial performance.
Today, there are relatively few laws specifically directed towards conducting business over the Internet. We expect more stringent laws and regulations relating to the Internet to be enacted. The adoption or modification
24
Table of Contents
of laws related to the Internet could harm our business, financial condition and results of operations by, among other things, increasing our costs and administrative burdens. Due to the increasing popularity and use of the Internet, many laws and regulations relating to the Internet are being debated at the international, federal and state levels, which are likely to address a variety of issues such as:
| • | user privacy and expression; |
| • | ability to collect and/or share necessary information that allows us to conduct business on the Internet; |
| • | export compliance; |
| • | pricing and taxation; |
| • | fraud; |
| • | advertising; |
| • | intellectual property rights; |
| • | consumer protection; |
| • | protection of minors; |
| • | content regulation; |
| • | information security; and |
| • | quality of services and products. |
Several federal laws that could have an impact on our business have been adopted. The Digital Millennium Copyright Act of 1998 reduces the liability of online service providers of third-party content, including content that may infringe copyrights or rights of others. The Children’s Online Privacy Protection Act imposes additional restrictions on the ability of online services to collect user information from minors. In addition, the Protection of Children from Sexual Predators Act requires online service providers to report evidence of violations of federal child pornography laws under certain circumstances.
It could be costly for us to comply with existing and potential laws and regulations, and they could harm our marketing efforts and our attractiveness to advertisers by, among other things, restricting our ability to collect demographic and personal information from consumers or to use or disclose that information in certain ways. If we were to violate these laws or regulations, or if it were alleged that we had, we could face private lawsuits, fines, penalties and injunctions and our business could be harmed.
Finally, the applicability to the Internet and other online services of existing laws in various jurisdictions governing issues such as property ownership, sales and other taxes, libel and personal privacy is uncertain. Any new legislation or regulation, the application of laws and regulations from jurisdictions whose laws do not currently apply to our business, or the application of existing laws and regulations to the Internet and other online services could also increase our costs of doing business, discourage Internet communications, reduce demand for our services and expose us to substantial liability.
Public scrutiny of Internet privacy issues may result in increased regulation and different industry standards, which could deter or prevent us from providing our current products and solutions to our customers, thereby harming our business.
The regulatory framework for privacy issues worldwide is currently in flux and is likely to remain so for the foreseeable future. Practices regarding the collection, use, storage, transmission and security of personal
25
Table of Contents
information by companies operating over the Internet have recently come under increased public scrutiny. The United States government, including the Federal Trade Commission and the Department of Commerce, has announced that it is reviewing the need for greater regulation for the collection of information concerning consumer behavior on the Internet, including regulation aimed at restricting certain targeted advertising practices. In addition, the European Union is in the process of proposing reforms to its existing data protection legal framework, which may result in a greater compliance burden for companies with users in Europe. Various government and consumer agencies have also called for new regulation and changes in industry practices.
Our business, including our ability to operate and expand internationally, could be adversely affected if legislation or regulations are adopted, interpreted or implemented in a manner that is inconsistent with our current business practices and that require changes to these practices, our services or our privacy policies.
Risks Related to this Offering and Ownership of Our Common Stock
Our existing stockholders, if they act together, will have substantial control over us after this offering, which could limit your ability to influence the outcome of key corporate decisions, such as an acquisition of our company.
Following the consummation of this offering, our directors, executive officers and holders of more than 5% of our common stock, together with their affiliates, will beneficially own, in the aggregate, approximately % of our outstanding common stock, or % if the underwriters exercise their option to purchase additional shares in full. As a result, these stockholders, if they act together, would have the ability to control the outcome of matters submitted to our stockholders for approval, including the election of directors and any merger, consolidation or sale of all or substantially all of our assets. In addition, these stockholders, if they act together, would have the ability to control the management and affairs of our company. Accordingly, this concentration of ownership might harm the trading price of our common stock by:
| • | delaying, deferring or preventing a change in our control; |
| • | impeding a merger, consolidation, takeover or other business combination involving us; or |
| • | discouraging a potential acquirer from making a tender offer or otherwise attempting to obtain control of us. |
Future sales of our common stock may cause the trading price of our common stock to decline.
If our existing stockholders, particularly our directors, their affiliated venture capital funds and our executive officers, sell substantial amounts of our common stock in the public market, or are perceived by the public market as intending to sell, the trading price of our common stock could decline below the initial public offering price. Based on shares outstanding as of September 30, 2011, upon completion of this offering, we will have outstanding shares of common stock (or shares if the underwriters exercise their option to purchase additional shares in full). Of these shares, only the shares of common stock sold in this offering and not subsequently held by “affiliates,” as that term is defined in Rule 144 under the Securities Act of 1933, as amended, or the Securities Act, will be immediately freely tradable, without restriction, in the public market.
Our directors, executive officers, holders of substantially all of our common stock and holders of options and warrants to purchase our stock have agreed with the underwriters, subject to certain exceptions, not to dispose of or hedge any of their common stock or securities convertible into or exchangeable or exercisable for shares of common stock for a period through the date that is 180 days after the date of this prospectus, except with the prior written consent of Merrill Lynch, Pierce, Fenner & Smith Incorporated and Citigroup Global Markets Inc. In addition, the holders of substantially all of our common stock and options to purchase our common stock have previously entered into agreements with us not to sell or otherwise transfer any of their
26
Table of Contents
common stock or securities convertible into or exchangeable for shares of common stock for a period through the date 180 days after the date of this prospectus.
The 180-day restricted period under the agreements with the underwriters described in the preceding paragraph will be automatically extended if: (1) during the last 17 days of the 180-day restricted period we issue an earnings release or material news or a material event relating to us occurs; or (2) prior to the expiration of the 180-day restricted period, we announce that we will release earnings results or become aware that material news or a material event will occur during the 16-day period following the last day of the 180-day period, in which case the restrictions described in the preceding paragraph will continue to apply until the expiration of the 18-day period beginning on the issuance of the earnings release or the occurrence of the material news or material event, as applicable, unless Merrill Lynch, Pierce, Fenner & Smith Incorporated and Citigroup Global Markets Inc. waive, in writing, such extension.
Upon the expiration of the contractual lock-up agreements pertaining to this offering 180 days from the date of this prospectus, or such longer period described above, up to an additional shares will be eligible for sale in the public market, of which will be held by directors, executive officers and other affiliates and will be subject to volume limitations under Rule 144 under the Securities Act and, in certain cases, various vesting agreements. Some of our existing stockholders have demand and piggyback rights to require us to register with the SEC up to 37,630,875 of our common stock, subject to contractual lock-up agreements. See “Description of Capital Stock—Registration Rights” for more information. If we register any of these shares of common stock, the stockholders would be able to sell those shares freely in the public market.
In addition, the shares that are either subject to outstanding options or that may be granted in the future under our 2012 Equity Incentive Plan, and the shares that are subject to outstanding warrants, will become eligible for sale in the public market to the extent permitted by the provisions of various vesting agreements, the contractual lock-up agreements and Rules 144 and 701 under the Securities Act.
After this offering, we intend to register the shares of our common stock that we may issue under our equity plans. Once we register these shares, they can be freely sold in the public market upon issuance, subject to any vesting or contractual lock-up agreements.
If any of these additional shares described are sold, or if it is perceived that they will be sold, in the public market, the trading price of our common stock could decline. For additional information, see “Shares Eligible for Future Sale.”
Some provisions of our certificate of incorporation, bylaws and Delaware law may discourage, delay or prevent a merger or acquisition that you may consider favorable or prevent the removal of our current board of directors and management.
Our amended and restated certificate of incorporation and amended and restated bylaws contain provisions that may discourage, delay or prevent a merger or acquisition that you may consider favorable or prevent the removal of our current board of directors and management. We have a number of anti-takeover devices in place that will hinder takeover attempts, including:
| • | our board of directors is classified into three classes of directors with staggered three-year terms; |
| • | our directors may only be removed for cause, and only with the affirmative vote of a majority of the voting interest of stockholders entitled to vote; |
| • | only our board of directors and not our stockholders will be able to fill vacancies on our board of directors; |
27
Table of Contents
| • | only our chairman of the board, our chief executive officer or a majority of our board of directors, and not our stockholders, are authorized to call a special meeting of stockholders; |
| • | our stockholders will be able to take action only at a meeting of stockholders and not by written consent; |
| • | our amended and restated certificate of incorporation authorizes undesignated preferred stock, the terms of which may be established and shares of which may be issued without stockholder approval; and |
| • | advance notice procedures apply for stockholders to nominate candidates for election as directors or to bring matters before an annual meeting of stockholders. |
These provisions and other provisions in our charter documents could discourage, delay or prevent a transaction involving a change in our control. Any delay or prevention of a change in control transaction could cause stockholders to lose a substantial premium over the then-current trading price of their shares. These provisions could also discourage proxy contests and could make it more difficult for you and other stockholders to elect directors of your choosing or to cause us to take other corporate actions you desire.
In addition, we are subject to Section 203 of the Delaware General Corporation Law, which, subject to some exceptions, prohibits “business combinations” between a Delaware corporation and an “interested stockholder,” which is generally defined as a stockholder who becomes a beneficial owner of 15% or more of a Delaware corporation’s voting stock, for a three-year period following the date that the stockholder became an interested stockholder. Section 203 could have the effect of delaying, deferring or preventing a change in control that our stockholders might consider to be in their best interests. See “Description of Capital Stock—Anti-Takeover Effects of Our Certificate of Incorporation and Bylaws and Delaware Law.”
We have not paid cash dividends on our capital stock, and we do not expect to do so in the foreseeable future.
We have not historically paid cash dividends on our capital stock. We anticipate that we will retain all future earnings and cash resources for the future operation and development of our business, and as a result, we do not anticipate paying any cash dividends to holders of our capital stock for the foreseeable future. Any future determination regarding the payment of any dividends will be made at the discretion of our board of directors and will depend on our financial condition, results of operations, capital requirements, general business conditions and other factors that our board may deem relevant. Consequently, investors must rely on sales of their common stock after price appreciation, which may never occur, as the only way to realize any future gains on their investment. Investors seeking cash dividends should not invest in our common stock.
We will have broad discretion in the use of the net proceeds from this offering and may fail to apply these proceeds effectively.
Our management will have broad discretion in the application of the net proceeds of this offering, including for working capital, general corporate purposes and possible acquisitions. We cannot specify with certainty the actual uses of the net proceeds of this offering. You may not agree with the manner in which our management chooses to allocate and spend the net proceeds. Pending their use, we may invest the net proceeds from this offering in a manner that does not produce income or that loses value. The failure by our management to apply these funds effectively could harm our business, financial condition and results of operations.
Purchasers in this offering will suffer immediate and substantial dilution.
The initial public offering price of our common stock is substantially higher than the net tangible book value per share of our common stock outstanding immediately after this offering. Our pro forma net tangible
28
Table of Contents
book value as of September 30, 2011 was $13.3 million, or approximately $0.33 per share. Our pro forma net tangible book value per share represents the amount of our total tangible assets reduced by the amount of our total liabilities and divided by 39,990,379 shares of common stock outstanding as of September 30, 2011 after giving effect to the automatic conversion of all outstanding shares of preferred stock into shares of common stock upon the closing of this offering. Investors who purchase our common stock in this offering will pay a price per share that substantially exceeds the pro forma net tangible book value per share of our common stock. If you purchase our common stock in this offering, you will experience immediate and substantial dilution of $ in the net tangible book value per share of our common stock, based upon the initial public offering price of $ per share, which represents the mid-point of the range set forth on the cover page of this prospectus. Investors who purchase our common stock in this offering will have purchased % of the shares outstanding immediately after the offering, but will have paid % of the total consideration for those shares. If previously granted options are exercised, additional dilution will occur. As of September 30, 2011, options to purchase 9,929,693 shares of our common stock with a weighted average exercise price of approximately $0.93 per share were outstanding. Exercise of these options will result in additional dilution to purchasers of our common stock in this offering.
No public market for our common stock currently exists and an active market for our common stock may not develop, which could make it difficult for you to sell your shares of common stock and could have a material adverse effect on the value of your investment.
Prior to this offering, there has been no public market for shares of our common stock. After pricing of this offering, we expect that the shares will trade on The NASDAQ Global Market under the symbol “SYNC.” However, we cannot assure you that an active public trading market for our common stock will develop on that exchange or elsewhere or, if developed, that any market will be active or sustained. Accordingly, we cannot assure you of the liquidity of any such market, your ability to sell your shares of common stock or the prices that you may obtain for your shares of common stock. As a result, you could lose all or part of your investment.
The trading price and volume of our common stock is likely to be volatile, and you might not be able to sell your shares at or above the initial public offering price.
Even if an active trading market develops, the trading price of our common stock may be highly volatile and could be subject to wide fluctuations. In addition, the trading volume in our common stock may fluctuate and cause significant price variations to occur. If the trading price of our common stock declines significantly, you may be unable to resell your shares at or above your purchase price. We cannot assure you that the trading price of our common stock will not fluctuate or decline significantly in the future. Some of the factors that could negatively affect our share price or result in fluctuations in the price or trading volume of our common stock include:
| • | variations in our financial performance; |
| • | announcements of technological innovations, new services and products, strategic alliances or significant agreements by us or by our competitors; |
| • | recruitment or departure of key personnel; |
| • | changes in the estimates of our operating results or changes in recommendations by any securities analysts that elect to follow our common stock; |
| • | market conditions in our industry, the industries of our customers and the economy as a whole; |
| • | adoption or modification of laws, regulations, policies, procedures or programs applicable to our business or announcements relating to these matters; and |
| • | the expiration of contractual lock-up agreements. |
29
Table of Contents
In addition, if the market for technology stocks or the stock market in general experiences loss of investor confidence, the trading price of our common stock could decline for reasons unrelated to our business, financial condition or results of operations. The trading price of our common stock might also decline in reaction to events that affect other companies in our industry even if these events do not directly affect us. Some companies that have had volatile market prices for their securities have had securities class actions filed against them. Such a suit filed against us, regardless of its merits or outcome, could cause us to incur substantial costs and could divert management’s attention.
If securities or industry analysts do not publish research or reports about our company, our stock price and trading volume could decline.
The trading market for our common stock will depend in part on the research and reports that securities or industry analysts publish about us or our business. We do not currently have and may never obtain research coverage by securities and industry analysts. If no securities or industry analysts commence coverage of our company, the trading price for our stock may be negatively impacted. In the event we obtain securities or industry analyst coverage, if one or more of the analysts who cover us downgrade our stock or publish inaccurate or unfavorable research about our business, our stock price would likely decline. If one or more of these analysts cease coverage of our company or fail to publish reports on us regularly, demand for our stock could decrease, which might cause our stock price and trading volume to decline.
We will incur increased costs and demands upon management as a result of complying with federal securities laws and regulations applicable to public companies, which could adversely affect our financial performance and our ability to attract and retain directors.
As a public company, we will be subject to the reporting requirements of the Securities Exchange Act of 1934, as amended, or the Exchange Act, the Sarbanes-Oxley Act, the Dodd-Frank Wall Street Reform and Consumer Protection Act, or the Dodd-Frank Act, and the rules and regulations of The NASDAQ Global Market. The Sarbanes-Oxley Act, as well as rules subsequently implemented by the SEC and NASDAQ impose additional requirements on public companies, including enhanced corporate governance practices. For example, the NASDAQ listing requirements require that listed companies satisfy certain corporate governance requirements relating to independent directors, audit committees, distribution of annual and interim reports, stockholder meetings, stockholder approvals, solicitation of proxies, conflicts of interest, stockholder voting rights and codes of business conduct. In addition, our management team has limited experience managing a publicly-traded company or complying with the increasingly complex laws pertaining to public companies. In addition, most of our current directors have limited experience serving on the boards of public companies and directors have recently joined our board of directors. In order to have an effective board, these new directors and any other directors that join our board after the consummation of this offering will need to integrate with our other directors and management and become familiar with our operations and growth strategies.
The requirements of these rules and regulations will increase our legal, accounting and financial compliance costs, will make some activities more difficult, time-consuming and costly and may also place undue strain on our personnel, systems and resources. Our management and other personnel will need to devote a substantial amount of time to these requirements. These rules and regulations will also make it more difficult and more expensive for us to maintain directors’ and officers’ liability insurance, and we may be required to accept reduced coverage or incur substantially higher costs to maintain coverage. If we are unable to maintain adequate directors’ and officers’ insurance, our ability to recruit and retain qualified directors, especially those directors who may be considered independent for purposes of NASDAQ rules, and officers may be significantly curtailed.
30
Table of Contents
SPECIAL NOTE REGARDING FORWARD-LOOKING STATEMENTS
This prospectus includes forward-looking statements that reflect our current views with respect to future events or our future financial performance, are based on information currently available to us, and involve known and unknown risks, uncertainties and other factors that may cause our actual results, levels of activity, performance or achievements to differ materially from any future results, levels of activity, performance or achievements expressed or implied by these forward-looking statements. Words such as, but not limited to, “believes,” “can,” “expects,” “anticipates,” “estimates,” “intends,” “objective,” “plans,” “possibly,” “potential,” “predicts,” “targets,” “likely,” “may,” “might,” “would,” “should,” “could,” and similar expressions or phrases (including the negative of such expressions or phrases) may identify forward-looking statements. Forward-looking statements include, but are not limited to, statements about:
| • | our expected future financial performance; |
| • | our expectations regarding our operating expenses; |
| • | our ability to maintain or broaden relationships with existing customers and develop relationships with new customers; |
| • | our success in anticipating market needs or developing new or enhanced services and products to meet those needs; |
| • | our expectations regarding market acceptance of our services and products; |
| • | our ability to recruit and retain qualified technical and other key personnel; |
| • | our competitive position in our industry, as well as innovations by our competitors; |
| • | our success in managing growth; |
| • | our plans to expand into international markets; |
| • | our success in identifying and managing potential acquisitions; |
| • | our capacity to protect our confidential information and intellectual property rights; |
| • | our need to obtain additional funding and our ability to obtain funding in the future on acceptable terms; |
| • | our expectations regarding the use of proceeds from this offering; and |
| • | anticipated trends and challenges in our business and the markets in which we operate. |
Any forward-looking statements contained in this prospectus are based upon our historical performance and our current plans, estimates and expectations. The inclusion of this forward-looking information should not be regarded as a representation by us, the underwriters or any other person that the future plans, estimates or expectations contemplated by us will be achieved. All forward-looking statements involve risks, assumptions and uncertainties. Given these risks, assumptions and uncertainties, you should not place undue reliance on any forward-looking statements. The occurrence of the events described, and the achievement of the expected results, depend on many factors, some or all of which are not predictable or within our control. Actual results may differ materially from expected results. See “Risk Factors” and elsewhere in this prospectus for a more complete discussion of these risks, assumptions and uncertainties and for other risks, assumptions and uncertainties. These
31
Table of Contents
risks, assumptions and uncertainties are not necessarily all of the important factors that could cause actual results to differ materially from those expressed in any of our forward-looking statements. Other unknown or unpredictable factors also could harm our results. In light of these risks, uncertainties and assumptions, the forward-looking events discussed in this prospectus might not occur, and we therefore qualify all of our forward-looking statements by these cautionary statements. Any forward-looking statement made by us in this prospectus speaks only as of the date on which it is made. Except as required by law, we undertake no obligation to update publicly or revise any forward-looking statements, whether as a result of new information, future events or otherwise.
32
Table of Contents
We estimate that our net proceeds from the sale of the shares of common stock that we are offering will be approximately $ , assuming an initial public offering price of $ per share, which is the midpoint of the range of the initial public offering price listed on the cover page of this prospectus, and after deducting the estimated underwriting discounts and commissions and estimated offering expenses payable by us. If the underwriters’ option to purchase additional shares in this offering is exercised in full, we estimate that our net proceeds will increase by approximately $ .
A $1.00 increase (decrease) in the assumed initial public offering price of $ per share would increase (decrease) the net proceeds to us from this offering by approximately $ million, assuming the number of shares offered by us, as set forth on the cover page of this prospectus, and our offering expenses remain the same, and after deducting underwriting discounts and commissions. Similarly, each increase (decrease) of one million shares in the number of shares of common stock offered by us would increase (decrease) the net proceeds to us from this offering by approximately $ million, assuming the assumed initial public offering price and our offering expenses remain the same, and after deducting underwriting discounts and commissions.
The principal purposes of this offering are to obtain additional capital, to create a public market for our common stock, to facilitate our future access to the public equity markets and to increase our visibility in markets. We intend to use the net proceeds to us from this offering for working capital and other general corporate purposes. These purposes may include expansion of our sales and marketing activities through hiring additional personnel or funding new marketing initiatives. They may also include investments in research and development projects that our management and technical staff may wish to pursue in the future to enhance our product offerings. In addition, the net proceeds may be used to pursue other corporate opportunities that arise in the future.
We may also use a portion of the net proceeds to expand our current business through acquisitions of other companies, assets, products or technologies that enhance or add functionality to our solution, further solidify our market position or allow us to offer complementary services and products. However, we do not have agreements or commitments for any specific acquisitions at this time.
As of the date of this prospectus, we have not yet determined the specific uses of the net proceeds from this offering, and therefore we cannot specify with certainty the amounts to be used for each of the purposes discussed above. The amounts and timing of any expenditures will vary depending on the amount of cash generated by our operations, competitive and technological developments and the rate of growth of our business. As a result, we will have broad discretion in applying the net proceeds from this offering, and investors will be relying on our judgment regarding the application of these net proceeds.
Pending the use of the net proceeds from this offering, we intend to invest the net proceeds in short-term investment-grade, interest-bearing securities. The goal with respect to the investment of these net proceeds will be capital preservation and liquidity so that these funds are readily available to fund our operations.
We have never declared or paid cash dividends on our capital stock. We currently intend to retain all future earnings and cash resources for the future operation and development of our business and do not anticipate paying any cash dividends for the foreseeable future. Any future determination to declare cash dividends will be made at the discretion of our board of directors and will depend on our financial condition, results of operations, capital requirements, general business conditions and other factors that our board of directors may deem relevant.
33
Table of Contents
The following table sets forth our capitalization as of September 30, 2011:
| • | on an actual basis; |
| • | on a pro forma basis to give effect to the automatic conversion of all outstanding shares of preferred stock into 34,790,277 shares of common stock, as if this had occurred as of September 30, 2011; and |
| • | on a pro forma as adjusted basis to give effect to (i) the conversion of all outstanding shares of preferred stock into common stock as if this had occurred as of September 30, 2011, (ii) the receipt of the estimated net proceeds from the sale of shares of common stock offered by us in this offering at an assumed initial public offering price of $ , which is the midpoint of the range of the initial public offering price listed on the cover page of this prospectus, after deducting the estimated underwriting discounts and commissions and estimated offering expenses payable by us, and (iii) the filing of our amended and restated certificate of incorporation immediately prior to the closing of this offering. |
You should read this table in conjunction with “Selected Financial Data,” “Management’s Discussion and Analysis of Financial Condition and Results of Operations” and our financial statements and related notes included elsewhere in this prospectus.
| As of September 30, 2011 | ||||||||||||
| Actual | Pro Forma | Pro Forma as Adjusted |
||||||||||
| (in thousands, except share and per share data) | ||||||||||||
| Cash and cash equivalents |
$ | 7,253 | $ | 7,253 | $ | |||||||
|
|
|
|
|
|
|
|||||||
| Bank financing and Capital lease obligations, including current portion |
$ | 3,043 | $ | 3,043 | $ | |||||||
| Stockholders’ equity: |
||||||||||||
| Common stock, $0.01 par value per share, 60,000,000 shares authorized, 5,839,102 shares issued and 5,200,102 outstanding, actual; 60,000,0000 shares authorized, 40,629,379 shares issued and 39,990,379 shares outstanding, pro forma; 100,000,000 shares authorized, shares issued and outstanding, pro forma as adjusted |
58 | 406 | ||||||||||
| Mandatorily convertible shares of Series A, Series A-1, Series B and Series C preferred stock, $0.01 par value per share, 12,520,389 shares authorized, 11,596,759 shares issued and outstanding, actual; 12,520,389 shares authorized, no shares issued and outstanding pro forma; 10,000,000 shares authorized, no shares issued and outstanding, pro forma as adjusted |
28,432 | — | ||||||||||
| Treasury stock—at cost 639,000 shares, actual; 639,000 shares, pro forma; shares, pro forma as adjusted |
(569 | ) | (569 | ) | ||||||||
| Additional paid-in capital |
45,254 | 73,338 | ||||||||||
| Accumulated deficit |
(59,897 | ) | (59,897 | ) | ||||||||
|
|
|
|
|
|
|
|||||||
| Total stockholders’ equity |
13,278 | 13,278 | ||||||||||
|
|
|
|
|
|
|
|||||||
| Total capitalization |
$ | 16,321 | $ | 16,321 | $ | |||||||
|
|
|
|
|
|
|
|||||||
34
Table of Contents
If the underwriters’ option to purchase additional shares in the offering were exercised in full, pro forma as adjusted cash and cash equivalents, additional paid-in capital, total stockholders’ equity (deficit), total capitalization and shares issued and outstanding as of September 30, 2011 would be $ , $ , $ , $ and shares, respectively.
This table excludes the following shares:
| • | 9,929,693 shares of common stock issuable upon exercise of options outstanding as of September 30, 2011 at a weighted average exercise price of $0.93 per share; and |
| • | shares of common stock reserved for future issuance under our 2012 Equity Incentive Plan, which will become effective on the effective date of the registration statement of which this prospectus is a part. |
See “Management—Equity Benefit Plans” for a description of our equity plans.
35
Table of Contents
If you invest in our common stock in this offering, your interest will be diluted to the extent of the difference between the initial public offering price per share of our common stock and the pro forma net tangible book value per share of our common stock immediately after completion of this offering.
Our pro forma net tangible book value as of September 30, 2011 was $13.3 million, or approximately $0.33 per share, based upon 39,990,379 shares outstanding as of that date. Our pro forma net tangible book value per share represents the amount of our total tangible assets reduced by the amount of our total liabilities and divided by the number of shares of common stock outstanding as of September 30, 2011 after giving effect to the automatic conversion of all outstanding shares of preferred stock into shares of common stock as if the conversion occurred on September 30, 2011. Net tangible book value dilution per share to new investors represents the difference between the amount per share paid by purchasers of shares of common stock in this offering and the pro forma net tangible book value per share of common stock immediately after completion of this offering.
After giving effect to our sale of shares of common stock in this offering at an assumed initial public offering price of $ per share, which is the midpoint of the range of the initial public offering price listed on the cover page of this prospectus, and after deducting estimated underwriting discounts and commissions and estimated offering expenses, our pro forma net tangible book value as of September 30, 2011 would have been $ million, or $ per share. This represents an immediate increase in pro forma net tangible book value of $ per share attributable to existing investors and an immediate dilution in pro forma net tangible book value of $ per share to purchasers of common stock in this offering, as illustrated in the following table:
| Assumed initial public offering price per share |
$ | |||
| Pro forma net tangible book value per share as of September 30, 2011 |
0.33 | |||
| Increase in pro forma net tangible book value per share attributable to existing investors |
||||
| Pro forma net tangible book value per share after the offering |
||||
| Dilution per share to new investors |
If the underwriters exercise in full their option to purchase additional shares of our common stock in this offering, the pro forma net tangible book value per share after the offering would be $ per share, the increase in pro forma net tangible book value per share to existing stockholders would be $ per share and the dilution to new investors purchasing shares in this offering would be $ per share.
Each $1.00 increase (decrease) in the assumed initial public offering price of $ per share would increase (decrease) our pro forma net tangible book value by $ million, or $ per share, increase (decrease) the pro forma net tangible book value attributable to existing investors by $ per share and increase (decrease) the dilution in pro forma net tangible book value per share to purchasers of common stock in this offering by $ per share, assuming that the number of shares offered by us, as set forth on the cover page of this prospectus, remains the same and after deducting an assumed underwriting discount and estimated offering expenses we must pay.
36
Table of Contents
The following table presents, on a pro forma basis as of September 30, 2011, after giving effect to the automatic conversion of all outstanding shares of preferred stock into common stock upon completion of this offering, the differences between the existing stockholders and the purchasers of shares in the offering with respect to the number of shares purchased from us, the total consideration paid and the average price paid per share:
| Shares Purchased | Total Consideration | Average Price per | ||||||||||||||||
| Number | Percent | Amount | Percent | Share | ||||||||||||||
| (in thousands except share and per share data) | ||||||||||||||||||
| Existing stockholders |
% | $ | % | $ | ||||||||||||||
| New stockholders |
||||||||||||||||||
| Total |
100.0 | % | $ | 100.0 | % | |||||||||||||
|
|
|
|
|
|
|
|
|
|
||||||||||
As of September 30, 2011, there were options outstanding to purchase a total of 9,929,693 shares of common stock at a weighted average exercise price of $0.93 per share. To the extent outstanding options are exercised, there will be further dilution to new investors. For a description of our equity plans, please see “Management—Equity Benefit Plans.”
37
Table of Contents
You should read the following selected historical financial data below in conjunction with “Management’s Discussion and Analysis of Financial Condition and Results of Operations” and the financial statements, related notes and other financial information included in this prospectus. The selected financial data in this section is not intended to replace the financial statements and is qualified in its entirety by the financial statements and related notes included in this prospectus.
We derived the selected financial data for the years ended December 31, 2008, 2009 and 2010 and as of December 31, 2009 and 2010 from our audited financial statements and related notes, which are included in this prospectus. We derived the selected consolidated financial data for the years ended December 31, 2006 and 2007 and as of December 31, 2006, 2007 and 2008 from our audited consolidated financial statements and related notes, which are not included in this prospectus. The selected financial data for the nine months ended September 30, 2010 and 2011, and the balance sheet data as of September 30, 2011 have been derived from our unaudited condensed financial statements appearing elsewhere in this prospectus. We have included, in our opinion, all adjustments, consisting only of normal recurring adjustments, that we consider necessary for a fair presentation of the financial information set forth in those statements. Our historical results are not necessarily indicative of the results to be expected in the future, and our interim results are not necessarily indicative of the results to be expected for the full fiscal year.
The pro forma basic and diluted net income (loss) per share attributable to common stockholders data for the year ended December 31, 2010 and for the nine months ended September 30, 2011 reflect the conversion of all of our outstanding shares of preferred stock into 34,790,277 shares of common stock in connection with this offering. See Note 1 of Notes to the Financial Statements and Note 1 of Notes to the Condensed Financial Statements—Unaudited for an explanation of the method used to determine the number of shares used in computing pro forma basic and diluted net income (loss) per share.
38
Table of Contents
| Year Ended December 31, | Nine Months
Ended September 30, |
|||||||||||||||||||||||||||
| 2006 | 2007 | 2008 | 2009 | 2010 | 2010 | 2011 | ||||||||||||||||||||||
| (in thousands except share and per share data) | ||||||||||||||||||||||||||||
| Consolidated Statements of Operations Data: |
||||||||||||||||||||||||||||
| Revenue |
$ | 26,327 | $ | 39,896 | $ | 52,571 | $ | 60,798 | $ | 66,232 | $ | 48,041 | $ | 62,115 | ||||||||||||||
| Costs and operating expenses: |
||||||||||||||||||||||||||||
| Cost of revenue (1) |
15,327 | 21,611 | 28,575 | 34,074 | 36,703 | 26,907 | 32,872 | |||||||||||||||||||||
| Research and development (1)(2) |
4,546 | 7,947 | 12,783 | 13,627 | 18,494 | 13,710 | 14,270 | |||||||||||||||||||||
| Sales and marketing (2) |
4,413 | 6,157 | 5,732 | 5,591 | 6,211 | 4,597 | 5,811 | |||||||||||||||||||||
| General and administrative (1)(2) |
3,933 | 4,888 | 4,997 | 4,966 | 5,656 | 3,941 | 4,887 | |||||||||||||||||||||
| Withdrawn initial public offering expenses |
— | — | 3,405 | — | — | — | — | |||||||||||||||||||||
| Depreciation |
465 | 1,272 | 1,574 | 2,005 | 2,506 | 1,884 | 1,950 | |||||||||||||||||||||
| Other operating expenses |
— | — | 1,121 | — | — | — | — | |||||||||||||||||||||
|
|
|
|
|
|
|
|
|
|
|
|
|
|
|
|||||||||||||||
| Total costs and operating expenses |
28,684 | 41,875 | 58,187 | 60,263 | 69,570 | 51,039 | 59,790 | |||||||||||||||||||||
|
|
|
|
|
|
|
|
|
|
|
|
|
|
|
|||||||||||||||
| Income (loss) from operations |
(2,357 | ) | (1,979 | ) | (5,616 | ) | 535 | (3,338 | ) | (2,998 | ) | 2,325 | ||||||||||||||||
| Loss on extinguishment of debt |
(32 | ) | — | — | — | — | — | — | ||||||||||||||||||||
| Other income (expense) |
279 | 626 | 156 | 69 | (2 | ) | (17 | ) | (18 | ) | ||||||||||||||||||
| Interest expense |
(132 | ) | (189 | ) | (294 | ) | (285 | ) | (240 | ) | (189 | ) | (64 | ) | ||||||||||||||
|
|
|
|
|
|
|
|
|
|
|
|
|
|
|
|||||||||||||||
| Income (loss) before income taxes |
(2,242 | ) | (1,542 | ) | (5,754 | ) | 319 | (3,580 | ) | (3,204 | ) | 2,243 | ||||||||||||||||
| Provision for income taxes |
14 | 15 | 10 | 15 | 11 | 18 | 55 | |||||||||||||||||||||
|
|
|
|
|
|
|
|
|
|
|
|
|
|
|
|||||||||||||||
| Net income (loss) |
(2,256 | ) | (1,557 | ) | (5,764 | ) | 304 | (3,591 | ) | (3,222 | ) | 2,188 | ||||||||||||||||
|
|
|
|
|
|
|
|
|
|
|
|
|
|
|
|||||||||||||||
| Undistributed earnings allocated to preferred stockholders |
— | — | — | 279 | — | — | 1,903 | |||||||||||||||||||||
|
|
|
|
|
|
|
|
|
|
|
|
|
|
|
|||||||||||||||
| Net income (loss) attributable to common stockholders |
$ | (2,256 | ) | $ | (1,557 | ) | $ | (5,764 | ) | $ | 25 | $ | (3,591 | ) | $ | (3,222 | ) | $ | 285 | |||||||||
|
|
|
|
|
|
|
|
|
|
|
|
|
|
|
|||||||||||||||
| Net income (loss) per share attributable to common stockholders: |
||||||||||||||||||||||||||||
| Basic |
$ | (6.28 | ) | $ | (1.15 | ) | $ | (1.70 | ) | $ | 0.01 | $ | (0.96 | ) | $ | (0.87 | ) | $ | 0.07 | |||||||||
|
|
|
|
|
|
|
|
|
|
|
|
|
|
|
|||||||||||||||
| Diluted |
$ | (6.28 | ) | $ | (1.15 | ) | $ | (1.70 | ) | $ | 0.01 | $ | (0.96 | ) | $ | (0.87 | ) | $ | 0.05 | |||||||||
|
|
|
|
|
|
|
|
|
|
|
|
|
|
|
|||||||||||||||
| Weighted average shares used to compute net income (loss) per share attributable to common stockholders: |
||||||||||||||||||||||||||||
| Basic |
359,445 | 1,348,776 | 3,380,917 | 3,628,058 | 3,730,588 | 3,711,130 | 4,013,478 | |||||||||||||||||||||
|
|
|
|
|
|
|
|
|
|
|
|
|
|
|
|||||||||||||||
| Diluted |
359,445 | 1,348,776 | 3,380,917 | 44,586,142 | 3,730,588 | 3,711,130 | 44,866,723 | |||||||||||||||||||||
|
|
|
|
|
|
|
|
|
|
|
|
|
|
|
|||||||||||||||
| Pro forma net income (loss) per share attributable to common stockholders: |
||||||||||||||||||||||||||||
| Basic |
$ | (0.09 | ) | $ | 0.06 | |||||||||||||||||||||||
|
|
|
|
|
|||||||||||||||||||||||||
| Diluted |
$ | (0.09 | ) | $ | 0.05 | |||||||||||||||||||||||
|
|
|
|
|
|||||||||||||||||||||||||
| Pro forma weighted average shares used to compute net income (loss) per share attributable to common stockholders: |
||||||||||||||||||||||||||||
| Basic |
38,520,865 | 38,803,755 | ||||||||||||||||||||||||||
|
|
|
|
|
|||||||||||||||||||||||||
| Diluted |
38,520,865 | 44,866,723 | ||||||||||||||||||||||||||
|
|
|
|
|
|||||||||||||||||||||||||
| Other Financial Data: |
||||||||||||||||||||||||||||
| Adjusted EBITDA (3) |
$ | (1,886 | ) | $ | (313 | ) | $ | (3,374 | ) | $ | 3,441 | $ | 36 | $ | (509 | ) | $ | 4,915 | ||||||||||
Notes:
| (1) | Exclusive of depreciation shown separately. |
(notes continue on following page)
39
Table of Contents
Notes (continued from previous page):
| (2) | Includes stock-based compensation as follows: |
| Year Ended December 31, | Nine Months Ended September 30, |
|||||||||||||||||||||||||||
| 2006 | 2007 | 2008 | 2009 | 2010 | 2010 | 2011 | ||||||||||||||||||||||
| (in thousands) | ||||||||||||||||||||||||||||
| Research and development |
$ | — | $ | 94 | $ | 221 | $ | 252 | $ | 398 | $ | 278 | $ | 205 | ||||||||||||||
| Sales and marketing |
— | 71 | 142 | 189 | 202 | 140 | 141 | |||||||||||||||||||||
| General and administrative |
58 | 229 | 305 | 460 | 268 | 187 | 294 | |||||||||||||||||||||
| (3) | We define adjusted EBITDA as net income (loss), plus: provision for income taxes, interest expense, other (income) expense, depreciation, and stock-based compensation. Please see “Adjusted EBITDA” below for more information and for a reconciliation of adjusted EBITDA to net income (loss), the most directly comparable financial measure calculated and presented in accordance with GAAP. |
| As of December 31, | As of September 30, |
|||||||||||||||||||||||
| 2006 | 2007 | 2008 | 2009 | 2010 | 2011 | |||||||||||||||||||
| (in thousands) | ||||||||||||||||||||||||
| Consolidated Balance Sheet Data: |
||||||||||||||||||||||||
| Cash and cash equivalents |
$ | 15,293 | $ | 11,072 | $ | 8,830 | $ | 10,462 | $ | 5,412 | $ | 7,253 | ||||||||||||
| Trade receivables, net |
4,102 | 6,134 | 7,162 | 7,773 | 9,654 | 12,004 | ||||||||||||||||||
| Property and equipment, net |
4,315 | 5,743 | 7,707 | 6,631 | 7,110 | 7,377 | ||||||||||||||||||
| Total assets |
24,212 | 28,629 | 25,945 | 26,004 | 24,327 | 28,801 | ||||||||||||||||||
| Long-term bank financing and capital lease obligations |
1,297 | 1,710 | 2,914 | 1,247 | 1,203 | 1,501 | ||||||||||||||||||
| Total stockholders’ equity |
17,608 | 17,175 | 12,211 | 13,053 | 10,156 | 13,278 | ||||||||||||||||||
Adjusted EBITDA
To provide investors with additional information regarding our financial results, we have disclosed within this prospectus adjusted EBITDA, a non-GAAP financial measure. We have provided a reconciliation below of adjusted EBITDA to net income (loss), the most directly comparable GAAP financial measure.
We have included adjusted EBITDA in this prospectus because it is a key measure used by our management and board of directors to understand and evaluate our core operating performance and trends, to prepare and approve our annual budget and to develop short- and long-term operational plans. In particular, the exclusion of certain expenses in calculating adjusted EBITDA can provide a useful measure for period-to-period comparisons of our core business. Additionally, adjusted EBITDA is a key financial measure used by the compensation committee of our board of directors in connection with the payment of bonuses to our executive officers. Accordingly, we believe that adjusted EBITDA provides useful information to investors and others in understanding and evaluating our operating results in the same manner as our management and board of directors.
Our use of adjusted EBITDA has limitations as an analytical tool, and you should not consider it in isolation or as a substitute for analysis of our results as reported under GAAP. Some of these limitations are:
| • | although depreciation is a non-cash charge, the assets being depreciated may have to be replaced in the future, and adjusted EBITDA does not reflect capital expenditure requirements for such replacements or for new capital expenditure requirements; |
| • | adjusted EBITDA does not reflect changes in, or cash requirements for, our working capital needs; |
| • | adjusted EBITDA does not consider the potentially dilutive impact of equity-based compensation; |
40
Table of Contents
| • | adjusted EBITDA does not reflect tax payments that may represent a reduction in cash available to us; and |
| • | other companies, including companies in our industry, may calculate adjusted EBITDA differently, which reduces its usefulness as a comparative measure. |
Because of these limitations, you should consider adjusted EBITDA alongside other financial performance measures, including various cash flow metrics, net income (loss) and our other GAAP results. The following table presents a reconciliation of adjusted EBITDA to net income (loss) for each of the periods indicated:
| Year Ended December 31, | Nine Months Ended September 30, |
|||||||||||||||||||||||||||
| 2006 | 2007 | 2008 | 2009 | 2010 | 2010 | 2011 | ||||||||||||||||||||||
| (in thousands) | ||||||||||||||||||||||||||||
| Reconciliation of Adjusted EBITDA: |
||||||||||||||||||||||||||||
| Net income (loss) |
$ | (2,256 | ) | $ | (1,557 | ) | $ | (5,764 | ) | $ | 304 | $ | (3,591 | ) | $ | (3,222 | ) | $ | 2,188 | |||||||||
| Provision for income taxes |
14 | 15 | 10 | 15 | 11 | 18 | 55 | |||||||||||||||||||||
| Interest expense |
132 | 189 | 294 | 285 | 240 | 189 | 64 | |||||||||||||||||||||
| Other (income) expense (1) |
(279 | ) | (626 | ) | (156 | ) | (69 | ) | 2 | 17 | 18 | |||||||||||||||||
| Depreciation |
465 | 1,272 | 1,574 | 2,005 | 2,506 | 1,884 | 1,950 | |||||||||||||||||||||
| Stock-based compensation |
58 | 394 | 668 | 901 | 868 | 605 | 640 | |||||||||||||||||||||
|
|
|
|
|
|
|
|
|
|
|
|
|
|
|
|||||||||||||||
| Adjusted EBITDA |
$ | (1,866 | ) | $ | (313 | ) | $ | (3,374 | ) | $ | 3,441 | $ | 36 | $ | (509 | ) | $ | 4,915 | ||||||||||
|
|
|
|
|
|
|
|
|
|
|
|
|
|
|
|||||||||||||||
Note:
| (1) | Other (income) expense consists primarily of interest income earned and foreign exchange gains and losses. |
41
Table of Contents
MANAGEMENT’S DISCUSSION AND ANALYSIS OF
FINANCIAL CONDITION AND RESULTS OF OPERATIONS
The following discussion of our results of operations and financial condition should be read in conjunction with the information set forth in “Selected Financial Data” and our financial statements and the notes thereto included in this prospectus. This discussion contains forward-looking statements based upon our current expectations, estimates and projections that involve risks and uncertainties. Actual results could differ materially from those anticipated in these forward-looking statements due to, among other considerations, the matters discussed under “Risk Factors” and “Special Note Regarding Forward-Looking Statements.”
Overview
We are a leading provider of authentication and aggregation solutions for delivery of online content and services. We deliver our solutions as a set of services through our hosted and managed platform, enabling cable and telecom service providers and consumer electronics manufacturers to provide the online content and services that their consumers increasingly demand. Our platform allows our customers to package a wide array of online content and services with their high-speed Internet, communications, television and other offerings. Our customers offer our services under their own brands on Internet-enabled devices such as PCs, tablets, smartphones and connected TVs. As of September 30, 2011, our high-speed Internet service provider customers used our platform to offer an engaging Internet experience to over 25% of the estimated 79 million United States high-speed Internet households.
We generate revenue from search and display advertising and by charging subscriber-based fees for services and products delivered through our platform. Our results are driven primarily by our customer mix, the product and service mix preferences of those customers and the pricing of those products and services. We generate the majority of our revenue from search and display advertising on our customers’ branded websites, which comprise consumer-facing components of our platform. Adding new customers with large consumer bases and expansion of our relationships with existing customers have resulted in an increasing shift in our revenue mix towards search and display advertising revenue. In addition, as new customers adopt our platform, and as their respective consumers’ use of our platform ramps up as described below, our growth is increasingly driven by search and display advertising revenue. These increases are largely driven by our model of sharing a portion of this search and advertising revenue with our customers. As we expand our value added services offerings, we expect to generate increased subscriber-based revenue from our customers.
Growth in search and display advertising revenue is driven largely by increasing consumer use of our platform. As more consumers use our customers’ websites and as consumers spend more time on these websites, we have a greater number of opportunities to deliver advertisements. During the nine months ended September 30, 2011, search and display advertising revenue was $48.0 million, a growth of 50% over $32.1 million for the nine months ended September 30, 2010. Over the same period, our unique visitors increased by 55%, our search queries increased by 54% and our advertising impressions increased by 41%. We expect consumer engagement on our customers’ websites to continue to grow in the future as our customers deliver more services through their websites.
Our subscriber-based revenue consists of fees charged for the use of our proprietary technology platform and for the use of, or access to, services, such as e-mail, security, online games, music and other value added services and paid content. During the nine months ended September 30, 2011, subscriber-based revenue was $14.1 million, a decline of 12% from $16.0 million during the nine months ended September 30, 2010. While subscriber-based revenue decreased in amount and as a percentage of our total revenue, we believe there are opportunities to generate new sources of subscriber-based revenue, such as fees for TV Everywhere authentication and the introduction of new value added services. We believe that the variety of value added services and the introduction of new value added services will also drive increased search and display advertising revenue.
42
Table of Contents
As new customers introduce their branded websites to their consumers, usage of our platform and our revenue from our customers’ websites tends to increase over time. There are a variety of reasons for this ramp-up period. For example, a new customer may migrate its consumers from its existing platform to our platform over a period of time. Moreover, a new customer may initially launch a selection of our services and products, rather than our entire suite of offerings, and subsequently broaden their service and product offerings over time. When a customer launches a new service or product, marketing and promotional activities may be required to generate awareness and interest among consumers. Search and display advertising revenue typically grows significantly during the first two to three years after a customer launch, although there can be notable variances from customer to customer. Thereafter, changes in revenue tend to mirror changes in the consumer base of the applicable customer.
For the nine months ended September 30, 2011, we derived revenue from over 45 customers, with revenue attributable to three customers, CenturyLink (including revenue attributable to Qwest), Charter and Toshiba, together accounting for approximately 63% of our revenue for the nine months ended September 30, 2011, or $39.1 million. Two of these customers each accounted for 20% or more of revenue in such period, and revenue attributable to the third customer accounted for more than 10% in such period. As we gain additional customers and as recently-added customers ramp up as described above, we anticipate that our revenue will be more broadly spread across all our customers.
Revenue attributable to our customers includes the subscriber-based revenue earned directly from them, as well as the search and display advertising revenue generated through our relationships with our search and display advertising partners (such as Google for search advertising and advertising networks, advertising agencies and advertisers for display advertising). This revenue is attributable to our customers because it is produced from the traffic on our customers’ websites. These partners provide us with advertisements that we then deliver with search results and other content on our customers’ websites. Since our search advertising partner, Google, and our advertising network partners generate their revenue by selling those advertisements, we create a revenue stream for these partners. In the nine months ended September 30, 2011, search advertising through our relationship with Google generated approximately 55% of our revenue, or $34.0 million (all of which was attributable to our customers).
We have experienced, and expect to continue to experience, growth in our business as we acquire new customers, as our existing customers acquire new consumers, as we roll out new products and services and as we expand our presence into international markets. We expect to continue to make capital expenditures in 2012 related to both the customer supporting activities and our internal information technology infrastructure. We also expect that our research and development headcount and associated expenses will increase in 2012 as we continue to develop our technology platform, deliver new products and services, and make those and existing products and services available across different devices.
Although we experienced net losses in 2008 and 2010 (as well as in prior years), we believe that the revenue opportunities afforded us by the growth in search and display advertising across our customers have enhanced our ability to achieve profitability in the future. Our costs of revenue are expected generally to grow with revenue as most of these costs are associated with the sharing of revenue with our customers. Therefore, in order to take advantage of this revenue potential and continue to grow profitably it has been and will continue to be important for us to cost-effectively support our customers and manage our operating expenses. While we expect our costs of revenue to increase generally in line with revenue, we expect our operating expenses to decrease as a percentage of revenue, thereby increasing our profitability over time. For the first nine months of 2011 revenue grew by 29.3% over the first nine months of 2010 while operating expenses, including depreciation, grew by 11.5%, and excluding depreciation, grew by 12.2%.
The initiatives described below under “Key Initiatives” are expected to contribute to our ability to maintain and grow profitability via increases in advertising revenue, increases in customers and our consumer reach, and increases in availability of products across more devices. We expect the period in which we
43
Table of Contents
experience a return on future investments in each of these initiatives to differ. For example, more direct advertising at higher CPMs would be expected to have an immediate and direct impact on profitability while expansion into international markets may require an investment that involves a longer term return. We expect that some of the net proceeds of the offering will be utilized with a goal of enhancing our technology and our systems capabilities to more efficiently support our customers, develop new products and features and report upon, analyze and manage the financial performance of the business in order to improve our ability to achieve consistent profitability in the future. As of the date of this prospectus, we have not yet determined the specific uses of the net proceeds of the offering.
Trends Affecting Our Business
Our customers, who are predominantly high-speed Internet service providers that also offer television services, are facing increasing competition from companies that deliver video content over the Internet, more commonly referred to as “over-the-top,” or OTT. These new competitors include a number of large and growing companies, such as Google, Netflix, Inc., or Netflix, Hulu, LLC, or Hulu, and Amazon.com Inc., or Amazon. With the increased availability of high-speed Internet access and over-the-top programming, consumers’ video content consumption preferences may shift away from current viewing habits. As a result, many of our customers and potential customers are compelled to find new ways to deliver services and content to their consumers via the Internet. We expect this pressure to become even greater as more video content becomes available online. We expect to continue to benefit from this trend as customers adopt our platform to package and deliver video programming and other related authentication services on their own branded websites.
Another trend affecting our customers and our business is the proliferation of Internet-connected devices, especially mobile devices. Smartphones, tablets and connected TVs have made it more convenient for consumers to access services and content online, including television programming. To remain competitive, our customers and potential customers must have the capability to deliver their services and products to consumers on these new devices. Our platform enables them to extend their presence beyond traditional personal computers, and we expect that a significant portion of our revenue growth will come from traffic on these devices.
Our business is also affected by growth in advertising on the Internet, of which proliferation of high-speed Internet access and Internet-connected devices will be the principal drivers. According to the report published by PwC in June 2011, such search advertising is projected to continue to attract advertising spending to the Internet. Meanwhile, growth in the number of mobile Internet users is expected to drive mobile advertising. Our platform creates a revenue stream for our search advertising partner, Google, and our advertising network partners, who provide us with advertisements and share in the fees generated by those advertisements when we deliver them with search results and other content on our customers’ websites. We expect that we (and therefore these advertising partners) will continue to benefit from the underlying trend of growth in Internet advertising.
Key Initiatives
We are focused on several key initiatives to drive our business:
| • | increase the content and services we provide to our customers and their consumers, enhance our direct advertising sales effort to increase the cost-per-thousand impressions (referred to as cost per mille, or CPM) derived from advertising and increase the number of customers using our TV Everywhere authentication platform; |
| • | add new customers from the high-speed Internet service provider and consumer electronics industries to expand our consumer reach; |
| • | extend the availability of our existing and new products and services to additional devices including tablets and smartphones; and |
| • | expand our presence into international markets. |
44
Table of Contents
Key Business Metrics
In addition to the line items in our financial statements, we regularly review a number of business metrics related to Internet traffic and search and display advertising to evaluate our business, determine the allocation of resources and make decisions regarding business strategies. We believe information of these metrics is useful for investors and analysts to understand the underlying trends in our business. The following table summarizes our key business metrics, which are unaudited, for the years ended December 31, 2008, 2009 and 2010 and the first nine months of 2010 and 2011:
| Years Ended December 31, | Nine Months Ended September 30, |
|||||||||||||||||||
| 2008 | 2009 | 2010 | 2010 | 2011 | ||||||||||||||||
| Key Business Metrics: |
||||||||||||||||||||
| Unique Visitors (1) |
7,647,917 | 8,320,500 | 8,235,583 | 8,551,444 | 13,250,013 | |||||||||||||||
| Search Queries (2) |
314,039,915 | 383,871,812 | 453,687,989 | 326,658,368 | 503,476,341 | |||||||||||||||
| Advertising Impressions (3) |
9,432,921,273 | 16,549,485,330 | 18,832,969,669 | 13,769,460,560 | 19,461,422,855 | |||||||||||||||
Notes:
| (1) | Reflects the number of unique visitors to our customers’ websites computed on an average monthly basis during the applicable period. |
| (2) | Reflects the total number of search queries during the applicable period. |
| (3) | Reflects the total number of advertising impressions during the applicable period. |
Unique Visitors
We define unique visitors as consumers who have visited one of our customers’ websites at least once during a particular time period. We rely on comScore to provide this data. comScore estimates this data based on the U.S. portion of the Internet activity of its worldwide panel of consumers and its proprietary data collection method.
Search Queries
We define search queries as the number of instances in which a consumer entered a query into a search bar on our platform during a particular time period. We rely on reports from our search partner, Google, to measure the number of such instances.
Advertising Impressions
We define advertising impressions as graphical, textual or video paid advertisements displayed to consumers on our platform during a particular time period. We rely on reports from technology and advertising partners, including DoubleClick (a division of Google), to measure the number of advertising impressions delivered on our platform.
45
Table of Contents
Components of our Results of Operations
Revenue
We derive our revenue from two categories: revenue generated from search and display advertising activities and subscriber-based revenue, each of which is described below. We record our search and display advertising revenue on a gross basis, which includes the net amount received from Google under our agreement with them. The following table shows the revenue in each category, both in amount and as a percentage of revenue, for 2008, 2009 and 2010 and the nine months ended September 30, 2010 and 2011.
| Year Ended December 31, | Nine Months Ended September 30, |
|||||||||||||||||||
| 2008 | 2009 | 2010 | 2010 | 2011 | ||||||||||||||||
| (in thousands) | ||||||||||||||||||||
| Revenue: |
||||||||||||||||||||
| Search and display advertising |
$ | 32,212 | $ | 39,268 | $ | 45,859 | $ | 32,089 | $ | 48,040 | ||||||||||
| Subscriber-based |
20,359 | 21,530 | 20,373 | 15,952 | 14,075 | |||||||||||||||
|
|
|
|
|
|
|
|
|
|
|
|||||||||||
| Total revenue |
$ | 52,571 | $ | 60,798 | $ | 66,232 | $ | 48,041 | $ | 62,115 | ||||||||||
|
|
|
|
|
|
|
|
|
|
|
|||||||||||
| Percentage of revenue: |
||||||||||||||||||||
| Search and display advertising |
61 | % | 65 | % | 69 | % | 67 | % | 77 | % | ||||||||||
| Subscriber-based |
39 | 35 | 31 | 33 | 23 | |||||||||||||||
|
|
|
|
|
|
|
|
|
|
|
|||||||||||
| Total revenue |
100 | % | 100 | % | 100 | % | 100 | % | 100 | % | ||||||||||
|
|
|
|
|
|
|
|
|
|
|
|||||||||||
Search and Display Advertising Revenue
We use Internet search and display advertising to generate revenue from the traffic on our customers’ websites.
| • | In the case of search advertising, we have a revenue-sharing relationship with Google, pursuant to which we include a Google-branded search tool on our customers’ websites. When a consumer makes a search query using this tool, we deliver the query to Google and they return search results to consumers that include advertiser-sponsored links. If the consumer clicks on a sponsored link, Google receives payment from the sponsor of that link and shares a portion of that payment with us, which we in turn share with the applicable customer. The net payment we receive from Google is recognized as revenue. |
| • | We generate display advertising revenue when consumers view or click on a text, graphic or video advertisement that was delivered on a Synacor-operated website. We fill our advertising inventory with advertisements sourced by our direct salesforce, independent advertising sales representatives and advertising network partners. Revenue may be calculated differently depending on our agreements with our advertisers or the agreements between our advertising network partners and their advertisers. It may be calculated on a cost per impression basis, which means the advertiser pays based on the number of times its advertisements appear, or a cost per action basis, which means that an advertiser pays when a consumer performs an action after engaging one of its advertisements. Historically only a small percentage of our display advertising revenue has been calculated on a cost per action basis. |
Subscriber-Based Revenue
We define subscriber-based revenue as subscription fees and other fees that we receive from our customers for the use of our proprietary technology platform and the use of, or access to, e-mail, security, games
46
Table of Contents
and other services, including value added services and paid content. Monthly subscriber levels typically form the basis for calculating and generating subscriber-based revenue. They are generally determined by multiplying a per-subscriber per-month fee by the number of subscribers using the particular services being offered or consumed. In other cases, the fee is fixed. We recognize revenue from our customers as the service is delivered.
Costs and Expenses
Cost of Revenue
Cost of revenue consists of revenue sharing, content acquisition costs and co-location facility costs. Revenue sharing consists of amounts accrued and paid to our customers for the traffic on their websites resulting in the generation of search and display advertising revenue. The revenue-sharing agreements with our customers are primarily variable payments based on a percentage of the search and display advertising revenue. Content acquisition agreements may be based on a fixed payment schedule, on the number of subscribers per month, or a combination of both. Fixed-payment agreements are expensed over the term defined in the agreement. Agreements based on the number of subscribers are expensed on a monthly basis. Co-location facility costs consist of rent and operating costs for our data center facilities.
Research and Development
Research and development expenses consist primarily of compensation-related expenses incurred for the development of, enhancements to, and maintenance and operation of our technology platform and related infrastructure.
Sales and Marketing
Sales and marketing expenses consist primarily of compensation-related expenses to our direct sales and marketing personnel, as well as costs related to advertising, industry conferences, promotional materials, and other sales and marketing programs. Advertising cost is expensed as incurred.
General and Administrative
General and administrative expenses consist primarily of compensation related expenses for executive management, finance, accounting, human resources and other administrative functions.
Depreciation
Depreciation includes depreciation of our computer hardware and software, furniture and fixtures, leasehold improvements, and other property, and depreciation on capital leased assets.
Other Income (Expense)
Other income (expense) consists primarily of interest income earned and foreign exchange gains and losses.
Interest Expense
Interest income (expense) primarily consists of expenses associated with our long-term debt, capital leases, and amortization of debt issuance costs.
Provision for Income Taxes
Income tax expense consists of federal and state income taxes in the United States and taxes in certain foreign jurisdictions.
47
Table of Contents
Critical Accounting Policies
The preparation of financial statements in conformity with GAAP requires estimates and assumptions that affect the reported amounts and classifications of assets and liabilities, revenue and expenses, and the related disclosures of contingent liabilities in the financial statements and accompanying notes. The SEC has defined a company’s critical accounting policies as the ones that are most important to the portrayal of the company’s financial condition and results of operations, and which require the company to make its most difficult and subjective judgments, often as a result of the need to make estimates of matters that are inherently uncertain. Based on this definition, we have identified the following critical accounting policies and estimates addressed below. We also have other key accounting policies, which involve the use of estimates, judgments, and assumptions that are significant to understanding our results. See Note 1, The Company and Summary of Significant Accounting Policies, of Notes to the Financial Statements and Notes to the Condensed Financial Statements—Unaudited for further information. Although we believe that our estimates, assumptions, and judgments are reasonable, they are based upon information available at the time. Actual results may differ significantly from these estimates under different assumptions, judgments, or conditions.
Revenue Recognition
We recognize revenue when the following criteria are met: persuasive evidence of an arrangement exists; delivery has occurred; the selling price is fixed or determinable; and collectability is reasonably assured.
The terms of our arrangements with our customers, Google and our advertising network partners are specified in written agreements. These written agreements constitute the persuasive evidence of the arrangements with our customers that are a pre-condition to the recognition of revenue. The evidence used to document that delivery or performance has occurred generally consists of communication of either numbers of subscribers or the revenue generated in a reporting period from customers, advertising partners, vendors and our own internally-generated reports. Occasionally, a customer will notify us of subsequent adjustments to previously reported subscriber data. These adjustments, once accepted by us, will result in adjustments to revenue and cost of revenue. The historical occurrences of such adjustments, and the amounts involved, have not been significant.
Although prices used in our revenue recognition formulas are generally fixed pursuant to the written arrangements with our customers, Google and our advertising network partners, the number of subscribers or the amount of search and display advertising revenue that are subject to our pricing arrangements are not known until the reporting period has ended. Although this data is, in most cases, available prior to the completion of our periodic financial statements, this data may need to be estimated. When made, these estimates are based upon our historical experience with the relevant party. Adjustments to these estimates have historically not been significant. The receipt of this volume data also serves to verify that we have appropriately satisfied our obligation to our customers for that reporting period. Adjustments are recorded in the period in which the data is received.
Pursuant to the terms of our customer contracts, we recognize revenue in each period for our services once the contract has been signed, its terms reviewed and understood, the service, content or both have been made available to the customer and reliable active subscriber information is made available to us.
We undertake an evaluation of the creditworthiness of both new and, on a periodic basis, existing customers. Based on these reviews we determine whether collection of our prospective revenue is probable.
Revenue Sharing
We pay our customers a portion of the revenue generated from search and display advertising. The portion paid to our customers depends on, among other things, the consumer base of the customer and their expected ability to drive consumer traffic to our platform. This revenue consists of the consideration we receive from Google and our display advertising partners in connection with traffic supplied by the applicable customer.
48
Table of Contents
Gross Versus Net Presentation of Revenue for Revenue Sharing
We evaluate our relationship between our search and display advertising partners and our customers in accordance with Financial Accounting Standards Board, or FASB, Accounting Standards Codification, or ASC, 605-45, Principal Agent Considerations. We have determined that the revenue derived from traffic supplied by our customers is reported on a gross basis because we are the primary obligor (we are responsible to our customers for fulfilling search and display advertising services and value added and other services), are involved in the service specifications, perform part of the service, have discretion in supplier selection, have latitude in establishing price and bear credit risk.
Stock-Based Compensation
In accordance with FASB ASC 718, Compensation—Stock Compensation, we measure stock-based compensation cost at fair value, net of estimated forfeitures, and generally recognize the corresponding compensation expense on a straight-line basis over the service period during which awards are expected to vest. We include stock-based compensation expense in research and development, sales and marketing and general and administrative expenses in our statement of operations, and determining the fair value of stock-based awards at the grant date requires judgment.
Fair Value of Stock Options. We use the Black-Scholes-Merton option-pricing model to determine the fair value of stock options. The determination of the grant date fair value of options using an option-pricing model is affected by our estimated common stock fair value as well as assumptions regarding a number of other complex and subjective variables. These variables include the fair value of our common stock, our expected stock price volatility over the expected term of the options, stock option exercise and cancellation behaviors, risk-free interest rates, and expected dividends, which are estimated as follows:
| • | Fair Value of Our Common Stock. Because our stock has not been publicly traded, we must estimate the fair value of common stock, as discussed below. |
| • | Expected Term. The expected term represents the period of time the stock options are expected to be outstanding and is based on the “simplified method” allowed under SEC guidance. We used the “simplified method” due to the lack of sufficient historical exercise data to provide a reasonable basis upon which to otherwise estimate the expected life of the stock options. |
| • | Volatility. Since we do not have a trading history for our common stock, the expected stock price volatility was estimated by taking the average historic price volatility for publicly-traded options of comparable industry peers similar in size, stage of life cycle and financial leverage, based on daily price observations over a period equivalent to the expected term of the stock option grants. We did not rely on implied volatilities of traded options in our industry peers’ common stock because the volume of activity was relatively low. We intend to continue to consistently apply this process using the same or similar public companies until a sufficient amount of historical information regarding the volatility of our own common stock share price becomes available, or unless circumstances change such that the identified companies are no longer similar to us, in which case more suitable companies whose share prices are publicly available would be utilized in the calculation. |
| • | Risk-free Interest Rate. The risk-free interest rate is based on the yields of United States Treasury securities with maturities similar to the expected term of the options for each option group. |
| • | Dividend Yield. We have never declared or paid any cash dividend on our common stock. We intend to retain any future earnings and do not expect to pay any dividends in the foreseeable future. |
49
Table of Contents
If any of the assumptions used in the Black-Scholes-Merton model changes significantly, stock-based compensation for future awards may differ materially compared with the awards granted previously.
The following table presents the weighted-average assumptions used to estimate the fair value of options granted during the years ended December 31, 2008, 2009, and 2010 and the nine months ended September 30, 2011:
| Year Ended December 31, | Nine Months Ended September 30, 2011 |
|||||||||||||||
| 2008 | 2009 | 2010 | ||||||||||||||
| Dividend yield |
— | — | — | — | ||||||||||||
| Risk-free interest rate |
3.10 | % | 3.40 | % | 2.38 | % | 1.63 | % | ||||||||
| Expected term (in years) |
6.25 | 6.25 | 6.25 | 6.25 | ||||||||||||
| Expected volatility |
54 | % | 52 | % | 53 | % | 51 | % | ||||||||
Since May 2006, in accordance with Section 409A of the Internal Revenue Code and related regulations issued by the Internal Revenue Service, our board of directors has received valuations of our common stock from an independent valuation specialist, Anvil Advisors, LLC, or Anvil Advisors, and used the values determined in their reports to set the exercise price of stock options. We also considered these valuations when determining the fair value of our common stock for purposes of calculating stock-based compensation expense in connection with stock options. Anvil Advisors, an unrelated valuation specialist as defined under the American Institute of Certified Public Accountants Practice Guide, Valuation of Privately-Held Company Equity Securities Issued as Compensation, or the Practice Guide, appraised the value of our common stock in accordance with the guidelines outlined in the Practice Guide. The assumptions it used in its valuation models were based on future expectations combined with management judgments.
In its valuations through June 2009, Anvil Advisors estimated the enterprise value of our company on the applicable valuation date using the discounted future cash flow method and the guideline company method and then computing a weighted average of the two based on the likelihood of an initial public offering. As an initial public offering became more likely, the guideline company method was given greater weight. Then Anvil Advisors used the company security valuation method to allocate the enterprise value of our company among its various classes of equity to derive a fully marketable value per share for the common stock. Anvil Advisors applied an appropriate discount for lack of marketability to this fully marketable value to arrive at the fair value per share of common stock.
In its valuations after June 2009, Anvil Advisors continued to use the guideline company method, but replaced the discounted future cash flow method with the comparable transaction method. This method determines a value based on prices paid by strategic and financial buyers of comparable companies in the Internet software and services sector. Anvil Advisors replaced the discounted cash flow method because our internal forecasting, on which it relied in its analysis, became more short-term focused following the departure of our former chief financial officer in December 2008.
The difference between the exercise price of the options and our estimate of the fair value has been factored into the stock-based compensation expense. Our estimates of the fair value used to compute the stock-based compensation expense for financial reporting purposes may not be reflective of the fair value that would result from the application of other valuation methods, including accepted valuation methods for tax purposes.
Along with these valuations, we considered other objective and subjective factors to determine the fair value of our common stock as of the date of each option grant, including the following factors:
| • | the prices, rights, preferences and privileges of our preferred stock relative to the common stock; |
| • | our operating and financial performance; |
50
Table of Contents
| • | current business conditions and projections; |
| • | the hiring of key personnel; |
| • | the history of our company and the introduction of new products and services; |
| • | our stage of development; |
| • | the likelihood of achieving a liquidity event for the shares of common stock underlying these stock options, such as an initial public offering or sale of our company, given prevailing market conditions; |
| • | any adjustment necessary to recognize a lack of marketability for our common stock; |
| • | the market performance of comparable publicly-traded companies; and |
| • | the United States and global capital market conditions. |
We granted stock options with the following weighted average exercise price each quarter since the beginning of 2008 through September 30, 2011.
| Three Months Ended |
Shares Underlying Options |
Weighted Average Exercise Price ($) |
||||||
| March 31, 2008 (1)(2) |
414,000 | 2.00 | ||||||
| June 30, 2008 (1)(2) |
1,179,000 | 2.00 | ||||||
| September 30, 2008 (1)(2) |
318,500 | 1.99 | ||||||
| December 31, 2008 |
148,250 | 1.29 | ||||||
| March 31, 2009 |
84,000 | 1.29 | ||||||
| June 30, 2009 |
563,000 | 1.26 | ||||||
| September 30, 2009 |
442,000 | 1.25 | ||||||
| December 31, 2009 |
56,000 | 1.20 | ||||||
| March 31, 2010 |
265,750 | 1.20 | ||||||
| June 30, 2010 |
269,966 | 1.34 | ||||||
| September 30, 2010 |
504,250 | 1.34 | ||||||
| December 31, 2010 |
1,004,000 | 1.44 | ||||||
| March 31, 2011 |
145,750 | 1.44 | ||||||
| June 30, 2011 |
121,000 | 1.66 | ||||||
| September 30, 2011 |
2,354,600 | 1.66 | ||||||
Notes:
| (1) | The Board amended the exercise price of these options to $1.26 in June 2009. Please see the section below titled “Stock Option Re-pricing.” |
| (2) | Reflects a 3-for-1 forward stock split of our common stock that became effective July 31, 2008. |
Summarized below are the significant factors we considered in determining the fair value of the common stock underlying our stock options.
For options granted through September 2008, we based our estimate of the fair value of our common stock on a report from our independent valuation specialist, which concluded that our common stock had a value of $5.71 per share as of March 31, 2008 (or $1.90 per share following a 3-for-1 forward split of our common stock that became effective on July 31, 2008). In this report, the specialist used a discount rate of 25% in its discounted future cash flow analysis. Based on a sample of comparable publicly-traded companies, company-specific volatility was determined to be 55%, and the lack-of-marketability discount was 10%. In light of our
51
Table of Contents
plans to pursue an initial public offering at the time, management determined that the probability of an initial public offering was greater than a sale of the company, and thus the guideline company method was weighted 80% and the discounted future cash flow method was weighted 20%.
For options granted in December 2008 through March 2009, we based our estimate of the fair value of our common stock in part on a report from our independent valuation specialist, which concluded that our common stock had a value of $1.29 per share as of October 14, 2008. We also considered that, as a result of the severe downturn in the United States economy and financial market conditions in the fall of 2008, the stock prices of publicly-traded comparable companies declined significantly. Moreover, we withdrew our registration statement for an initial public offering in October 2008, thereby reducing the likelihood of a liquidity event for our stockholders. In connection with the withdrawal of our initial public offering, we recorded expenses of $3.4 million, which had a material negative impact on our results of operations. Finally, in December 2008 our former chief financial officer, whom we had hired in anticipation of a proposed initial public offering, ended his employment with us.
For options we granted from June 2009 through July 2009, we based our estimate of the fair value of our common stock in part on a report from our independent valuation specialist, which concluded that our common stock had a value of $1.26 per share as of March 31, 2009. In this report, the specialist continued to use a discount rate of 25% in its discounted future cash flow analysis. Based on a sample of comparable publicly-traded companies, company-specific volatility was determined to be 80%, and the lack-of marketability discount was 20%. Because we had abandoned our plans for an initial public offering in 2008, the weighting of the guideline company method was lowered to 67% and the discounted future cash flow method was weighted 33%. We also observed that the United States economy and financial market conditions continued to be unfavorable during 2009, and the likelihood of a successful liquidity event remained low. Our operating and financial performance was hampered by poor economic conditions, and we signed no new significant customer contracts during this period.
For options we granted from September 2009 through February 2010, we based our estimate of the fair value of our common stock in part on a report from our independent valuation specialist, which concluded that our common stock had a value of $1.20 per share as of June 30, 2009. We also considered a transaction in August 2009 in which our chief executive officer sold 200,000 shares of his common stock back to us for $1.00 per share. Our operating and financial performance continued to be affected by poor economic conditions, and we did not sign any new significant customer contracts through the end of 2009.
For options we granted from May 2010 through September 2010, we based our estimate of the fair value of our common stock in part on a report from our independent valuation specialist, which concluded that our common stock had a value of $1.34 per share as of March 31, 2010. The guideline company method and the comparable transaction method were weighted equally. Based on a sample of comparable publicly-traded companies, company-specific volatility was determined to be 70%, and the lack-of marketability discount was 20%. We also considered improvements in the United States economy and financial market conditions.
For options we granted from November 2010 through March 2011, we based our estimate of the fair value of our common stock in part on a report from our independent valuation specialist, which concluded that our common stock had a value of $1.44 per share as of September 30, 2010. The specialist continued to weigh the guideline company method and the comparable transaction method equally. Since the specialist’s last report as of March 31, 2010, we had renewed contracts with two of our largest customers, and we signed contracts with two significant new customers. In October 2010, Scott A. Bailey joined our executive team as chief operating officer. Finally, we considered continued improvement in the United States economy and financial market conditions and a transaction in September 2010 in which our chief executive officer sold 150,000 shares of his common stock back to us for $1.34 per share.
For options we granted from May 2011 through August 2011, we based our estimate of the fair value of our common stock in part on a report from our independent valuation specialist, which concluded that our
52
Table of Contents
common stock had a value of $1.66 per share as of March 31, 2011. We also considered the fact that the United States economy and financial market conditions improved in the first and second quarters of 2011 and our business continued to grow.
Stock Option Re-pricing. In June 2009, the Company’s Board of Directors determined that the fair value of the Company’s common stock had declined to $1.26 per share based on an independent valuation performed for the company and the other factors described above. In connection with this decline, stock options for a total of 2,217,694 shares of common stock, which were granted during from July 31, 2007 through September 16, 2008 with an exercise price above $1.99, were amended to have an exercise price of $1.26. The number of shares, the vesting commencement date and the length of the vesting period for each of these grants were not altered.
We treated the re-pricing as a modification of the original awards and calculated additional compensation costs for the difference between the fair value of the modified award and the fair value of the original award on the modification date. The re-pricing was estimated to result in incremental stock-based compensation expense of $0.3 million. The cost related to vested shares was expensed on the re-pricing date and the cost related to unvested shares will be amortized over the remaining vesting period of such stock options. The assumptions used to estimate the fair value of the original awards immediately before the modification and the fair value of the modified awards required significant judgment.
Recent Stock Option Grants. For the 198,000 options we granted in November 2011, we based our estimate of the fair value of our common stock in part on a report from our independent valuation specialist, which concluded that our common stock had a value of $1.85 per share as of September 30, 2011. We also considered the fact that while the United States economy and financial market conditions were difficult in the third quarter of 2011, our business continued to grow. In the third quarter of 2011, our operating and financial performance also benefited from a contract we signed with a significant new customer, and William J. Stuart, our current chief financial officer, joined our executive team.
In December 2011, we granted 261,500 options to directors and employees. We based our estimate of the fair value of our common stock on a report from our independent valuation specialist, which concluded that our common stock had a value of $2.98 per share as of December 15, 2011. In light of the fact that we had filed a registration statement for this offering, Anvil Advisors replaced the guideline company and comparable transaction methods in that report with the probability-weighted expected return method, or PWERM. Under the PWERM, the value of common stock is estimated based upon an analysis of future values for the enterprise assuming various scenarios and potential future expected outcomes (e.g., an initial public offering, or IPO, a merger or sale, continuing as a private company or dissolution with no value to common stockholders). Enterprise value is allocated to convertible preferred stock, warrants, options and shares of common stock based on the rights and characteristics of each equity instrument. The resulting share value is based upon the probability-weighted present value of expected future investment returns. The aggregate value of the common stock derived from the PWERM was then divided by the number of common shares to arrive at the per-share common value, and a discount for lack of marketability was then applied to the continuing as a private company scenario. This analysis resulted in a fair market value of our common stock of $2.98 per share as of December 15, 2011.
53
Table of Contents
Results of Operations
The following tables set forth our results of operations for the periods presented in amount and as a percentage of revenue for those periods. The period to period comparison of financial results is not necessarily indicative of future results.
| Year Ended December 31, | Nine Months Ended September 30, |
|||||||||||||||||||
| 2008 | 2009 | 2010 | 2010 | 2011 | ||||||||||||||||
| (in thousands) | ||||||||||||||||||||
| Revenue |
$ | 52,571 | $ | 60,798 | $ | 66,232 | $ | 48,041 | $ | 62,115 | ||||||||||
| Costs and operating expenses: |
||||||||||||||||||||
| Cost of revenue (1) |
28,575 | 34,074 | 36,703 | 26,907 | 32,872 | |||||||||||||||
| Research and development (1)(2) |
12,783 | 13,627 | 18,494 | 13,710 | 14,270 | |||||||||||||||
| Sales and marketing (2) |
5,732 | 5,591 | 6,211 | 4,597 | 5,811 | |||||||||||||||
| General and administrative (1)(2) |
4,997 | 4,966 | 5,656 | 3,941 | 4,887 | |||||||||||||||
| Withdrawn initial public offering expenses |
3,405 | — | — | — | — | |||||||||||||||
| Depreciation |
1,574 | 2,005 | 2,506 | 1,884 | 1,950 | |||||||||||||||
| Other operating expenses |
1,121 | — | — | — | — | |||||||||||||||
|
|
|
|
|
|
|
|
|
|
|
|||||||||||
| Total costs and operating expenses |
58,187 | 60,263 | 69,570 | 51,039 | 59,790 | |||||||||||||||
|
|
|
|
|
|
|
|
|
|
|
|||||||||||
| Income (loss) from operations |
(5,616 | ) | 535 | (3,338 | ) | (2,998 | ) | 2,325 | ||||||||||||
|
|
|
|
|
|
|
|
|
|
|
|||||||||||
| Other income (expense) |
156 | 69 | (2 | ) | (17 | ) | (18 | ) | ||||||||||||
| Interest expense |
294 | 285 | 240 | 189 | 64 | |||||||||||||||
|
|
|
|
|
|
|
|
|
|
|
|||||||||||
| Income (loss) before income taxes |
(5,754 | ) | 319 | (3,580 | ) | (3,204 | ) | 2,243 | ||||||||||||
| Provision for income taxes |
10 | 15 | 11 | 18 | 55 | |||||||||||||||
|
|
|
|
|
|
|
|
|
|
|
|||||||||||
| Net income (loss) |
$ | (5,764 | ) | $ | 304 | $ | (3,591 | ) | $ | (3,222 | ) | $ | 2,188 | |||||||
|
|
|
|
|
|
|
|
|
|
|
|||||||||||
Notes:
| (1) | Exclusive of depreciation shown separately. |
| (2) | Includes stock-based compensation as follows: |
| Year Ended December 31, | Nine Months Ended September 30, |
|||||||||||||||||||
| 2008 | 2009 | 2010 | 2010 | 2011 | ||||||||||||||||
| (in thousands) | ||||||||||||||||||||
| Research and development |
$ | 221 | $ | 252 | $ | 398 | $ | 278 | $ | 205 | ||||||||||
| Sales and marketing |
142 | 189 | 202 | 140 | 141 | |||||||||||||||
| General and administrative |
305 | 460 | 268 | 187 | 294 | |||||||||||||||
54
Table of Contents
| Year Ended December 31, | Nine Months Ended September 30, |
|||||||||||||||||||
| 2008 | 2009 | 2010 | 2010 | 2011 | ||||||||||||||||
| Revenue |
100 | % | 100 | % | 100 | % | 100 | % | 100 | % | ||||||||||
| Costs and operating expenses: |
||||||||||||||||||||
| Cost of revenue (1) |
54 | 56 | 55 | 56 | 53 | |||||||||||||||
| Research and development (1) |
24 | 22 | 28 | 29 | 23 | |||||||||||||||
| Sales and marketing |
11 | 9 | 9 | 10 | 9 | |||||||||||||||
| General and administrative (1) |
10 | 8 | 9 | 8 | 8 | |||||||||||||||
| Withdrawn initial public offering expenses |
6 | 0 | 0 | 0 | 0 | |||||||||||||||
| Depreciation |
3 | 3 | 4 | 4 | 3 | |||||||||||||||
| Other operating expenses |
2 | 0 | 0 | 0 | 0 | |||||||||||||||
|
|
|
|
|
|
|
|
|
|
|
|||||||||||
| Total costs and operating expenses |
110 | 99 | 105 | 107 | 96 | |||||||||||||||
|
|
|
|
|
|
|
|
|
|
|
|||||||||||
| Income (loss) from operations |
(11 | ) | 1 | (5 | ) | (6 | ) | 4 | ||||||||||||
| Other income (expense) |
0 | 0 | 0 | 0 | 0 | |||||||||||||||
| Interest expense |
1 | 0 | 0 | 0 | 0 | |||||||||||||||
|
|
|
|
|
|
|
|
|
|
|
|||||||||||
| Income (loss) before income taxes |
(11 | ) | 1 | (5 | ) | (7 | ) | 4 | ||||||||||||
| Provision for income taxes |
0 | 0 | 0 | 0 | 0 | |||||||||||||||
|
|
|
|
|
|
|
|
|
|
|
|||||||||||
| Net income (loss) |
(11 | )% | 1 | % | (5 | )% | (7 | )% | 4 | % | ||||||||||
|
|
|
|
|
|
|
|
|
|
|
|||||||||||
Note:
| (1) | Exclusive of depreciation shown separately. |
Comparison of Nine Months Ended September 30, 2010 and 2011
Revenue
| Nine Months Ended September 30, |
||||||||||||
| 2010 | 2011 | % Change | ||||||||||
| (in thousands) | ||||||||||||
| Revenue: |
||||||||||||
| Search and display advertising |
$ | 32,089 | $ | 48,040 | 50 | % | ||||||
| Subscriber-based |
15,952 | 14,075 | (12 | )% | ||||||||
|
|
|
|
|
|||||||||
| Total revenue |
$ | 48,041 | $ | 62,115 | 29 | % | ||||||
|
|
|
|
|
|||||||||
| Percentage of revenue: |
||||||||||||
| Search and display advertising |
67 | % | 77 | % | ||||||||
| Subscriber-based |
33 | 23 | ||||||||||
|
|
|
|
|
|||||||||
| Total revenue |
100 | % | 100 | % | ||||||||
|
|
|
|
|
|||||||||
Our revenue increased by approximately $14.1 million, or 29%, to approximately $62.1 million for the nine months ended September 30, 2011 from approximately $48.0 million for the same period in 2010. Search and display advertising revenue increased by approximately $15.9 million, or 50%, to approximately $48.0 million for the nine months ended September 30, 2011 from approximately $32.1 million for the same period in 2010. This increase was a result of increased search queries and advertising impressions on our platform, driven in part by the launch of a significant new customer on our platform in September 2010. The total number of search queries increased by 54% in the nine months ended September 30, 2011, and the total number of advertising impressions increased by 41% in the nine months ended September 30, 2011, in each case as compared to the nine months ended September 30, 2010. The increase in search queries contributed to approximately 72% of the increase in search and display advertising revenue, while the increase in advertising impressions contributed to approximately 28%.
55
Table of Contents
The increase in search and display advertising revenue was partially offset by a decline in subscriber-based revenue, which fell by approximately $1.9 million, or 12%, to approximately $14.1 million in the nine months ended September 30, 2011 from approximately $16.0 million for the same period in 2010. The decline was the result of adjustments in the subscriber-based fees we charge in order to participate in greater search and display advertising revenue resulting from the increases in search queries and advertising impressions.
Cost of Revenue
| Nine Months Ended September 30, |
||||||||||||
| 2010 | 2011 | % Change | ||||||||||
| (in thousands) | ||||||||||||
| Cost of revenue |
$ | 26,907 | $ | 32,872 | 22 | % | ||||||
| Percentage of revenue |
56 | % | 53 | % | ||||||||
Our cost of revenue increased by approximately $6.0 million, or 22%, to approximately $32.9 million for the nine months ended September 30, 2011 from approximately $26.9 million for the same period in 2010. The increase in our cost of revenue was driven by additional revenue-sharing costs from increased search and display advertising. Cost of revenue as a percentage of revenue declined to 53% of revenue in the nine months ended September 30, 2011 from 56% of revenue in the nine months ended September 30, 2010 because of changes in search and display advertising revenue attributable to the mix of customers with revenue-sharing arrangements.
Research and Development Expenses
| Nine Months Ended September 30, |
||||||||||||
| 2010 | 2011 | % Change | ||||||||||
| (in thousands) | ||||||||||||
| Research and development |
$ | 13,710 | $ | 14,270 | 4 | % | ||||||
| Percentage of revenue |
29 | % | 23 | % | ||||||||
Research and development expenses increased by approximately $0.6 million, or 4%, to approximately $14.3 million for the nine months ended September 30, 2011 from approximately $13.7 million for the same period in 2010. The increase was primarily due to a $0.9 million increase in employee-related costs as a result of the increase in headcount to support new product initiatives and customer deployments. In addition, there was a $0.3 million increase in expenses for contractors. These increases were partially offset by a $0.5 million decrease in spending on supplies and travel related expenses. The increase in spending reflects our increased hiring in 2010 in contemplation of new customer deployments in 2010 and 2011.
Sales and Marketing Expenses
| Nine Months Ended September 30, |
||||||||||||
| 2010 | 2011 | % Change | ||||||||||
| (in thousands) | ||||||||||||
| Sales and marketing |
$ | 4,597 | $ | 5,811 | 26 | % | ||||||
| Percentage of revenue |
10 | % | 9 | % | ||||||||
Sales and marketing expenses increased by approximately $1.2 million, or 26%, to approximately $5.8 million for the nine months ended September 30, 2011 from approximately $4.6 million for the same period in 2010. The increase was primarily due to a $0.5 million increase in employee-related costs as a result of the increase in headcount as we hired salespeople in our advertising department. The remaining increases include a $0.4 million increase for sales commissions and a $0.1 million increase for reporting services.
56
Table of Contents
General and Administrative Expenses
| Nine Months Ended September 30, |
||||||||||||
| 2010 | 2011 | % Change | ||||||||||
| (in thousands) | ||||||||||||
| General and administrative |
$ | 3,941 | $ | 4,887 | 24 | % | ||||||
| Percentage of revenue |
8 | % | 8 | % | ||||||||
General and administrative expenses increased by approximately $1.0 million, or 24%, to approximately $4.9 million for the nine months ended September 30, 2011 from approximately $3.9 million for the same period in 2010. The increase was primarily due to a $0.5 million increase in employee-related costs as a result of hiring in our executive management and finance departments. The remainder of the increase includes $0.4 million for independent contractors to support our growth.
Depreciation
| Nine Months Ended September 30, |
||||||||||||
| 2010 | 2011 | % Change | ||||||||||
| (in thousands) | ||||||||||||
| Depreciation |
$ | 1,884 | $ | 1,950 | 4 | % | ||||||
| Percentage of revenue |
4 | % | 3 | % | ||||||||
Depreciation remained consistent at approximately $1.9 million for the nine months ended September 30, 2010 and 2011.
Other Income (expense)
| Nine Months Ended September 30, |
||||||||
| 2010 | 2011 | |||||||
| (in thousands) | ||||||||
| Other income (expense) |
$ | (17 | ) | $ | (18 | ) | ||
For each of the nine-month periods ended September 30, 2010 and 2011 foreign currency transactions related to our operations in the United Kingdom accounted for nearly all other income (expense).
Interest Expense
| Nine Months Ended September 30, |
||||||||
| 2010 | 2011 | |||||||
| (in thousands) | ||||||||
| Interest expense |
$ | 189 | $ | 64 | ||||
Interest expense decreased for the nine months ended September 30, 2011 compared to the same period in 2010 as a result of lower average capital lease and bank financing balances. The interest rates applied to those balances remained substantially the same period-over-period.
57
Table of Contents
Provision for Income Taxes
| Nine Months Ended September 30, |
||||||||
| 2010 | 2011 | |||||||
| (in thousands) | ||||||||
| Provision for income taxes |
$ | 18 | $ | 55 | ||||
We have incurred operating losses which are available to offset income and, consequently, did not incur any material federal or state income taxes for the nine months ended September 30, 2011 and 2010. We do not anticipate recording significant tax benefits or provisions in the near future.
Comparison of Years Ended December 31, 2008, 2009 and 2010
Revenue
| Year Ended December 31, | 2008
to 2009% Change |
2009
to 2010% Change |
||||||||||||||||||
| 2008 | 2009 | 2010 | ||||||||||||||||||
| (in thousands) | ||||||||||||||||||||
| Revenue: |
||||||||||||||||||||
| Search and display advertising |
$ | 32,212 | $ | 39,268 | $ | 45,859 | 22 | % | 17 | % | ||||||||||
| Subscriber-based |
20,359 | 21,530 | 20,373 | 6 | % | (5 | )% | |||||||||||||
|
|
|
|
|
|
|
|||||||||||||||
| Total revenue |
$ | 52,571 | $ | 60,798 | $ | 66,232 | 16 | % | 9 | % | ||||||||||
|
|
|
|
|
|
|
|||||||||||||||
| Percentage of revenue: |
||||||||||||||||||||
| Search and display advertising |
61 | % | 65 | % | 69 | % | ||||||||||||||
| Subscriber-based |
39 | 35 | 31 | |||||||||||||||||
|
|
|
|
|
|
|
|||||||||||||||
| Total revenue |
100 | % | 100 | % | 100 | % | ||||||||||||||
|
|
|
|
|
|
|
|||||||||||||||
In 2010 our revenue increased by $5.4 million, or 9%, to $66.2 million from $60.8 million in 2009. Search and display advertising revenue increased by $6.6 million, or 17%, to $45.9 million in 2010 from $39.3 million in 2009 as a result of increased search queries and advertising impressions on existing customers’ websites, as well as the launch of a significant new customer in September 2010. The total number of search queries increased by 18% in 2010, and the total number of advertising impressions increased by 14% in 2010 as compared with 2009. The increase in search queries accounted for approximately 75% of the increase in search and display advertising revenue in 2010, while the increase in advertising impressions accounted for approximately 25%. Subscriber-based revenue decreased $1.2 million, or 5%, to $20.4 million in 2010 from $21.5 million in 2009. The decrease was a result of reduced revenue of $2.0 million from existing products partially offset by increased revenue of $0.8 million from new value added services introduced after the beginning of 2009 to existing customers.
In 2009 our revenue increased by $8.2 million, or 16%, to $60.8 million from $52.6 million in 2008. Search and display advertising revenue increased by $7.1 million, or 22%, to $39.3 million in 2009 from $32.2 million in 2008 as a result of increased search queries and advertising impressions on existing customers’ websites. The total number of search queries increased by 22% in 2009, and the total number of advertising impressions increased by 75% in 2009. The increase in search queries accounted for approximately 38% of the increase in search and display advertising revenue, while the increase in advertising impressions accounted for approximately 62%. Subscriber-based revenue increased by $1.1 million, or 6%, to $21.5 million in 2009 from $20.4 million in 2008. Approximately $0.6 million of the increase resulted from the launch of new customer websites, and approximately $0.5 million resulted from the launch of new products with existing customers.
58
Table of Contents
Cost of Revenue
| Year Ended December 31, | 2008
to 2009% Change |
2009
to 2010% Change |
||||||||||||||||||
| 2008 | 2009 | 2010 | ||||||||||||||||||
| (in thousands) | ||||||||||||||||||||
| Cost of revenue |
$ | 28,575 | $ | 34,074 | $ | 36,703 | 19 | % | 8 | % | ||||||||||
| Percentage of revenue |
54 | % | 56 | % | 55 | % | ||||||||||||||
Our cost of revenue increased by $2.6 million, or 8%, to $36.7 million in 2010 from $34.1 million in 2009, in part because greater search and display advertising on our platform led to additional revenue-sharing costs, which grew by $3.8 million in 2010. This was partially offset by a decline in our content acquisition costs of $1.4 million. Cost of revenue as a percentage of revenue declined to 55% of revenue in 2010 from 56% of revenue in 2009. This reduction in cost of revenue as a percentage of revenue was the result of a change in customer mix.
Our cost of revenue increased by $5.5 million, or 19%, to $34.1 million in 2009 from $28.6 million in 2008, in part because greater search and display advertising on our platform led to additional revenue-sharing costs, which grew by $5.6 million in 2009. In addition, our content acquisition costs increased $0.5 million in 2009. Cost of revenue in 2008 included $0.6 million of one-time expenses related to the move of a data center from Buffalo, New York to Atlanta, Georgia. The increase in cost of revenue as a percent of revenue was the result of changes in search and display advertising revenue attributable to the mix of customers with revenue-sharing arrangements partially offset by relocation of a data center.
Research and Development Expenses
| Year Ended December 31, | 2008
to 2009% Change |
2009
to 2010% Change |
||||||||||||||||||
| 2008 | 2009 | 2010 | ||||||||||||||||||
| (in thousands) | ||||||||||||||||||||
| Research and development |
$ | 12,783 | $ | 13,627 | $ | 18,494 | 7 | % | 36 | % | ||||||||||
| Percentage of revenue |
24 | % | 22 | % | 28 | % | ||||||||||||||
Research and development expenses increased by $4.9 million, or 36%, to $18.5 million in 2010 from $13.6 million in 2009. The increase was primarily due to a $3.6 million increase in employee-related costs as a result of the increase in headcount as we added personnel to support new product initiatives and anticipated customer deployments in 2010 and 2011. The remaining increase includes $0.5 million for contractors, $0.4 million for supplies and $0.3 million for travel related costs.
Research and development expenses increased by $0.8 million, or 7%, to $13.6 million in 2009 from $12.8 million in 2008. The increase was due to a $0.8 million increase in employee-related costs as a result of additions to headcount to support new product initiatives and anticipated customer deployments.
Sales and Marketing Expenses
| Year Ended December 31, | 2008
to 2009% Change |
2009
to 2010% Change |
||||||||||||||||||
| 2008 | 2009 | 2010 | ||||||||||||||||||
| (in thousands) | ||||||||||||||||||||
| Sales and marketing |
$ | 5,732 | $ | 5,591 | $ | 6,211 | (2 | )% | 11 | % | ||||||||||
| Percentage of revenue |
11 | % | 9 | % | 9 | % | ||||||||||||||
Sales and marketing expenses increased by $0.6 million, or 11%, to $6.2 million in 2010 from $5.6 million in 2009. The increase included $0.3 million of additional sales commissions and additional payments to contractors and $0.1 million of additional travel-related expense.
59
Table of Contents
Sales and marketing expenses decreased by $0.1 million, or 2%, to $5.6 million in 2009 from $5.7 million in 2008. The decrease included a $0.2 million decline in payments to contractors, a $0.2 million decline in public relation services and a $0.1 million decline in trade show attendance costs. These decreases were partially offset by $0.4 million increase in employee related costs as a result of the increase in headcount.
General and Administrative Expenses
| Year Ended December 31, | 2008
to 2009% Change |
2009
to 2010% Change |
||||||||||||||||||
| 2008 | 2009 | 2010 | ||||||||||||||||||
| (in thousands) | ||||||||||||||||||||
| General and administrative |
$ | 4,997 | $ | 4,966 | $ | 5,656 | (1 | )% | 14 | % | ||||||||||
| Percentage of revenue |
10 | % | 8 | % | 9 | % | ||||||||||||||
General and administrative expenses increased by $0.7 million, or 14%, to $5.7 million in 2010 from $5.0 million in 2009. This increase was largely driven by an increase in contractor costs of $0.3 million and an increase in employee-related costs of $0.6 million as a result of additional headcount and related relocation costs, all to support our growth. These increases were partially offset by reduced legal and other expenses of $0.2 million.
General and administrative expenses remained constant at $5.0 million in 2009 and 2008.
Withdrawn Initial Public Offering Expenses
| Year Ended December 31, | ||||||||||||
| 2008 | 2009 | 2010 | ||||||||||
| (in thousands) | ||||||||||||
| Withdrawn initial public offering expenses |
$ | 3,405 | $ | — | $ | — | ||||||
During 2007 and the first quarter of 2008, we were preparing for a potential initial public offering, for which we had filed a registration statement with the SEC. During this process we incurred and capitalized approximately $3.4 million of professional services fees for legal, valuation and auditing services. As a result of severe adverse conditions of the United States economy and financial markets, we withdrew our registration statement in October 2008 and recorded these professional services fees of $3.4 million as an operating expense in the fourth quarter of 2008.
Depreciation
| Year Ended December 31, | 2008
to 2009% Change |
2009
to 2010% Change |
||||||||||||||||||
| 2008 | 2009 | 2010 | ||||||||||||||||||
| (in thousands) | ||||||||||||||||||||
| Depreciation |
$ | 1,574 | $ | 2,005 | $ | 2,506 | 27 | % | 25 | % | ||||||||||
| Percentage of revenue |
3 | % | 3 | % | 4 | % | ||||||||||||||
Depreciation increased by approximately $0.5 million, or 25%, to approximately $2.5 million in 2010 from approximately $2.0 million in 2009. This increase was driven by the purchase of assets to support the addition of new customers.
Depreciation increased by approximately $0.4 million, or 27%, to approximately $2.0 million in 2009 from approximately $1.6 million in 2008. This increase was driven by the purchase of assets to support the addition of new customers.
60
Table of Contents
Other Operating Expenses
| Year Ended December 31, | ||||||||||||
| 2008 | 2009 | 2010 | ||||||||||
| (in thousands) | ||||||||||||
| Other operating expenses |
$ | 1,121 | $ | — | $ | — | ||||||
In 2008 we relocated a data center from Buffalo, New York to Atlanta, Georgia. We incurred approximately $1.1 million of other operating expenses which included moving costs, consulting fees, and accelerated depreciation on retired data center assets.
Other Income (Expense)
| Year Ended December 31, | ||||||||||||
| 2008 | 2009 | 2010 | ||||||||||
| (in thousands) | ||||||||||||
| Other income (expense) |
$ | 156 | $ | 69 | $ | (2 | ) | |||||
For each of 2008, 2009 and 2010, other income (expense) consisted primarily of interest income coupled with foreign currency transaction losses related to our operations in the United Kingdom.
Interest Expense
| Year Ended December 31, | ||||||||||||
| 2008 | 2009 | 2010 | ||||||||||
| (in thousands) | ||||||||||||
| Interest expense |
$ | 294 | $ | 285 | $ | 240 | ||||||
Interest expense declined in 2010 as the average capital lease balances at a higher interest rate declined and the average bank loan balances at a lower interest rate increased. Interest expense remained essentially unchanged in 2008 and 2009 as our average combined outstanding capital lease and bank financings balances remained consistent and the interest rates on these balances also remained relatively consistent.
Provision for Income Taxes
| Year Ended December 31, | ||||||||||||
| 2008 | 2009 | 2010 | ||||||||||
| (in thousands) | ||||||||||||
| Provision for income taxes |
$ | 10 | $ | 15 | $ | 11 | ||||||
We have incurred operating losses which are available to offset income and, consequently, did not incur any material federal or state income taxes in 2008, 2009 and 2010. We do not anticipate recording significant tax benefits or provisions in the near future.
61
Table of Contents
Unaudited Quarterly Results of Operations and Other Data
The following tables present our unaudited quarterly results of operations and other data for the seven quarters ended September 30, 2011 in dollars and as a percentage of revenue. This unaudited quarterly information has been prepared on the same basis as our audited financial statements and, in the opinion of management, the statement of operations data includes all adjustments, consisting of normal recurring adjustments, necessary for the fair presentation of the results of operations for these periods. You should read this table in conjunction with our financial statements and related notes located elsewhere in this prospectus. The results of operations for any quarter are not necessarily indicative of the results of operations for any future periods.
| For the Three Months Ended | ||||||||||||||||||||||||||||
| March 31, 2010 |
June 30, 2010 |
September 30, 2010 |
December 31, 2010 |
March 31, 2011 |
June 30, 2011 |
September 30, 2011 |
||||||||||||||||||||||
| (in thousands, except per share and per-share data) | ||||||||||||||||||||||||||||
| Statements of Operations Data: |
||||||||||||||||||||||||||||
| Revenue |
$ | 16,540 | $ | 15,867 | $ | 15,634 | $ | 18,191 | $ | 18,694 | $ | 19,467 | $ | 23,954 | ||||||||||||||
| Costs and operating expenses: |
||||||||||||||||||||||||||||
| Cost of revenue (1) |
9,114 | 8,843 | 8,950 | 9,796 | 9,980 | 10,078 | 12,814 | |||||||||||||||||||||
| Research and development (1)(2) |
4,131 | 4,564 | 5,015 | 4,784 | 4,602 | 4,718 | 4,950 | |||||||||||||||||||||
| Sales and marketing (2) |
1,490 | 1,534 | 1,573 | 1,614 | 1,796 | 1,888 | 2,127 | |||||||||||||||||||||
| General and administrative (1)(2) |
1,325 | 1,389 | 1,227 | 1,715 | 1,551 | 1,512 | 1,824 | |||||||||||||||||||||
| Depreciation |
537 | 571 | 776 | 622 | 620 | 657 | 673 | |||||||||||||||||||||
|
|
|
|
|
|
|
|
|
|
|
|
|
|
|
|||||||||||||||
| Total costs and operating expenses |
16,597 | 16,901 | 17,541 | 18,531 | 18,549 | 18,853 | 22,388 | |||||||||||||||||||||
|
|
|
|
|
|
|
|
|
|
|
|
|
|
|
|||||||||||||||
| Income (loss) from operations |
(57 | ) | (1,034 | ) | (1,907 | ) | (340 | ) | 145 | 614 | 1,566 | |||||||||||||||||
|
|
|
|
|
|
|
|
|
|
|
|
|
|
|
|||||||||||||||
| Other income (expense) |
(14 | ) | (15 | ) | 12 | 15 | 1 | — | (19 | ) | ||||||||||||||||||
| Interest expense |
(57 | ) | (64 | ) | (68 | ) | (51 | ) | (32 | ) | (19 | ) | (13 | ) | ||||||||||||||
|
|
|
|
|
|
|
|
|
|
|
|
|
|
|
|||||||||||||||
| Income (loss) before income taxes |
(128 | ) | (1,113 | ) | (1,963 | ) | (376 | ) | 114 | 595 | 1,534 | |||||||||||||||||
| Provision for income taxes |
3 | 3 | 12 | (7 | ) | 3 | 3 | 49 | ||||||||||||||||||||
|
|
|
|
|
|
|
|
|
|
|
|
|
|
|
|||||||||||||||
| Net income (loss) |
(131 | ) | (1,116 | ) | (1,975 | ) | (369 | ) | 111 | 592 | 1,485 | |||||||||||||||||
|
|
|
|
|
|
|
|
|
|
|
|
|
|
|
|||||||||||||||
| Undistributed earnings allocated to preferred stockholders |
— | — | — | — | 101 | 541 | 1,292 | |||||||||||||||||||||
|
|
|
|
|
|
|
|
|
|
|
|
|
|
|
|||||||||||||||
| Net income (loss) attributable to common stockholders |
$ | (131 | ) | $ | (1,116 | ) | $ | (1,975 | ) | $ | (369 | ) | $ | 10 | $ | 51 | $ | 193 | ||||||||||
|
|
|
|
|
|
|
|
|
|
|
|
|
|
|
|||||||||||||||
| Net income (loss) per share attributable to common stockholders: |
||||||||||||||||||||||||||||
|
|
|
|
|
|
|
|
|
|
|
|
|
|
|
|||||||||||||||
| Basic |
$ | (0.04 | ) | $ | (0.30 | ) | $ | (0.52 | ) | $ | (0.10 | ) | $ | — | $ | 0.01 | $ | 0.04 | ||||||||||
|
|
|
|
|
|
|
|
|
|
|
|
|
|
|
|||||||||||||||
| Diluted |
$ | (0.04 | ) | $ | (0.30 | ) | $ | (0.52 | ) | $ | (0.10 | ) | $ | — | $ | 0.01 | $ | 0.03 | ||||||||||
|
|
|
|
|
|
|
|
|
|
|
|
|
|
|
|||||||||||||||
| Weighted average shares used to compute net income (loss) per share attributable to common stockholders: |
||||||||||||||||||||||||||||
| Basic |
3,669,985 | 3,687,838 | 3,774,418 | 3,788,329 | 3,859,818 | 3,949,981 | 4,637,332 | |||||||||||||||||||||
| Diluted |
3,669,985 | 3,687,838 | 3,774,418 | 3,788,329 | 44,423,843 | 44,871,616 | 43,823,857 | |||||||||||||||||||||
|
Notes: (1) Exclusive of depreciation shown separately. (2) Includes stock-based compensation as follows: |
| |||||||||||||||||||||||||||
(notes continue on following page)
62
Table of Contents
| For the Three Months Ended | ||||||||||||||||||||||||||||
| (Notes continued from previous page): | March 31, 2010 |
June 30, 2010 |
September 30, 2010 |
December 31, 2010 |
March 31, 2011 |
June 30, 2011 |
September 30, 2011 |
|||||||||||||||||||||
| Research and development |
$ | 111 | $ | 62 | $ | 105 | $ | 120 | $ | 71 | $ | 59 | $ | 75 | ||||||||||||||
| Sales and marketing |
56 | 32 | 52 | 62 | 49 | 41 | 51 | |||||||||||||||||||||
| General and administrative |
75 | 42 | 70 | 81 | 102 | 86 | 106 | |||||||||||||||||||||
| For the Three Months Ended | ||||||||||||||||||||||||||||
| March 31, 2010 |
June 30, 2010 |
September 30, 2010 |
December 31, 2010 |
March 31, 2011 |
June 30, 2011 |
September 30, 2011 |
||||||||||||||||||||||
| (as a percentage of revenue) | ||||||||||||||||||||||||||||
| Statements of Operations Data: |
||||||||||||||||||||||||||||
| Revenue |
100 | % | 100 | % | 100 | % | 100 | % | 100 | % | 100 | % | 100 | % | ||||||||||||||
| Costs and operating expenses: |
||||||||||||||||||||||||||||
| Cost of revenue (1) |
55 | % | 56 | % | 57 | % | 54 | % | 53 | % | 52 | % | 53 | % | ||||||||||||||
| Research and development (1) |
25 | % | 29 | % | 32 | % | 26 | % | 25 | % | 24 | % | 21 | % | ||||||||||||||
| Sales and marketing |
9 | % | 10 | % | 10 | % | 9 | % | 10 | % | 10 | % | 9 | % | ||||||||||||||
| General and administrative (1) |
8 | % | 9 | % | 8 | % | 9 | % | 8 | % | 8 | % | 8 | % | ||||||||||||||
| Depreciation |
3 | % | 4 | % | 5 | % | 3 | % | 3 | % | 3 | % | 3 | % | ||||||||||||||
|
|
|
|
|
|
|
|
|
|
|
|
|
|
|
|||||||||||||||
| Total costs and operating expenses |
100 | % | 107 | % | 112 | % | 102 | % | 99 | % | 97 | % | 93 | % | ||||||||||||||
|
|
|
|
|
|
|
|
|
|
|
|
|
|
|
|||||||||||||||
| Income (loss) from operations |
0 | % | (7 | )% | (12 | )% | (2 | )% | 1 | % | 3 | % | 7 | % | ||||||||||||||
|
|
|
|
|
|
|
|
|
|
|
|
|
|
|
|||||||||||||||
| Other income (expense) |
0 | % | 0 | % | 0 | % | 0 | % | 0 | % | 0 | % | 0 | % | ||||||||||||||
| Interest expense |
0 | % | 0 | % | 0 | % | 0 | % | 0 | % | 0 | % | 0 | % | ||||||||||||||
|
|
|
|
|
|
|
|
|
|
|
|
|
|
|
|||||||||||||||
| Income (loss) before income taxes |
(1 | )% | (7 | )% | (13 | )% | (2 | )% | 1 | % | 3 | % | 6 | % | ||||||||||||||
| Provision for income taxes |
0 | % | 0 | % | 0 | % | 0 | % | 0 | % | 0 | % | 0 | % | ||||||||||||||
|
|
|
|
|
|
|
|
|
|
|
|
|
|
|
|||||||||||||||
| Net income (loss) |
(1 | )% | (7 | )% | (13 | )% | (2 | )% | 1 | % | 3 | % | 6 | % | ||||||||||||||
|
|
|
|
|
|
|
|
|
|
|
|
|
|
|
|||||||||||||||
Notes:
| (1) | Exclusive of depreciation shown separately. |
| For the Three Months Ended | ||||||||||||||||||||||||||||
| March 31, 2010 |
June 30, 2010 |
September 30, 2010 |
December 31, 2010 |
March 31, 2011 |
June 30, 2011 |
September 30, 2011 |
||||||||||||||||||||||
| (in thousands) | ||||||||||||||||||||||||||||
| Additional Financial Data: |
||||||||||||||||||||||||||||
| Revenue: |
||||||||||||||||||||||||||||
| Search and display advertising |
$ | 10,759 | $ | 10,516 | $ | 10,814 | $ | 13,770 | $ | 14,235 | $ | 15,083 | $ | 18,722 | ||||||||||||||
| Subscriber-based |
5,781 | 5,351 | 4,820 | 4,421 | 4,459 | 4,384 | 5,232 | |||||||||||||||||||||
|
|
|
|
|
|
|
|
|
|
|
|
|
|
|
|||||||||||||||
| Total revenue |
$ | 16,540 | $ | 15,867 | $ | 15,634 | $ | 18,191 | $ | 18,694 | $ | 19,467 | $ | 23,954 | ||||||||||||||
|
|
|
|
|
|
|
|
|
|
|
|
|
|
|
|||||||||||||||
| For the Three Months Ended | ||||||||||||||||||||||||||||
| March 31, 2010 |
June 30, 2010 |
September 30, 2010 |
December 31, 2010 |
March 31, 2011 |
June 30, 2011 |
September 30, 2011 |
||||||||||||||||||||||
| Other Data: |
||||||||||||||||||||||||||||
| Adjusted EBITDA (1)(2) |
$722 | $(327) | $(904) | $545 | $987 | $1,457 | $2,471 | |||||||||||||||||||||
| Unique Visitors (3)(4) |
8,243,000 | 8,796,000 | 8,615,333 | 7,288,000 | 11,792,076 | 13,888,227 | 14,069,737 | |||||||||||||||||||||
| Search Queries (3)(5) |
112,219,468 | 103,859,612 | 110,579,288 | 127,029,621 | 146,278,350 | 153,862,860 | 203,335,131 | |||||||||||||||||||||
| Advertising Impressions (3)(6) |
4,678,818,176 | 4,427,171,181 | 4,663,471,203 | 5,063,509,109 | 5,785,304,866 | 5,993,229,228 | 7,682,888,761 | |||||||||||||||||||||
63
Table of Contents
|
Notes: (1) We define adjusted EBITDA as net income (loss), plus: provision for income taxes, interest expense, other (income) expense, depreciation, and stock-based compensation. Please see “Selected Financial Data—Adjusted EBITDA” above for more information on adjusted EBITDA and below for a reconciliation of adjusted EBITDA to net income (loss), the most directly comparable financial measure calculated and presented in accordance with GAAP. (2) In thousands. (3) Please see the section titled “Management’s Discussion and Analysis of Financial Condition and Results of Operations—Key Business Metrics” for additional information on unique visitors, search queries and advertising impressions, including how we define and measure these key business metrics. (4) Reflects the number of unique visitors to our customers’ websites computed on an average monthly basis during the applicable period. (5) Reflects the total number of search queries during the applicable period. (6) Reflects the total number of advertising impressions during the applicable period. |
| |||||||||||||||||||||||||||
| For the Three Months Ended | ||||||||||||||||||||||||||||
| Reconciliation of Adjusted EBITDA: | March 31, 2010 |
June 30, 2010 |
September 30, 2010 |
December 31, 2010 |
March 31, 2011 |
June 30, 2011 |
September 30, 2011 |
|||||||||||||||||||||
| (in thousands) | ||||||||||||||||||||||||||||
| Net income (loss) |
$ | (131 | ) | $ | (1,116 | ) | $ | (1,975 | ) | $ | (369 | ) | $ | 111 | $ | 592 | $ | 1,485 | ||||||||||
| Provision for income taxes |
3 | 3 | 12 | (7 | ) | 3 | 3 | 49 | ||||||||||||||||||||
| Interest expense |
57 | 64 | 68 | 51 | 32 | 19 | 13 | |||||||||||||||||||||
| Other (income) expense |
14 | 15 | (12 | ) | (15 | ) | (1 | ) | — | 19 | ||||||||||||||||||
| Depreciation |
537 | 571 | 776 | 622 | 620 | 657 | 673 | |||||||||||||||||||||
| Stock-based compensation |
242 | 136 | 227 | 263 | 222 | 186 | 232 | |||||||||||||||||||||
|
|
|
|
|
|
|
|
|
|
|
|
|
|
|
|||||||||||||||
| Adjusted EBITDA |
$ | 722 | $ | (327 | ) | $ | (904 | ) | $ | 545 | $ | 987 | $ | 1,457 | $ | 2,471 | ||||||||||||
|
|
|
|
|
|
|
|
|
|
|
|
|
|
|
|||||||||||||||
Increases in revenue have been driven by increases in search and display advertising revenue. This increase was a result of increased search queries and advertising impressions on our platform, driven in part by the launch of a significant new customer on our platform in September 2010. In general, revenue from search and display advertising is stronger in the fourth quarter due to higher levels of Internet usage and online commerce and advertising during the holiday season in November and December. Subscriber-based revenue has generally decreased as a result of adjustments in the subscriber-based fees we charge in order to participate in greater search and display advertising revenue resulting from the increases in search queries and advertising impressions.
Our cost of revenue has increased as revenue has increased due to revenue-sharing arrangements with our customers. Our cost of revenue has slightly decreased as a percentage of revenue because of changes in search and display advertising revenue attributable to the mix of customers with revenue-sharing arrangements.
The increases in research and development expense are a result of increased headcount to support new product initiatives and customer deployments in 2010 and 2011.
The increases in sales and marketing expense were primarily due to increases in employee-related costs as a result of the increase in headcount as we hired salespeople in our advertising department.
The increases in general and administrative expense was primarily due to employee-related costs as a result of hiring in our executive management and finance departments.
Liquidity and Capital Resources
Our primary liquidity and capital resource requirements are for financing working capital, investing in capital expenditures such as computer hardware and software, supporting research and development efforts, introducing new technology, enhancing existing technology, and marketing our services and products to new and existing customers. To the extent that existing cash and cash equivalents, cash from operations, cash from short-term borrowings and the net proceeds from this offering are insufficient to fund our future activities, we may need to raise additional funds through public or private equity offerings or debt financings.
64
Table of Contents
Since our inception, we have funded our operations and met our capital expenditure requirements primarily with venture capital funding. In four separate issuances of preferred stock, from Series A in November 2002 to Series C in October 2006 and November 2006, we have raised approximately $28.4 million from institutional investors. The proceeds from all of these issuances have been used for general business purposes, with the exception of the Series C preferred stock offering, a portion of which was used to repay approximately $0.7 million of notes payable. Each share of preferred stock is convertible into common stock at the respective conversion ratio for each series of preferred stock at any time, subject to adjustment triggered by changes in our capitalization such as a stock split. Conversion is automatic in the event of a public offering of common stock at a price per share representing a post-offering valuation (on a fully diluted basis) of at least $150.0 million with gross proceeds of at least $25.0 million. This conversion of all our outstanding series of preferred stock is expected to take place upon consummation of this offering.
In July 2011 we entered into an amended and restated loan and security agreement with a commercial bank, pursuant to which we can refinance an outstanding term loan from that bank with a new term loan in the principal amount of up to $3.0 million at any time before January 2012. As of September 30, 2011, the outstanding principal amount of the existing term loan was $0.4 million. We are in the process of repaying the principal amount of the existing term loan in 24 equal monthly installments, with the last such installment due in June 2012. Interest on the existing term loan is payable monthly at a per annum rate equal to the greater of 4.0% or the bank’s prime rate plus 0.5%. If we elect to refinance the existing term loan, we will be required to make monthly interest payments on the new term loan through January 2012. Thereafter, the principal amount of the new term loan will be payable in 30 equal monthly installments ending in July 2014. Interest will accrue on the new term loan at a per annum rate equal to the bank’s prime rate plus 0.5%, subject to a minimum rate per annum of 4.0%.
The amended and restated loan and security agreement also provides us with a revolving credit line of $6.0 million, which we can draw on at any time before July 2013, subject to a borrowing base calculation. Borrowings under the revolving credit line accrue interest at a per annum rate equal to the bank’s prime rate plus 0.25%, subject to a minimum rate of 4.0% per annum, and must be repaid by July 2013. As of September 30, 2011, $6.0 million was fully available under the revolving credit line, with no outstanding borrowings.
The amended and restated loan and security agreement contains provisions that allow the bank to accelerate repayment of both the existing term loan, the new term loan, if any, and the revolving credit line upon a material adverse change, as defined in the agreement, as well as other events of default. Our obligations under the agreement are secured by a blanket lien on all of our assets in favor of the bank. The agreement contains certain financial performance and reporting covenants. As of September 30, 2011, we were in compliance with the covenants.
As of September 30, 2011, we had approximately $7.3 million of cash and cash equivalents and money market funds. We did not have any short-term or long-term investments. We believe that our existing cash and cash equivalents, along with cash flows from operations and availability under our term loan and revolving credit line, will be sufficient to meet our anticipated working capital and capital expenditure requirements for at least the next 12 months.
Cash Flows
| Year Ended December 31, | Nine Months Ended September 30, |
|||||||||||||||||||
| 2008 | 2009 | 2010 | 2010 | 2011 | ||||||||||||||||
| (in thousands) | ||||||||||||||||||||
| Statements of Cash Flows Data: |
|
|||||||||||||||||||
| Cash flows provided by (used in) operating activities |
$ | (123 | ) | $ | 4,489 | $ | (1,333 | ) | $ | (2,298 | ) | $ | 4,011 | |||||||
| Cash flows used in investing activities |
(667 | ) | (828 | ) | (1,558 | ) | (1,279 | ) | (1,478 | ) | ||||||||||
| Cash flows used in financing activities |
(1,452 | ) | (2,029 | ) | (2,159 | ) | (1,211 | ) | (692 | ) | ||||||||||
65
Table of Contents
Cash Provided by (Used in) Operating Activities
From January 1, 2008 through September 30, 2011, we have generated $7.0 million in positive cash flows from operating activities. Our largest source of cash flows from operating activities is cash collections from customers and search and display advertising partners, including Google. Our primary uses of cash from operating activities are for revenue-sharing and content-acquisition costs, personnel related expenditures, and facilities expenses to support our growth.
Operating activities provided $4.0 million of cash in the nine months ended September 30, 2011. The cash flow from operating activities primarily resulted from our net income, adjusted for non-cash items, and changes in our operating assets and liabilities. We had net income in the nine months ended September 30, 2011 of $2.2 million, which included non-cash depreciation of $2.0 million and non-cash stock-based compensation of $0.6 million. Changes in our operating assets and liabilities used $0.8 million of cash during the nine months ended September 30, 2011, primarily due to an increase of $2.4 million in our accounts receivable partially offset by increases in our accounts payable of $0.7 million and other accrued expenses of $0.8 million. The increase in our accounts receivable was primarily due to our revenue growth in the nine months ended September 30, 2011. The increase in accounts payable and other accrued expenses was the result of increased spending due to the growth of our revenue-share payments associated with our revenue growth and the timing of payments to customers for revenue-sharing agreements and to content providers.
Operating activities used $2.3 million of cash in the nine months ended September 30, 2010. The cash flow from operating activities primarily resulted from our net loss, adjusted for non-cash items, and changes in our operating assets and liabilities. We had a net loss in the nine months ended September 30, 2010 of $3.2 million, which included non-cash depreciation of $1.9 million and non-cash stock-based compensation of $0.6 million. Changes in our operating assets and liabilities used $1.6 million of cash during the nine months ended September 30, 2010, primarily due to a decrease of $1.1 million in our accounts payable. The decrease in accounts payable was the result of the timing of payments to customers for revenue-sharing agreements partially offset by increased spending due to the growth of our revenue-share payments associated with our revenue growth.
Operating activities used $1.3 million of cash in 2010. The cash flow from operating activities primarily resulted from our net loss, adjusted for non-cash items, and changes in our operating assets and liabilities. We had a net loss in 2010 of $3.6 million, which included non-cash depreciation of $2.5 million and non-cash stock-based compensation of $0.9 million. Changes in our operating assets and liabilities used $1.1 million of cash in 2010, primarily due to an increase of $1.9 million in our accounts receivable partially offset by an increase of $1.0 million in our accounts payable. The increase in our accounts receivable was primarily due to our revenue growth in 2010. The increase in accounts payable was the result of increased spending due to the growth of our revenue-share payments associated with our revenue growth and the timing of payments to customers for revenue-sharing agreements.
Operating activities provided $4.5 million of cash in 2009. The cash flow from operating activities primarily resulted from our net income adjusted for non-cash items, and changes in our operating assets and liabilities. We had net income in 2009 of $0.3 million, which included non-cash depreciation of $2.0 million, non-cash stock-based compensation of $0.9 million, non-cash bad debt write-off of $0.3 million and a non-cash loss on disposal of equipment of $0.1 million. Changes in our operating assets and liabilities provided $0.9 million of cash in 2009, primarily due to increases in our accounts payable of $2.2 million and decreases of our prepaid expenses of $0.9 million. The favorable components of cash provided by operating activities were partially offset by increases in our accounts receivable of $0.9 million and decreases of our accrued expenses of $1.1 million. The increase in accounts payable was the result of increased spending due to the growth of our revenue-share payments associated with our revenue growth and the timing of payments. The decrease in prepaid expenses reflects the timing of advance payments made to content providers. The increase in our accounts receivable was primarily due to our revenue growth in 2009 and the decrease in our accrued expenses was due to timing of payments made to content providers.
66
Table of Contents
Operating activities used $0.1 million of cash in 2008. The cash flow from operating activities primarily resulted from our net loss adjusted for non-cash items, and changes in our operating assets and liabilities. We had a net loss in 2008 of $5.8 million, which included non-cash write-off of capitalized initial public offering costs of $3.4 million, non-cash depreciation of $2.0 million and non-cash stock-based compensation of $0.7 million. Changes in our operating assets and liabilities used $0.5 million of cash in 2008, primarily due to an increase in our accounts receivable of $1.0 million and decreases in our accounts payable of $0.7 million. The unfavorable components of cash used in operating activities were partially offset by a decrease in our long-term assets of $1.1 million. The increase in our accounts receivable was primarily due to our revenue growth in 2008. The decrease in accounts payable was primarily due to the decrease in payments due relating to our initial public offering.
Cash Used in Investing Activities
Our investing activities have consisted of purchases of property, equipment and software to build out our data centers. For the nine months ended September 30, 2011, net cash used in investing activities was $1.5 million. For the nine months ended September 30, 2010, net cash used in investing activities was $1.3 million. Net cash used in investing activities for the years ended December 31, 2010, 2009 and 2008 were $1.6 million, $0.8 million, and $0.7 million, respectively. Purchases of property, equipment and software may vary from period to period due to the timing of the expansion of our operations. We expect to continue to invest in property, equipment and software for the remainder of 2011 and into the foreseeable future.
Cash Used in Financing Activities
For the nine months ended September 30, 2011, net cash used in financing activities was approximately $0.7 million primarily for repayments of $1.8 million on our capital lease obligations and bank financing partially offset by proceeds of $0.8 million from a sale-leaseback of equipment transaction and $0.3 million of proceeds from the exercise of common stock options.
For the nine months ended September 30, 2010, net cash used in financing activities was approximately $1.2 million primarily for repayments of $1.8 million on our capital lease obligations and bank financing partially offset by proceeds of $0.6 million from borrowings on bank financing.
For the year ended December 31, 2010, net cash used in financing activities was approximately $2.2 million primarily for repayments of $2.6 million on our capital lease obligations and bank financing and $0.2 million used for the repurchase of our common stock from our chief executive officer partially offset by proceeds of $0.6 million from borrowings on bank financing.
For the year ended December 31, 2009, net cash used in financing activities was approximately $2.0 million primarily for repayments of $2.0 million on our capital lease obligations and $0.4 million used for the repurchase of our common stock from certain stockholders partially offset by proceeds of $0.4 million from borrowings on bank financing.
For the year ended December 31, 2008, net cash used in financing activities was approximately $1.5 million primarily for repayments of our capital lease obligations.
Quantitative and Qualitative Disclosures about Market Risk
We have operations both within the United States and internationally, and we are exposed to market risks in the ordinary course of our business. These primarily include interest rate and inflation risk.
Interest Rate Risk
Our cash and cash equivalents primarily consist of cash and money market funds. We currently have no investments of any type. Our exposure to market risk for changes in interest rates is limited because nearly all of our cash and cash equivalents have a short-term maturity and are used primarily for working capital purposes.
67
Table of Contents
Inflation Risk
We do not believe that inflation has had a material effect on our business, financial condition or results of operations. If our costs were to become subject to significant inflationary pressures, we may not be able to fully offset such higher costs through price increases. Our inability or failure to do so could harm our business, financial condition and results of operations.
Recently Issued and Adopted Accounting Pronouncements
Fair Value Measurements
In October 2009, the FASB amended the accounting standard for multiple deliverable revenue arrangements, which provided updated guidance on whether multiple deliverables exist, how deliverables in an arrangement should be separated and how consideration should be allocated. This standard eliminates the use of the residual method and requires arrangement consideration to be allocated based on the relative selling price for each deliverable. We elected to early adopt this accounting standard on January 1, 2010 on a prospective basis for applicable transactions originating or materially modified after December 31, 2009. The adoption of this standard did not have a material impact on our financial statements.
Effective January 1, 2010, we adopted new authoritative guidance on fair value measurements and disclosures. The new guidance requires additional disclosures regarding fair value measurements, amends disclosures about post-retirement benefit plan assets, and provides clarification regarding the level of disaggregation of fair value disclosures by investment class. This guidance is effective for interim and annual reporting periods beginning after December 15, 2009, except for certain Level 3 activity disclosure requirements that will be effective for reporting periods beginning after December 15, 2010. Accordingly, we adopted this new guidance beginning January 1, 2010, except for the additional Level 3 requirements, which were adopted in 2011. Level 3 assets and liabilities are those whose fair value inputs are unobservable and reflect management’s best estimate of what market participants would use in pricing the asset or liability at the measurement date. The adoption of this guidance did not have a material impact on our financial statements.
In May 2011, the FASB issued guidance that establishes a global standard for applying fair value measurement. In addition to a few updates to the measurement guidance it includes enhanced disclosure requirements. The most significant change for companies reporting under GAAP is an expansion of the disclosures required for Level 3 measurements; that is, measurements based on unobservable inputs, such as a company’s own data. This update is effective for us beginning in fiscal year 2012. The adoption of this guidance is not expected to have a material impact on our financial statements.
Off-Balance Sheet Arrangements
As of September 30, 2011, we did not have any off-balance sheet arrangements.
Contractual Obligations
We lease office space and data center space under operating lease agreements and certain equipment under capital lease agreements. We are also obligated to make payments under various contracts with vendors and customers, principally for revenue-sharing and content arrangements.
68
Table of Contents
The following table sets forth our future contractual obligations as of December 31, 2010:
| Payments due by period | ||||||||||||||||||||||||||||
| Total | 2011 | 2012 | 2013 | 2014 | 2015 | 2016 | ||||||||||||||||||||||
| (in thousands) | ||||||||||||||||||||||||||||
| Bank financing |
$ | 750 | $ | 500 | $ | 250 | $ | — | $ | — | $ | — | $ | — | ||||||||||||||
| Capital lease obligations |
2,558 | 1,563 | 665 | 330 | — | — | — | |||||||||||||||||||||
| Operating lease obligations |
3,710 | 1,095 | 959 | 594 | 472 | 472 | 118 | |||||||||||||||||||||
| Contract commitments |
12,423 | 5,422 | 3,451 | 3,275 | 275 | — | — | |||||||||||||||||||||
|
|
|
|
|
|
|
|
|
|
|
|
|
|
|
|||||||||||||||
| Total |
$ | 19,441 | $ | 8,580 | $ | 5,325 | $ | 4,199 | $ | 747 | $ | 472 | $ | 118 | ||||||||||||||
|
|
|
|
|
|
|
|
|
|
|
|
|
|
|
|||||||||||||||
The contract commitments shown in the foregoing table represent fixed payment obligations to some of our customers and content providers. Agreements with certain customers and certain content providers require us to make fixed payments to them.
69
Table of Contents
Our Business
We are a leading provider of authentication and aggregation solutions for delivery of online content and services. We deliver our solutions as a set of services through our hosted and managed platform, enabling cable and telecom service providers and consumer electronics manufacturers to provide the online content and services their consumers increasingly demand. Our platform allows our customers to package a wide array of online content and services with their high-speed Internet, communications, television and other offerings. Our customers offer our services under their own brands on Internet-enabled devices such as PCs, tablets, smartphones and connected TVs. As of September 30, 2011, our high-speed Internet service provider customers used our platform to offer an engaging Internet experience to over 25% of the estimated 79 million United States high-speed Internet households.
Our hosted and managed platform allows our customers to enhance their consumers’ online experience. With the increase in Internet access speeds, improved search functionality and availability of content online, individuals are spending more time consuming online content at home and on the go. As a result, it has become increasingly important for our customers to provide consumers with choice, a personalized experience and seamless, single sign-on, access to online content and services. Our platform allows high-speed Internet service providers to compete with new market entrants who are delivering online video and entertainment directly to consumers, often over the very networks that those providers operate. We believe the increased functionality we offer through our platform results in an enhanced experience for consumers and a broadened relationship between our customers and their consumers, both of which increase the traffic associated with our platform. This increased traffic creates an opportunity, through our revenue-share agreements, for increased monetization for both us and our customers.
Our platform provides single sign-on capability, enabling consumers to seamlessly sign in and consume packaged online content and services from numerous programmers and content providers. These services include e-mail, security, online games, music and authentication of TV Everywhere, a technology enabling consumers with applicable rights to access on-demand television online via multiple devices including PCs, tablets, smartphones and connected TVs. We offer consumers access to these services on demand through a user-friendly, customer-branded online solution and, increasingly, across multiple devices. We enable our customers to up-sell a menu of content and services to their consumers either on a pay-per-view basis or as a new service tier added to their existing subscription relationship.
Our platform offers our customers a comprehensive solution by providing consumers access to a broad range of online products and services. Following initial integration with our platform, our customers gain access to a wide range of programmers and content and service providers with whom we have licensing and distribution agreements. In addition, we may integrate into our platform content and services that form part of our customers’ existing offerings. Our platform’s flexible architecture integrates with our customers’ billing and subscriber management systems, as well as with third-party content and services.
Our customers direct consumers to their branded websites, which comprise the consumer-facing components of our platform, where consumers have access to the online content and services available to them at their respective subscription levels. This enhanced Internet experience helps connect us and our customers to their large and engaged consumer base. We monetize the online traffic generated by these consumers through search and display advertising. We also charge fees for value added services delivered through our platform. Search queries, advertising impressions and use of our services have grown as we have added new customers and as our existing customers continue to further adopt our service offerings. Our business model creates deep customer relationships: as we monetize our customers’ online traffic, we share a portion of this revenue with our customers, resulting in a mutually beneficial partnership.
70
Table of Contents
We have historically experienced growth in the number of consumers whose online traffic can generate search and display advertising revenues through our platform. The number of these consumers who are subscribers through our high-speed Internet customers has increased from 5.2 million in December 2006 to 9.5 million in December 2009 to 21.1 million in September 2011. These subscribers, along with other consumers, such as those attributable to our consumer electronics manufacturer customer, have driven a 71% increase in average monthly unique visitors to our customers’ websites, an 81% increase in average monthly search queries by consumers on our platform and a 64% increase in average monthly advertising impressions, each on a comparative quarterly basis since the first quarter of 2010.
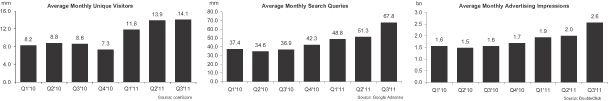
In turn, the increased usage of our platform over this period has driven the growth in our revenue and improvement of our net income and adjusted EBITDA. For the nine months ended September 30, 2011, our revenue was $62.1 million, which represented a 29.3% increase over $48.0 million in the same period in 2010. For the nine months ended September 30, 2011, our net income was $2.2 million compared to a net loss of $3.2 million in the same period in 2010. For the nine months ended September 30, 2011, adjusted EBITDA was $4.9 million compared to $(0.5) million over the same period in 2010. Adjusted EBITDA is a non-GAAP financial measure, and thus should be considered in addition to, not as a substitute for, or superior to, measures of financial performance prepared in accordance with GAAP. For additional information on adjusted EBITDA, including its limitations, and for a reconciliation of adjusted EBITDA to net income (loss), the most directly comparable financial measure calculated and presented in accordance with GAAP, for each of these periods, see “Selected Financial Data.”
Market Overview
According to a June 2011 report published by PwC, from 2006 through 2010, high-speed Internet penetration (measured on a household basis) has increased substantially both within the United States and globally, from 46% and 18% to 69% and 34%, respectively. This represents an increase from 50 million households with high-speed Internet to 79 million households in the United States, and from 248 million households to 490 million households globally. Individuals are spending more time online driven by a growing selection of online services, higher bandwidth speeds, the increased amount of content available online and the societal shift towards virtual socialization. According to a report published by Forrester in May 2011, in 2010, people consumed 36% of their media on the Internet compared with only 19% in 2005. This growth in Internet usage has driven advertisers to expand their reach and market to these consumers who are increasingly spending their time online. According to the PwC report, Internet advertising is expected to continue to grow rapidly, with United States search advertising revenue growing at an average rate of approximately 10% per annum from 2011 to 2015, and United States display advertising revenue growing at an average rate of approximately 12% per annum over the same period. Taken together, the market for search and display advertising in the United States is expected to grow from $21 billion in 2011 to $31 billion in 2015.
71
Table of Contents
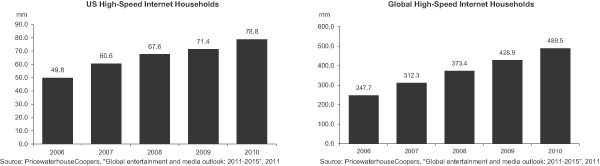
High-speed Internet service providers have continuously upgraded their networks in recent years, providing users with significantly faster connection speeds and enabling online access through multiple types of devices, thus reinforcing and enabling the growth in Internet usage. These higher speeds and increased number of platforms have resulted in an increased number of services available online. Most significantly, this has led to an increase in consumer spending on Internet content, with $13 billion spent in 2010 projected to grow to over $30 billion in 2015 according to a report by VSS published in September 2011. In addition, the proliferation of new types of connected mobile devices, such as smartphones and tablets, has enabled consumers to increase the amount and type of content they consume online. According to a report by Cisco published in June 2011, mobile video traffic is expected to grow at a compound annual growth rate of 99% between 2011 and 2015, from 213 petabytes per month to over 3,300 petabytes per month, and by 2015 it is expected that more than half of the world’s mobile data traffic will be video. Consumers have become device-agnostic and expect to access their content across multiple devices. Rapid innovations in technology have made it possible for users to easily transition between smartphones, tablets, laptops and desktops, thereby significantly increasing the total amount of time spent online and the quality of the viewing experience.

72
Table of Contents
The rapid growth of online content offerings across a multitude of websites and apps, while embraced by consumers, has also created a new challenge, as consumers sometimes find it difficult to ascertain which online content they already have rights to access. Furthermore, the disaggregation of content forces consumers to sign on across multiple online platforms, making it cumbersome for them to access authorized content. Consumers want a simplified solution that allows them to sign on once and view all of their content in a seamless manner.
Increasingly available Internet connectivity, increases in high-speed Internet penetration and speed, and the expansion of online video content services, have driven explosive growth in consumption of video content delivered over the Internet to televisions, computers, tablets and smartphones, more commonly referred to as “over-the-top” (OTT). OTT content can either be downloaded or streamed and is monetized via pay-per-view video on demand, in-video advertisements or subscription payment models. The emergence of OTT services has driven a substantial increase in consumption of online media, fueled by the many ways consumers are able to view content online, the user-friendliness of platforms and website designs. Nevertheless, the OTT landscape remains highly fragmented, making specific content often difficult to find or consume. Over the last few years, video providers such as Google, Hulu, Netflix and Amazon have created or acquired services and mobile apps to capitalize on the OTT adoption trend. At the same time, content providers, such as ESPN, Inc., HBO (a division of Time Warner, Inc.) and Turner Broadcasting System, Inc., or Turner Broadcasting, are increasingly distributing their content online across a multitude of platforms. As a result, we believe high-speed Internet providers that also provide television services face a growing threat of disintermediation from these OTT providers, and are increasingly seeking compelling solutions to help them compete.
The Synacor Solution
Our customers face a number of challenges, including responding to changing consumer preferences, maintaining relevance in the face of increasing competitive pressure, addressing OTT and finding new ways to increase their average revenue per subscriber. We tailored our platform to provide solutions to these challenges and to enable our customers to:
| • | Deliver a compelling consumer experience. Our platform simplifies the consumer Internet experience by packaging online content and services with the goal of providing consumers easy access to the content they are entitled to receive—anytime, anywhere, on any device. We believe the enhanced online experience delivered by our platform drives increased use of our services as consumers spend more time on our customers’ websites. |
| • | Broaden relationships with consumers. We provide our customers with a platform that enables multiple touch points with consumers and increases engagement through an extensive offering of online content and services across multiple devices. We enable a high-speed Internet service provider to capitalize on consumers’ growing interest in OTT services by providing our customers the tools to offer authenticated video content online. In addition, we enable a consumer electronics manufacturer to maintain an ongoing relationship with consumers past the point of sale, generating new recurring revenue streams from advertising and consumption of additional services. We offer our services as a white-label solution to support our customers’ online branding and marketing efforts. |
| • | Increase monetization. We enable our customers to generate additional revenue by monetizing their consumer Internet traffic and packaging value added services which we partner with them to provide. We designed the functionality of our platform to increase the amount of time consumers spend using our services, which we believe leads to higher advertising viewership, more targeted advertising capabilities, higher click-through rates and higher CPMs. In addition, our customers may also generate additional revenue and increase consumer loyalty by offering their consumers |
73
Table of Contents
| our subscriber services such as e-mail, TV Everywhere, security and other value added services. Taken together, we provide our customers the opportunity to effectively leverage our platform to increase their average revenue per subscriber. |
Our Strengths
| • | Robust platform at scale. We benefit from scalable technology, our customers’ large subscriber base and extensive relationships with content providers. By applying our proprietary platform and investment in research and development, we are able to offer our services to new and existing customers on what we believe are highly competitive terms. As a result, we believe our customers benefit from the decrease in capital expenditures and ongoing maintenance expense required to implement and operate their own platform. In addition, we believe that our scale enables us to obtain more favorable terms from third parties (such as search and display advertising partners) than our customers could obtain on their own. Finally, our customers’ large subscriber base draws many programmers and content providers with whom we have content licensing agreements, enabling us to offer consumers access to an extensive range of online content. We believe that our economies of scale make it difficult for our customers to cost-effectively develop comparable solutions in-house or for a competitor to replicate our comprehensive suite of solutions. |
| • | Flexible and easily integrated solution. Our flexible platform allows our customers to package content that meets the specific requirements of their consumers. We designed our platform to fully integrate with our customers’ billing and subscriber management systems, enabling consumers to access content and services that they are authorized to receive across multiple devices. Our integration also provides our customers with an opportunity to package, cross-sell and up-sell premium content and additional tiers of service to their consumers. These characteristics allow us to offer highly customized solutions to a broad range of customers. |
| • | Large and engaged consumer base. Over the three months ended September 30, 2011, we had an average of 14.1 million unique visitors per month, as measured by comScore. These unique visitor levels represent a large and engaged consumer base that has developed as we have attracted new customers and added more content and services to our platform. We have the ability to target specific consumer segments, enabling us to attract advertisers seeking to target specific local and national audiences. Our access to broad content and our extensive customer relationships enable us to effectively monetize new products, services and advertisements by launching them to a large and engaged consumer base. |
| • | Established customer relationships. We have long-term relationships with many of our customers which, together with what we believe is a high cost of switching (from our platform to another solution), have resulted in very low levels of customer turnover over time. While we derive a substantial majority of our revenue from a small number of customers, the majority of our revenue attributable to our established customers is generated through search and display advertising. Consumer search and page view behavior patterns on our platform have historically followed consistent patterns as our customers have made our offerings available to their consumers. The combination of established customer relationships, low customer turnover and historically consistent search and page view behavior patterns has generally provided us with a high level of visibility on our search and display advertising revenue once a new customer is brought online. |
| • | Well positioned in large and growing market. The market for Internet-delivered content has grown rapidly over the past several years. We have been delivering online solutions to customers since 2000 and, as of September 30, 2011, had over 45 customers, including some of the nation’s major high speed Internet service providers and one major consumer electronics manufacturer. We |
74
Table of Contents
| continue to make ongoing investments in our platform to expand its functionality. We believe we are one of the only companies that has a platform solution with the scale and functionality to allow the largest high-speed Internet service providers and consumer electronics manufacturers to develop or expand their online video or other online and content offerings. As a result, we believe that we are well positioned to gain share as the market for these services continues to grow. |
Our Strategy
We intend to:
| • | Increase penetration and monetization of existing customers. We believe there is an opportunity to capitalize on the growth in Internet usage by our customers’ consumers and their increased demand for online content and services. For example, we intend to grow subscriber penetration and monetization by increasing the adoption of new packages of content and tiers of service. We also intend to sell more of our advertising directly through our display salesforce. Given the higher CPMs associated with direct advertising, we expect that this shift will increase our average CPM yields. Finally, we intend to increase the number of customers using our TV Everywhere authentication platform. |
| • | Acquire new customers. We intend to aggressively pursue new high-speed Internet service provider customers. We also plan to further develop our new distribution channels, such as sales to consumer electronics manufacturers. The development of new products and services, such as TV Everywhere, is a tool to attract new customers seeking to cater to the needs of their subscribers. Acquiring new customers will help strengthen our position as a leading provider of online content aggregation, authentication and delivery solutions. |
| • | Continue to invest in platform enhancements and technology solutions. We plan to continue developing new features and services for our platform, including continuing expansion of our platform’s offerings to tablets and smartphones. Through our close relationships with our customers, we gain early insight into how to address their needs and those of their consumers. We also design new products and services to anticipate these needs and, at times, dedicate separate development teams for these initiatives, as is the case for TV Everywhere. Our revenue-sharing business model enables us and our customers to monetize these service offerings. We expect that developing enhancements and solutions ahead of customers’ deployment requirements will continue to result in increased customer loyalty, satisfaction and profitability. |
| • | Expand internationally. We believe that our business model is scalable and readily adaptable to select markets outside the United States. We will focus on markets that have similar dynamics to the United States, where high-speed Internet service providers and consumer electronics manufacturers are striving to offer a differentiated product to their subscribers and consumers are seeking a single platform that packages and aggregates content. We are in the initial stages of international expansion and intend to increase our international presence in select markets with meaningful growth opportunities. |
Services and Products
We provide a proprietary technology platform that enables our customers to drive consumer engagement and generate new revenue streams through an array of online content and services such as video, search, advertising and value added services. Our customers use our platform to develop personalized websites that serve as their consumers’ respective online hubs for communication services, entertainment offerings and support services.
Our platform enables our customers to combine entertainment, such as television shows, multi-player games and streaming music based on a subscriber’s access rights and preferences with communications offerings
75
Table of Contents
such as voicemail, e-mail, and third party messaging services like Yahoo Mail, Google Gmail, AOL Mail, Facebook, and Twitter. Our platform further allows our customers to deliver appropriate account tools, support, bill pay services and up-sell promotions to their consumers, all without leaving the applicable customer’s website.
We generate revenue from consumer traffic on our platform through search and display advertising revenue, which we collect from our search partner, Google, our advertising network providers and directly from advertisers. We typically share a portion of this search and display advertising revenue with our customers. We also generate recurring revenues in the form of subscriber-based fees for the use of our platform, value added services and paid content, which we collect from our customers.
Our Platform
We believe the key features of our platform help our customers by substantially improving the subscriber experience. This increases revenues, promotes subscriber retention, strengthens our customers’ online presence and reinforces their brands.
| • | Website Design and Development. Using our technology platform, we create, design and develop branded websites for our customers. Our websites are designed to be the initial online destination for our customers’ consumers and typically aggregate a broad array of resources, including free-to-subscriber content and service offerings, value added services, online content and search, all in one location. |
| • | Unified Registration and Login (Single Sign-On). Our platform gives subscribers access to all of the value added services and paid content, including subscription television programming they have the right to consume, using a single user ID and password, which are typically the same credentials that they use for e-mail. Single sign-on for subscribers is accomplished by integrating with both our customers and our content and value added service partners. Because our single sign-on technology was built to accommodate many authentication mechanisms, we are able to integrate with a wide range of partners. |
| • | Billing Integration. Our platform allows our customers to integrate billing for value added services and paid content purchases with other services and products provided to their subscribers, including television and telephony service. A customer may collect transaction fees via credit card or on the subscriber’s service provider bill, and it may bill transactions each time they occur or on a monthly basis using monthly summary totals. Our system enables online bill review, providing subscribers with access to a detailed transaction account. |
| • | Personalization. Our platform enables the consumer to personalize his or her online experience through customization and localization. Consumers may add, delete, move, and otherwise customize the content displayed on our customers’ branded websites, such as by setting preferred television stations in our TV-at-a-glance module. Localization allows consumers to set a website to a “favorite” zip code to gain access to radio stations, weather, movies, and events, all in the local area. Among other things, our platform allows consumers to comment on online articles and to create shortcuts to their favorite content using an online “personal assistant” on the personalized website. Consumers are able to manage access to services and products available to each member of the household, define a budget limit for purchases for each member of the household and set the payment method (service provider bill vs. credit card) for access to paid offerings. |
| • | Video Delivery Capability. Our video delivery capability includes two primary components: a video player and a video discovery and delivery system. The video player contains video controls such as play, pause, fast forward and rewind and full-screen viewing and can be configured to play within or on top of a page. Our video discovery and delivery system is database-driven, supports multiple video hosting methods and enables transcoding from a number of video formats to formats that are playable on a variety of devices. The system contains a number of access control mechanisms, |
76
Table of Contents
| including the ability to restrict access based on IP address location, consumer type or household management settings. The system also permits consumers to search videos and browse by channel, genre or content type. |
| • | Content Management System. Our proprietary content management system enables our customers and us to create dynamic, customizable online experiences containing content from various sources. Content is distributed via web services in an architecture that is easily portable to multiple devices and platforms. Our system is comprised of administrative interfaces, a scalable content storage system and a system to distribute content to the platform. The interface is easy to use and displays a preview of page or component designs prior to approval and publishing. Our system can also automatically publish content from outside sources or assign publishing rights, by site section, to outside vendors. |
| • | Household Management. Our household management system puts parents in control of the content their children are allowed to purchase or consume through our platform. Among other things, this system allows the head of household to specify the range of products their “child accounts” may access and utilize and to establish preset spending limits for content purchases such as music. |
| • | Toolbar. We offer our customers the ability to create branded toolbars that can be personalized by their consumers. The toolbar can be updated automatically as new features become available and may be configured with search, weather, television and movie listings as well as value added services and paid content packages, enabling consumers to access their favorite features on our platform even when they leave our customers’ websites. The toolbars can also integrate internal services such as instant messaging, customer support and e-mail. |
| • | Television Listings. Our platform provides television listings and corresponding television channels, which enables consumers to search and browse local television programming. |
Search and Display Advertising
We use search and display advertising to generate revenue from consumer online traffic generated on our platform.
Search Advertising. We have a revenue-sharing relationship with Google, pursuant to which we include a Google-branded search tool on our customers’ websites. When a consumer makes a search query using this tool, we deliver it to Google, and Google returns search results that include advertiser-sponsored links to us, which we pass on to the consumer. If the consumer clicks on a sponsored link, Google receives payment from the sponsor of that link and shares a portion of that payment with us, which we in turn share with the applicable customer. We receive a monthly payment from Google within 30 days following the end of the month in which the revenue from the Google search advertising was earned; in turn we make revenue-share payments to our customers, subject to varying payment terms requiring payment from 30 days to 45 days following either the end of the month or quarter in which the revenue share was generated.
Display Advertising. We generate advertising revenue when consumers view or click on a text, graphic or video advertisement that is delivered on a Synacor-operated website. We sell some of our advertising inventory directly to advertisers using our team of direct advertising sales employees and independent advertising sales representatives. As of September 30, 2011, we had a total of ten in-house salespeople and independent advertising sales representatives, and we intend to hire additional salespeople and retain additional independent sales representatives. Our advertisers pay us a fee when a subscriber views or clicks the advertisement we place on their behalf on our customer’s website. We sell the rest of our advertising inventory through arrangements we have entered into with several advertising networks, including DoubleClick (a division of Google) and advertising.com (a division of AOL), among others. Advertisers pay these networks a fee to place their advertisements on various websites. When the networks place an advertisement on one of our customers’ websites, the network will pay us a portion of that fee. We typically share a portion of the payments from
77
Table of Contents
advertisers or advertising networks with the applicable customer. We have varying payment terms from advertisers and advertising networks ranging from 30 days to 60 days following the end of the month in which the revenue from the advertiser was earned; in turn we make revenue-share payments to our customers, subject to varying payment terms requiring payment from 30 days to 45 days following either the end of the month or quarter in which the revenue share was generated.
As we hire additional advertising salespeople and retain additional independent advertising sales representatives, we will target more advertisers directly as opposed to through advertising networks to fill our advertising inventory, which we expect will result in higher CPMs and, consequently, higher revenue.
Search and display advertising revenue contributed approximately 61%, 65% and 69% of our revenue for 2008, 2009 and 2010, or $32.2 million, $39.3 million and $45.9 million, respectively, and approximately 77% of our revenue for the nine months ended September 30, 2011, or $48.0 million. Search advertising revenue attributable specifically to our arrangement with Google contributed 48%, 45% and 49% of our revenue for 2008, 2009 and 2010, or $25.0 million, $27.7 million and $32.6 million, respectively, and approximately 55% of our revenue for the nine months ended September 30, 2011, or $34.0 million.
Subscriber-Based Services
Using our proprietary technology platform, we provide our customers a flexible solution, enabling them to deliver a wide range of online content and value added services from multiple sources in a single, customizable online location. Our customers use our platform to provide their subscribers with access to free-to-subscriber content and service offerings, including television programming, news, sports, entertainment and weather, as well as paid content and other value added services, all from one location and with one login. Our platform employs a scalable and flexible architecture that allows us, and our customers, to add or change features and applications regularly, enabling subscribers to access them across a wide range of Internet-enabled devices, such as PCs, tablets, smartphones and connected TVs.
We offer both free-to-subscriber content and service offerings and paid content and value added services, which are paid for by our customers or their subscribers, individually or in bundled packages. The packages are accessed via our single sign-on capability according to access rules established by our customers and the content or service providers. These are available at our customers’ websites as well as the websites of the content and service providers. The following are illustrative examples of some of these packages, which we allow our customers to modify if they desire:
| • | E-mail and Calendar. We provide e-mail and calendar solutions to our customers using a suite of messaging products provided by a third party. We integrate these products into our technology platform to deliver e-mail and family calendars to subscribers from their websites. The system enables us to highlight customer-related and community events on subscribers’ calendars and insert advertising into e-mail interfaces. Additionally, we have developed voicemail and VOIP functionality for e-mail that allows subscribers to access voicemail from their e-mail. |
| • | Security. Our security offering typically includes anti-virus, firewall and intrusion detection, pop-up blocker, parental controls and automatic updates all powered by security suites, such as F-Secure. |
| • | TV Everywhere. Our platform enables subscribers to watch free television online or utilize our authentication functionality to authorize them to watch premium television online, on-demand using an approved Internet-connected device. We have developed a combined television/video solution with an information architecture that improves usability and serves as a destination point for all platforms, including linear, video on demand, or VOD, and other online content. We process various metadata on over 200,000 video assets (e.g., movies or television programs), from over 300 providers of video content. |
| • | Variety Package. Our variety package combines content from several Internet subscription and entertainment products into a single package. These packages may include any combination of games (such as AtomShockwave), greeting card services (such as American Greetings), weather |
78
Table of Contents
| services (such as weather.com), educational elements (such as Encyclopedia Britannica or Clever Island) and sports elements (such as MLB.com, NASCAR.com Trackpass, NHL.com or Fox Sports). |
| • | Sports Plus Package. The sports plus package combines access to multiple sports-related content providers that would otherwise require separate subscriptions into a single package. The package includes access to MLB.com, NASCAR.com Trackpass, NHL.com and Fox Sports. |
| • | Portable and Non-Portable Music. Our music offering includes download-to-own, download-to-rent, and streaming music from our content providers’ libraries of nearly 11 million songs. Non-portable subscriptions allow subscribers to play music on their PCs, while portable subscriptions allow the subscribers to listen to music on a mobile device. Our music services are provided through contractual relationships with MediaNet and Rdio, Inc. |
| • | GamesSomniaTM. Our GamesSomnia package includes subscriptions to popular online gaming services and gaming-related news sources, which may include offerings from Classic Atari, LEGO PC Games, Yummy Arcade, Shockwave and IGN Insider. |
| • | Learning EdgeTM. Our Learning Edge package combines a number of educational products that appeal to families with young children, which may include offerings from Nick Jr. Boost, Boston Test Prep, Clever Island, Encyclopedia Britannica and IKnowThat.com. |
Revenue from fees we charge for the use of our technology platform, e-mail, security and other value added services and paid content, which we refer to as subscriber-based revenue, contributed approximately 39%, 35% and 31% of our revenue for 2008, 2009 and 2010, respectively, and approximately 23% of our revenue for the nine months ended September 30, 2011. We invoice our customers on a monthly basis with varying payment terms ranging from 30 days to 45 days following the end of the month in which the revenue was earned. Our content provider payment terms range from prepayment to 30 days or 45 days following the end of the month in which the content was provided.
Technology and Operations
Technology Platform Architecture
Our technology platform has been designed and built to support reliability and scalability. To route traffic through our network in the most efficient manner, we use load-balancing products, which spread work among multiple servers, and link controllers, which monitor availability and performance of multiple connections to our platform. Our technology platform is fault tolerant and scalable through the addition of more servers as usage grows.
Data Center Facilities
We currently operate and maintain four data centers in regionally diverse locations and have a network operations center which is staffed 24 hours a day, 7 days a week. Our three primary data centers are located in shared facilities in Atlanta, Georgia; Denver, Colorado and Amsterdam, The Netherlands. We also maintain a secondary data center in a shared facility in Buffalo, New York. All systems are fully monitored for reporting continuity and fault isolation. The Atlanta, Buffalo, Denver and Amsterdam data centers are each in a physically secure facility using monitoring, environmental alarms, closed circuit television and redundant power sources. Our network operations center is located in a secure facility.
Customers
Our customers principally consist of high-speed Internet service providers, such as Charter and CenturyLink, as well as a consumer electronics manufacturer, Toshiba. Our customer contracts typically have an
79
Table of Contents
initial term of two to three years from the deployment of the customer’s website and frequently provide for one or more automatic renewal terms of one to two years each. Our customer contracts typically contain service level agreements which call for specific system “up times” and 24 hours per day, seven days per week support. As of September 30, 2011, we had agreements with over 45 customers. Revenue attributable to two customers, Charter and CenturyLink (including revenue attributable to Qwest, which merged with CenturyLink in April 2011), together accounted for approximately 65%, 62% and 60% of our revenue for the years ended December 31, 2008, 2009 and 2010, or $34.3 million, $37.8 million and $39.8 million, respectively, with each of these customers accounting for 20% or more in each such period. In addition, revenue attributable to Charter, CenturyLink (including revenue attributable to Qwest) and Toshiba accounted for approximately 63% of our revenue for the nine months ended September 30, 2011, or $39.1 million, with revenue attributable to two of these customers each accounting for 20% or more in such period and revenue attributable to the third customer accounting for more than 10% in such period. Revenue attributable to these customers includes the subscriber-based revenue earned directly from them, as well as the search and display advertising revenue earned through our relationships with our advertising partners, such as Google, based on traffic generated by their consumers on our platform. We believe we have strong and collaborative relationships with our customers, which is critical to our success.
Content Providers
We license the content which we provide to our customers, including free and paid content offerings and value added services, from numerous third-party content and service providers. Our content and service partners provide a variety of content, including news and information, entertainment, sports, music, video, games, shopping, travel, autos, careers and finance. To obtain this content, we enter into a variety of licensing arrangements with our content providers. These arrangements are typically one to three years in duration with payment terms that may be based on traffic, advertising revenue share, number of subscribers, flat fee payments over time, or some combination thereof. We use licensed content to populate our customers’ websites, as well as to provide value added services and paid content that subscribers may purchase for additional fees. As of September 30, 2011, we had arrangements with over 75 content providers such as MLB Advanced Media, L.P., or MLB Advanced Media, CNN, The Associated Press, FOX News Network, LLC, NASCAR, MusicNet, Inc., AG.com, Inc., or American Greetings, and Encyclopedia Britannica, Inc.
Sales and Marketing
Our sales and marketing efforts focus on five primary areas: platform sales, client services, account management, marketing and advertising sales. Our platform sales team consists of direct sales personnel who call upon prospective customers, typically large and mid-sized high-speed Internet service providers and consumer electronics manufacturers. A significant amount of time and effort is devoted to researching and analyzing the requirements and objectives of each prospective customer. Each bid is specifically customized for the prospective customer, and often requires many months of interaction and negotiation before an agreement is reached.
Once an agreement is reached, our client services team, working closely with the sales team, assumes responsibility for managing the customer relationship during the time of the initial deployment and integration period, which is usually three to six months. During this period, the customer’s technology platform is assessed and, if required, modifications are proposed to make it compatible with our technology platform. The client services team is responsible for the quality of the client deployment, customer relationship management during the time of deployment and integration and project management associated with upgrades and enhancements.
After deployment, our account management team takes over management of the customer relationship, analyzing the ways in which a customer could further benefit from increased use of our products and services. The account management team is responsible for ongoing customer relationship management, upgrades and enhancements to the available products and services, as well as tracking the financial elements and performance of the customer relationship.
80
Table of Contents
Our marketing team works closely with our account management team to deliver marketing programs that support our customers’ sales efforts as well as their consumers’ interaction with these products and services. We assist our customers in developing marketing materials, advertising and cross-channel commercials that can be accessed by consumers through different media outlets, including the Internet, print, television, and radio. We also assist our customers in training their customer service representatives to introduce and sell value added services and our paid content offerings to new and existing customers.
Our advertising sales team sells display advertising inventory directly to advertisers, frequently through the advertising agencies representing those advertisers. These advertisers may be small companies with the advertising regionally focused on the website of one customer, or large companies with nationwide advertising on the websites of many customers. We have a team of direct advertising sales employees and independent advertising sales representatives focused on this effort and expect to add to this team and to grow the amount of display advertising revenue generated with our customers.
Government Regulation
We generally are not regulated other than under international, federal, state and local laws applicable to the Internet or e-commerce or to businesses in general. Some regulatory authorities have enacted or proposed specific laws and regulations governing the Internet and online entertainment. These laws and regulations cover issues such as taxation, pricing, content, distribution, quality and delivery of services and products, electronic contracts, intellectual property rights, user privacy and information security.
Federal laws regarding the Internet that could have an impact on our business include the following: the Digital Millennium Copyright Act of 1998, which is intended to reduce the liability of online service providers of third-party content, including content that may infringe copyrights or rights of others; the Children’s Online Privacy Protection Act, which imposes additional restrictions on the ability of online services to collect user information from minors; and the Protection of Children from Sexual Predators Act, which requires online service providers to report evidence of violations of federal child pornography laws under certain circumstances.
Laws and regulations regarding user privacy and information security impact our business because we collect and use personal information regarding our customers’ websites. We use this information to deliver more relevant content and services and provide consumers with a personalized online experience. We share this information on an aggregate basis with our customers and content providers and, subject to confidentiality agreements, to prospective customers and content providers. Laws such as the CAN-SPAM Act of 2003 or other user privacy or security laws could restrict our and our customers’ ability to market products to their consumers, create uncertainty in Internet usage and reduce the demand for our services and products or require us to redesign our customers’ websites.
Intellectual Property
We believe that the protection of our intellectual property is critical to our success. We rely on copyright and service mark enforcement, contractual restrictions and trade secret laws to protect our proprietary rights. We have entered into confidentiality and invention assignment agreements with our employees and contractors, and nondisclosure agreements with certain parties with whom we conduct business in order to limit access to and disclosure of our proprietary information. Our registered service mark in the United States is Synacor®.
We endeavor to protect our internally developed systems and maintain our trademarks and service marks. We generally control access to and use of our proprietary software and other confidential information through the use of internal and external controls, including contractual protections with employees, contractors, customers and partners, and our software is protected by United States and international copyright laws.
In addition to legal protections, we believe that factors such as the technological and creative skills of our personnel, new product developments, frequent product enhancements and reliable product support and services are essential to establishing and maintaining a technology leadership position.
81
Table of Contents
Competition
The market for Internet-based services and products in which we operate is highly competitive and involves rapidly-changing technologies and customer and consumer requirements, as well as evolving industry standards and frequent product introductions. While we believe that our platform offers considerable value and flexibility to our customers by helping them to extend their consumer relationships to a wide variety of Internet-based services, we face competition at three levels:
| • | When one of our prospective or existing customers considers another supplier, including one of our partners, for elements of the services or products which we provide. |
| • | When consumers choose to rely on other vendors for similar products and services. |
| • | When content and service providers prefer to establish direct relationships with one or more of our customers. |
Our technology platform, value added services and paid content offerings compete primarily with high-speed Internet service providers that have internal information technology staff capable of developing similar solutions in-house. In addition, we compete with companies such as Facebook, Inc., Yahoo!, Google, AOL and MSN, which have destination websites of their own or are capable of delivering competing platforms with content and service offerings similar to ours.
We also compete with providers of paid content and services over the Internet, especially companies with the capability of bundling paid content and value added services in much the same manner that we do. These companies include ESPN3, F-Secure Corporation or F-Secure, Exent Technologies Ltd. or Exent, Zynga Inc., MLB Advanced Media, Symantec Corporation, McAfee, Inc., Activision Blizzard, Inc. and Electronic Arts Inc. In some cases we have performed software integrations with these companies on behalf of our customers or, as in the case of F-Secure and Exent, we have partnered with them in order to offer their services more broadly to all our customers.
We believe the principal competitive factors in our markets include a company’s ability to:
| • | reinforce the brand of the high-speed Internet service provider; |
| • | produce products that are flexible and easy to use; |
| • | offer competitive fees for website development and operation; |
| • | generate additional revenue for high-speed Internet service providers; |
| • | enable high-speed Internet service providers to be involved in designing the “look and feel” of their online presence; |
| • | offer services and products that meet the changing needs of high-speed Internet service providers and their subscribers, including emerging technologies and standards; |
| • | provide high-quality product support to assist the customer’s service representatives; and |
| • | aggregate content to deliver more compelling bundled packages of paid content. |
We believe that we distinguish ourselves from potential competitors in three principal ways. First, we provide a white-label solution that, unlike the co-branded approach of most of our competitors, creates a consumer experience that reinforces our customers’ and partners’ brands. Second, we give customers control over the sign-on process and billing function for a wide range of Internet services and content by integrating with their internal systems (where applicable) thereby allowing our customers to “own the consumer.” Finally, our solution is flexible, meaning that we allow each customer to fashion websites that are specifically tailored to their desired “look and feel.”
82
Table of Contents
Employees
As of September 30, 2011, we had 253 employees in the United States and 1 employee in the United Kingdom. None of our employees is represented by a labor union, and we consider current employee relations to be good.
Facilities
Our corporate headquarters are located at 40 LaRiviere Drive, Buffalo, New York 14202. We lease approximately 31,000 square feet of office space at this address pursuant to a sublease agreement that expires in March 2016. The sublease agreement grants us a right of first offer over approximately 63,000 additional square feet in the same building.
We also maintain administrative offices in New York, New York and have data centers in Atlanta, Georgia; Buffalo, New York; Denver, Colorado and Amsterdam, The Netherlands.
We believe that our facilities are adequate to meet our current needs and that suitable additional or substitute space will be available as needed.
Legal Proceedings
From time to time, we may become involved in legal proceedings arising in the ordinary course of our business. We are not presently involved in any legal proceedings, the outcome of which, if determined adversely to us, would have a material adverse effect on our business, results of operations or financial condition.
83
Table of Contents
Executive Officers, Key Employees and Directors
Our executive officers, key employees and directors, and their ages and positions as of September 30, 2011, are set forth below. Our executive officers are Messrs. Frankel, Bailey, Chamoun and Stuart.
| Name |
Age | Position | ||||
| Ronald N. Frankel |
55 | President, Chief Executive Officer and Director | ||||
| William J. Stuart |
60 | Chief Financial Officer | ||||
| Scott A. Bailey |
43 | Chief Operating Officer | ||||
| George G. Chamoun |
37 | Executive Vice President of Sales and Marketing | ||||
| Ross Winston |
39 | Chief Architect | ||||
| Theodore May |
56 | Senior Vice President of Strategy and Business Affairs | ||||
| Julia Culkin |
37 | Vice President of Human Resources | ||||
| Marwan Fawaz |
48 | Director | ||||
| Gary L. Ginsberg |
49 | Director | ||||
| Andrew Kau |
49 | Director | ||||
| Thomas W. Keaveney |
65 | Director | ||||
| Jordan Levy |
56 | Director | ||||
| Mark Morrissette |
40 | Director | ||||
| Joseph Tzeng |
56 | Director | ||||
Ronald N. Frankel has served as a member of our board of directors and as our President and Chief Executive Officer since April 2001. Prior to joining us, Mr. Frankel served as Chief Executive Officer of Perks.com, Inc. from 1998 to 2001. From 1994 to 1998 Mr. Frankel served as President of MGM Interactive, the interactive division of Metro-Goldwyn-Mayer Studios Inc. From 1993 to 1994, Mr. Frankel served as Senior Vice President of Marketing and Sales at Kenfil Distribution. From 1988 to 1991, Mr. Frankel served in several executive positions at Softview, Inc., lastly as Senior Vice President of Marketing and Sales. Mr. Frankel attended the University of California at Berkeley and received a J.D. from the University of Southern California Law Center. We believe it is appropriate and desirable for our Chief Executive Officer to serve on our board. Additionally, we believe Mr. Frankel’s extensive leadership experience at the company provides our board with useful insights with respect to management and operations.
William J. Stuart has served as our Chief Financial Officer since August 2011. From 2006 to 2011, Mr. Stuart served as Senior Vice President of Finance, Chief Financial Officer, Treasurer and Secretary for Avici Systems, Inc. (now Soapstone Networks, Inc.), or Soapstone, a publicly-held company. He also served as Soapstone’s President and on Soapstone’s board of directors from 2009 to 2011. From 2001 to 2006, Mr. Stuart was a partner at Still River Fund, a Boston-based venture capital firm. He has previously served as chief financial officer of the publicly-held Telco Systems (acquired by World Access, Inc.) as well as three privately-held technology companies. Mr. Stuart has a B.A. from Boston College and an M.B.A. from Northeastern University.
Scott A. Bailey has served as our Chief Operating Officer since October 2010. From 2007 to 2010, Mr. Bailey served as Senior Vice President and General Manager at Comcast.net, a division of Comcast Corporation, or Comcast. Prior to Comcast, from 2001 to 2007, Mr. Bailey served as Vice President and General Manager at Turner Sports Interactive, a division of Turner Broadcasting, where he managed a portfolio of web properties including NASCAR.com, PGATOUR.com and PGA.com. Mr. Bailey attended Bowling Green State University.
George G. Chamoun has served as our Executive Vice President of Sales and Marketing since June 2009. From our acquisition of MyPersonal in December 2000 to June 2009, Mr. Chamoun served as our Senior Vice President of Client Services. Mr. Chamoun was co-founder of Chek and served as its President from January 1998 until such acquisition. Mr. Chamoun holds a B.A. in Political Science from the State University of New York at Buffalo.
84
Table of Contents
Ross Winston has served as our Chief Architect since January 2011. Prior to that period, he served as our Vice President of Engineering from June 1999 to August 2006 and our Chief Technology Officer from August 2006 to January 2011. From June 1996 to June 1999, Mr. Winston served as Campuswide Information Systems Coordinator for the State University of New York at Buffalo, where he managed the university’s Internet portals and related applications. Previously, Mr. Winston was an independent consultant and served as the lead developer for two software and web development companies. Mr. Winston holds B.S. and M.S. degrees in Computer Science from the State University of New York at Buffalo.
Theodore May has served as our Senior Vice President of Strategy and Business Affairs since October 2009. Prior to that, he served as our Vice President of Content and Value Added Services since July 2005. From July 1997 to February 2005, Mr. May held various positions, including Vice President of Broadband, at America Online Inc. From 1987 to 1996, Mr. May served as Director of Strategic Planning and Vice President of New Media at Cablevision Systems Corp. From 1986 to 1987, Mr. May served as a Vice President in the Controller’s Division at Drexel Burnham Lambert Inc. From 1984 to 1986, Mr. May served as Associate Director of Business Planning and Development at CBS Broadcasting Inc. Mr. May holds a B.F.A. from The Julliard School and an M.B.A. from New York University.
Julia Culkin has served as our Vice President of Human Resources since August 2006. Prior to that period, she served as our Director of Human Resources from July 2005 to July 2006 and as our Manager of Human Resources from December 2004 to July 2005. From March 2002 to November 2004, Ms. Culkin served as an independent consultant, primarily for Towers Perrin, where she worked on various human resource-related projects, focusing on executive compensation. From May 2000 to December 2001, Ms. Culkin served as a Senior Compensation Analyst at Pitney Bowes Inc. From June 1998 to May 2000, Ms. Culkin served as a consultant for Towers Perrin where she worked with Fortune 1000 companies on various human resource-related projects, including executive compensation analyses, change management practices and human resource practices competitive research. Ms. Culkin holds a B.S. in Business Administration from the State University of New York at Buffalo.
Marwan Fawaz has been a member of our board of directors since December 2011. Since June 2011, Mr. Fawaz has served as Principal at Fawaz Consulting Services. From August 2006 through March 2011, Mr. Fawaz was an Executive Vice President and Chief Technology Officer at Charter, and served as an executive officer of Charter during the pendency of its Chapter 11 cases in 2009. From March 2003 until July 2006, Mr. Fawaz served as Senior Vice President and Chief Technical Officer for Adelphia Communications Corporation, or Adelphia. Adelphia filed a petition under Chapter 11 of the Bankruptcy Code in June 2002. From April 2002 to March 2003, he served as Investment Specialist/Technology Analyst for Vulcan, Inc. Mr. Fawaz served as Regional Vice President of Operations for the Northwest Region for Charter from July 2001 to March 2002. From July 2000 to December 2000, he served as Chief Technology Officer for Infinity Broadband. He served as Vice President — Engineering and Operations at MediaOne, Inc. from January 1996 to June 2000. Mr. Fawaz received a B.S. degree in electrical engineering and a M.S. in telecom engineering from California State University — Long Beach. We believe Mr. Fawaz’s significant experience as an executive at Charter, one of our customers, enables him to bring a valuable customer perspective to our board and provides our board with insight into how prospective and existing customers value our product offering.
Gary L. Ginsberg has been a member of our board of directors since December 2011. Mr. Ginsberg has been the Executive Vice President of Corporate Marketing and Communications at Time Warner Inc. since February 2010. From 1999 through late 2009, Mr. Ginsberg served as the Executive Vice President in various capacities at News Corporation. Mr. Ginsberg has also been a managing director at the strategic consulting firm Clark & Weinstock, a senior editor and counsel at George, the magazine, a former Assistant Counsel to President Clinton, and an attorney with Simpson Thacher & Bartlett LLP. Mr. Ginsberg holds an A.B. from Brown University and a J.D. from Columbia University School of Law. Mr. Ginsberg is a member of the boards of directors of the John F. Kennedy Library Foundation, the Newseum, New Visions for Public Schools and New York Cares. In the past five years, Mr. Ginsberg has served on the boards of directors of Vringo, Inc. and Audible, Inc. and on the audit committee of Audible, Inc. We believe Mr. Ginsberg’s significant and high-level experience in the media industry enables him to bring valuable operational and management experience to our board and provides our board with a unique insight into potential partnerships with companies in the media industry.
85
Table of Contents
Andrew Kau has been a member of our board of directors since Chek acquired MyPersonal in December 2000. Prior to that period, Mr. Kau served as a director of MyPersonal from September 1999 until such acquisition. Mr. Kau has been a managing director at Walden International since 1994. From 1992 to 1994, Mr. Kau was President of Chemical Technologies Ventures. Mr. Kau was a management consultant at Strategic Planning Associates, LLC from 1991 to 1992 and at Booz, Allen and Hamilton Inc. from 1985 to 1987. From 1983 to 1985, Mr. Kau was a research scientist at Systems Planning Corporation. Mr. Kau holds a Sc.B. in Electrical Engineering from Brown University and an M.B.A. from the University of Virginia. We believe Mr. Kau’s experience as a venture capital investor enables him to bring significant technology knowledge to our board. Additionally, Mr. Kau’s lengthy history on our board enables him to provide essential leadership to the board on corporate governance and operational matters.
Thomas W. Keaveney has been a member of our board of directors since June 2009. Mr. Keaveney has served as a Board Member and Senior Advisor for Advantage Capital since 2002. Mr. Keaveney previously served as an investment banker with Credit Suisse First Boston, or CSFB from 1976 to 2002, where he was Chairman of the Private Finance Department, and a member of both the Investment and Investment Banking committees. Prior to CSFB, Mr. Keaveney worked in the private finance department of Salomon Brothers and at the Teachers Insurance and Annuity Association. Mr. Keaveney holds a B.A. in Economics from Fordham University and an M.A. in Economics from the Fordham Graduate School of Arts and Sciences. We believe Mr. Keaveney’s significant finance background provides our board with insight regarding finance-related matters.
Jordan Levy has been a member of our board of directors since October 2001. Mr. Levy has been a general partner at Softbank Capital since June 2005. In October 1999, Mr. Levy co-founded Seed Capital Partners LLC and was a managing partner there until May 2005. In July 2007, he was appointed Chairman of the Erie Canal Harbor Development Corporation. From 2004 through 2009 Mr. Levy served on the board of directors of Lorex Technology Inc., a publicly-held company. Mr. Levy holds a B.A. in Political Science from the State University of New York at Buffalo. We believe Mr. Levy’s service on the boards of directors of other public companies and his lengthy history on our board give him a strong understanding of his role as a member of our board and enables him to provide essential strategic and corporate governance leadership to the board. Additionally, Mr. Levy’s experience as a venture capital investor, including at the seed stage, enables him to bring significant technology experience to our board.
Mark Morrissette has been a member of our board of directors since October 2006. Mr. Morrissette has been a Managing Director at North Atlantic Capital since July 2000. From March 1995 to December 1998, Mr. Morrissette was a senior associate at Advent International Corporation. From August 1993 to March 1995, Mr. Morrissette was an analyst at CSC Index. Mr. Morrissette holds a B.A. in Economics from Dartmouth College and an M.B.A. from Harvard Business School. We believe Mr. Morrissette’s experience as a venture capital investor enables him to bring significant technology experience to our board.
Joseph Tzeng has been a member of our board of directors since Chek acquired MyPersonal in December 2000. Prior to that, Mr. Tzeng served as a director of MyPersonal from September 1999 until such acquisition. Mr. Tzeng has been a managing director of Crystal Internet Ventures since November 1996. Mr. Tzeng holds an undergraduate degree in Computer Engineering and Information Science from National Chiao-Tung University, Taiwan and an M.S. in Computer Engineering and Information Sciences from Case Western Reserve University. We believe Mr. Tzeng’s experience as a venture capital investor and his academic training enables him to bring significant technology experience to our board.
Board Composition
Independent Directors
Our board of directors is currently composed of eight members. Prior to the consummation of this offering, we expect Messrs. Keaveney, Morrissette and Tzeng to resign from our board of directors, and we expect to appoint one additional director who will serve as the chairman of the audit committee and be the “audit
86
Table of Contents
committee financial expert” as defined in Item 407(d) of Regulation S-K. As of the date of this prospectus, that additional director has not been identified. Messrs. Fawaz, Ginsberg, Kau, Keaveney, Levy, Morrissette and Tzeng qualify as independent directors in accordance with the published listing requirements of The NASDAQ Global Market. The NASDAQ independence definition includes a series of objective tests, such as that the director is not, and has not been for at least three years, one of our employees and that neither the director, nor any of his family members has engaged in various types of business dealings with us. In addition, as further required by the NASDAQ rules, our board of directors has made a subjective determination as to each independent director that no relationships exist which, in the opinion of our board of directors, would interfere with the exercise of independent judgment in carrying out the responsibilities of a director. In making these determinations, our board of directors reviewed and discussed information provided by the directors and us with regard to each director’s business and personal activities and relationships as they may relate to us and our management. See “Transactions with Related Persons, Promoters and Certain Control Persons.”
Selection Arrangements
Our current directors were elected pursuant to a voting agreement that we entered into with certain holders of our common and preferred stock. This voting agreement will terminate upon the closing of this offering and there will be no further contractual obligations regarding the election of our directors. Our directors hold office until their successors have been elected and qualified or their earlier death, resignation or removal.
Classified Board
Our amended and restated certificate of incorporation and our amended and restated bylaws that will become effective immediately prior to the closing of this offering will provide for a classified board of directors consisting of three classes of directors, each serving a staggered three-year term. As a result, only one class of our board of directors will be elected each year from and after the closing. Our amended and restated certificate of incorporation and amended and restated bylaws that will become effective immediately prior to the closing of this offering will provide that the number of authorized directors may be changed only by resolution of a number of directors that is more than half of the number of directors then authorized (including any vacancies), and that, except as otherwise required by law or by resolution of the board, any vacancies or new directorships on the board may be filled only by vote of the directors and not by stockholders. The classification of the board of directors may have the effect of delaying or preventing changes in control of our company.
Board Committees
We currently have a compensation committee, a corporate governance and nominating committee, and an audit committee. Our board of directors and its committees set schedules to meet throughout the year and also can hold special meetings and act by written consent under certain circumstances. The independent members of our board of directors also periodically hold separate executive session meetings at which only independent directors are present. Our board of directors delegates various responsibilities and authority to its committees as generally described below. The committees regularly report on their activities and actions to the full board of directors. Each member of each committee of our board of directors qualifies as an independent director in accordance with the NASDAQ standards described above. Each committee of our board of directors has adopted a written charter. Upon the effectiveness of the registration statement of which this prospectus forms a part, copies of each charter will be posted on our website at www.synacor.com under the Investor Relations section. The inclusion of our website address in this prospectus does not include or incorporate by reference the information on our website into this prospectus.
Audit Committee
The current members of our audit committee are Messrs. Keaveney, Levy and Morrissette, each of whom is “independent” under the rules and regulations of the SEC and the listing standards of The NASDAQ Global Market. Mr. Morrissette chairs the audit committee. The audit committee of our board of directors
87
Table of Contents
oversees our accounting practices, system of internal controls, audit processes and financial reporting processes. Among other things, our audit committee is responsible for reviewing our disclosure controls and processes and the adequacy and effectiveness of our internal controls. It also discusses the scope and results of the audit with our independent auditors, reviews with our management and our independent auditors our year-end operating results and, as appropriate, initiates inquiries into aspects of our financial affairs. Our audit committee has oversight for our code of business conduct and is responsible for establishing procedures for the receipt, retention and treatment of complaints regarding accounting, internal accounting controls, auditing matters, federal securities laws (including any rules or regulations thereunder), the disclosures we are required to make to our stockholders as a public company and any other securities matters related to our code of business conduct, and for the confidential, anonymous submission by our employees of concerns regarding questionable accounting, auditing or securities laws matters. In addition, our audit committee has sole and direct responsibility for the appointment, retention, compensation and oversight of the work of our independent auditors, including approving services and fee arrangements. Our audit committee also is responsible for reviewing and approving all related party transactions in accordance with our related party transactions approval policy.
Compensation Committee
The current members of our compensation committee are Messrs. Kau, Levy and Tzeng, each of whom is “independent” under the rules and regulations of the SEC and the listing standards of The NASDAQ Global Market. Mr. Kau chairs the compensation committee. The purpose of our compensation committee is to oversee the responsibilities of our board of directors relating to executive compensation policies and programs. Among other things, specific responsibilities of our compensation committee include evaluating the performance of our chief executive officer and determining our chief executive officer’s compensation. In consultation with our chief executive officer, it also determines the compensation of our other executive officers. In addition, our compensation committee administers our equity compensation plans and has the authority to grant equity awards and approve modifications of such awards under our equity compensation plans, subject to the terms and conditions of any equity award policy adopted by our board of directors. Our compensation committee also reviews and approves various other compensation policies and matters.
Corporate Governance and Nominating Committee
The current members of our corporate governance and nominating committee are Messrs. Kau, Levy and Tzeng, each of whom is “independent” under the rules and regulations of the SEC and the listing standards of The NASDAQ Global Market. Mr. Kau chairs the corporate governance and nominating committee. The corporate governance and nominating committee of our board of directors oversees the nomination of directors, including, among other things, identifying, evaluating and making recommendations of nominees to our board of directors, and evaluates the performance of our board of directors and individual directors. Our corporate governance and nominating committee also is responsible for reviewing developments in corporate governance practices, evaluating the adequacy of our corporate governance practices and making recommendations to our board of directors concerning corporate governance matters.
Code of Business Conduct
Our code of business conduct applies to all of our employees, officers and directors. Upon the effectiveness of the registration statement of which this prospectus forms a part, the full text of our code of business conduct will be posted on our website at www.synacor.com under the Investor Relations section. We intend to disclose future amendments to certain provisions of our code of business conduct, or waivers of such provisions, at the same location on our website identified above and also in public filings. The inclusion of our website address in this prospectus does not include or incorporate by reference the information on our website into this prospectus.
88
Table of Contents
Compensation Committee Interlocks and Insider Participation
Compensation decisions during the year ended December 31, 2010 pertaining to executive officer compensation were made by our board of directors.
During 2010, Messrs. Kau, Levy and Tzeng served on the compensation committee of our board of directors. None of these committee members is currently or has been at any time one of our officers or employees. None of our executive officers has ever served or will serve as a member of the board of directors or compensation committee (or committee serving a similar function) of any other entity that has or has had one or more executive officers serving as a member of our board of directors or our compensation committee.
Limitation of Liability and Indemnification
Prior to the consummation of this offering, we will enter into indemnification agreements with each of our directors and executive officers and certain other key employees. The form of agreement provides that we will indemnify each of our directors, executive officers and such key employees against any and all expenses incurred by that director, executive officer or key employee because of his or her status as one of our directors, executive officers or key employees, to the fullest extent permitted by Delaware law, our amended and restated certificate of incorporation and our amended and restated bylaws (except in a proceeding initiated by such person without board approval). In addition, the form agreement provides that, to the fullest extent permitted by Delaware law, we will advance all expenses incurred by our directors, executive officers and such key employees in connection with a legal proceeding in which they may be entitled to indemnification.
Our amended and restated certificate of incorporation and amended and restated bylaws will contain provisions relating to the limitation of liability and indemnification of directors and officers. The amended and restated certificate of incorporation will provide that our directors will not be personally liable to us or our stockholders for monetary damages for any breach of fiduciary duty as a director, except for liability:
| • | for any breach of the director’s duty of loyalty to us or our stockholders; |
| • | for acts or omissions not in good faith or which involve intentional misconduct or a knowing violation of law; |
| • | in respect of unlawful payments of dividends or unlawful stock repurchases or redemptions as provided in Section 174 of the Delaware General Corporation Law; or |
| • | for any transaction from which the director derives any improper personal benefit. |
Our amended and restated certificate of incorporation also will provide that if Delaware law is amended after the approval by our stockholders of the certificate of incorporation to authorize corporate action further eliminating or limiting the personal liability of directors, then the liability of our directors will be automatically eliminated or limited to the fullest extent permitted by Delaware law.
Our amended and restated bylaws will provide that we will indemnify our directors and officers to the fullest extent permitted by Delaware law, as it now exists or may in the future be amended, against all expenses and liabilities reasonably incurred in connection with their service for or on our behalf. Our amended and restated bylaws will provide that we shall advance the expenses incurred by a director or officer in advance of the final disposition of an action or proceeding. Our amended and restated bylaws also will authorize us to indemnify any of our employees or agents and permit us to secure insurance on behalf of any officer, director, employee or agent for any liability arising out of his or her action in that capacity, whether or not Delaware law would otherwise permit indemnification.
89
Table of Contents
Compensation Discussion and Analysis
This Compensation Discussion and Analysis discusses our executive compensation philosophy, objectives and design, our compensation-setting process, our executive compensation components and the decisions with respect to our named executive officers’ compensation for fiscal year 2010 as well as certain other compensation-related actions taken after the end of 2010. The compensation provided to our named executive officers for 2010 is set forth in detail in the 2010 Summary Compensation Table and other tables and accompanying footnotes and narrative that follow this section.
Our executive officers whose compensation is discussed in this section and included in the compensation tables that follow this section, whom we refer to as our “named executive officers,” are:
Ronald N. Frankel, our President and Chief Executive Officer
Scott A. Bailey, our Chief Operating Officer
George G. Chamoun, our Executive Vice President of Sales and Marketing
Tim Peterman, our former Chief Operating Officer
We note that Mr. Peterman was our principal financial officer until his departure in April 2010. Following Mr. Peterman’s departure, Mr. Frankel fulfilled this function for the company until we hired William J. Stuart as our new chief financial officer in August 2011. Mr. Stuart will be a named executive officer for fiscal year 2011.
General Overview
To date, our executive compensation programs have emphasized variable compensation, which comprises two primary components of our programs: annual cash incentive bonuses and equity compensation in the form of stock options. As with other privately-held companies in our industry, our board of directors has generally held base salaries to a low level relative to market comparables as discussed below, reviewing them and generally providing for modest annual increases based upon merit, internal pay equity, performance and market conditions. Our board’s practice has been to grant additional equity awards to executive officers only as their prior equity awards become fully vested rather than to do annual “refresher” grants. Because our executives’ base salaries have remained relatively low and because our board of directors has made grants of additional equity awards relatively infrequently, our board focuses careful attention on our annual cash incentive bonus program, tying its objectives to our annual operating plan.
As described in more detail below, early in fiscal year 2010, two of our three named executive officers who were in their positions at the beginning of the year received base salary increases. Bonus targets did not change in 2010 for these three named executive officers compared with 2009 levels, nor did any of them receive new equity grants during 2010. Our annual cash incentive bonus program paid below target for 2010, as our board of directors determined that we had not made sufficient progress on our international expansion efforts and we had fallen short of our adjusted EBITDA objective. In October 2010, we hired a new chief operating officer, Mr. Bailey.
Early in fiscal year 2011, as part of its annual compensation review, and because many of our executive officers were by then almost fully vested in all their equity awards, our board of directors approved base salary increases and its compensation committee in August 2011 approved new equity awards for our chief executive officer, Mr. Frankel, and our executive vice president of sales and marketing, Mr. Chamoun. In addition, during the third quarter of 2011 our board approved a one-time bonus to Mr. Chamoun to reward him for completing certain significant business transactions in the first half of the year. In August 2011 in anticipation of this offering, we hired a new chief financial officer, Mr. Stuart.
90
Table of Contents
We anticipate that prior to completion of this offering, our board of directors or its compensation committee, after completing a comprehensive review of our officer compensation programs, may make certain adjustments to the compensation arrangements for our named executive officers, although we do not expect any such adjustments to be effective until the first quarter of fiscal year 2012 at the earliest.
Compensation Philosophy and Objectives
Because we compete in a new and rapidly evolving market, which is growing significantly and is highly competitive, we continually refine our business model with the goals of fostering the growth of our clients’ subscribers base, increasing the level of engagement of their consumers, developing new products on alternate platforms and expanding our international operations. Our ability to compete and succeed in this market is directly tied to our ability to recruit, reward and retain a highly-talented team of sales, marketing, technical, financial and operational professionals.
Our compensation philosophy is therefore designed to attract high-caliber talent with the skills, judgment and dedication to help us achieve our business goals and reward those who continue to perform at or above our expectations and contribute to our long-term success. The various elements of our compensation program permit us to recognize and reward individual achievements within the framework of the Company’s financial and business goals.
Our executive compensation program is designed to achieve three key objectives:
| • | attracting, rewarding, motivating and retaining talented and experienced individuals whose knowledge, skills and abilities are critical to our success and long-term value creation, |
| • | focusing our executive team on achievement of long-term and short-term financial and business goals, thereby aligning their interests with those of our stockholders, and |
| • | allowing the level of compensation received by our named executive officers to reflect individual contribution and performance. |
As mentioned above, our compensation programs to date have emphasized variable rather than fixed compensation. Because we have been in operation more than ten years, our long-term named executive officers have become fully vested over time in their equity compensation awards, which has two consequences for us. First, it requires that our board of directors consider from time to time whether to grant them additional equity awards to ensure we have effective retention arrangements in place. For example, Mr. Frankel and Mr. Chamoun both received stock option grants in 2007, which will be fully vested in the first quarter of 2012, prompting the compensation committee of our board of directors to approve the grant to them of additional stock option awards in the third quarter of 2011. Second, our board of directors ties our annual cash incentive bonus program closely to our annual operating plan, which results in annual bonus payments that it believes reflect our achievements over the relevant fiscal year. This emphasis on variable compensation has been chosen because our board of directors believed it to be the most effective way to motivate, focus and reward our executive officers on achieving both our short- and long-term objectives. We believe that our compensation levels reflect consideration of our stockholders’ interest in paying what is appropriate to achieve our corporate goals while conserving cash and managing stockholder dilution. The individual components of our programs, as well as the mix and relative weighting of these components, have not been determined on the basis of a specific formula. Similarly we have not had any policy or guidelines for allocating compensation between cash and non-cash components, or among different forms of non-cash compensation. Rather, our board of directors has considered in making compensation decisions some or all of the following factors (in no particular order):
| • | Internal equity and consistency |
| • | Cash resources |
91
Table of Contents
| • | Stockholder dilution |
| • | Individual performance |
| • | Individual potential |
| • | Market information |
| • | Corporate performance |
| • | Financial performance |
This multi-factor approach allows us to review and structure each named executive officer’s compensation package to attract and retain that individual. Increasingly, we are required to attract talent from larger, including publicly-traded, companies and across ever-expanding geographies. In order to succeed, we believe it is becoming increasingly necessary to offer a greater amount and proportion of base salary as well as competitive target cash bonus levels. At the same time, as a technology company, it is an important feature of our culture and history to foster an ownership mentality and so we continue to emphasize equity compensation. As we transition from a privately-held to a publicly-traded company, we will continue to evaluate our philosophy, objectives and design as circumstances require. At a minimum, we expect to review our executive compensation program annually to consider whether it is consistent with the philosophy described above and whether it is meeting our business needs.
Compensation-Setting Processes
Role of our Board of Directors. Prior to this offering, our board of directors has retained authority to approve compensation paid to our executive officers and has generally approved, after considering its compensation committee’s and Mr. Frankel’s recommendations, compensation decisions for our named executive officers. In this capacity, our board of directors has determined the overall annual budget including targeted compensation for our executive officers, reviewed corporate and individual performance against goals established at the beginning of each fiscal year, and approved annual, hiring process and other compensation actions taken with respect to our named executive officers.
While its role to date has largely been one of making recommendations on specific compensation decisions to the board for its consideration and approval, the compensation committee has taken an active role in the compensation-setting process, undertaking on behalf of the board the responsibilities of reviewing corporate and individual achievement in the context of the compensation-setting process, reviewing and evaluating compensation market data, proposing the structure of and reviewing achievement under our annual incentive cash bonus program, and making recommendations regarding changes in base salary and additional equity grants to our named executive officers. After having been delegated authority to do so by our board, the compensation committee approved in the third quarter of 2011 stock option grants to certain of our named executive officers
Our chief executive officer, as the manager of the executive team, assesses each executive officer’s contributions on a corporate, departmental and individual level and makes recommendations to the board of directors with respect to merit increases in salary and annual bonus award amounts to be made to the other executive officers. The board of directors evaluates, discusses and modifies or approves those recommendations and conducts a similar evaluation of the chief executive officer’s own contributions to the corporate goals.
With respect to compensation decisions for fiscal year 2010, including in connection with structuring and negotiating the compensation package offered to Mr. Bailey at the time he was hired in October 2010, the compensation committee obtained and reviewed competitive market data (described below), reviewed current executive officer compensation packages, and considered both internal equity among the executive officer team and the recommendations made by our chief executive officer. Our board of directors approved the committee’s recommendation with regard to Mr. Bailey’s compensation package.
92
Table of Contents
After completion of this offering, we expect the board’s compensation committee to take primary responsibility for executive officer compensation decisions. See “Management—Board Committees—Compensation Committee” above.
Role of Management. Our chief executive officer and vice president of human resources have supported our board of directors in its work by providing information relating to our financial plans, performance assessments of our executive officers and other personnel-related data. Our finance department works with our chief executive officer and vice president of human resources to gather financial and operational data that the chief executive officer reviews in making his recommendations. As described above, the chief executive officer made recommendations to the board’s compensation committee with respect to the compensation of other executive officers but did not participate in the determination of his own compensation.
We expect that the chief executive officer, vice president of human resources and other appropriate company personnel will support the board’s compensation committee in a similar manner in the future.
Role of Compensation Consultant. From time to time since 2007, our board of directors has worked with the compensation consulting firm of Frederic W. Cook. Although neither the board nor its compensation committee worked with this firm with respect to fiscal year 2010 or 2011 compensation, they have currently engaged Frederic W. Cook to assist with our 2012 executive compensation review. Except for the consulting services provided to the compensation committee, Frederic W. Cook did not perform any other services for the Company or its management. In connection with this review, which began during the third quarter of 2011, Frederic W. Cook prepared an executive compensation assessment analyzing current cash and equity compensation for our senior management team and developed a peer group of comparable companies. This information was used by the compensation committee in connection with its approval of additional equity grants to Mr. Frankel and Mr. Chamoun in August 2011 and will be used as a point of comparison against which our compensation programs can be compared for purposes of setting fiscal year 2012 compensation. The peer group is discussed below.
The compensation committee has the authority under its charter to engage and pay for the services of outside advisors and experts, including compensation consultants and counsel.
Peer Group and Market Data. Our board of directors has from time to time considered market data on compensation practices of certain other companies in its annual review of our executive compensation programs.
In 2009, our board of directors and its compensation committee reviewed and considered, on an informal basis, among other things, such market data in connection with setting fiscal year 2010 compensation. Specifically, they reviewed two composite compensation surveys in connection with setting 2010 executive officer salary levels: the 2009 Towers Perrin Executive Compensation Survey and the 2009 CompStudy US Technology Survey. The participating companies whose information is included in these surveys were not selected by our board or on behalf of our company, and we do not focus on any particular company covered by these surveys. The 2010 Towers Perrin Executive Compensation Survey includes publicly-traded companies in the technology industry, while the participants in the 2009 CompStudy US Technology Survey, whose identities are not disclosed, are venture capital-backed, privately-held companies in the information technology industry. In relative terms as it applied to fiscal year 2010 compensation decisions, our board of directors believed that the market information included in the CompStudy US Technology Survey was generally more relevant to our circumstances than the information reflected in the Towers Perrin survey. While both surveys were used as reference tools, the data was not the primary factor that drove decisions made for 2010. Rather, in making final compensation decisions for 2010, the board was also informed by a variety of other factors including corporate and individual performance, competitive factors in the market for talent, dynamics within our company and industry, and internal pay equity.
As mentioned above, Frederic W. Cook has created at our board’s request a group of peer companies for use in evaluating compensation decisions in fiscal year 2012 and beyond. Although the board has not yet
93
Table of Contents
received final data related to the peer group companies and, except with respect to the option grants to two named executive officers in the third quarter of 2011, no compensation decisions have been made after review of this market data, we expect that our board of directors and its compensation committee will consider this data in its decisions for 2012 compensation. This peer group, which includes public companies in the application software, software systems and digital media/broadcasting sectors that have annual revenue less than $650 million, consists of the following companies:
| ANSYS, Inc. |
RealD Inc. | |
| Ariba, Inc. |
Realpage, Inc. | |
| Aspen Technology, Inc. |
Rovi Corporation | |
| Brightcove, Inc. |
SeaChange International | |
| Commvault Systems, Inc. |
Solarwinds Worldwide, LLC | |
| Concur Technologies, Inc. |
Successfactors, Inc. | |
| Fortinet, Inc. |
Synchronoss Technologies, Inc. | |
| Netsuite Inc. |
Taleo Corporation | |
| Pandora Media, Inc. |
Tivo Inc. | |
| Qlik Technologies, Inc. |
Ultimate Software Group, Inc. |
Our compensation committee concluded that it was appropriate to review the compensation offered by these companies, notwithstanding that the group includes companies that are larger or have significantly more annual revenue than Synacor has, because it believes that these companies are representative of (although not a comprehensive list of all of) the companies against whom we primarily compete and will continue to compete for executive talent. In fact, we must compete in hiring key executives against companies much larger than the ones included in the peer group, including Comcast, Yahoo! and other large companies in the broader industry in which we operate. Our compensation committee and compensation consultant did not feel it appropriate to include such Goliaths in our peer group at this time. We expect that the peer group data will help us understand the directions in which we may need to take our general executive compensation practices, as well as to be well-positioned to offer competitive compensation packages should we need to hire executives for key positions, in the few years following the offering.
Except as described below with respect to base salaries, neither our board of directors nor its compensation committee have established specific targets based upon the peer group data for any other individual component of or total compensation for our executive officers.
Principal Elements of Executive Compensation
Our executive compensation program consists of four components:
| • | Base salary |
| • | Annual cash incentive bonuses |
| • | Equity compensation in the form of stock options |
| • | Certain employment termination- and change in control-related benefits |
Because of our efforts to preserve cash, it has not always been possible to provide an officer with a base salary at the level that our board of directors considers competitive. Accordingly, our board has from time to time instead approved an increase in target bonus, a one-time bonus or additional equity awards as a result of such shortfall in targeted base salary. Except in this respect, a determination by our board with regard to one component of compensation has generally not affected its determinations with regard to the other components.
Base Salaries. Our board of directors has established base salaries for our chief executive officer and other named executive officers based upon historical company compensation practices, the officer’s position, the
94
Table of Contents
scope of the officer’s responsibilities within the position, and general survey information about the market compensation for that position as described above. Base salaries are reviewed annually and adjusted as and when the board determines appropriate. Salary adjustments have been and we expect will continue to be determined by the board or the compensation committee in its discretion, based on competitive conditions, individual performance, our overall financial and business performance, changes in job duties and responsibilities, and our overall budget for base salary increases.
For fiscal years 2010 and 2011, our board of directors believes that to remain competitive in our hiring within the senior management ranks, our officer base salaries should approach the 50th percentile of the market data as drawn for each position for which data is available from the Towers Perrin and CompStudy surveys described above. In the fall of 2009, the compensation committee and our board of directors informally analyzed the base salary of each named executive officer and observed that the market data indicated that Messrs. Frankel and Chamoun both received base salaries significantly below this 50th percentile level. We believe this occurred with respect to our long-term executive officers because their base salaries had generally been established during the first few years of our operation, when our revenue was lower. While our board of directors believes that over time our officer base salaries should approach the 50th percentile level, it has not believed it appropriate to immediately increase salaries to this level. Rather, it prefers to gradually move toward this goal.
Following this review, our board in February 2010 increased Mr. Frankel’s annual base salary from $280,000 to $295,000 and Mr. Chamoun’s annual base salary from $175,000 to $225,000. With respect to Mr. Frankel, our board concluded that it would reconsider providing him a salary increase of the magnitude necessary to take his base salary to the 50th percentile at a later date and provided him instead with an ordinary annual merit increase. The increase in early 2010 left his base salary below the 25th percentile of the market data. On the other hand, with regard to Mr. Chamoun, the increase took his salary approximately to the 25th percentile, an increase which our board concluded was necessary to retain him. In connection with his joining us in October 2010, Mr. Bailey’s annual base salary was set at $325,000, which is slightly below the 50th percentile of the survey data for his position and necessary in our board’s judgment to hire and relocate him to the Buffalo area. Mr. Peterman’s annual base salary for 2010 was unchanged at $275,000.
In February 2011, our board approved additional increases to the annual base salaries for Mr. Frankel and Mr. Chamoun, increasing Mr. Frankel’s salary to $325,000 and Mr. Chamoun’s to $240,000. The market data indicated that the base salary amounts of Messrs. Frankel and Chamoun were below the level necessary to achieve our compensation objectives, based on companies in our geographic region, technology companies throughout the United States, and the compensation packages we have paid to our new hire executive officers. In each case the increase put the officer’s salary at or slightly below the 25th percentile for the applicable position.
In connection with his commencing employment with us in August 2011, our board of directors approved a base salary for Mr. Stuart, our new chief financial officer, of $250,000, which was negotiated with him and is substantially below the 25th percentile for his position based upon the survey data. Pursuant to his offer letter with us, his base salary will increase to $290,000 effective upon this offering, which represents slightly less than the 25th percentile for his position.
Annual Incentive Compensation. Our annual cash incentive bonus program for executive officers, originally adopted in 2007, is designed to drive toward achievement of our annual objectives and reward individual performance in connection with achievement of those objectives. Each year, our board upon the recommendation of its compensation committee establishes certain financial and corporate performance objectives which it later evaluates in light of full-year performance in determining the amount of bonus payments for our executive officers. Each named executive officer has a target bonus opportunity expressed as a percentage of his base salary as in effect at the end of the fiscal year. For fiscal year 2010, the bonus targets for our named executive officers were as follows: Mr. Frankel, 70%, and Messrs. Chamoun and Bailey, 50%. The bonus program provides an opportunity for greater-than-target payout upon overachievement, as determined by the board in its discretion, up to a maximum of two times the officer’s target bonus amount.
95
Table of Contents
The board retains discretion to increase or decrease bonus payments based on a variety of factors, such as accomplishing a specific business objective not included in the goals for the year (if it had a material impact on our financial results or business operations), assuming responsibility beyond the scope of the executive officer’s position, or accomplishing goals in a way that contributed materially to exceeding the financial targets for the year or generating revenue in future years.
For fiscal year 2010, 75% of the target bonus for each named executive officers was based upon two financial objectives having equal weight: a revenue objective and an adjusted EBITDA objective. The remaining 25% of the target bonus was tied to achievement of certain corporate objectives identified below. The board has not established a specific weighting with respect to these corporate objectives; rather, it reviews achievement of all such objectives and exercises its judgment to assign an achievement percentage with respect to this 25% portion of our annual cash incentive bonus.
With regard to 2010 objectives achievement and bonus payments, our board had established for the year a revenue goal of $67 million (actual achievement was $66 million) and an adjusted EBITDA goal of $3 million (actual achievement was $(0.5) million). Our board determined that the revenue achieved constituted performance substantially at target level for purposes of our 2010 annual cash bonus and therefore concluded that the financial objectives portion of the bonus program would pay out at the 37.5% level (50% of total for this 75% portion of the bonus). No bonus was awarded for the EBITDA component of the bonus program. The corporate objectives established for the year related to the business achievements identified below, which also indicates the achievement level assessment determined by our board for each objective:
| Strengthen domestic distribution with solid renewals and expand distribution by 10% | Achieved: Secured renewals and expanded distribution in excess of 10% | |
| Implement international expansion plan | Not achieved: Due to changing business priorities it was determined that we should delay international expansion | |
| Implement a plan to increase consumer usage of our portal product | Achieved: Launched a new generation of portal on several of our clients’ websites | |
| Launch a new Synacor “Advertising Network” to clients | Achieved: Hired a VP of Advertising and replaced several direct response ads with broader branded advertising, significantly improving the quality of advertising | |
As a result of partial achievement of the corporate objectives, our board determined in its judgment to pay out at the 20% level (80% of total) with respect to this (25%) portion of our bonus program. This resulted in a payout level of approximately 57% for Messrs. Frankel and Chamoun for 2010. Mr. Peterman did not receive a bonus payment for 2010, as he left before year-end. Mr. Bailey, who joined us in October 2010, was paid a pro-rated amount of his target bonus for the portion of the year that he worked with the Company. The total amounts actually paid to each named executive officer are reflected in the 2010 Summary Compensation Table under “Management—Executive Compensation” below.
The structure of the 2011 annual cash incentive bonus is essentially the same as the 2010 bonus program. Seventy-five percent of the target bonus ties to revenue and adjusted EBITDA goals, and twenty-five percent ties to corporate objectives. Performance achievement and bonus amount payments will be determined in the first quarter of 2012 with respect to our 2011 bonus program. Target bonus opportunities for Messrs. Frankel, Chamoun and Bailey remained unchanged from 2010, while Mr. Stuart was assigned a target bonus of 40% of his salary at the time he commenced employment with us in August 2011. Mr. Stuart is eligible to earn a pro-rated amount of his 2011 bonus.
96
Table of Contents
Long-Term Incentive Compensation. Our long-term equity incentive compensation is typically awarded in the form of options to acquire shares of our common stock, because we believe that stock options are the best retention device, offer our employees the opportunity to earn a more significant portion of equity than would other equity award instruments and, therefore, provide the greatest incentive for our management to drive toward increasing the value of our business. Our equity incentive plans were established to provide our employees, including our executive officers, with incentives to support our long-term success and growth. Prior to the date of this offering, stock option grants have generally been approved by our board of directors. Following this offering, our compensation committee will approve stock option and other equity award grants to executive officers and other employees, unless it decides to delegate authority to our chief executive officer to make routine grants to employees below the officer level at some point in the future. We expect that our chief executive officer will continue to make recommendations with regard to equity awards to be made to executive officers other than himself.
An executive officer typically receives a significant stock option grant in the year he or she commences employment. Thereafter, option grants may be made at varying times and in varying amounts at the discretion of our compensation committee or our board of directors. We do not have any program or obligation that requires us to grant equity compensation to any executive officer on specified dates, nor do we have any policy or practice with regard to granting options or equity awards in relation to the release of corporate information. Stock options are typically granted on the first board meeting following a new employee’s date of hire. For options granted to newly hired employees, the vesting commencement date applicable to their options is typically the first day of the month following the month in which they commence employment, whereas for options granted to current employees, the vesting commencement date is typically the first day of the month during which the grant is made. We anticipate that following this offering our compensation committee will review and update or change these procedures as it determines to be appropriate.
Prior to this offering, the size of each option grant was generally set at a level that our board of directors deemed appropriate to create a meaningful opportunity for stock ownership while reflecting the individual’s position with us and the individual’s potential for future responsibility. Prior to this offering since 2006, the exercise price of options has been determined by our board of directors on the basis of a report obtained from an independent valuation firm. We expect that the exercise price for options we grant following this offering will be the closing price of our common stock on the grant date.
Stock options granted under our 2006 Stock Plan generally vest subject to continued service as to 25% of the shares on the anniversary date of the first day of the month following the date of hire for the initial grant to an employee and the first day of the month following the date of grant for subsequent grants, and then as to 1/48th of the shares each month thereafter. These vesting schedules are designed to provide a meaningful incentive to remain in our employ over a long period of time and to reflect the prevailing practice among comparable companies.
To date, we have not granted additional options to employees on an annual basis, although we evaluate employee performance on an annual basis. Instead, additional options have been granted from time to time to employees if our board of directors determined that an additional grant was necessary on the basis of our retention or incentive needs, corporate and individual performance, the individual’s existing equity holdings, and internal pay equity. When additional grants have been made, the amount of such grants was determined in the discretion of the board of directors, who also considered any recommendation made by our chief executive officer.
Our board of directors has twice re-priced outstanding stock options held by our employees, including executive officers. In February 2008, our board, after determining that the fair value of the Company’s common stock had declined to $2.00 per share based on an independent valuation of the Company’s common stock, approved an offer to re-price outstanding options that had exercise prices above $2.00. All executive-level employees, including Messrs. Frankel, Chamoun and Peterman, chose to re-price the options they had received in
97
Table of Contents
2007 with exercise prices above $2.00 per share. As a condition of these officers participating in the re-pricing, they were required to reset their vesting commencement date to the effective date of the re-pricing. Except for the vesting schedule and the exercise price, all other terms of these options remained unchanged. As a result of the global economic conditions that occurred in late 2008 and early 2009, our board again decided to re-price outstanding stock options in June 2009, after determining that the fair value of the Company’s common stock had declined to $1.26 per share based on an independent valuation of the Company’s common stock. In connection with this second re-pricing, in which Messrs. Frankel, Chamoun and Peterman participated, no changes were made to the number of shares subject to the options, the vesting commencement date and the length of the vesting period.
During fiscal year 2010, the only option grant made to a named executive officer was the one made to Mr. Bailey in connection with his commencing employment. Our board of directors approved for Mr. Bailey an option to purchase 800,000 shares, with a per-share exercise price of $1.44. This option vests on our standard vesting schedule for new hire awards. The size of Mr. Bailey’s option grant was determined on the basis of the negotiations that occurred with respect to his offer letter. This grant is shown in the 2010 Grants of Plan-Based Awards Table below.
In connection with his commencing employment with us in August 2011, our new chief financial officer Mr. Stuart was granted an option to purchase 500,000 shares. This amount was determined based upon negotiations with Mr. Stuart in advance of his accepting the Company’s employment offer. At this same time, Frederic W. Cook completed an executive compensation study in preparation for the 2012 annual compensation review. Its report indicated that Mr. Frankel and Mr. Chamoun were at the 25th percentile for total compensation, based on a comparison with the peer group identified above, as set forth in the third paragraph under “Management—Compensation Philosophy and Objectives.” In an effort to address retention concerns, including in light of the fact that Messrs. Frankel and Chamoun would be fully vested in their outstanding options in the first quarter of 2012, our compensation committee with the support of our board of directors approved in August 2011 the grant of options to purchase 350,000 shares of our common stock to Mr. Frankel and an option to purchase 200,000 shares of our common stock to Mr. Chamoun. The compensation committee determined the number of shares subject to these awards based upon a number of factors, including such as providing the officer with a meaningful amount of unvested equity as we headed into fiscal year 2012 and achieving internal equity within the senior management team. All options granted in August 2011 had exercise prices equal to the then fair market value of our common stock of $1.66 per share, which valuation was based on a written report prepared by an independent valuation firm.
We currently do not require our directors or executive officers to own a particular amount of our common stock. Our board of directors is satisfied that stock and option holdings among our directors and executive officers are sufficient at this time to provide motivation and to align this group’s interests with those of our stockholders.
Employment Agreements. We have entered into letter agreements with each of our named executive officers that provide severance benefits in certain circumstances, including in connection with a change of control. The terms of these agreements are described below in “Management—Employment Agreements and Offer Letters” and “Management—Potential Payments upon Termination or Change in Control.” Our board of directors believes that it is appropriate to provide such benefits to our named executive officers in order to keep them focused on achieving corporate objectives in the context of at-will employment and the possibility of significant corporate events that could disrupt our employment relationships with our executive officers.
Other than the offer letters the company entered into with Mr. Bailey at the time of his hire in 2010 and Mr. Stuart at the time of his hire in 2011, we did not approve any new employment or similar agreements with our named executive officers during fiscal year 2010 or 2011.
98
Table of Contents
Perquisites
Our executive officers participate in the same group insurance and employee benefit plans as our other salaried employees. At this time, we do not generally offer special benefits plans or programs in which only executive officers may participate. However, because their offer letters tend to be negotiated, we have from time to time provided certain benefits to officers in connection with their commencing employment with us. During 2010, as negotiated with him prior to his accepting our employment offer, we provided Mr. Bailey with a relocation package in an amount of up to $150,000.
Clawback Policy
Our board of directors has not adopted a policy as to whether or not we will make retroactive adjustments to or require recovery of any cash or equity-based incentive compensation paid to the named executive officers (or others) where the payment was predicated upon the achievement of financial results that were subsequently the subject of a restatement. We will comply with applicable laws and regulations requiring any such adjustments to or recovery of incentive compensation in connection with a financial restatement.
Tax and Accounting Treatment of Compensation
Section 162(m) of the Internal Revenue Code places a limit of $1 million per person on the amount of compensation that we may deduct in any one year with respect to each of our named executive officers other than the chief financial officer. There is an exemption from the $1 million limitation for performance-based compensation that meets certain requirements. We expect all grants of options made under our 2006 Stock Plan and 2012 Equity Incentive Plan to qualify for the exemption. See “Management—Equity Benefit Plans” for more details. Grants of restricted shares or stock units under our equity award plans may qualify for the exemption if vesting is contingent on the attainment of objectives based on the performance criteria set forth in the plan and if certain other requirements are satisfied. Grants of restricted shares or stock units that vest solely on the basis of service cannot qualify for the exemption. Our current cash incentive plan is not designed to qualify for the exemption. To maintain flexibility in compensating officers in a manner designed to promote varying corporate goals, our compensation committee has not adopted a policy requiring all compensation to be deductible. Although tax deductions for some amounts that we pay to our named executive officers as compensation may in the future be limited by section 162(m), we would not expect this limitation would result in the payment of increased federal income taxes by us immediately following this offering due to our net operating loss carry-forward position. Our compensation committee may approve compensation or changes to plans, programs or awards that may cause the compensation or awards to exceed the limitation under section 162(m) if it determines that such action is appropriate and in our best interests.
Under current accounting rules governing the manner in which equity compensation paid to our employees including executive officers is to be accounted for, we estimate and record an expense for each equity award over the applicable service period. Accounting rules also require us to record cash compensation as an expense at the time the obligation is accrued. We have not tailored our executive compensation program to achieve particular accounting results.
99
Table of Contents
2010 Summary Compensation Table
The following table provides information concerning the compensation paid to our named executive officers for our 2010 fiscal year.
| Name and Principal Position |
Year | Salary ($) |
Bonus ($) |
Option Awards (4) ($) |
Non-Equity Incentive Plan Compensation ($) (5) |
All
Other Compensation ($) |
Total ($) |
|||||||||||||||||||||
| Ronald N. Frankel President & Chief Executive Officer |
2010 | 293,750 | — | — | 118,738 | 17,386 | (6) | 429,874 | ||||||||||||||||||||
| Scott A. Bailey (1) Chief Operating Officer |
2010 | 81,250 | (3) | 40,625 | 606,000 | — | 107,061 | (7) | 834,936 | |||||||||||||||||||
| George G. Chamoun Executive Vice President of Sales and Marketing |
2010 | 220,833 | — | — | 64,400 | — | 285,233 | |||||||||||||||||||||
| Tim Peterman Former Chief Operating Officer (2) |
2010 | 91,667 | — | — | — | 48,609 | (8) | 140,276 | ||||||||||||||||||||
Notes:
| (1) | Mr. Bailey commenced employment with us on October 1, 2010. |
| (2) | Mr. Peterman resigned as our chief operating officer effective as of April 30, 2010. |
| (3) | Amount reflects prorated compensation for 2010. |
| (4) | The amounts in this column represent the aggregate grant date fair value of option awards granted to the officer in the applicable fiscal year computed in accordance with FASB ASC Topic 718. See Note 9 of the Notes to the Financial Statements included elsewhere in this prospectus for a discussion of the assumptions made by the Company in determining the grant date fair value of its equity awards. |
| (5) | Reflects amounts paid pursuant to our Management Cash Incentive Plan for our 2010 fiscal year. The amounts indicated above were paid by us on February 15, 2011. |
| (6) | Represents medical benefits paid to or on behalf of Mr. Frankel. |
| (7) | Pursuant to Mr. Bailey’s offer letter, we agreed to reimburse Mr. Bailey up to $150,000 in connection with his relocation, by December 31, 2010, from Philadelphia, Pennsylvania, to the Buffalo, New York, area, with any unused portion of such amount payable to Mr. Bailey as a relocation bonus. If Mr. Bailey resigns before completing 12 months of continuous service, he is required to immediately refund to us all such payments and reimbursements made by us. In addition, in connection with relocation to Buffalo, Mr. Bailey was entitled to reasonable executive-style housing through December 31, 2010 and to reasonable rental housing from the date his family relocated to Buffalo through June 30, 2011. Mr. Bailey was also entitled to reimbursement for reasonable travel expenses incurred by him or his spouse for travel to Buffalo from Philadelphia through December 31, 2010. The amount shown includes $6,693 as reimbursement for moving expenses and $100,368 as an additional relocation payment. The remaining $42,939 was paid to Mr. Bailey in 2011 as a bonus. |
| (8) | Represents $45,833 paid to Mr. Peterman as severance and an additional $2,776 paid with respect to accrued vacation time. |
100
Table of Contents
“Salary,” “bonus” and “non-equity incentive plan compensation” accounted for the following percentages of the “total compensation” of our named executive officers in our 2010 fiscal year:
| Name |
Salary | Bonus | Non-Equity Incentive Plan Compensation |
|||||||||
| Ronald N. Frankel |
68 | % | 0 | % | 28 | % | ||||||
| Scott A. Bailey |
10 | % | 5 | % | 0 | % | ||||||
| George G. Chamoun |
77 | % | 0 | % | 23 | % | ||||||
| Tim Peterman |
65 | % | 0 | % | 0 | % | ||||||
2010 Grants of Plan-Based Awards
The following table provides information concerning each plan-based award granted to our named executive officers during our 2010 fiscal year. The amounts shown in the “Estimated Possible Payouts Under Non-Equity Incentive Plan Awards” reflect each officer’s participation in our Management Cash Incentive Plan.
| Name |
Grant Date | Estimated Possible Payouts Under Non-Equity Incentive Plan Awards (1) |
All Other Option Awards: Number of Securities Underlying Options (#) |
Exercise or Base Price of Option Awards ($/Sh) |
Grant Date Fair Value of Stock and Option Awards (3) ($) |
|||||||||||||||||||||||
| Threshold ($) | Target ($) | Maximum ($) | ||||||||||||||||||||||||||
| Ronald N. Frankel |
N/A | 0 | 206,500 | 413,000 | ||||||||||||||||||||||||
| Scott A. Bailey |
11/18/10 | 800,000 | (2) | 1.44 | 606,000 | |||||||||||||||||||||||
| George G. Chamoun |
N/A | 0 | 112,500 | 225,000 | — | |||||||||||||||||||||||
Notes:
| (1) | Represents awards granted under our Management Cash Incentive Plan, which were based on achievement of certain levels of performance in our 2010 fiscal year. These columns show the awards that were possible at the threshold, target and maximum levels of performance (with the maximum payout under the plan being 200% of the target amount). The column titled “Non-Equity Incentive Plan Compensation” in the Summary Compensation Table shows the actual awards earned in our 2010 fiscal year by our named executive officers under the plan, which were paid in fiscal year 2011. For more information about our Management Cash Incentive Plan, please see the section titled “Compensation Discussion and Analysis” above. |
| (2) | Shares underlying the option vest over 4 years of service, with 25% vesting upon completion of 12 months of service and the remainder vesting in 36 equal monthly installments thereafter. |
| (3) | The amount in this column represents the aggregate grant date fair value of the option computed in accordance with FASB ASC Topic 718. See Note 9 of the Notes to the Financial Statements included elsewhere in this prospectus for a discussion of the assumptions made by us in determining the grant date fair value of our equity awards. |
Outstanding Equity Awards at 2010 Fiscal Year-End
The following table provides information concerning each unexercised option held by our named executive officers as of December 31, 2010. The number of option shares and the exercise prices that appear below reflect all adjustments as a result of our capitalization adjustments.
Except as indicated in the footnotes below, options granted to our named executive officers are generally immediately exercisable with respect to all of the option shares (whether vested or unvested), subject to our repurchase right in the event that the executive’s service terminates before vesting in such shares. For information regarding the vesting acceleration provisions applicable to the options held by our named executive officers, please see the section titled “Management—Potential Payments upon Termination or Change in Control” below.
101
Table of Contents
| Option Awards | ||||||||||||||||||||||||
| Name |
Grant Date | Vesting Commencement Date |
Number
of Securities Underlying Unexercised Options (#) Vested |
Number of Securities Underlying Unexercised Options (#) Unvested |
Option Exercise Price ($) |
Option Expiration Date |
||||||||||||||||||
| Ronald N. Frankel |
8/21/01 | 2/1/01 | 8,052 | (1) | — | 50.00 | 2/1/11 | |||||||||||||||||
| Ronald N. Frankel |
8/21/01 | 4/1/01 | 8,502 | (2) | — | 50.00 | 3/31/11 | |||||||||||||||||
| Ronald N. Frankel |
3/13/03 | 3/13/02 | 1,864,410 | (3) | — | 0.02 | 3/13/13 | |||||||||||||||||
| Ronald N. Frankel |
11/18/04 | 10/1/04 | 720,027 | (4) | — | 0.10 | 11/17/14 | |||||||||||||||||
| Ronald N. Frankel |
4/3/07 | 4/3/07 | 316,662 | (4) | 28,788 | 0.463333 | 4/2/17 | |||||||||||||||||
| Ronald N. Frankel |
9/14/07 | 2/1/08 | 153,125 | (4)(5) | 56,875 | 1.26 | 9/13/17 | |||||||||||||||||
| Scott A. Bailey |
11/18/10 | 11/1/10 | — | (4)(6) | 800,000 | 1.44 | 11/17/20 | |||||||||||||||||
| George G. Chamoun |
3/13/03 | 11/18/02 | 574,326 | (3) | — | 0.02 | 3/13/13 | |||||||||||||||||
| George G. Chamoun |
11/18/04 | 10/1/04 | 216,009 | (4) | — | 0.10 | 11/17/14 | |||||||||||||||||
| George G. Chamoun |
9/14/07 | 2/1/08 | 109,375 | (4) | 40,625 | 1.26 | 9/13/17 | |||||||||||||||||
Notes:
| (1) | Shares underlying the option vested four years of service after the Vesting Commencement Date, with approximately 20% vesting upon completion of 12 months of service and in 36 monthly installments thereafter. |
| (2) | Shares underlying the option vested four years of service after the Vesting Commencement Date, with approximately 24% vesting upon completion of 12 months of service and in 39 monthly installments thereafter. |
| (3) | 2.083% of the shares underlying the option vested following the completion of each month of service after the Vesting Commencement Date. |
| (4) | Shares underlying the option vest over 4 years of service after the Vesting Commencement Date, with 25% upon completion of 12 months of service and in 36 equal monthly installments thereafter. |
| (5) | 169,461 of the option shares are immediately exercisable, with the remaining 40,539 of the option shares becoming exercisable at any time after December 31, 2010. |
| (6) | 522,224 of the option shares are immediately exercisable, with an additional 69,444 of the option shares becoming exercisable at any time after each of December 31, 2010, December 31, 2011, December 31, 2012, and December 31, 2013. |
2010 Option Exercises and Stock Vested
None of our named executive officers exercised stock options or held any stock awards that vested during our 2010 fiscal year.
Pension Benefits & Nonqualified Deferred Compensation
The Company does not provide a pension plan for its employees and none of our named executive officers participated in a nonqualified deferred compensation plan during our 2010 fiscal year.
Employment Agreements and Offer Letters
Ronald N. Frankel. We entered into a letter agreement with Mr. Frankel in July 2007 (which remains subject to our policy applicable to severance benefits), which clarified the severance benefit and vesting acceleration that were initially offered to Mr. Frankel when he commenced employment with us in 2001. In addition, we entered into a change of control severance agreement that will become effective as of the effective date of this offering. See “Management—Potential Payments upon Termination or Change in Control” for a description of the severance benefits and vesting benefits provided by these agreements.
102
Table of Contents
Scott A. Bailey. We entered into a letter agreement with Mr. Bailey in September 2010, which sets forth his base salary of $325,000 per year and his eligibility for a bonus of up to 50% of such base salary. Pursuant to such letter agreement, Mr. Bailey is eligible to receive up to $150,000 in connection with his relocation to the Buffalo, New York, area, subject to repayment by Mr. Bailey if he resigns before completing 12 months of continuous service with us. In addition, we agreed to provide reasonable executive-style temporary housing to Mr. Bailey until no later than December 31, 2010, and, to facilitate the permanent relocation of his family to the Buffalo area, to provide him with reasonable rental housing from the date his family moves through June 30, 2011. We also agreed to provide reasonable travel expenses incurred by Mr. Bailey or his spouse for travel to Buffalo from Philadelphia, Pennsylvania, through December 31, 2010. The letter agreement also provides for severance benefits and vesting acceleration. See “Management—Potential Payments upon Termination or Change in Control” for a description of these benefits.
George G. Chamoun. We entered into an employment agreement with Mr. Chamoun in December 2000, which is subject to our policy applicable to severance benefits. In addition, we entered into a change of control severance agreement that will become effective as of the effective date of this offering. See “Management—Potential Payments upon Termination or Change in Control” for a description of Mr. Chamoun’s severance benefits and vesting acceleration.
Potential Payments upon Termination or Change in Control
Ronald N. Frankel
Pursuant to our letter agreement with Mr. Frankel, if we terminate Mr. Frankel’s employment without cause, he will receive a lump-sum severance payment equal to 12 months of his then-current base salary. Cause under Mr. Frankel’s letter agreement is defined as Mr. Frankel’s intentional failure to perform his assigned duties; commission of a felony or any fraudulent or similar act or misconduct; unauthorized use or disclosure of our proprietary information or trade secrets or any other party’s proprietary information or trade secrets; or willful breach of any of Mr. Frankel’s obligations to us.
Options granted to Mr. Frankel have the following vesting acceleration: If Mr. Frankel is terminated without cause at any time, he will receive an additional 12 months of vesting. In addition, in the event of a change of control, 100% of his unvested options will vest if the acquirer or successor entity does not assume such options in full; if his compensation is reduced below the rate as of immediately prior to the change of control; if his place of employment is relocated more than 35 miles from its location immediately prior to the change of control; or if his duties and responsibilities are reduced as a result of or following such change of control (including as a result of our termination of Mr. Frankel for any reason). Cause under Mr. Frankel’s option agreements is defined substantially as under his letter agreement with us, as described above. Change of control under Mr. Frankel’s option agreements is defined as a sale of our assets or our merger or consolidation with or into another corporation.
Scott A. Bailey
Pursuant to our letter agreement with Mr. Bailey, if we terminate his employment for any reason other than cause or permanent disability after he and his spouse relocate to the Buffalo area or at any time following our change of control, we will continue to pay Mr. Bailey his base salary for a period of 12 months following such termination. In addition, if we terminated his employment for any reason other than cause or permanent disability at any time, we will pay his COBRA premiums for a period of 12 months following such termination. Mr. Bailey is also entitled to receive 12 months’ vesting on all of his options or restricted stock. Further, if Mr. Bailey is terminated subsequent to our change of control or after the effective date of this offering, we will also pay Mr. Bailey his target bonus prorated through the last day of his employment. Cause under Mr. Bailey’s letter agreement is defined as his unauthorized use or disclosure of our confidential information or trade secrets; material breach of any agreement with us; material failure to comply with our written policies or rules;
103
Table of Contents
conviction of or plea of guilty or no contest to a felony; gross negligence or willful misconduct; continuing failure to perform assigned duties; or failure to cooperate in good faith with a governmental or internal investigation of us, our directors, officers or employees, if we have requested his cooperation.
The option granted to Mr. Bailey on November 18, 2010, has the following vesting acceleration. If, in connection with, or within 12 months following, a change of control in which the acquiring or succeeding entity assumes the option or makes a substitution for it, Mr. Bailey is subject to an involuntary termination, he will receive an additional 12 months of vesting. Involuntary termination under Mr. Bailey’s option agreement means our termination Mr. Bailey’s service without cause or his voluntary resignation within 30 days following a material reduction in his job responsibilities; relocation of more than 50 miles; or a reduction in his then-current base salary by at least 10%, other than pursuant to a generally applicable salary reduction. “Cause” and “change of control” are defined substantially as with respect to Mr. Frankel’s option, as described above.
George G. Chamoun
Pursuant to our employment agreement with Mr. Chamoun, if he resigns for good reason, or if he is terminated by us for any reason other than for cause (including a termination in contemplation of our change in control), we will continue to pay Mr. Chamoun his base salary for a period of six months following such termination. Good reason means a resignation by Mr. Chamoun due to our material breach of his employment agreement, because he is required to relocate to a location other than one of our principal offices or if (following our change in control) he is not offered a position having duties, rights and responsibilities similar to those before the transaction. Cause under Mr. Chamoun’s employment agreement means his dishonesty, commission of a felony, willful violation of his fiduciary duties or material violation of the terms of his employment agreement. Change of control is defined substantially as with respect to Mr. Frankel’s option, as described above.
The option granted to Mr. Chamoun on September 14, 2007, has the following vesting acceleration. If, in connection with, or within 12 months following, a change of control in which the acquiring or succeeding entity assumes the option or makes a substitution for it, Mr. Chamoun is subject to an involuntary termination, he will receive an additional 12 months of vesting. Involuntary termination under Mr. Chamoun’s option agreement has the same meaning as with respect to Mr. Bailey’s option, as described above.
Post-Offering Change of Control Severance Benefits
Our board of directors approved change of control severance agreements for our chief executive officer and his direct reports (which includes Messrs. Bailey and Chamoun) that will become effective when this offering is consummated. If an executive is subject to an involuntary termination in connection with or within 12 months following our change of control, he will receive severance equal to twelve months of his then-current base salary plus his then-annual target bonus amount, payable over a 12-month period. In addition, we will pay the executive’s COBRA premiums for 12 months, and each executive will be eligible for 12 months’ additional vesting with respect to any of our equity granted to such executive. All such benefits are contingent on the executive signing a general release of all claims against us. If an executive has an existing agreement that provides for severance benefits, such executive will receive benefits under whichever agreement provides the greatest benefits (but not both). Change of control under our change of control agreement means our merger or consolidation with or into another corporation; a sale of our assets; a change in the majority of our board of directors; or any transaction as a result of which any person acquires beneficial ownership of at least 50% of the total voting power of our then-outstanding voting securities. Involuntary termination under our change of control agreement is defined substantially as under Mr. Bailey’s option, as described above. Cause is defined substantially as under Mr. Frankel’s letter agreement, as described above.
104
Table of Contents
Change-of-Control Benefits Under Our Stock Plans
Under our 2006 Stock Plan, awards that are not continued, assumed or substituted by the surviving entity will be cancelled in exchange for a payment equal to the difference between the fair market value of the shares subject to such options and the exercise price per share applicable to such award. Such payments may be made in installments and paid pursuant to a vesting schedule at least as favorable as that which would otherwise have applied had such options remained outstanding pursuant to their terms. Change of control is defined under our 2006 Stock Plan as a sale of our assets or our merger or consolidation with another corporation.
In addition, the form of stock option agreement under our 2006 Stock Plan provides for 12 months of accelerated vesting if an optionee is subject to an involuntary termination in connection with, or within 12 months after, a change in control in which our options are assumed or substituted by the surviving entity. Involuntary termination is defined as our termination of the optionee’s service without cause or the optionee’s resignation as a result of a material reduction in job responsibilities, relocation by more than 50 miles or a reduction in base salary by at least 10% (other than in connection with a general salary level reduction). Cause is defined as willful failure to perform duties or responsibilities; commission of any act of fraud, embezzlement, dishonesty or other willful misconduct; unauthorized use or disclosure of proprietary information or trade secrets; or willful breach of any obligation under a written agreement or covenant with us. A change of control includes our merger or consolidation with or into another corporation, after which our stockholders who owned more than 50% of our capital stock immediately before the transaction will own 50% or less of the total voting power of the surviving corporation or entity; or a sale of all or substantially all of our assets.
Under our 2000 Stock Plan, if we are subject to a change of control, awards terminate if not assumed or substituted by the surviving entity. Change of control under our 2000 Stock Plan is defined as under our 2006 Stock Plan, as described above.
Estimated Benefits and Payments Upon Termination or Change in Control
Other than with respect to Mr. Peterman, the following table provides information concerning the potential payments and benefits payable upon termination of our named executive officers’ employment or upon a change of control, as if each named executive officer’s employment terminated or other vesting acceleration event occurred on December 31, 2010. With respect to Mr. Peterman, the following table provides the actual payments and benefits he received upon termination of his employment pursuant to a letter agreement with us dated December 7, 2009.
For purposes of valuing the vacation payments in the table below (with the exception of Mr. Peterman, whose payment value reflects the actual amount he received upon his termination), we used each executive’s base salary in effect as of December 31, 2010, and the number of accrued but unused vacation days as of December 31, 2010. The value of equity acceleration shown in the table below assumes that the vesting acceleration occurred on December 31, 2010, and was calculated by multiplying the number of unvested option shares that will accelerate by the difference between the fair market value of our common stock on December 31, 2010 (assuming that the fair market value of our common stock on that date was $ , the midpoint of the initial public offering price range reflected on the cover page of this prospectus) and the exercise price per share.
If any executive has an existing agreement that already provides for severance benefits, he will be entitled to benefits under the agreement that provides the greatest benefits, but not both.
105
Table of Contents
| Name |
Benefit |
Voluntary Resignation ($) |
Termination Without Cause Unrelated to a Change in Control ($) |
Change in Control Benefits | ||||||||||||||
| Pursuant to Executives’ Change in Control Severance Agreement ($) (6) |
Pursuant to Other Individual Agreement ($) |
|||||||||||||||||
| Ronald N. Frankel |
Cash Severance | — | 295,000 | (3) | 501,500 | — | ||||||||||||
| Equity Acceleration | — | (3) | (7) | |||||||||||||||
| COBRA Premiums | — | — | — | |||||||||||||||
| Vacation Payout | 39,712 | 39,712 | 39,712 | — | ||||||||||||||
| Total Value | 39,712 | |||||||||||||||||
| Scott A. Bailey |
Cash Severance | — | 487,500 | (4) | $ | 487,500 | 487,500 | (8) | ||||||||||
| Equity Acceleration | — | (4) | (8) | |||||||||||||||
| COBRA Premiums (1) | — | 11,031 | (4) | — | 11,031 | (8) | ||||||||||||
| Vacation Payout | — | — | — | — | ||||||||||||||
| Total Value | — | — | ||||||||||||||||
| George G. Chamoun |
Cash Severance | 112,500 | (2) | 112,500 | (5) | 337,500 | 112,500 | (9) | ||||||||||
| Equity Acceleration | — | — | (10) | |||||||||||||||
| COBRA Premiums | — | — | 11,031 | — | ||||||||||||||
| Vacation Payout | 28,558 | 28,558 | 28,558 | 28,558 | ||||||||||||||
| Total Value | 141,058 | 141,058 | ||||||||||||||||
| Tim Peterman |
Cash Severance | — | 45,833 | — | ||||||||||||||
| Equity Acceleration | — | — | ||||||||||||||||
| COBRA Premiums | — | — | ||||||||||||||||
| Vacation Payout | 2,776 | — | ||||||||||||||||
| Total Value | 48,609 | — | ||||||||||||||||
Notes:
| (1) | The value of COBRA premiums shown with respect to Mr. Bailey reflects the cost of COBRA continuation coverage under health plans sponsored by Mr. Bailey’s prior employer, as Mr. Bailey elected not to participate in our health plans until January 1, 2012. |
| (2) | Represents 6 months of base salary payable to Mr. Chamoun if he resigns as a result of our material breach of his employment agreement or if he is required to relocate under certain circumstances or if he is terminated by us without cause. |
| (3) | Represents a lump-sum payment equal to 12 months of base salary and 12 months of vesting acceleration with respect to Mr. Frankel’s options granted on April 3, 2007, and September 14, 2007, if he is terminated without cause at any time. |
| (4) | Represents salary continuation payments equal to 12 months of base salary and prorated target bonus, 12 months of COBRA premiums paid by the Company and 12 months of vesting with respect to his options or restricted shares. Mr. Bailey is eligible for such benefits if he is terminated for any reason other than cause or permanent disability at any time following the relocation of Mr. Bailey and his spouse to the Buffalo, New York, area (or, with respect to payment of his COBRA premiums, if he is terminated for any reason other than cause or permanent disability at any time). Mr. Bailey is only eligible to receive a prorated bonus if he is terminated by us other than for cause or permanent disability after the date of this offering. |
| (5) | Represents 6 months of base salary payable to Mr. Chamoun if he is terminated without cause. |
| (6) | The amounts shown are payable if the executive is subject to an involuntary termination in connection with, or within 12 months following, a change of control. Each executive is entitled to severance in an amount equal to 12 months of base salary and annual target bonus; 12 months of COBRA premiums paid by the Company; and 12 months of equity acceleration. |
| (7) | Represents full vesting with respect to options granted to Mr. Frankel if such options are not assumed in full or if Mr. Frankel’s compensation is reduced below the rate in effect immediately prior to the change of control, if his work site is relocated by more than 35 miles, or if his duties and responsibilities are reduced as a result of or following the change of control. |
106
(notes continue on following page)
Table of Contents
| (8) | Represents salary continuation payments equal to 12 months of his base salary, 12 months of COBRA premiums paid by the Company, 12 months of vesting with respect to his options or restricted shares and prorated target bonus through his last day of employment if he is terminated for any reason other than cause or permanent disability at any time following our change of control. Mr. Bailey is also eligible to receive 12 months of vesting with respect to his option granted November 18, 2010, if, in connection with or within 12 months following, a change of control in which the acquiring or succeeding entity assumes the option or makes a substitution for it, he is subject to an involuntary termination. |
| (9) | Represents 6 months of base salary payable to Mr. Chamoun if, following a change of control, Mr. Chamoun resigns because he is not offered a position having duties, rights and responsibilities similar to those before the transaction, or if he is terminated by us in contemplation of such change of control. |
| (10) | Represents 12 months of vesting with respect to options granted on September 14, 2007, if, in connection with or within 12 months following a change of control in which the acquiring or succeeding entity assumes options or substitutes for them, Mr. Chamoun is subject to an involuntary termination. |
2010 Director Compensation
The following table sets forth information about the compensation of each person who served as a director during the 2010 fiscal year, other than a director who also served as a named executive officer. We have a policy of reimbursing our directors for their reasonable out-of-pocket expenses incurred in attending Board and committee meetings.
| Name |
Fees Earned or Paid in Cash ($) (1) |
Option Awards ($) (2)(3) |
Total ($) |
|||||||||
| Jordan Levy, Chairman |
25,000 | 76,000 | (4) | 101,000 | ||||||||
| Andrew Kau |
— | — | — | |||||||||
| Thomas W. Keaveney |
— | — | — | |||||||||
| Jeff Mallett |
25,000 | — | 25,000 | |||||||||
| Mark Morrissette |
— | — | — | |||||||||
| Terri Santisi |
25,000 | — | 25,000 | |||||||||
| Joseph Tzeng |
— | — | — | |||||||||
Notes:
| (1) | Prior to the date of this offering, we paid each of Jordan Levy, Terri Santisi and Jeff Mallett an annual retainer of $25,000 for serving on our Board of Directors. |
| (2) | The amounts in this column represent the aggregate grant date fair value of option awards granted to the director in the applicable fiscal year computed in accordance with FASB ASC Topic 718. See Note 9 of the Notes to the Financial Statements included elsewhere in this prospectus for a discussion of the assumptions made by us in determining the grant date fair value of our equity awards. |
| (3) | As of December 31, 2010, the above-listed directors held outstanding options to purchase the following number of shares of our common stock: Jordan Levy (160,000), Jeff Mallett (180,000) and Terri Santisi (105,000). |
| (4) | Reflects an option to purchase 100,000 shares of our common stock granted to Mr. Levy on November 18, 2010, at an exercise price of $1.44 per share. The option vests in annual installments following the completion by Mr. Levy of each of three years of service following February 1, 2011. The option will vest in full if we experience a change of control while Mr. Levy remains in service to us. |
107
Notes (continued from previous page):
Table of Contents
In November 2011, we approved the following post-offering annual cash compensation for non-employee directors as well as an annual stock option grant of 10,000 shares to be granted at our annual meeting. In addition, our non-employee directors will also be eligible for an initial stock option grant of up to 100,000 shares, to be granted at our first board meeting occurring on or following such director’s initial election to our board of directors. All such options vest over four years of service, with 25% vesting after completion of one year of service and the remainder vesting monthly over an additional three years of service.
| • | Board member: $35,000; |
| • | Non-employee chairman of the board: $35,000; |
| • | Audit committee member: $7,500; |
| • | Audit committee chairman: $15,000; |
| • | Compensation committee member: $6,500; |
| • | Compensation committee chairman: $12,500; |
| • | Nominating and corporate governance committee member: $3,500; and |
| • | Nominating and corporate governance committee chairman: $7,500. |
Equity Benefit Plans
2012 Equity Incentive Plan
Our board of directors adopted our 2012 Equity Incentive Plan in 2012, and we will obtain stockholder approval of the plan prior to completion of this offering. This plan will become effective on the effective date of the registration statement of which this prospectus is a part. The purpose of our 2012 Equity Incentive Plan is to promote our long-term success and create stockholder value by promoting the attraction and retention of employees, outside directors and consultants with exceptional qualifications and encouraging them to focus on long-range objectives. Our 2012 Equity Incentive Plan will replace the 2006 Stock Plan. No further grants will be made under our 2006 Stock Plan after this offering. However, the options outstanding after this offering under the 2006 Stock Plan will continue to be governed by their existing terms.
Share Reserve. We have reserved shares of our common stock for issuance under the 2012 Equity Incentive Plan. The number of shares reserved for issuance under the plan will be increased automatically on January 1 of each fiscal year, starting with fiscal 2013, by a number equal to the smallest of:
| • | 4% of the shares of common stock outstanding at that time; |
| • | shares of our common stock; or |
| • | the number of shares determined by our board of directors. |
In general, to the extent that awards under the 2012 Equity Incentive Plan are forfeited or lapse without the issuance of shares, those shares will again become available for awards. In addition, shares subject to awards outstanding under our 2000 Stock Plan or 2006 Stock Plan that are forfeited or lapse without shares being issued after this offering will be available for awards under the 2012 Equity Incentive Plan. All share numbers described in this summary of the 2012 Equity Incentive Plan (including exercise prices for options and stock appreciation rights) are automatically adjusted in the event of a subdivision of the outstanding common stock, a declaration of a dividend payable in common stock or a combination or consolidation of the outstanding shares of common stock (by reclassification or otherwise) into a lesser number of shares of common stock.
108
Table of Contents
Administration. Our board of directors intends to appoint the compensation committee of our board of directors to administer the 2012 Equity Incentive Plan. The committee has the complete discretion to make all decisions relating to the plan and outstanding awards.
Eligibility. Employees, members of our board of directors who are not employees and consultants are eligible to participate in our 2012 Equity Incentive Plan.
Types of Award. Our 2012 Equity Incentive Plan provides for the following types of awards:
| • | incentive and nonstatutory stock options to purchase shares of our common stock; |
| • | stock appreciation rights; |
| • | restricted shares of our common stock; |
| • | stock units; and |
| • | performance cash awards. |
Options and Stock Appreciation Rights. The exercise price for options granted under the 2012 Equity Incentive Plan may not be less than 100% of the fair market value of our common stock on the option grant date. Optionees may pay the exercise price by using:
| • | cash or cash equivalents; |
| • | shares of common stock that the optionee already owns; |
| • | an immediate sale of the option shares through a broker approved by us; |
| • | a promissory note, if permitted by applicable laws; |
| • | withholding of option shares; or |
| • | any other method permitted by applicable law that the compensation committee approves. |
All forms of payment other than cash require the consent of the compensation committee.
A participant who exercises a stock appreciation right receives the increase in value of our common stock over the exercise price. The exercise price for stock appreciation rights may not be less than 100% of the fair market value of our common stock on the grant date. The settlement value of a stock appreciation right may be paid in cash or shares of common stock, or a combination of both at the discretion of the compensation committee. Options and stock appreciation rights vest at the time or times determined by the compensation committee. Options and stock appreciation rights also expire at the time determined by the compensation committee. They generally expire earlier if the participant’s service terminates earlier. No participant may receive options or stock appreciation rights under the 2012 Equity Incentive Plan covering more than shares in any calendar year, except that a new employee may receive options or stock appreciation rights covering up to shares in the calendar year in which his or her employment starts.
Restricted Shares and Stock Units. Restricted shares and stock units may be awarded under the 2012 Equity Incentive Plan in return for any lawful consideration, and participants who receive restricted shares or stock units generally are not required to pay for their awards in cash. In general, these awards will be subject to vesting. Vesting may be based on length of service, the attainment of certain performance-based milestones, or a combination of both, as determined by the compensation committee. No participant may receive restricted shares or stock units with performance-based vesting covering more than shares or stock units in any calendar year, except that a new employee may receive restricted shares or stock units covering up to shares or stock units in the calendar year in which his or her employment starts. Settlement of vested stock units may be made in the form of cash, shares of common stock, or a combination of both.
Performance Cash Awards. The compensation committee may grant awards of cash to participants, which awards are subject to the achievement of performance goals to be determined by the compensation committee. No participant may receive more than $ million in cash awards under the 2012 Equity Incentive Plan in any calendar year.
109
Table of Contents
Change of Control. The compensation committee may determine, at the time of grant or thereafter, that options or stock appreciation rights granted under the 2012 Equity Incentive Plan will continue following the change of control, be assumed or substituted for by the surviving entity or be cancelled in exchange for a payment equal to the difference between the fair market value of the shares subject to the option or stock appreciation right (whether or not vested) and the exercise price of the option or stock appreciation right. The compensation committee may determine, at the time of grant or thereafter, that restricted shares or stock units granted under the 2012 Equity Incentive Plan will continue following the change of control, be assumed or substituted for by the surviving entity or accelerate and, in the case of stock units, be cancelled in exchange for a payment equal to the fair market value of such stock unit. Awards may also be subject to accelerated vesting or exercisability in the event of a reorganization, as described below.
A change of control includes:
| • | a merger or consolidation after which our stockholders own less than 50% of the surviving corporation or its parent; |
| • | a sale, transfer or other disposition of all or substantially all of our assets; |
| • | a proxy contest that results in the replacement of more than 50% of our directors over a 24-month period; or |
| • | an acquisition of 50% or more of our outstanding stock by any person or group, other than a person related to Synacor (such as a holding company owned by our stockholders or a trustee or other fiduciary holding securities under an employee benefit plan of ours or of our parent or of a subsidiary of ours). |
Reorganizations. If we experience a merger or consolidation, awards granted under the 2012 Equity Incentive Plan will be subject to the merger or consolidation agreement, which may provide that the awards are continued, assumed, substituted with awards that have substantially the same terms, become fully exercisable with respect to options and stock appreciation rights and fully vested with respect to shares underlying such options and stock appreciation rights; or cancellation of outstanding options, stock appreciation rights and stock units in exchange for a cash payment (which payment may be deferred until the options, stock appreciation rights or stock units would have become exercisable or common shares underlying them would have become vested).
Amendments or Termination. Our board of directors may amend or terminate the 2012 Equity Incentive Plan at any time. If our board of directors amends the plan, it does not need to ask for stockholder approval of the amendment unless required by applicable law, regulation or rule. The 2012 Equity Incentive Plan will continue in effect for 10 years from its adoption date, unless our board of directors decides to terminate the plan earlier.
2006 Stock Plan
Our 2006 Stock Plan was adopted by our board of directors on December 5, 2006, and our stockholders approved it on April 4, 2007. The most recent amendment to the 2006 Stock Plan was adopted by our board of directors on August 16, 2011, and we will obtain stockholder approval of such amendment. Our 2006 Stock Plan replaced our 2000 Stock Plan. No further awards will be made under our 2006 Stock Plan after this offering. The awards outstanding after this offering under the 2006 Stock Plan will continue to be governed by their existing terms.
Share Reserve. We have reserved 7,536,211 shares of our common stock for issuance under the 2006 Stock Plan, all of which may be issued as incentive stock options. In general, if options or shares awarded under the 2006 Stock Plan are reacquired or repurchased by us or otherwise forfeited by a 2006 Stock Plan participant, then those shares or option shares will again become available for awards under the 2006 Stock Plan.
110
Table of Contents
Administration. Our board of directors administered the 2006 Stock Plan before this offering, and the compensation committee of our board of directors will administer this plan after this offering. Before this offering, our board of directors had, and after this offering, our compensation committee will have, complete discretion to make all decisions relating to our 2006 Stock Plan.
Eligibility. Employees, members of our board of directors who are not employees and consultants are eligible to participate in our 2006 Stock Plan.
Types of Award. Our 2006 Stock Plan provides for the following types of awards:
| • | incentive and nonstatutory stock options to purchase shares of our common stock; and |
| • | direct award or sale of shares of our common stock, including restricted shares (subject to a right of repurchase by us upon the participant’s termination with respect to unvested shares). |
Options and restricted shares vest at the times determined by our board of directors. Both options and restricted shares generally vest over a four-year period following the date of grant. In most cases, our options are immediately exercisable, subject to our right to repurchase unvested shares. Options expire not more than 10 years after they are granted but generally expire earlier if the participant’s service terminates earlier.
Payment. The exercise price for options granted under the 2006 Stock Plan may not be less than 100% of the fair market value of our common stock on the option grant date. Participants may pay the exercise price of options, or the purchase price of shares, by using:
| • | cash or cash equivalents; |
| • | a full-recourse promissory note, against which the purchased shares are pledged as security for payment of the principal amount of, and interest on, the note; |
| • | shares of common stock that the optionee already owns; or |
| • | an immediate sale of the option shares through a broker designated by us. |
Shares may also be awarded under the 2006 Stock Plan in consideration of services rendered to us prior to the grant date of a stock award. To date, no participant under the 2006 Stock Plan has been permitted to pay the purchase price or exercise price with a promissory note.
Change of Control. The form of stock option agreement under the 2006 Stock Plan provides for 12 months of accelerated vesting if an optionee is subject to an involuntary termination in connection with, or within 12 months after, a change in control in which our options are assumed or substituted by the surviving entity. Involuntary termination is defined as our termination of the optionee’s service without cause or the optionee’s resignation as a result of a material reduction in job responsibilities, relocation by more than 50 miles or a reduction in base salary by at least 10% (other than in connection with a general salary level reduction). Cause is defined as willful failure to perform duties or responsibilities; commission of any act of fraud, embezzlement, dishonesty or other willful misconduct; unauthorized use or disclosure of proprietary information or trade secrets; or willful breach of any obligation under a written agreement or covenant with us.
111
Table of Contents
A change of control includes:
| • | our merger or consolidation with or into another corporation, after which our stockholders who owned more than 50% of our capital stock immediately before the transaction will own 50% or less of the total voting power of the surviving corporation or entity; or |
| • | a sale of all or substantially all of our assets. |
Amendments or Termination. Our board of directors may amend or terminate the 2006 Stock Plan at any time. If our board of directors amends the plan, it does not need to ask for stockholder approval of the amendment unless the amendment increases the number of shares available for issuance, materially changes the class of persons eligible to receive incentive stock options or is otherwise required by applicable law. The 2006 Stock Plan will continue in effect for 10 years from the later of its adoption date or the date of approval of the latest share increase, unless our board of directors decides to terminate the plan earlier.
2000 Stock Plan
Our 2000 Stock Plan was adopted by our board of directors and approved by our stockholders on December 5, 2000. The most recent amendment to the 2000 Stock Plan was adopted by our board of directors on May 12, 2010 and reduced the number of shares reserved for issuance under the plan. The most recent amendment that required stockholder approval was approved by our stockholders on October 19, 2006. No further awards will be made under our 2000 Stock Plan. The awards outstanding after this offering under the 2000 Stock Plan will continue to be governed by their existing terms.
Share Reserve. Pursuant to the 2000 Stock Plan and subsequent amendments, we have reserved 6,750,344 shares of our common stock for issuance under the 2000 Stock Plan, all of which may be issued as incentive stock options.
Administration. Our board of directors administers the 2000 Stock Plan before this offering and the compensation committee of our board of directors will administer this plan after this offering. Before this offering, our board of directors and after this offering, our compensation committee has complete discretion to make all decisions relating to our 2000 Stock Plan.
Eligibility. Employees, members of our board of directors who are not employees and consultants are eligible to participate in our 2000 Stock Plan.
| • | Types of Award. Our 2000 Stock Plan provides for the following types of awards: |
| • | incentive and nonstatutory stock options to purchase shares of our common stock; and |
| • | restricted shares. |
Options and restricted shares vest at the times determined by the board of directors. Both options and restricted shares generally vest over a four-year period following the date of grant.
In most cases, our options are exercisable for all of the shares subject to such options at any time six months after the date of grant, subject to our right to repurchase unvested shares. Options expire not more than 10 years after they are granted but generally expire earlier if the participant’s service terminates earlier. The compensation committee of our board of directors or our board of directors may at any time offer to buy out for payment in cash or shares of our common stock an option previously granted under the 2000 Stock Plan.
112
Table of Contents
Payment. The exercise price for incentive stock options granted under the 2000 Stock Plan may not be less than 100% of the fair market value of our common stock on the option grant date. The exercise price for nonstatutory stock options granted under the 2000 Stock Plan may not be less than 85% of the fair market value of our common stock on the option grant date. The purchase price for restricted shares may not be less than 85% of the fair market value of our common stock on the date of the award.
Participants may pay the exercise price of options or stock purchase rights by using:
| • | cash or check; |
| • | promissory note; |
| • | cancellation of indebtedness; |
| • | shares of common stock that the optionee already owns (provided such shares have been owned for more than 6 months on the date of surrender); or |
| • | an immediate sale of the option shares through a broker designated by us. |
Amendments or Termination. Our board of directors may amend or terminate the 2000 Stock Plan at any time. If our board of directors amends the plan, it does not need to ask for stockholder approval of the amendment unless required by applicable law. The 2000 Stock Plan will continue in effect for 10 years from its adoption date by the board of directors, unless our board of directors decides to terminate the plan earlier.
113
Table of Contents
TRANSACTIONS WITH RELATED PERSONS, PROMOTERS AND
CERTAIN CONTROL PERSONS
In addition to the compensation arrangements with directors and executive officers and the registration rights described in this prospectus, the following is a description of each transaction since January 1, 2008 and each currently proposed transaction in which:
| • | we have been or are to be a participant; |
| • | the amount involved exceeds $120,000; and |
| • | any of our directors, executive officers or holders of more than 5% of our capital stock, or any immediate family member of or person sharing the household with any of these individuals (other than tenants or employees), had or will have a direct or indirect material interest. |
Transactions with our Executive Officers, Directors and Significant Stockholders
Stock Option Grant to Ronald N. Frankel
In August 2011, in connection with his service as our chief executive officer, we granted Ronald N. Frankel an option to purchase 350,000 shares of our common stock at an exercise price of $1.66 per share, pursuant to the 2006 Stock Plan. See “Principal Stockholders” for more details regarding the shares beneficially owned by Mr. Frankel.
Repurchases of Common Stock from Ronald N. Frankel
On September 29, 2010, we repurchased 150,000 shares of common stock held by Mr. Frankel at a per share price of $1.34, or an aggregate repurchase price of $201,000. On August 20, 2009, we repurchased 200,000 shares of common stock held by Mr. Frankel at a per share price of $1.00, or an aggregate repurchase price of $200,000.
Stock Option Grant to Tim Peterman
In June 2009, we granted Tim Peterman, our former chief operating officer, an option to purchase 500,000 shares of our common stock at an exercise price of $1.26 per share, pursuant to the 2006 Stock Plan.
Stock Option Grant to William J. Stuart
In August 2011, we granted William J. Stuart, our chief financial officer, an option to purchase 500,000 shares of our common stock at an exercise price of $1.66 per share, pursuant to the 2006 Stock Plan. See “Principal Stockholders” for more details regarding the shares beneficially owned by Mr. Stuart.
Stock Option Grant to Scott A. Bailey
In November 2010, we granted Scott A. Bailey, our chief operating officer, an option to purchase 800,000 shares of our common stock at an exercise price of $1.44 per share, pursuant to the 2006 Stock Plan. See “Principal Stockholders” for more details regarding the shares beneficially owned by Mr. Bailey.
Stock Option Grant to George G. Chamoun
In August 2011, we granted George G. Chamoun, our executive vice president of sales and marketing, an option to purchase 200,000 shares of our common stock at an exercise price of $1.66 per share, pursuant to the 2006 Stock Plan. See “Principal Stockholders” for more details regarding the shares beneficially owned by Mr. Chamoun.
114
Table of Contents
Stock Option Grants to Jordan Levy
In August 2011, we granted Jordan Levy an option to purchase 35,000 shares of our common stock at an exercise price of $1.66 per share, pursuant to the 2006 Stock Plan. In November 2010, we granted Jordan Levy an option to purchase 100,000 shares of our common stock at an exercise price of $1.44 per share, pursuant to the 2006 Stock Plan. See “Principal Stockholders” for more details regarding the shares beneficially owned by Mr. Levy.
JoRon Management LLC Purchase of Mallett Shares
In July 2011, Jeffrey Mallett, a former member of our board of directors, exercised his option to purchase 180,000 shares of our common stock at an exercise price of $1.26 per share. Mr. Mallett then entered into an agreement with JoRon Management LLC, an entity beneficially owned by Mr. Levy, whereby JoRon Management LLC purchased the 180,000 shares from Mr. Mallett for $226,800.
Stock Option Grant to Andrew Kau
In August 2011, we granted Andrew Kau an option to purchase 100,000 shares of our common stock at an exercise price of $1.66 per share, pursuant to the 2006 Stock Plan. See “Principal Stockholders” for more details regarding the shares beneficially owned by Mr. Kau.
Stock Option Grant to Mark Morrissette
In August 2011, we granted Mark Morrissette an option to purchase 100,000 shares of our common stock at an exercise price of $1.66 per share, pursuant to the 2006 Stock Plan. See “Principal Stockholders” for more details regarding the shares beneficially owned by Mr. Morrissette.
Stock Option Grant to Joseph Tzeng
In August 2011, we granted Joseph Tzeng an option to purchase 100,000 shares of our common stock at an exercise price of $1.66 per share, pursuant to the 2006 Stock Plan. See “Principal Stockholders” for more details regarding the shares beneficially owned by Mr. Tzeng.
Stock Option Grant to Thomas Keaveney
In August 2011, we granted Thomas Keaveney an option to purchase 100,000 shares of our common stock at an exercise price of $1.66 per share, pursuant to the 2006 Stock Plan. See “Principal Stockholders” for more details regarding the shares beneficially owned by Mr. Keaveney.
Stock Option Grant to Marwan Fawaz
In December 2011, we granted Marwan Fawaz an option to purchase 100,000 shares of our common stock at an exercise price of $2.98 per share, pursuant to the 2006 Stock Plan, in connection with his election to our board of directors.
Stock Option Grant to Gary Ginsberg
In December 2011, we granted Gary Ginsberg an option to purchase 100,000 shares of our common stock at an exercise price of $2.98 per share, pursuant to the 2006 Stock Plan, in connection with his election to our board of directors.
115
Table of Contents
Stock Option Grant to Terri Santisi
In April 2008, we granted Terri Santisi, a former member of our board of directors, an option to purchase 35,000 shares of our common stock at an exercise price of $5.99 per share, pursuant to the 2006 Stock Plan. Subsequently, following our 3-for-1 forward stock split, Ms. Santisi’s option became exercisable for 105,000 shares of our common stock at an exercise price of $2.00 per share. Ms. Santisi’s option was later re-priced to $1.26 per share in connection with our June 2009 Stock Option Re-pricing.
Repurchase of Common Stock from Eric Blachno
In December 2009, Eric Blachno, our former chief financial officer, exercised his right to sell 225,000 shares of his common stock back to us at a purchase price of $0.463333 per share.
Indemnification Agreements
Prior to the consummation of this offering, we will enter into indemnification agreements with each of our directors and executive officers and certain other key employees. See “Management—Limitation of Liability and Indemnification.”
Review, Approval or Ratification of Transactions with Related Parties
Our board of directors has adopted certain written policies and procedures with respect to related party transactions. These policies and procedures require that certain transactions, other than ones that involve compensation, between us and any of our directors, executive officers or beneficial holders of more than 5% of our capital stock, or any immediate family member of, or person sharing the household with, any of these individuals, be consummated only when we determine that the transaction is in, or is not inconsistent with, the best interests of our company and our stockholders, including situations where we may obtain products or services of a nature, quantity or quality, or on other terms, that are not readily available from alternative sources or when the transaction is on terms comparable to those that could be obtained in arm’s length dealings with an unrelated third party. Whether a proposed transaction is on comparable terms to those available from an unrelated third party may be determined by, among other means, gathering publicly available information about the terms offered by third parties in similar transactions, soliciting offers from third parties or engaging independent experts to evaluate the terms offered by the related party.
Our policies and procedures with respect to related party transactions also apply to certain charitable contributions by us or our executive officers and to the hiring of any members of the immediate family of any of our directors or executive officers as our permanent full-time employees. Our policies and procedures do not, however, require approval or ratification of any transaction that is approved by our board of directors by a majority vote of the disinterested members or by our audit committee. The approval of our compensation committee will be required to approve any transaction that involves compensation to our directors and executive officers. Transactions entered into prior to the completion of this offering were not subject to these policies and procedures.
Upon the effectiveness of the registration statement of which this prospectus forms a part, copies of these policies and procedures will be posted on our website at www.synacor.com under the Investor Relations section. The inclusion of our website address in this prospectus does not include or incorporate by reference the information on our website into this prospectus.
116
Table of Contents
The following table provides information concerning beneficial ownership of our common stock as of September 30, 2011, and as adjusted to reflect the sale of shares of common stock in this offering, by:
| • | each stockholder, or group of affiliated stockholders, known by us to beneficially own more than 5% of our outstanding common stock; |
| • | each of our directors; |
| • | each of our named executive officers; and |
| • | all of our directors and named executive officers as a group. |
Beneficial ownership is determined in accordance with the rules of the SEC and generally includes voting power and/or investment power with respect to the securities held. Shares of common stock subject to options currently exercisable or exercisable within 60 days of September 30, 2011 are deemed outstanding and beneficially owned by the person holding such options for purposes of computing the number of shares and percentage beneficially owned by such person, but are not deemed outstanding for purposes of computing the percentage beneficially owned by any other person. Except as indicated in the footnotes to this table, and subject to applicable community property laws, the persons or entities named have sole voting and investment power with respect to all shares of our common stock shown as beneficially owned by them.
The following table lists the number of shares and percentage of shares beneficially owned based on 39,990,379 shares of common stock outstanding as of September 30, 2011. This number reflects:
| • | 5,200,102 shares of common stock; |
| • | the conversion of 5,548,508 shares of Series A preferred stock into 16,645,524 shares of common stock upon the closing of this offering; |
| • | the conversion of 570,344 shares of Series A-1 preferred stock into 1,711,032 shares of common stock upon the closing of this offering; |
| • | the conversion of 2,737,500 shares of Series B preferred stock into 8,212,500 shares of common stock upon the closing of this offering; and |
| • | the conversion of 2,740,407 shares of Series C preferred stock into 8,221,221 shares of common stock upon the closing of this offering. |
The table also lists the applicable percentage beneficial ownership based on shares of common stock outstanding upon completion of this offering, assuming no exercise of the underwriters’ option to purchase up to an aggregate of shares of our common stock.
Unless otherwise indicated, the principal address of each of the stockholders below is c/o Synacor, Inc., 40 La Riviere Drive, Suite 300, Buffalo, New York 14202.
117
Table of Contents
| Shares Beneficially Owned Prior to the Offering |
Shares Beneficially Owned After the Offering | |||||||||||||
| Name and Address of Beneficial Owner |
Number | Percent | Number | Percent | ||||||||||
| 5% Stockholders |
||||||||||||||
| Entities associated with Walden International (1) |
9,205,584 | 23.0 | % | 9,205,584 | ||||||||||
| One California Street, Suite 2800 |
||||||||||||||
| San Francisco, CA 94111 |
||||||||||||||
| Entities associated with Crystal Internet Ventures (2) |
7,977,075 | 19.9 | % | 7,977,075 | ||||||||||
| 1120 Chester Avenue, Suite 418 |
||||||||||||||
| Cleveland, OH 44114 |
||||||||||||||
| Entities associated with Advantage Capital Partners (3) |
5,591,277 | 14.0 | % | 5,591,277 | ||||||||||
| 909 Poydras Street |
||||||||||||||
| Suite 2230 |
||||||||||||||
| New Orleans, LA 70112 |
||||||||||||||
| Intel Corporation (4) |
4,174,314 | 10.4 | % | 4,174,314 | ||||||||||
| 2200 Mission College Boulevard |
||||||||||||||
| Santa Clara, CA 95052 |
||||||||||||||
| Entities associated with North Atlantic Capital (5) |
2,839,119 | 7.1 | % | 2,839,119 | ||||||||||
| 2 City Center, 5th Floor |
||||||||||||||
| Portland, ME 04105 |
||||||||||||||
| Directors and Executive Officers |
||||||||||||||
| Ronald N. Frankel (6) |
3,409,167 | 8.1 | % | 3,409,167 | ||||||||||
| Andrew Kau (7) |
9,305,584 | 23.2 | % | 9,305,584 | ||||||||||
| c/o Walden International |
||||||||||||||
| 361 Lytton Avenue, 2nd Floor |
||||||||||||||
| Palo Alto, CA 94301 |
||||||||||||||
| Joseph Tzeng (8) |
8,077,075 | 20.1 | % | 8,077,075 | ||||||||||
| c/o Crystal Internet Ventures |
||||||||||||||
| 1120 Chester Avenue, Suite 418 |
||||||||||||||
| Cleveland, OH 44114 |
||||||||||||||
| Thomas Keaveney (9) |
100,000 | * | 100,000 | |||||||||||
| c/o Advantage Capital Partners |
||||||||||||||
| 909 Poydras Street |
||||||||||||||
| Suite 2230 |
||||||||||||||
| New Orleans, LA 70112 |
||||||||||||||
| Mark Morrissette (10) |
2,939,119 | 7.3 | % | 2,939,119 | ||||||||||
| c/o North Atlantic Capital |
||||||||||||||
| 2 City Center, 5th Floor |
||||||||||||||
| Portland, ME 04105 |
||||||||||||||
| Jordan Levy (11) |
907,161 | 2.2 | % | 907,161 | ||||||||||
| One HSBC Center, Suite 3850 |
||||||||||||||
| Buffalo, NY 14203 |
||||||||||||||
| George G. Chamoun (12) |
1,089,351 | 2.7 | % | 1,089,351 | ||||||||||
| Scott A. Bailey (13) |
591,668 | 1.5 | % | 591,668 | ||||||||||
| William J. Stuart (14) |
259,040 | * | 259,040 | |||||||||||
| All directors and executive officers as a group (9 persons) (15) |
26,678,165 | 70.0 | % | 26,678,165 | ||||||||||
Notes:
| * | Less than 1% |
(notes continue on following pages)
118
Table of Contents
Notes (continued from previous page):
| (1) | Represents 150,705 shares held by Pacven Walden Ventures IV Associates Fund, L.P. (“Pacven IV Associates Fund”), 8,084,595 shares held by Pacven Walden Ventures IV, L.P. (“Pacven IV”), 485,142 shares held by WIIG-TDF Partners LLC (“WIIG-TDF”) and 485,142 shares held by Walden EDB Partners II, L.P. (“EDB II”). The general partner of Pacven IV Associates Fund and Pacven IV is Pacven Walden Management II, L.P. (“Pacven Management II”). The general partner of EDB II is Walden Management, LLC. The general partner of Pacven Management II is Pacven Walden Management Co., Ltd. (“Pacven Walden Management”). The manager of Walden Management, LLC is Pacven Walden Management. Lip-Bu Tan is the sole director of Pacven Walden Management and he shares voting and investment power with respect to the shares held by Pacven IV, Pacven IV Associates Fund and EDB II with the other members of the investment committee of Pacven Walden Management. Each of Andrew Kau (who is also a member of our board of directors), Hock Voo Loo and Brian Chiang is a member of the investment committee of Pacven Walden Management. The directors of WIIG-TDF are WIIG Management Co. Ltd. and TDF Global Co. Ltd. Lip-Bu Tan is the sole director of WIIG Management Co. Ltd. and shares voting and investment power with respect to the shares held by WIIG-TDF with Tan Lai Choo, the director of TDF Global Co. Ltd. |
| (2) | Represents 551,352 shares held by Crystal Internet Venture Fund II (BVI), Crystal Vision, L.P. (“CVLP”), and 7,425,723 shares held by Crystal Internet Venture Fund II (BVI), L.P. (“CIVF”). The general partner of CVLP and CIVF is Crystal Venture II, Ltd. (“CVII”). The Class A members of CVII, which have all voting rights of CVII, are Daniel Kellogg and Joseph Tzeng. By virtue of their voting power over the membership interests of CVII, each of these individuals may be deemed to have voting and investment power with respect to the shares held of record by CVLP and CIVF. |
| (3) | Represents 4,644,903 shares held by Advantage Capital New York Partners I, L.P. (“Advantage I”) and 946,374 shares held by Advantage Capital New York Partners II, L.P. (“Advantage II”). The sole general partner of Advantage I is Advantage Capital New York GP-I, LLC (“Advantage GP I”), and the sole general partner of Advantage II is Advantage Capital New York GP-II, LLC (“Advantage GP II”). Advantage GP I and Advantage GP II, in their respective capacities as general partner of Advantage I and Advantage II, exercise investment discretion and control of the shares beneficially owned by Advantage I and Advantage II. Steven T. Stull and Scott A. Zajac hold all of the ownership interests, including voting interests, of Advantage GP I and, therefore, may be deemed to have voting and investment power with respect to the shares held of record by Advantage I and Steven T. Stull and Maurice E. Doyle hold all of the ownership interests, including voting interests, of Advantage GP II and, therefore, may be deemed to have voting and investment power with respect to the shares held of record by Advantage II. Thomas Keaveney does not exercise voting and investment power with respect to the shares held of record by Advantage I and Advantage II. |
| (4) | Represents 4,174,314 shares held by Intel Capital (Cayman) Corporation (formerly known as Intel Capital Corporation), a wholly-owned subsidiary of Intel Corporation. |
| (5) | Represents 1,182,966 shares held by North Atlantic Venture Fund III, A Limited Partnership (“NAVF”) and 1,656,153 shares held by North Atlantic SBIC IV, L.P. (“NASBIC”). The general partner of NAVF is North Atlantic Investors III, LLC. The general partner of NASBIC is North Atlantic Investors SBIC IV, LLC. The managers of North Atlantic Investors III, LLC and North Atlantic Investors SBIC IV, LLC are David M. Coit and Mark J. Morrissette. Each of these individuals exercises shared voting and investment power over the shares held of record by NAVF and NASBIC. |
| (6) | Represents 1,200,000 shares held by Mr. Frankel and 2,209,167 shares issuable upon exercise of stock options exercisable within 60 days of September 30, 2011, 186,780 of which shares remained subject to vesting as of September 30, 2011. The shares set forth in the table do not |
(notes continue on following page)
119
Table of Contents
Notes (continued from previous page):
| include 180,720 shares issuable upon exercise of stock options granted to Mr. Frankel on August 16, 2011, which become exercisable on a series of dates after December 31, 2011. |
| (7) | Includes 100,000 shares issuable upon exercise of stock options issued to Mr. Kau and exercisable within 60 days of September 30, 2011, 100,000 of which shares remained subject to vesting as of September 30, 2011. See footnote (1) regarding Mr. Kau’s relationship with Walden International. |
| (8) | Includes 100,000 shares issuable upon exercise of stock options issued to Mr. Tzeng and exercisable within 60 days of September 30, 2011, 100,000 of which shares remained subject to vesting as of September 30, 2011. See footnote (2) regarding Mr. Tzeng’s relationship with Crystal Internet Ventures. |
| (9) | Represents 100,000 shares issuable upon exercise of stock options issued to Mr. Keaveney and exercisable within 60 days of September 30, 2011, 100,000 of which shares remained subject to vesting as of September 30, 2011. |
| (10) | Includes 100,000 shares issuable upon exercise of stock options issued to Mr. Morrissette and exercisable within 60 days of September 30, 2011, 100,000 of which shares remained subject to vesting as of September 30, 2011. See footnote (5) regarding Mr. Morrissette’s relationship with North Atlantic Capital. |
| (11) | Includes 498,447 shares issuable upon exercise of stock options issued to Mr. Levy and exercisable within 60 days of September 30, 2011, 135,000 of which shares remained subject to vesting as of September 30, 2011. Also includes 408,714 shares held of record by JoRon Management LLC (“JoRon”). Jordan Levy and Ron Schreiber are the managers of JoRon and may therefore be deemed to beneficially own the shares held of record by JoRon. |
| (12) | Represents 663,102 shares held by Mr. Chamoun and 426,249 shares issuable upon exercise of stock options issued to Mr. Chamoun and exercisable within 60 days of September 30, 2011, 72,740 of which shares remained subject to vesting as of September 30, 2011. The shares set forth in the table do not include 139,760 shares issuable upon exercise of stock options granted to Mr. Chamoun on August 16, 2011, which become exercisable on a series of dates after December 31, 2011. |
| (13) | Represents 591,668 shares issuable upon exercise of stock options issued to Mr. Bailey and exercisable within 60 days of September 30, 2011, 591,668 of which shares remained subject to vesting as of September 30, 2011. The shares set forth in the table do not include 208,332 shares issuable upon exercise of stock options granted to Mr. Bailey on November 18, 2010, which become exercisable on a series of dates after December 31, 2011. |
| (14) | Represents 259,040 shares issuable upon exercise of stock options issued to Mr. Stuart and exercisable within 60 days of September 30, 2011, 259,040 of which shares remained subject to vesting as of September 30, 2011. The shares set forth in the table do not include 240,960 shares issuable upon exercise of stock options granted to Mr. Stuart on August 16, 2011, which become exercisable on a series of dates after December 31, 2011. |
| (15) | Represents 4,384,571 shares issuable upon exercise of stock options exercisable within 60 days of September 30, 2011, 1,645,228 of which shares remained subject to vesting as of September 30, 2011. |
120
Table of Contents
General
The following is a summary of our capital stock and certain provisions of our amended and restated certificate of incorporation and amended and restated bylaws, as they will be in effect upon the closing of this offering. This summary does not purport to be complete and is qualified in its entirety by the provisions of our amended and restated certificate of incorporation and amended and restated bylaws, copies of which will be filed as exhibits to the registration statement of which this prospectus is a part.
Following the closing of this offering, our authorized capital stock will consist of 100,000,000 shares of common stock, par value $0.01 per share, and 10,000,000 shares of preferred stock, par value $0.01 per share. Immediately after the consummation of the offering, we will have shares of common stock issued and outstanding and no shares of preferred stock issued and outstanding.
Common Stock
As of September 30, 2011, there were 39,990,379 shares of common stock outstanding held of record by approximately 179 stockholders. This number of shares has been adjusted to reflect:
| • | 5,200,102 shares of common stock; |
| • | the conversion of 5,548,508 shares of Series A preferred stock into 16,645,524 shares of common stock upon the closing of this offering; |
| • | the conversion of 570,344 shares of Series A-1 preferred stock into 1,711,032 shares of common stock upon the closing of this offering; |
| • | the conversion of 2,737,500 shares of Series B preferred stock into 8,212,500 shares of common stock upon the closing of this offering; and |
| • | the conversion of 2,740,407 shares of Series C preferred stock into 8,221,221 shares of common stock upon the closing of this offering. |
There will be shares of common stock outstanding, assuming no exercise of the underwriters’ option to purchase additional shares in the offering and assuming no exercise after September 30, 2011 of outstanding options, after giving effect to the sale of the shares of common stock to the public offered in this prospectus.
The holders of common stock are entitled to one vote per share on all matters to be voted upon by the stockholders, with certain exceptions described in our amended and restated certificate of incorporation. The holders of common stock are entitled to receive ratably such dividends, if any, as may be declared from time to time by the board of directors out of funds legally available, subject to preferences that may be applicable to preferred stock then outstanding, if any. See “Dividend Policy.” In the event of a liquidation, dissolution or winding up of our company, the holders of common stock are entitled to share ratably in all assets remaining after payment of liabilities, subject to prior distribution rights of preferred stock then outstanding, if any. The common stock has no preemptive or conversion rights or other subscription rights. There are no redemption or sinking fund provisions applicable to the common stock. All outstanding shares of common stock are fully paid and non-assessable, and the shares of common stock to be issued upon completion of this offering will be fully paid and non-assessable.
121
Table of Contents
Preferred Stock
Concurrently with the closing of this offering, outstanding shares of Series A preferred stock will be converted into 16,645,524 shares of common stock, outstanding shares of Series A-1 preferred stock will be converted into 1,711,032 shares of common stock, outstanding shares of Series B preferred stock will be converted into 8,212,500 shares of common stock and outstanding shares of Series C preferred stock will be converted into 8,221,221 shares of common stock.
After the completion of this offering, our board of directors will be authorized, without further stockholder approval, to issue preferred stock in one or more series, to establish the number of shares to be included in each such series and to fix the designation, powers, preferences and rights of such shares and any qualifications, limitations or restrictions thereof. The issuance of preferred stock may have the effect of delaying, deferring or preventing a change in control of our company without further action by the stockholders and may adversely affect the voting and other rights of the holders of common stock. The issuance of preferred stock with voting and conversion rights may adversely affect the voting power of the holders of common stock, including the loss of voting control to others. At present, we have no plans to issue any preferred stock.
Registration Rights
After the completion of this offering, holders of 37,630,875 shares of common stock will be entitled to rights with respect to the registration of those shares under the Securities Act. Under the terms of the investors’ rights agreement between us and the holders of these registrable securities, if we propose to register any of our securities under the Securities Act, either for our own account or for the account of other security holders exercising registration rights, these holders are entitled to notice of registration and are entitled to include their shares of common stock in the registration.
Certain holders of these registrable securities are also entitled to specified demand registration rights under which they may require us to file a registration statement under the Securities Act at our expense with respect to our shares of common stock, and we are required to use our commercially reasonable efforts to effect this registration. We are required to effect only two registrations pursuant to this provision of the investors’ rights agreement. Further, the holders of these registrable securities may require us to file additional registration statements on Form S-3.
All of these registration rights are subject to conditions and limitations, among them the right of the underwriters of an offering to limit the number of shares included in the registration and our right not to effect a requested registration within 180 days following the initial offering of our securities, including this offering. All applicable registration rights in connection with this offering have been waived. The foregoing summary is not a complete description of the investors’ rights agreement and is qualified in its entirety by the full text of the investors’ rights agreement, a copy of which is filed as Exhibit 4.3 to the registration statement of which this prospectus is a part.
Anti-Takeover Effects of Our Certificate of Incorporation and Bylaws and Delaware Law
Some provisions of Delaware law and our amended and restated certificate of incorporation and amended and restated bylaws could make the following transactions more difficult:
| • | acquisition of our company by means of a tender offer, a proxy contest or otherwise; and |
| • | removal of our incumbent directors and officers. |
These provisions, summarized below, are expected to discourage and prevent coercive takeover practices and inadequate takeover bids. These provisions are designed to encourage persons seeking to acquire
122
Table of Contents
control of our company to first negotiate with our board of directors. They are also intended to provide our management with the flexibility to enhance the likelihood of continuity and stability if our board of directors determines that a takeover is not in the best interests of our stockholders. These provisions, however, could have the effect of discouraging attempts to acquire us, which could deprive our stockholders of opportunities to sell their shares of common stock at prices higher than prevailing market prices.
Election and Removal of Directors
Our amended and restated certificate of incorporation and our amended and restated bylaws contain provisions that establish specific procedures for appointing and removing members of the board of directors. Under our amended and restated certificate of incorporation and amended and restated bylaws, our board will be classified into three classes of directors and, under our amended and restated bylaws, directors will be elected by a plurality of the votes cast in each election. Only one class will stand for election at each annual meeting, and directors will be elected to serve three-year terms. In addition, our amended and restated certificate of incorporation and amended and restated bylaws will provide that vacancies and newly created directorships on the board of directors may be filled only by a majority of the directors then serving on the board (except as otherwise required by law or by resolution of the board). Under our amended and restated certificate of incorporation and amended and restated bylaws, directors may only be removed for cause, and only with the affirmative vote of a majority of the voting interest of stockholders entitled to vote
Special Stockholder Meetings
Under our amended and restated certificate of incorporation and amended and restated bylaws, only the chairman of the board, our chief executive officer and our board of directors may call special meetings of stockholders.
Requirements for Advance Notification of Stockholder Nominations and Proposals
Our amended and restated bylaws establish advance notice procedures with respect to stockholder proposals and the nomination of candidates for election as directors, other than nominations made by or at the direction of the board of directors or a committee of the board of directors.
Delaware Anti-Takeover Law
Following this offering, we will be subject to Section 203 of the Delaware General Corporation Law, which is an anti-takeover law. In general, Section 203 prohibits a publicly-held Delaware corporation from engaging in a business combination with an interested stockholder for a period of three years following the date that the person became an interested stockholder, unless the business combination or the transaction in which the person became an interested stockholder is approved in a prescribed manner. Generally, a business combination includes a merger, asset or stock sale, or another transaction resulting in a financial benefit to the interested stockholder. Generally, an interested stockholder is a person who, together with affiliates and associates, owns 15% or more of the corporation’s voting stock. The existence of this provision may have an anti-takeover effect with respect to transactions that are not approved in advance by our board of directors, including discouraging attempts that might result in a premium over the market price for the shares of common stock held by stockholders.
Elimination of Stockholder Action by Written Consent
Our amended and restated certificate of incorporation and amended and restated bylaws eliminate the right of stockholders to act by written consent without a meeting after this offering.
123
Table of Contents
No Cumulative Voting
Under Delaware law, cumulative voting for the election of directors is not permitted unless a corporation’s certificate of incorporation authorizes cumulative voting. Our amended and restated certificate of incorporation and amended and restated bylaws do not provide for cumulative voting in the election of directors. Cumulative voting allows a minority stockholder to vote a portion or all of its shares for one or more candidates for seats on the board of directors. Without cumulative voting, a minority stockholder will not be able to gain as many seats on our board of directors based on the number of shares of our stock the stockholder holds as the stockholder would be able to gain if cumulative voting were permitted. The absence of cumulative voting makes it more difficult for a minority stockholder to gain a seat on our board of directors to influence our board’s decision regarding a takeover.
Undesignated Preferred Stock
The authorization of undesignated preferred stock makes it possible for our board of directors to issue preferred stock with voting or other rights or preferences that could impede the success of any attempt to change control of our company.
Amendment of Provisions in Certificate of Incorporation and Bylaws
The amendment of most of the above provisions in our amended and restated certificate of incorporation and amended and restated bylaws requires approval by holders of at least two-thirds of our outstanding capital stock entitled to vote generally in the election of directors.
These and other provisions could have the effect of discouraging others from attempting hostile takeovers and, as a consequence, may also inhibit temporary fluctuations in the market price of our common stock that often result from actual or rumored hostile takeover attempts. These provisions may also have the effect of preventing changes in our management. It is possible that these provisions could make it more difficult to accomplish transactions that stockholders may otherwise deem to be in their best interests.
Transfer Agent and Registrar
The transfer agent and registrar for our common stock is . Its telephone number is .
Listing on
We intend to apply to have our common stock listed on The NASDAQ Global Market under the symbol “SYNC.”
124
Table of Contents
SHARES ELIGIBLE FOR FUTURE SALE
Prior to this offering, there has been no public market for our common stock, and we cannot assure you that a significant public market for our common stock will develop or be sustained after this offering. Other than as described below, no shares currently outstanding will be available for sale immediately after this offering due to certain contractual and securities law restrictions on resale. Sales of substantial amounts of our common stock, including shares issued upon exercise of outstanding options to purchase shares of common stock, in the public market after the restrictions lapse, or the possibility of such sales, could cause the prevailing market price to decline and limit our ability to raise equity capital in the future.
Upon completion of this offering, we will have issued and outstanding an aggregate of shares of common stock, assuming no exercise of the underwriters’ option to purchase additional shares and no exercise of options to purchase common stock that were outstanding as of September 30, 2011. The shares of common stock being sold in this offering will be freely tradable without restriction or further registration under the Securities Act unless purchased by our “affiliates” (as that term is defined in Rule 144 under the Securities Act).
The remaining 40,101,305 shares of common stock held by existing stockholders are “restricted securities” as that term is defined in Rule 144 under the Securities Act. Restricted securities may be sold in the public market only if registered or if they qualify for an exemption from registration under Section 4(1) or Rules 144 or 701 promulgated under the Securities Act. We summarize these rules below.
Subject to any applicable vesting restrictions, the following table shows approximately when the 40,101,305 shares of our common stock that are not being sold in this offering, but which will be outstanding when this offering is complete, will be eligible for sale in the public market:
| Days After Date of this Prospectus |
Shares Eligible for Sale |
Explanation | ||||
| Upon effectiveness |
Shares sold by us in the offering | |||||
| Upon effectiveness |
21,384 | Freely tradable shares saleable under Rule 144 that are not subject to the lock-up | ||||
| 90 days |
— | Shares saleable under Rules 144 and 701 that are not subject to a lock-up | ||||
| 180 days |
40,079,921 | Lock-up released, subject to extension; shares saleable under Rules 144 and 701 | ||||
Resale of 28,184,871 of the restricted shares that will become available for sale in the public market starting 180 days after the effective date (or longer period described below) will be limited by volume and other resale restrictions under Rule 144 because the holders of those shares are our affiliates.
Lock-Up Agreements
Our directors, executive officers, holders of substantially all of our common stock and holders of options and warrants to purchase our stock have agreed with the underwriters, subject to certain exceptions, not to dispose of or hedge any of their common stock or any securities convertible into or exchangeable or exercisable for shares of common stock for a period through the date 180 days after the date of this prospectus, except with the prior written consent of Merrill Lynch, Pierce, Fenner & Smith Incorporated and Citigroup Global Markets Inc. In addition, substantially all of the holders of our common stock and options to purchase our common stock have previously entered agreements with us not to sell or otherwise transfer any of their common stock or securities convertible into or exchangeable for shares of common stock for a period through the date 180 days after the date of this prospectus.
125
Table of Contents
The 180-day restricted period under the agreements with the underwriters described in the preceding paragraph will be automatically extended if: (1) during the last 17 days of the 180-day restricted period we issue an earnings release or material news or a material event relating to us occurs; or (2) prior to the expiration of the 180-day restricted period, we announce that we will release earnings results or become aware that material news or a material event will occur during the 16-day period following the last day of the 180-day period, in which case the restrictions described in the preceding paragraph will continue to apply until the expiration of the 18-day period beginning on the issuance of the earnings release or the occurrence of the material news or a material event, as applicable, unless Merrill Lynch, Pierce, Fenner & Smith Incorporated and Citigroup Global Markets Inc. waive, in writing, such extension.
Rule 144
In general, under Rule 144 as currently in effect, once we have been subject to public company reporting requirements for at least 90 days, a person who is not deemed to have been one of our affiliates for purposes of the Securities Act at any time during the 90 days preceding a sale and who has beneficially owned the shares proposed to be sold for at least six months, including the holding period of any prior owner other than our affiliates, is entitled to sell those shares without complying with the manner of sale, volume limitation or notice provisions of Rule 144, subject to compliance with the public information requirements of Rule 144. If such a person has beneficially owned the shares proposed to be sold for at least one year, including the holding period of any prior owner other than our affiliates, then that person is entitled to sell those shares without complying with any of the requirements of Rule 144.
In general, under Rule 144 as currently in effect, beginning 90 days after the date of this prospectus, and subject to the restrictions contained in the lock-up agreements described above, our affiliates or persons selling shares on behalf of our affiliates would be entitled to sell within any three-month period a number of shares that does not exceed the greater of:
| • | 1% of the number of shares of common stock then outstanding, which will equal approximately shares immediately after the completion of this offering, assuming no exercise of the underwriters’ option to purchase additional shares; and |
| • | the average weekly trading volume of the common stock on the open market during the four calendar weeks preceding the filing of a Form 144 with respect to such sale. |
Sales under Rule 144 by our affiliates or persons selling shares on behalf of our affiliates are also subject to certain manner of sale provisions and notice requirements and to the availability of current public information about us.
Rule 701
Rule 701, as currently in effect, permits resales of shares in reliance upon Rule 144 but without compliance with certain restrictions, including the holding period requirement, of Rule 144. Any employee, officer or director of or consultant to us who purchased shares under a written compensatory plan or contract prior to this offering may be entitled to rely on the resale provisions of Rule 701. Rule 701 permits affiliates to sell their Rule 701 shares under Rule 144 without complying with the holding period requirements of Rule 144. Rule 701 further provides that non-affiliates may sell such shares in reliance on Rule 144 without having to comply with the holding period, public information, volume limitation or notice provisions of Rule 144. All holders of Rule 701 shares are required to wait until 90 days after the date of this prospectus before selling such shares. All Rule 701 shares are, however, subject to lock-up agreements and will only become eligible for sale upon the expiration of the contractual lock-up agreements.
126
Table of Contents
Registration Rights
After the completion of this offering, the holders of 37,630,875 shares of our common stock will be entitled to the registration rights described in “Description of Capital Stock—Registration Rights.” All such shares are covered by lock-up agreements. Following the expiration of the applicable lock-up period, registration of these shares under the Securities Act would result in the shares becoming freely tradable without restriction under the Securities Act immediately upon the effectiveness of the registration, except for shares purchased by our affiliates.
Form S-8 Registration Statements
Following the consummation of this offering, we intend to file one or more registration statements on Form S-8 under the Securities Act to register the shares of our common stock that are issuable pursuant to our 2012 Equity Incentive Plan, 2006 Stock Plan and 2000 Stock Plan. See “Management—Equity Benefit Plans.” Subject to the lock-up agreements described above and any applicable vesting restrictions, shares registered under these registration statements will be available for resale in the public market immediately upon the effectiveness of these registration statements, except with respect to Rule 144 volume limitations that apply to our affiliates.
127
Table of Contents
MATERIAL UNITED STATES FEDERAL INCOME TAX CONSEQUENCES TO NON-U.S. HOLDERS OF OUR COMMON STOCK
The following is a summary of the material United States federal income tax consequences to certain non-U.S. holders (as described below) of the acquisition, ownership and disposition of our common stock issued pursuant to this offering. This discussion is not a complete analysis of all potential U.S. federal income tax consequences relating thereto, nor does it address any estate and gift tax consequences or any tax consequences arising under any state, local or foreign tax laws, or any other United States federal tax laws. This discussion is based on the Internal Revenue Code of 1986, as amended, or the Code, Treasury Regulations promulgated thereunder, judicial decisions, and published rulings and administrative pronouncements of the Internal Revenue Service, or IRS, all as in effect as of the date of this offering. These authorities may change, possibly retroactively, resulting in U.S. federal income tax consequences different from those discussed below. No ruling has been or will be sought from the IRS with respect to the matters discussed below, and there can be no assurance that the IRS will not take a contrary position regarding the tax consequences of the acquisition, ownership or disposition of our common stock, or that any such contrary position would not be sustained by a court.
This discussion is limited to non-U.S. holders who purchase our common stock issued pursuant to this offering and who hold our common stock as a “capital asset” within the meaning of Section 1221 of the Code (generally, property held for investment). This discussion does not address all of the U.S. federal income tax consequences that may be relevant to a particular holder in light of such holder’s particular circumstances. This discussion also does not consider any specific facts or circumstances that may be relevant to holders subject to special rules under the U.S. federal income tax laws, including, without limitation, former citizens or residents of the United States, partnerships or other pass-through entities and investors in such entities, real estate investment trusts, regulated investment companies, “controlled foreign corporations,” “passive foreign investment companies,” corporations that accumulate earnings to avoid U.S. federal income tax, banks, financial institutions, investment funds, insurance companies, brokers, dealers or traders in securities, commodities or currencies, tax-exempt organizations, tax-qualified retirement plans, persons subject to the alternative minimum tax, persons that own, or have owned, actually or constructively, more than 5% of our common stock and persons holding our common stock as part of a hedging or conversion transaction or straddle, or a constructive sale, or other risk reduction strategy. Holders subject to special rules under the U.S. federal income tax laws should consult their own tax advisors to determine the U.S. federal, state, local, and other tax consequences that may be relevant to them.
PROSPECTIVE INVESTORS SHOULD CONSULT THEIR TAX ADVISORS REGARDING THE PARTICULAR U.S. FEDERAL INCOME TAX CONSEQUENCES TO THEM OF ACQUIRING, OWNING AND DISPOSING OF OUR COMMON STOCK, AS WELL AS ANY TAX CONSEQUENCES ARISING UNDER ANY STATE, LOCAL OR FOREIGN TAX LAWS AND ANY OTHER U.S. FEDERAL TAX LAWS.
Definition of Non-U.S. Holder
For purposes of this discussion, a non-U.S. holder is any beneficial owner of our common stock that is not a “U.S. person” or a partnership (including any entity or arrangement treated as a partnership) for U.S. federal income tax purposes. For purposes of this discussion, a U.S. person is any of the following:
| • | an individual citizen or resident of the United States; |
| • | a corporation or other entity treated as a corporation for U.S. federal income tax purposes created or organized in or under the laws of the United States or any political subdivision thereof; |
| • | an estate the income of which is subject to U.S. federal income tax regardless of its source; or |
128
Table of Contents
| • | a trust (1) whose administration is subject to the primary supervision of a U.S. court and which has one or more U.S. persons who have the authority to control all substantial decisions of the trust, or (2) that has a valid election in effect under applicable Treasury Regulations to be treated as a U.S. person. |
In the case of a holder that is classified as a partnership for U.S. federal income tax purposes, the tax treatment of a partner in such partnership generally will depend upon the status of the partner and the activities of the partner and the partnership. If you are a partner of a partnership holding our common stock, then you should consult your own tax advisor.
Distributions on Our Common Stock
If we make cash or other property distributions on our common stock (other than certain pro rata distributions of our common stock), such distributions will constitute dividends for U.S. federal income tax purposes to the extent paid from our current or accumulated earnings and profits, as determined under U.S. federal income tax principles. Amounts not treated as dividends for U.S. federal income tax purposes will constitute a return of capital and will first be applied against and reduce a holder’s tax basis in the common stock, but not below zero. Any excess will be treated as gain realized on the sale or other disposition of the common stock and will be treated as described under “Gain on Disposition of Our Common Stock” below.
Dividends paid to a non-U.S. holder of our common stock generally will be subject to U.S. federal withholding tax at a rate of 30% of the gross amount of the dividends, or such lower rate specified by an applicable income tax treaty. To receive the benefit of a reduced treaty rate, a non-U.S. holder must furnish to us or our paying agent a valid IRS Form W-8BEN (or other applicable form) including a U.S. taxpayer identification number and certifying such holder’s qualification for the reduced rate. Treasury Regulations or the applicable treaty will provide rates to determine whether dividends paid to an entity should be treated as paid to the entity or the entity’s owners. This certification must be provided to us or our paying agent prior to the payment of dividends and must be updated periodically. If the non-U.S. holder holds the stock through a financial institution or other agent acting on the non-U.S. holder’s behalf, the non-U.S. holder will be required to provide appropriate documentation to the agent, which then will be required to provide certification to us or our paying agent, either directly or through other intermediaries. Non-U.S. holders that do not timely provide us or our paying agent with the required certification, but that are eligible for a reduced rate of withholding pursuant to a tax treaty may obtain a refund of any excess amounts withheld by timely filing an appropriate claim for refund with the IRS.
If a non-U.S. holder holds our common stock in connection with the conduct of a trade or business in the United States, and dividends paid on the common stock are effectively connected with such holder’s U.S. trade or business, the non-U.S. holder will generally be exempt from U.S. federal withholding tax. To claim the exemption, the non-U.S. holder must generally furnish to us or our paying agent a properly executed IRS Form W-8ECI (or applicable successor form). Any dividends paid on our common stock that are effectively connected with a non-U.S. holder’s United States trade or business (and if an income tax treaty applies, are attributable to a permanent establishment maintained by the non-U.S. holder in the United States) generally will be subject to United States federal income tax on a net income basis at the regular graduated U.S. federal income tax rates in much the same manner as if such holder were a resident of the United States. A non-U.S. holder that is a foreign corporation also may be subject to an additional branch profits tax equal to 30% (or such lower rate specified by an applicable income tax treaty) of its effectively connected earnings and profits for the taxable year, as adjusted for certain items. Non-U.S. holders should consult any applicable income tax treaties that may provide for different rules.
129
Table of Contents
Gain on Disposition of Our Common Stock
Subject to the discussion below regarding backup withholding and certain recently enacted legislation, a non-U.S. holder generally will not be subject to U.S. federal income tax on any gain realized upon the sale or other disposition of our common stock, unless:
| • | the gain is effectively connected with the non-U.S. holder’s conduct of a trade or business in the United States, and if an income tax treaty applies, is attributable to a permanent establishment maintained by the non-U.S. holder in the United States; |
| • | the non-U.S. holder is a nonresident alien individual present in the United States for 183 days or more during the taxable year of the disposition, and certain other requirements are met; or |
| • | our common stock constitutes a “United States real property interest” in the event we are a United States real property holding corporation, or USRPHC, for United States federal income tax purposes at any time within the shorter of the five-year period preceding the disposition or the non-U.S. holder’s holding period for our common stock and our common stock has ceased to be regularly traded on an established securities market prior to the beginning of the calendar year in which the sale or other disposition occurs. The determination of whether we are a USRPHC depends on the fair market value of our United States real property interests relative to the fair market value of our other trade or business assets and our foreign real property interests. |
Gain described in the first bullet point above will be subject to U.S. federal income tax on a net income basis at the regular graduated U.S. federal income tax rates in the same manner as if such holder were a resident of the United States. A non-U.S. holder that is a foreign corporation also may be subject to an additional branch profits tax equal to 30% (or such lower rate specified by an applicable income tax treaty) of its effectively connected earnings and profits for the taxable year, as adjusted for certain items. Non-U.S. holders should consult any applicable income tax treaties that may provide for different rules.
Gain described in the second bullet point above will be subject to U.S. federal income tax at a flat 30% rate (or such lower rate specified by an applicable income tax treaty), but may be offset by U.S. source capital losses (even though the individual is not considered a resident of the United States), provided that the non-U.S. holder has timely filed U.S. federal income tax returns with respect to such losses.
Information Reporting and Backup Withholding
We must report annually to the IRS and to each non-U.S. holder the amount of dividends on our common stock paid to such holder and the amount of any tax withheld with respect to those dividends. These information reporting requirements apply even if no withholding was required because the dividends were effectively connected with the holder’s conduct of a U.S. trade or business, or withholding was reduced or eliminated by an applicable income tax treaty. This information also may be made available under a specific treaty or agreement with the tax authorities in the country in which the non-U.S. holder resides or is established.
Backup withholding, currently at a 28% rate, generally will not apply to payments to a non-U.S. holder of dividends on or the gross proceeds or a disposition of our common stock if the non-U.S. holder has furnished to us or our paying agent the required certification as to its non-U.S. status, such as by providing a valid IRS Form W-8BEN or IRS Form W-8ECI. However, backup withholding may apply if either we or our paying agent has actual knowledge, or reason to know, that the holder is a U.S. person that is not an exempt recipient. Backup withholding is not an additional tax. If any amount is withheld under the backup withholding rules, the non-U.S. holder should consult with a U.S. tax advisor regarding the possibility of and procedure for obtaining a refund or a credit against the non-U.S. holder’s U.S. federal income tax liability, if any.
130
Table of Contents
Recently Enacted Legislation Affecting Taxation of Our Common Stock Held by or through Foreign Entities
Recently enacted legislation generally imposes withholding at a rate of 30% on payments to certain foreign entities (including financial intermediaries), after December 31, 2012 (subject to certain transition rules), of dividends on and the gross proceeds of dispositions of U.S. common stock, unless various U.S. information reporting and due diligence requirements (generally relating to ownership by U.S. persons of interests in or accounts with those entities) have been satisfied. Prospective investors are encouraged to consult with their own tax advisors regarding the possible implications of this legislation on their investment in our common stock.
THE SUMMARY OF MATERIAL U.S. FEDERAL INCOME TAX CONSEQUENCES ABOVE IS INCLUDED FOR GENERAL INFORMATION PURPOSES ONLY. PROSPECTIVE INVESTORS ARE URGED TO CONSULT THEIR OWN TAX ADVISORS TO DETERMINE THE U.S. FEDERAL, STATE, LOCAL, AND NON-U.S. TAX CONSIDERATIONS OF THE PURCHASE, OWNERSHIP, AND DISPOSITION OF OUR COMMON STOCK.
131
Table of Contents
Merrill Lynch, Pierce, Fenner & Smith Incorporated and Citigroup Global Markets Inc. are acting as representatives of each of the underwriters named below. Subject to the terms and conditions set forth in an underwriting agreement among us and the underwriters, we have agreed to sell to the underwriters, and each of the underwriters has agreed, severally and not jointly, to purchase from us, the number of shares of common stock set forth opposite its name below.
| Underwriter | Number of Shares | |
| Merrill Lynch, Pierce, Fenner & Smith |
||
| Citigroup Global Markets Inc. |
||
| Stifel, Nicolaus & Company, Incorporated |
||
| BMO Capital Markets Corp. |
||
| Needham & Company, LLC |
||
| Oppenheimer & Co. Inc. |
||
|
| ||
| Total |
||
|
|
Subject to the terms and conditions set forth in the underwriting agreement, the underwriters have agreed, severally and not jointly, to purchase all of the shares sold under the underwriting agreement if any of these shares are purchased. If an underwriter defaults, the underwriting agreement provides that the purchase commitments of the nondefaulting underwriters may be increased or the underwriting agreement may be terminated.
We have agreed to indemnify the underwriters against certain liabilities, including liabilities under the Securities Act, or to contribute to payments the underwriters may be required to make in respect of those liabilities.
The underwriters are offering the shares, subject to prior sale, when, as and if issued to and accepted by them, subject to approval of legal matters by their counsel, including the validity of the shares, and other conditions contained in the underwriting agreement, such as the receipt by the underwriters of officer’s certificates and legal opinions. The underwriters reserve the right to withdraw, cancel or modify offers to the public and to reject orders in whole or in part.
Commissions and Discounts
The representatives have advised us that the underwriters propose initially to offer the shares to the public at the public offering price set forth on the cover page of this prospectus and to dealers at that price less a concession not in excess of $ per share. After the initial offering, the public offering price, concession or any other term of the offering may be changed.
The following table shows the public offering price, underwriting discount and proceeds before expenses to us. The information assumes either no exercise or full exercise by the underwriters of their option to purchase additional shares.
| Per Share | Without Option | With Option | ||||||||||
| Public offering price |
$ | $ | $ | |||||||||
| Underwriting discount |
$ | $ | $ | |||||||||
| Proceeds, before expenses, to Synacor, Inc. |
$ | $ | $ | |||||||||
132
Table of Contents
The expenses of the offering, not including the underwriting discount, are estimated at $ and are payable by us.
Option to Purchase Additional Shares
We have granted an option to the underwriters, exercisable for 30 days after the date of this prospectus, to purchase up to additional shares at the public offering price, less the underwriting discount. If the underwriters exercise this option, each will be obligated, subject to conditions contained in the underwriting agreement, to purchase a number of additional shares proportionate to that underwriter’s initial amount reflected in the above table.
No Sales of Similar Securities
We, our executive officers and directors and our other existing security holders have agreed not to sell or transfer any common stock or securities convertible into, exchangeable for, exercisable for, or repayable with common stock, for 180 days after the date of this prospectus without first obtaining the written consent of the representatives. Specifically, we and these other persons have agreed, with certain limited exceptions, not to directly or indirectly
| • | offer, pledge, sell or contract to sell any common stock, |
| • | sell any option or contract to purchase any common stock, |
| • | purchase any option or contract to sell any common stock, |
| • | grant any option, right or warrant for the sale of any common stock, |
| • | lend or otherwise dispose of or transfer any common stock, |
| • | request or demand that we file a registration statement related to the common stock, or |
| • | enter into any swap or other agreement that transfers, in whole or in part, the economic consequence of ownership of any common stock whether any such swap or transaction is to be settled by delivery of shares or other securities, in cash or otherwise. |
This lock-up provision applies to common stock and to securities convertible into or exchangeable or exercisable for or repayable with common stock. It also applies to common stock owned now or acquired later by the person executing the agreement or for which the person executing the agreement later acquires the power of disposition. In the event that either (x) during the last 17 days of the lock-up period referred to above, we issue an earnings release or material news or a material event relating to us occurs or (y) prior to the expiration of the lock-up period, we announce that we will release earnings results or become aware that material news or a material event will occur during the 16-day period beginning on the last day of the lock-up period, the restrictions described above shall continue to apply until the expiration of the 18-day period beginning on the issuance of the earnings release or the occurrence of the material news or material event, as applicable, unless the representatives waive, in writing, such extension.
Listing
We expect the shares to be approved for listing on The NASDAQ Global Market, subject to notice of issuance, under the symbol “SYNC.”
133
Table of Contents
Before this offering, there has been no public market for our common stock. The initial public offering price will be determined through negotiations between us and the representatives. In addition to prevailing market conditions, the factors to be considered in determining the initial public offering price are
| • | the valuation multiples of publicly-traded companies that the representatives believe to be comparable to us, |
| • | our financial information, |
| • | the history of, and the prospects for, our company and the industry in which we compete, |
| • | an assessment of our management, its past and present operations, and the prospects for, and timing of, our future revenue, |
| • | the present state of our development, and |
| • | the above factors in relation to market values and various valuation measures of other companies engaged in activities similar to ours. |
An active trading market for the shares may not develop. It is also possible that after the offering the shares will not trade in the public market at or above the initial public offering price.
The underwriters do not expect to sell more than 5% of the shares in the aggregate to accounts over which they exercise discretionary authority.
Price Stabilization, Short Positions and Penalty Bids
Until the distribution of the shares is completed, SEC rules may limit underwriters and selling group members from bidding for and purchasing our common stock. However, the representatives may engage in transactions that stabilize the price of the common stock, such as bids or purchases to peg, fix or maintain that price.
In connection with the offering, the underwriters may purchase and sell our common stock in the open market. These transactions may include short sales, purchases on the open market to cover positions created by short sales and stabilizing transactions. Short sales involve the sale by the underwriters of a greater number of shares than they are required to purchase in the offering. “Covered” short sales are sales made in an amount not greater than the underwriters’ option to purchase additional shares described above. The underwriters may close out any covered short position by either exercising their option to purchase additional shares or purchasing shares in the open market. In determining the source of shares to close out the covered short position, the underwriters will consider, among other things, the price of shares available for purchase in the open market as compared to the price at which they may purchase shares through the option granted to them. “Naked” short sales are sales in excess of such option. The underwriters must close out any naked short position by purchasing shares in the open market. A naked short position is more likely to be created if the underwriters are concerned that there may be downward pressure on the price of our common stock in the open market after pricing that could adversely affect investors who purchase in the offering. Stabilizing transactions consist of various bids for or purchases of shares of common stock made by the underwriters in the open market prior to the completion of the offering.
The underwriters may also impose a penalty bid. This occurs when a particular underwriter repays to the underwriters a portion of the underwriting discount received by it because the representatives have repurchased shares sold by or for the account of such underwriter in stabilizing or short covering transactions.
Similar to other purchase transactions, the underwriters’ purchases to cover the syndicate short sales may have the effect of raising or maintaining the market price of our common stock or preventing or retarding a
134
Table of Contents
decline in the market price of our common stock. As a result, the price of our common stock may be higher than the price that might otherwise exist in the open market. The underwriters may conduct these transactions on The NASDAQ Global Market, in the over-the-counter market or otherwise.
Neither we nor any of the underwriters make any representation or prediction as to the direction or magnitude of any effect that the transactions described above may have on the price of our common stock. In addition, neither we nor any of the underwriters make any representation that the representatives will engage in these transactions or that these transactions, once commenced, will not be discontinued without notice.
Electronic Distribution
In connection with the offering, certain of the underwriters or securities dealers may distribute prospectuses by electronic means, such as e-mail.
Other Relationships
Some of the underwriters and their affiliates have engaged in, and may in the future engage in, investment banking and other commercial dealings in the ordinary course of business with us or our affiliates. They have received, or may in the future receive, customary fees and commissions for these transactions.
In addition, in the ordinary course of their business activities, the underwriters and their affiliates may make or hold a broad array of investments and actively trade debt and equity securities (or related derivative securities) and financial instruments (including bank loans) for their own account and for the accounts of their customers. Such investments and securities activities may involve securities and/or instruments of ours or our affiliates. The underwriters and their affiliates may also make investment recommendations and/or publish or express independent research views in respect of such securities or financial instruments and may hold, or recommend to clients that they acquire, long and/or short positions in such securities and instruments.
Notice to Prospective Investors in the European Economic Area
In relation to each Member State of the European Economic Area which has implemented the Prospectus Directive (each, a “Relevant Member State”), with effect from and including the date on which the Prospectus Directive is implemented in that Relevant Member State (the “Relevant Implementation Date”), no offer of shares may be made to the public in that Relevant Member State other than:
| A. | to any legal entity which is a qualified investor as defined in the Prospectus Directive; |
| B. | to fewer than 100 or, if the Relevant Member State has implemented the relevant provision of the 2010 PD Amending Directive, 150, natural or legal persons (other than qualified investors as defined in the Prospectus Directive), as permitted under the Prospectus Directive, subject to obtaining the prior consent of the representatives; or |
| C. | in any other circumstances falling within Article 3(2) of the Prospectus Directive, |
provided that no such offer of shares shall require the Company or the representatives to publish a prospectus pursuant to Article 3 of the Prospectus Directive or supplement a prospectus pursuant to Article 16 of the Prospectus Directive.
Each person in a Relevant Member State (other than a Relevant Member State where there is a Permitted Public Offer) who initially acquires any shares or to whom any offer is made will be deemed to have represented, acknowledged and agreed that (A) it is a “qualified investor” within the meaning of the law in that Relevant Member State implementing Article 2(1)(e) of the Prospectus Directive, and (B) in the case of any
135
Table of Contents
shares acquired by it as a financial intermediary, as that term is used in Article 3(2) of the Prospectus Directive, the shares acquired by it in the offering have not been acquired on behalf of, nor have they been acquired with a view to their offer or resale to, persons in any Relevant Member State other than “qualified investors” as defined in the Prospectus Directive, or in circumstances in which the prior consent of the representatives has been given to the offer or resale. In the case of any shares being offered to a financial intermediary as that term is used in Article 3(2) of the Prospectus Directive, each such financial intermediary will be deemed to have represented, acknowledged and agreed that the shares acquired by it in the offer have not been acquired on a non-discretionary basis on behalf of, nor have they been acquired with a view to their offer or resale to, persons in circumstances which may give rise to an offer of any shares to the public other than their offer or resale in a Relevant Member State to qualified investors as so defined or in circumstances in which the prior consent of the representatives has been obtained to each such proposed offer or resale.
The Company, the representatives and their affiliates will rely upon the truth and accuracy of the foregoing representation, acknowledgement and agreement.
This prospectus has been prepared on the basis that any offer of shares in any Relevant Member State will be made pursuant to an exemption under the Prospectus Directive from the requirement to publish a prospectus for offers of shares. Accordingly any person making or intending to make an offer in that Relevant Member State of shares which are the subject of the offering contemplated in this prospectus may only do so in circumstances in which no obligation arises for the Company or any of the underwriters to publish a prospectus pursuant to Article 3 of the Prospectus Directive in relation to such offer. Neither the Company nor the underwriters have authorized, nor do they authorize, the making of any offer of shares in circumstances in which an obligation arises for the Company or the underwriters to publish a prospectus for such offer.
For the purpose of the above provisions, the expression “an offer to the public” in relation to any shares in any Relevant Member State means the communication in any form and by any means of sufficient information on the terms of the offer and the shares to be offered so as to enable an investor to decide to purchase or subscribe the shares, as the same may be varied in the Relevant Member State by any measure implementing the Prospectus Directive in the Relevant Member State and the expression “Prospectus Directive” means Directive 2003/71/EC (including the 2010 PD Amending Directive, to the extent implemented in the Relevant Member States) and includes any relevant implementing measure in the Relevant Member State and the expression “2010 PD Amending Directive” means Directive 2010/73/EU.
Notice to Prospective Investors in the United Kingdom
In addition, in the United Kingdom, this document is being distributed only to, and is directed only at, and any offer subsequently made may only be directed at persons who are “qualified investors” (as defined in the Prospectus Directive) (i) who have professional experience in matters relating to investments falling within Article 19 (5) of the Financial Services and Markets Act 2000 (Financial Promotion) Order 2005, as amended (the “Order”) and/or (ii) who are high net worth companies (or persons to whom it may otherwise be lawfully communicated) falling within Article 49(2)(a) to (d) of the Order (all such persons together being referred to as “relevant persons”). This document must not be acted on or relied on in the United Kingdom by persons who are not relevant persons. In the United Kingdom, any investment or investment activity to which this document relates is only available to, and will be engaged in with, relevant persons.
Notice to Prospective Investors in Switzerland
The shares may not be publicly offered in Switzerland and will not be listed on the SIX Swiss Exchange (“SIX”) or on any other stock exchange or regulated trading facility in Switzerland. This document has been prepared without regard to the disclosure standards for issuance prospectuses under art. 652a or art. 1156 of the Swiss Code of Obligations or the disclosure standards for listing prospectuses under art. 27 ff. of the SIX Listing Rules or the listing rules of any other stock exchange or regulated trading facility in Switzerland. Neither this
136
Table of Contents
document nor any other offering or marketing material relating to the shares or the offering may be publicly distributed or otherwise made publicly available in Switzerland.
Neither this document nor any other offering or marketing material relating to the offering, the Company, the shares have been or will be filed with or approved by any Swiss regulatory authority. In particular, this document will not be filed with, and the offer of shares will not be supervised by, the Swiss Financial Market Supervisory Authority FINMA (FINMA), and the offer of shares has not been and will not be authorized under the Swiss Federal Act on Collective Investment Schemes (“CISA”). The investor protection afforded to acquirers of interests in collective investment schemes under the CISA does not extend to acquirers of shares.
Notice to Prospective Investors in the Dubai International Financial Centre
This prospectus relates to an Exempt Offer in accordance with the Offered Securities Rules of the Dubai Financial Services Authority (“DFSA”). This prospectus is intended for distribution only to persons of a type specified in the Offered Securities Rules of the DFSA. It must not be delivered to, or relied on by, any other person. The DFSA has no responsibility for reviewing or verifying any documents in connection with Exempt Offers. The DFSA has not approved this prospectus nor taken steps to verify the information set forth herein and has no responsibility for the prospectus. The shares to which this prospectus relates may be illiquid and/or subject to restrictions on their resale. Prospective purchasers of the shares offered should conduct their own due diligence on the shares. If you do not understand the contents of this prospectus you should consult an authorized financial advisor.
137
Table of Contents
The validity of the common stock being offered hereby will be passed upon for the company by Gunderson Dettmer Stough Villeneuve Franklin & Hachigian, LLP, New York, New York. Certain legal matters in connection with this offering will be passed upon for the underwriters by O’Melveny & Myers, LLP, Los Angeles, California.
The financial statements as of December 31, 2009 and 2010, and for the years ended December 31, 2008, 2009, and 2010 included in this prospectus have been audited by Deloitte & Touche LLP, an independent registered public accounting firm, as stated in their report appearing herein and have been so included in reliance upon the report of such firm given upon their authority as experts in accounting and auditing.
WHERE YOU CAN FIND ADDITIONAL INFORMATION
We have filed with the SEC a registration statement on Form S-1 under the Securities Act with respect to the shares of common stock we are offering. This prospectus, which constitutes part of the registration statement, does not contain all of the information set forth in the registration statement. For further information about us and the common stock we propose to sell in this offering, we refer you to the registration statement and the exhibits and schedules filed as a part of the registration statement. Statements contained in this prospectus as to the contents of any contract or other document filed as an exhibit to the registration statement are not necessarily complete. If a contract or document has been filed as an exhibit to the registration statement, we refer you to the copy of the contract or document that has been filed. Each statement in this prospectus relating to a contract or document filed as an exhibit is qualified in all respects by the filed exhibit. The exhibits to the registration statement should be reviewed for the complete contents of these contracts and documents.
You may inspect a copy of the registration statement and the exhibits and schedules to the registration statement without charge at the Public Reference Room located at the offices of the SEC at 100 F Street, N.E., Washington, D.C. 20549. You may obtain copies of all or any part of the registration statement from the Public Reference Room maintained by the SEC located at 100 F Street, N.E., Washington, D.C. 20549 upon the payment of the fees prescribed by the SEC. You may obtain information on the operation of the Public Reference Room by calling the SEC at 1-800-SEC-0330. The SEC maintains a website at www.sec.gov that contains reports, proxy and information statements and other information regarding registrants like us that file electronically with the SEC. You can also inspect our registration statement on this website.
Upon completion of this offering, we will become subject to the information and periodic reporting requirements of the Exchange Act, and we intend to file periodic reports, proxy statements and other information with the SEC. The periodic reports and other information that we file with the SEC will be available for inspection and copying at the SEC’s public reference facilities and on the website of the SEC referred to above. We intend to furnish our stockholders with annual reports containing financial statements audited by an independent registered public accounting firm. We also maintain an Internet site at www.synacor.com. Our website and the information contained on or accessible through our website shall not be deemed to be incorporated into this prospectus or the registration statement of which it forms a part.
138
Table of Contents
INDEX TO THE FINANCIAL STATEMENTS
SYNACOR, INC.
F-1
Table of Contents
REPORT OF INDEPENDENT REGISTERED PUBLIC ACCOUNTING FIRM
To the Board of Directors of
Synacor, Inc.
Buffalo, New York
We have audited the accompanying balance sheets of Synacor, Inc. (the “Company”) as of December 31, 2009 and 2010, and the related statements of operations, stockholders’ equity, and cash flows for each of the three years in the period ended December 31, 2010. These financial statements are the responsibility of the Company’s management. Our responsibility is to express an opinion on these financial statements based on our audits.
We conducted our audits in accordance with the standards of the Public Company Accounting Oversight Board (United States). Those standards require that we plan and perform the audit to obtain reasonable assurance about whether the financial statements are free of material misstatement. The Company is not required to have, nor were we engaged to perform, an audit of its internal control over financial reporting. Our audits included consideration of internal control over financial reporting as a basis for designing audit procedures that are appropriate in the circumstances, but not for the purpose of expressing an opinion on the effectiveness of the Company’s internal control over financial reporting. Accordingly, we express no such opinion. An audit also includes examining, on a test basis, evidence supporting the amounts and disclosures in the financial statements, assessing the accounting principles used and significant estimates made by management, as well as evaluating the overall financial statement presentation. We believe that our audits provide a reasonable basis for our opinion.
In our opinion, such financial statements present fairly, in all material respects, the financial position of the Company as of December 31, 2009 and 2010, and the results of its operations and its cash flows for each of the three years in the period ended December 31, 2010, in conformity with accounting principles generally accepted in the United States of America.
/s/ Deloitte & Touche LLP
Williamsville, New York
March 29, 2011 (November 18, 2011 as to Note 6 and 10)
F-2
Table of Contents
SYNACOR, INC.
AS OF DECEMBER 31, 2009 AND 2010
(In thousands except for share and per share data)
| 2009 | 2010 | Pro Forma Stockholders’ Equity as of December 31, 2010 (note 1) Unaudited |
||||||||||
| ASSETS |
||||||||||||
| CURRENT ASSETS: |
||||||||||||
| Cash and cash equivalents |
$ | 10,462 | $ | 5,412 | ||||||||
| Accounts receivable—net of allowance of $63 and $19 |
7,773 | 9,654 | ||||||||||
| Prepaid expenses and other current assets |
916 | 1,536 | ||||||||||
|
|
|
|
|
|||||||||
| Total current assets |
19,151 | 16,602 | ||||||||||
| PROPERTY AND EQUIPMENT—Net |
6,631 | 7,110 | ||||||||||
| OTHER LONG-TERM ASSETS |
222 | 615 | ||||||||||
|
|
|
|
|
|||||||||
| TOTAL ASSETS |
$ | 26,004 | $ | 24,327 | ||||||||
|
|
|
|
|
|||||||||
| LIABILITIES AND STOCKHOLDERS’ EQUITY |
||||||||||||
| CURRENT LIABILITIES: |
||||||||||||
| Accounts payable |
$ | 6,531 | $ | 7,612 | ||||||||
| Accrued expenses and other current liabilities |
2,828 | 3,272 | ||||||||||
| Current portion of bank financing |
103 | 500 | ||||||||||
| Current portion of capital lease obligations |
1,976 | 1,478 | ||||||||||
|
|
|
|
|
|||||||||
| Total current liabilities |
11,438 | 12,862 | ||||||||||
| LONG-TERM PORTION OF BANK FINANCING |
309 | 250 | ||||||||||
| LONG-TERM PORTION OF CAPITAL LEASE OBLIGATIONS |
938 | 953 | ||||||||||
| OTHER LONG-TERM LIABILITIES |
266 | 106 | ||||||||||
|
|
|
|
|
|||||||||
| Total liabilities |
12,951 | 14,171 | ||||||||||
|
|
|
|
|
|||||||||
| COMMITMENTS AND CONTINGENCIES (Note 7) |
||||||||||||
| STOCKHOLDERS’ EQUITY: |
||||||||||||
| Common stock, $0.01 par value—authorized, 60,000,000 shares; 3,669,893 issued and 3,180,893 outstanding at December 31, 2009 and 3,808,308 issued and 3,169,308 shares outstanding at December 31, 2010 |
37 | 38 | $ | 386 | ||||||||
| Convertible preferred stock (liquidation value of $5,240 at December 31, 2010), $0.01 par value—authorized Series A, 5,709,638 shares; issued and outstanding, 5,548,508 shares at December 31, 2009 and 2010 |
5,077 | 5,077 | — | |||||||||
| Convertible preferred stock (liquidation value of $750 at December 31, 2010), $0.01 par value—authorized Series A-1, 570,344 shares; issued and outstanding, 570,344 shares at December 31, 2009 and 2010 |
730 | 730 | — | |||||||||
| Convertible preferred stock (liquidation value of $5,475 at December 31, 2010), $0.01 par value—authorized Series B, 3,500,000 shares; issued and outstanding, 2,737,500 shares at December 31, 2009 and 2010 |
5,401 | 5,401 | — | |||||||||
| Convertible preferred stock (liquidation value of $17,374 at December 31, 2010), $0.01 par value—authorized Series C, 2,740,407 shares; issued and outstanding, 2,740,407 shares at December 31, 2009 and 2010 |
17,224 | 17,224 | — | |||||||||
| Treasury stock—at cost, 489,000 shares in 2009 and 639,000 shares in 2010 |
(368 | ) | (569 | ) | (569 | ) | ||||||
| Additional paid-in capital |
43,446 | 44,340 | 72,424 | |||||||||
| Accumulated deficit |
(58,494 | ) | (62,085 | ) | (62,085 | ) | ||||||
|
|
|
|
|
|
|
|||||||
| Total stockholders’ equity |
13,053 | 10,156 | 10,156 | |||||||||
|
|
|
|
|
|
|
|||||||
| TOTAL LIABILITIES AND STOCKHOLDERS’ EQUITY |
$ | 26,004 | $ | 24,327 | $ | 24,327 | ||||||
|
|
|
|
|
|
|
|||||||
The accompanying notes are an integral part of these financial statements.
F-3
Table of Contents
SYNACOR, INC.
FOR THE YEARS ENDED DECEMBER 31, 2008, 2009, AND 2010
(In thousands except share and per share data)
| 2008 | 2009 | 2010 | ||||||||||
| REVENUE |
$ | 52,571 | $ | 60,798 | $ | 66,232 | ||||||
| COSTS AND OPERATING EXPENSES: |
||||||||||||
| Cost of revenue (exclusive of depreciation shown separately below) |
28,575 | 34,074 | 36,703 | |||||||||
| Research and development (exclusive of depreciation shown separately below) |
12,783 | 13,627 | 18,494 | |||||||||
| Sales and marketing |
5,732 | 5,591 | 6,211 | |||||||||
| General and administrative (exclusive of depreciation shown separately below) |
4,997 | 4,966 | 5,656 | |||||||||
| Withdrawn initial public offering expenses |
3,405 | — | — | |||||||||
| Depreciation |
1,574 | 2,005 | 2,506 | |||||||||
| Other operating expenses |
1,121 | — | — | |||||||||
|
|
|
|
|
|
|
|||||||
| Total costs and operating expenses |
58,187 | 60,263 | 69,570 | |||||||||
|
|
|
|
|
|
|
|||||||
| INCOME (LOSS) FROM OPERATIONS |
(5,616 | ) | 535 | (3,338 | ) | |||||||
| OTHER INCOME (EXPENSE) |
156 | 69 | (2 | ) | ||||||||
| INTEREST EXPENSE |
(294 | ) | (285 | ) | (240 | ) | ||||||
|
|
|
|
|
|
|
|||||||
| INCOME (LOSS) BEFORE INCOME TAXES |
(5,754 | ) | 319 | (3,580 | ) | |||||||
| PROVISION FOR INCOME TAXES |
10 | 15 | 11 | |||||||||
|
|
|
|
|
|
|
|||||||
| NET INCOME (LOSS) |
(5,764 | ) | 304 | (3,591 | ) | |||||||
|
|
|
|
|
|
|
|||||||
| UNDISTRIBUTED EARNINGS ALLOCATED TO PREFERRED STOCKHOLDERS |
— | 279 | — | |||||||||
|
|
|
|
|
|
|
|||||||
| NET INCOME (LOSS) ATTRIBUTABLE TO COMMON STOCKHOLDERS |
$ | (5,764 | ) | $ | 25 | $ | (3,591 | ) | ||||
|
|
|
|
|
|
|
|||||||
| NET INCOME (LOSS) PER SHARE ATTRIBUTABLE TO COMMON STOCKHOLDERS: |
||||||||||||
| Basic |
$ | (1.70 | ) | $ | 0.01 | $ | (0.96 | ) | ||||
|
|
|
|
|
|
|
|||||||
| Diluted |
$ | (1.70 | ) | $ | 0.01 | $ | (0.96 | ) | ||||
|
|
|
|
|
|
|
|||||||
| WEIGHTED AVERAGE SHARES USED TO COMPUTE NET INCOME (LOSS) PER SHARE ATTRIBUTABLE TO COMMON STOCKHOLDERS: |
||||||||||||
| Basic |
3,380,917 | 3,628,058 | 3,730,588 | |||||||||
|
|
|
|
|
|
|
|||||||
| Diluted |
3,380,917 | 44,586,142 | 3,730,588 | |||||||||
|
|
|
|
|
|
|
|||||||
| PRO FORMA NET LOSS PER SHARE ATTRIBUTABLE TO COMMON STOCKHOLDERS |
$ | (0.09 | ) | |||||||||
|
|
|
|||||||||||
| PRO FORMA WEIGHTED AVERAGE SHARES USED TO COMPUTE NET LOSS PER SHARE ATTRIBUTABLE TO COMMON STOCKHOLDERS |
38,520,865 | |||||||||||
|
|
|
|||||||||||
The accompanying notes are an integral part of these financial statements.
F-4
Table of Contents
STATEMENTS OF STOCKHOLDERS’ EQUITY
FOR THE YEARS ENDED DECEMBER 31, 2008, 2009, AND 2010
(In thousands except for share data)
| Treasury Stock | Series A | Series A-1 | Series B | Series C | Additional Paid-In Capital |
Accumulated Deficit |
||||||||||||||||||||||||||||||||||||||||||||||||||||||
| Common Stock | (Common) | Preferred Stock | Preferred Stock | Preferred Stock | Preferred Stock | |||||||||||||||||||||||||||||||||||||||||||||||||||||||
| Shares | Amount | Shares | Amount | Shares | Amount | Shares | Amount | Shares | Amount | Shares | Amount | Total | ||||||||||||||||||||||||||||||||||||||||||||||||
| BALANCE—January 1, 2008 |
3,182,547 | $ | 32 | — | $ | — | 5,548,508 | $ | 5,077 | 570,344 | $ | 730 | 2,737,500 | $ | 5,401 | 2,740,407 | $ | 17,224 | $ | 41,745 | $ | (53,034 | ) | $ | 17,175 | |||||||||||||||||||||||||||||||||||
| Exercise of common stock options |
144,872 | 2 | 26 | 28 | ||||||||||||||||||||||||||||||||||||||||||||||||||||||||
| Stock-based compensation expense |
668 | 668 | ||||||||||||||||||||||||||||||||||||||||||||||||||||||||||
| Vesting of restricted stock |
225,000 | 2 | 102 | 104 | ||||||||||||||||||||||||||||||||||||||||||||||||||||||||
| Net loss |
(5,764 | ) | (5,764 | ) | ||||||||||||||||||||||||||||||||||||||||||||||||||||||||
|
|
|
|
|
|
|
|
|
|
|
|
|
|
|
|
|
|
|
|
|
|
|
|
|
|
|
|
|
|
|
|||||||||||||||||||||||||||||||
| BALANCE—December 31, 2008 |
3,552,419 | 36 | — | — | 5,548,508 | 5,077 | 570,344 | 730 | 2,737,500 | 5,401 | 2,740,407 | 17,224 | 42,541 | (58,798 | ) | 12,211 | ||||||||||||||||||||||||||||||||||||||||||||
| Exercise of common stock options |
117,474 | 1 | 4 | 5 | ||||||||||||||||||||||||||||||||||||||||||||||||||||||||
| Stock-based compensation expense |
901 | 901 | ||||||||||||||||||||||||||||||||||||||||||||||||||||||||||
| Repurchase of common shares |
(489,000 | ) | (368 | ) | (368 | ) | ||||||||||||||||||||||||||||||||||||||||||||||||||||||
| Net income |
304 | 304 | ||||||||||||||||||||||||||||||||||||||||||||||||||||||||||
|
|
|
|
|
|
|
|
|
|
|
|
|
|
|
|
|
|
|
|
|
|
|
|
|
|
|
|
|
|
|
|||||||||||||||||||||||||||||||
| BALANCE—December 31, 2009 |
3,669,893 | 37 | (489,000 | ) | (368 | ) | 5,548,508 | 5,077 | 570,344 | 730 | 2,737,500 | 5,401 | 2,740,407 | 17,224 | 43,446 | (58,494 | ) | 13,053 | ||||||||||||||||||||||||||||||||||||||||||
| Exercise of common stock options |
138,415 | 1 | 26 | 27 | ||||||||||||||||||||||||||||||||||||||||||||||||||||||||
| Stock-based compensation expense |
868 | 868 | ||||||||||||||||||||||||||||||||||||||||||||||||||||||||||
| Repurchase of common shares |
(150,000 | ) | (201 | ) | (201 | ) | ||||||||||||||||||||||||||||||||||||||||||||||||||||||
| Net loss |
(3,591 | ) | (3,591 | ) | ||||||||||||||||||||||||||||||||||||||||||||||||||||||||
|
|
|
|
|
|
|
|
|
|
|
|
|
|
|
|
|
|
|
|
|
|
|
|
|
|
|
|
|
|
|
|||||||||||||||||||||||||||||||
| BALANCE—December 31, 2010 |
3,808,308 | $ | 38 | (639,000 | ) | $ | (569 | ) | 5,548,508 | $ | 5,077 | 570,344 | $ | 730 | 2,737,500 | $ | 5,401 | 2,740,407 | $ | 17,224 | $ | 44,340 | $ | (62,085 | ) | $ | 10,156 | |||||||||||||||||||||||||||||||||
|
|
|
|
|
|
|
|
|
|
|
|
|
|
|
|
|
|
|
|
|
|
|
|
|
|
|
|
|
|
|
|||||||||||||||||||||||||||||||
The accompanying notes are an integral part of these financial statements.
F-5
Table of Contents
SYNACOR, INC.
FOR THE YEARS ENDED DECEMBER 31, 2008, 2009, AND 2010
(In thousands)
| 2008 | 2009 | 2010 | ||||||||||
| CASH FLOWS FROM OPERATING ACTIVITIES: |
||||||||||||
| Net income (loss) |
$ | (5,764 | ) | $ | 304 | $ | (3,591 | ) | ||||
| Adjustments to reconcile net income (loss) to net cash provided by (used in) operating activities: |
||||||||||||
| Depreciation |
1,574 | 2,005 | 2,506 | |||||||||
| Accelerated depreciation on data center equipment (Note 12) |
424 | — | — | |||||||||
| Stock-based compensation expense |
668 | 901 | 868 | |||||||||
| Bad debt write off |
— | 287 | — | |||||||||
| Write-off of capitalized initial public offering costs |
3,405 | — | — | |||||||||
| Loss on disposal of property and equipment |
75 | 116 | 5 | |||||||||
| Change in assets and liabilities: |
||||||||||||
| Accounts receivable, net |
(1,029 | ) | (898 | ) | (1,881 | ) | ||||||
| Prepaid expenses and other current assets |
589 | 855 | (484 | ) | ||||||||
| Other long-term assets |
1,133 | 293 | (121 | ) | ||||||||
| Accounts payable |
(658 | ) | 2,164 | 1,081 | ||||||||
| Accrued expenses and other current liabilities |
(361 | ) | (1,076 | ) | 444 | |||||||
| Other long-term liabilities |
(179 | ) | (462 | ) | (160 | ) | ||||||
|
|
|
|
|
|
|
|||||||
| Net cash (used in) provided by operating activities |
(123 | ) | 4,489 | (1,333 | ) | |||||||
|
|
|
|
|
|
|
|||||||
| CASH FLOWS FROM INVESTING ACTIVITIES—Purchases of property and equipment |
(667 | ) | (828 | ) | (1,558 | ) | ||||||
|
|
|
|
|
|
|
|||||||
| CASH FLOWS FROM FINANCING ACTIVITIES: |
||||||||||||
| Borrowings on bank financing |
— | 412 | 588 | |||||||||
| Repayment on bank financing |
— | — | (250 | ) | ||||||||
| Repayments on capital lease obligations |
(1,480 | ) | (2,078 | ) | (2,323 | ) | ||||||
| Proceeds from exercise of common stock options |
28 | 5 | 27 | |||||||||
| Purchase of treasury stock |
— | (368 | ) | (201 | ) | |||||||
|
|
|
|
|
|
|
|||||||
| Net cash used in financing activities |
(1,452 | ) | (2,029 | ) | (2,159 | ) | ||||||
|
|
|
|
|
|
|
|||||||
| NET INCREASE (DECREASE) IN CASH AND CASH EQUIVALENTS |
(2,242 | ) | 1,632 | (5,050 | ) | |||||||
| CASH AND CASH EQUIVALENTS—Beginning of year |
11,072 | 8,830 | 10,462 | |||||||||
|
|
|
|
|
|
|
|||||||
| CASH AND CASH EQUIVALENTS—End of year |
$ | 8,830 | $ | 10,462 | $ | 5,412 | ||||||
|
|
|
|
|
|
|
|||||||
| SUPPLEMENTAL DISCLOSURES OF CASH FLOW INFORMATION: |
||||||||||||
| Cash paid for interest |
$ | 294 | $ | 285 | $ | 247 | ||||||
|
|
|
|
|
|
|
|||||||
| Non cash financing and investing activity—property and equipment acquired under capital lease obligations and bank financing |
$ | 4,753 | $ | 160 | $ | 1,840 | ||||||
|
|
|
|
|
|
|
|||||||
The accompanying notes are an integral part of these financial statements.
F-6
Table of Contents
NOTES TO THE FINANCIAL STATEMENTS
AS OF DECEMBER 31, 2009, AND 2010, AND
FOR THE YEARS ENDED DECEMBER 31, 2008, 2009, AND 2010
(In thousands except for share and per share data)
1. The Company and Summary of Significant Accounting Policies
Synacor, Inc. (the “Company”) is a leading provider of authentication and aggregation solutions for delivery of online content and services. The Company delivers solutions as a set of services through its hosted and managed platform, enabling cable and telecom service providers and consumer electronics manufacturers to provide the online content and services that their consumers increasingly demand. The Company’s platform allows its customers to package a wide array of online content and services with their high-speed Internet, communications, television and other offerings. Synacor’s customers offer the Company’s services under their own brands on Internet-enabled devices such as PCs, tablets, smartphones and connected TVs.
Cash and Cash Equivalents—The Company invests its excess cash in money market funds. All investments with an original maturity of three months or less are considered cash equivalents. The Company has not experienced any loss in fair value on these investments.
Accounts Receivable—The Company records accounts receivable at the invoiced amount and does not charge interest on past due invoices. An allowance for doubtful accounts is maintained to reserve for potentially uncollectible accounts receivable. The Company reviews its accounts receivable from customers which are past due to identify specific accounts with known disputes or collectability issues. In determining the amount of the reserve, the Company makes judgments about the creditworthiness of customers based on ongoing credit evaluations.
Property and Equipment—Property and equipment are stated at cost, less accumulated depreciation. Depreciation is computed using the straight-line method over the estimated useful lives of the assets as follows:
| Leasehold improvements |
3–10 years | |
| Computer hardware |
5 years | |
| Computer software |
3 years | |
| Furniture and fixtures |
7 years | |
| Other |
3–5 years |
Leasehold improvements are amortized over the shorter of the lease term or the estimated useful life of the assets.
Long-Lived Assets—The Company reviews the carrying value of its long-lived assets for impairment whenever events or changes in circumstances indicate that the carrying value of these assets may not be recoverable. For purposes of evaluating and measuring impairment, the Company groups a long-lived asset or assets with other assets and liabilities at the lowest level for which identifiable cash flows are largely independent of the cash flows of other assets and liabilities. Recoverability of assets to be held and used is measured by a comparison of the carrying amount of the assets to future undiscounted net cash flows expected to be generated by the assets. If such assets are considered to be impaired, the impairment to be recognized is measured as the amount by which the carrying amount of the assets exceeds the fair value of the assets. There has been no material adjustments to long-lived assets in any of the years presented.
F-7
Table of Contents
NOTES TO THE FINANCIAL STATEMENTS (continued)
Revenue Recognition—The Company derives revenue from two categories: revenue generated from search and display advertising activities and subscriber-based revenue, each of which is described below. Search and display advertising is recorded on a gross basis, which includes the net amount received from Google under the Company’s agreement with Google. The following table shows the revenue in each category for the years ended December 31, 2008, 2009 and 2010 (in thousands):
| Year Ended December 31, | ||||||||||||
| 2008 | 2009 | 2010 | ||||||||||
| Search and display advertising |
$ | 32,212 | $ | 39,268 | $ | 45,859 | ||||||
| Subscriber-based |
20,359 | 21,530 | 20,373 | |||||||||
|
|
|
|
|
|
|
|||||||
| Total revenue |
$ | 52,571 | $ | 60,798 | $ | 66,232 | ||||||
|
|
|
|
|
|
|
|||||||
The Company uses Internet search and display advertising to generate revenue from the traffic on its customers’ websites.
| • | In the case of search advertising, the Company has a revenue-sharing relationship with Google, pursuant to which it includes a Google-branded search tool on its customers’ websites. When a consumer makes a search query using this tool, the Company delivers the query to Google and they return search results to consumers that include advertiser-sponsored links. If the consumer clicks on a sponsored link, Google receives payment from the sponsor of that link and shares a portion of that payment with the Company, which in turn is shared with the applicable customer. The net payment received from Google is recognized as revenue. |
| • | Display advertising revenue is generated when consumers view or click on a text, graphic, or video advertisement that was delivered on a Synacor-operated website. Advertising inventory is filled with advertisements sourced by the Company’s direct salesforce, independent advertising sales representatives, and also advertising network partners. Display advertising revenue is calculated on a cost per impression basis, which means the advertiser pays based on the number of times its advertisements appear, or a cost per action basis, which means that an advertiser pays when a consumer performs an action after engaging one of its advertisements. Historically, only a small percentage of display advertising has been calculated on a cost per action basis. |
Subscriber-based revenue is defined as subscription fees and other fees that the Company receives from customers for the use of its proprietary technology platform and the use of, or access to, e-mail, security, games and other value added services and paid content. Monthly subscriber levels typically form the basis for calculating and generating subscriber-based revenue. They are generally determined by multiplying a per-subscriber per-month fee by the number of subscribers using the particular services being offered or consumed. In other cases, the fee is fixed. Revenue is recognized from customers as the service is delivered.
Search and display advertising and subscriber-based revenue are recognized when the following criteria are met: persuasive evidence of an arrangement exists; delivery has occurred; the selling price is fixed or determinable; and collectability is reasonably assured.
The Company evaluates its relationship between search and display advertising partners and customers in accordance with Financial Accounting Standards Board (“FASB”) Accounting Standards Codification (“ASC”) 605-45, Principal Agent Considerations. The Company has determined that the revenue derived from
F-8
Table of Contents
NOTES TO THE FINANCIAL STATEMENTS (continued)
traffic supplied by its customers is reported on a gross basis because Synacor is the primary obligor (the Company is responsible to its customers for fulfilling search and display advertising services and value added and other services), is involved in the service specifications, performs part of the service, has discretion in supplier selection, has latitude in establishing price and bears credit risk.
In October 2009, the FASB amended the accounting standard for multiple deliverable revenue arrangements, which provided updated guidance on whether multiple deliverables exist, how deliverables in an arrangement should be separated, and how consideration should be allocated. This standard eliminates the use of the residual method and will require arrangement consideration to be allocated based on the relative selling price for each deliverable. The selling price for each arrangement deliverable can be established based on vendor specific objective evidence (“VSOE”) or third-party evidence (“TPE”) if VSOE is not available. The new standard provides additional flexibility to utilize an estimate of selling price (“ESP”) if neither VSOE nor TPE is available.
The Company elected to early adopt this accounting standard on January 1, 2010 on a prospective basis for applicable transactions originating or materially modified after December 31, 2009. The adoption of this standard did not have a material impact on the Company’s financial position, cash flows, or results of operations for the year ended December 31, 2010.
Cost of Revenue—Cost of revenue consists of revenue sharing, content acquisition costs and co-location facility costs. Revenue sharing consists of amounts accrued and paid to customers for the traffic on their websites resulting in the generation of search and display advertising revenue. The revenue-sharing agreements with customers are primarily variable payments based on a percentage of the search and display advertising revenue. Content-acquisition agreements may be based on a fixed payment schedule, on the number of subscribers per month, or a combination of both. Fixed-payment agreements are expensed over the term defined in the agreement. Agreements based on the number of subscribers are expensed on a monthly basis. Co-location facility costs consist of rent and operating costs for the Company’s data center facilities.
Concentrations of Risk—As of December 31, 2009 and 2010, and for the years ended December 31, 2008, 2009, and 2010 the Company had concentrations equal to or exceeding 10% of the Company’s accounts receivable and revenue as follows:
| Accounts Receivable | Revenue | |||||||||||||||||||
| 2009 | 2010 | 2008 | 2009 | 2010 | ||||||||||||||||
| |
33 | % | 39 | % | 48 | % | 45 | % | 49 | % | ||||||||||
| Platform Customer A (1) |
25 | 22 | 20 | 18 | 14 | |||||||||||||||
Note:
| (1) | For this purpose revenue includes only revenue earned directly by the Company from this platform customer for subscriber-based services and excludes revenue attributable to search and display advertising on the customer’s website(s). |
For the years ended December 31, 2008, 2009 and 2010, the following platform customers received revenue-share payments equal to or exceeding 10% of the Company’s cost of revenue. The costs represent revenue share paid to them for their supply of Internet traffic on our customer branded platforms.
| Cost of Revenue | ||||||||||||
| 2008 | 2009 | 2010 | ||||||||||
| Platform Customer A |
18 | % | 18 | % | 21 | % | ||||||
| Platform Customer B |
24 | 26 | 25 | |||||||||
Financial instruments that potentially subject the Company to significant concentrations of credit risk consist principally of cash and cash equivalents. The Company places its cash primarily in checking and money market accounts with high credit quality financial institutions, which, at times, have exceeded federally insured limits. At December 31, 2010, the Company had cash of $5,053 at financial institutions in excess of the federally insured limits.
F-9
Table of Contents
NOTES TO THE FINANCIAL STATEMENTS (continued)
Research and Development—Research and development expenses consist primarily of compensation related expenses incurred for the development of, enhancements to, and maintenance and operation of the Company’s technology platform and related infrastructures.
Software Development Costs—Costs incurred during the preliminary project stage for software programs are expensed as incurred. External and internal costs incurred during the application development stage of new software development as well as for upgrades and enhancements for software programs that result in additional functionality are capitalized. In the years presented, the Company has not incurred significant external or internal costs related to the application development stage. Internal and external training and maintenance costs are expensed as incurred.
Sales and Marketing—Sales and marketing expenses consist primarily of compensation related expenses to the Company’s direct sales and marketing personnel, as well as costs related to advertising, industry conferences, promotional materials, and other sales and marketing programs. Advertising cost is expensed as incurred.
General and Administrative—General and administrative expenses consist primarily of compensation related expenses for executive management, finance, accounting, human resources, and other administrative functions.
Earnings Per Share—Basic earnings per share, or EPS, is calculated in accordance with FASB ASC Topic 260, Earnings per Share, and is calculated using the weighted average number of common shares outstanding during each period. Contingently issuable or repurchasable shares are not used in the calculation of basic earnings per share until the contingency is resolved.
Diluted EPS assumes the conversion, exercise or issuance of all potential common stock equivalents unless the effect is to reduce a loss or increase the income per share. For purposes of this calculation, convertible preferred stock and options are considered to be potential common shares and are only included in the calculation of diluted earnings per share when their effect is dilutive.
The shares used to compute basic and diluted net income per share represent the weighted-average common shares outstanding. The Company’s preferred stockholders have the right to participate with common stockholders in dividends and unallocated income. Net losses are not allocated to the preferred stockholders. Therefore, when applicable, basic and diluted EPS are computed using the two-class method, under which the Company’s undistributed earnings are allocated amongst the common and preferred stockholders.
Unaudited Pro Forma Stockholder’s Equity and Pro Forma Net Loss Per Share—If an initial public offering results in a post-offering valuation of the Company’s common stock on a fully diluted basis of at least $150,000 and the proceeds are not less than $25,000, all 11,596,759 shares of convertible preferred stock will be mandatorily converted into shares of common stock on a 3:1 ratio, resulting in a total of 34,790,277 common shares. The unaudited pro forma stockholders’ equity as of December 31, 2010 and the unaudited pro forma net loss per share data for the year ended December 31, 2010 have been prepared assuming that the conversion of preferred stock occurred on January 1, 2010. Refer to Note 10 Net Income (Loss) Per Common Share Data, for disclosure of the calculation of unaudited pro forma net loss per share.
Stock-Based Compensation—The Company records compensation costs related to stock-based awards in accordance with FASB ASC 718, Compensation—Stock Compensation. Under the fair value recognition provisions of ASC 718, the Company measures stock-based compensation cost at the grant date based on the estimated fair value of the award. Compensation cost is recognized ratably over the requisite service period of the award. The Company utilizes the Black-Scholes option-pricing model to estimate the fair value of stock options
F-10
Table of Contents
NOTES TO THE FINANCIAL STATEMENTS (continued)
granted. The amount of stock-based compensation expense recognized during a period is based on the portion of the awards that are ultimately expected to vest. The Company estimates prevesting forfeitures at the time of grant by analyzing historical data and revises those estimates in subsequent periods if actual forfeitures differ from those estimates. The total expense recognized over the vesting period will only be for those awards that ultimately vest. See Note 9 for additional information on stock-based compensation.
Income Taxes—Deferred income tax assets and liabilities are determined based on temporary differences between the financial statement and income tax bases of assets and liabilities and net operating loss and credit carryforwards using enacted income tax rates in effect for the year in which the differences are expected to reverse. A valuation allowance is established to the extent necessary to reduce deferred income tax assets to amounts that more likely than not will be realized. The Company has recorded a valuation allowance against all of its net deferred tax assets due to uncertainty of their ultimate realization.
The Company accounts for uncertain tax positions using a more-likely-than-not recognition threshold based on the technical merits of the tax position taken. Tax benefits that meet the more-likely-than-not recognition threshold should be measured as the largest amount of tax benefits, determined on a cumulative probability basis, which is more likely than not to be realized upon ultimate settlement in the financial statements. It is the Company’s policy to recognize interest and penalties related to income tax matters in income tax expense. As of December 31, 2010, there was no accrued interest or penalties related to uncertain tax positions.
Accounting Estimates—The preparation of financial statements in conformity with Generally Accepted Accounting Principles (“GAAP”) in the U.S. requires management to make estimates, judgments and assumptions that affect the amounts reported and disclosed in the financial statements and the accompanying notes. We base our estimates on historical experience and on various other assumptions that are believed to be reasonable, the results of which form the basis for making judgments about the carrying values of assets and liabilities. Such estimates primarily relate to unsettled transactions and events as of the date of the financial statements. Accordingly, actual results may differ from estimated amounts.
Fair Value of Financial Instruments—The carrying amounts of the Company’s capital leases and bank financing approximate fair value of these obligations based upon management’s best estimates of interest rates that would be available for similar debt obligations at December 31, 2010.
Fair Value Measurements—The provisions of ASC 820, Fair Value Measurements and Disclosures, establishes a framework for measuring the fair value in accounting principles generally accepted in the U.S. and establishes a hierarchy that categorizes and prioritizes the sources to be used to estimate fair value as follows:
Level 1—Level 1 inputs are defined as observable inputs such as quoted prices in active markets.
Level 2—Level 2 inputs include quoted prices for similar assets and liabilities in active markets, quoted prices for identical or similar assets or liabilities in markets that are not active, inputs other than quoted prices that are observable for the asset or liability (interest rates, yield curves, etc.), and inputs that are derived principally from or corroborated by observable market data by correlation or other means (market corroborated inputs).
Level 3—Level 3 inputs are unobservable inputs that reflect the Company’s determination of assumptions that market participants would use in pricing the asset or liability. These inputs are developed based on the best information available, including the Company’s own data.
In accordance with ASC 820, included within the Company’s cash and cash equivalents as of December 31, 2010 are $794 of money market funds that are classified as Level 1 financial assets. The fair value of cash and cash
F-11
Table of Contents
NOTES TO THE FINANCIAL STATEMENTS (continued)
equivalents are primarily composed of the Company’s investments in money market instruments with original maturities of three months or less. The Company’s cash and cash equivalent balances excluded above are composed of cash, certificates of deposits with original maturities of one month or less, and overnight investments.
Effective January 1, 2010, the Company adopted new authoritative guidance on fair value measurements and disclosures. The new guidance requires additional disclosures regarding fair value measurements, amends disclosures about post-retirement benefit plan assets, and provides clarification regarding the level of disaggregation of fair value disclosures by investment class. This guidance is effective for interim and annual reporting periods beginning after December 15, 2009, except for certain Level 3 activity disclosure requirements that will be effective for reporting periods beginning after December 15, 2010. Accordingly, the Company adopted this new guidance beginning January 1, 2010, except for the additional Level 3 requirements, which were adopted in 2011. Level 3 assets and liabilities are those whose fair value inputs are unobservable and reflect management’s best estimate of what market participants would use in pricing the asset or liability at the measurement date. The adoption of this guidance did not have a material impact on the Company’s financial statements.
Subsequent Events—The Company has evaluated subsequent events from the end of the most recent fiscal year through March 29, 2011 and November 18, 2011, the dates the financial statements were available to be issued.
2. Property and Equipment—net
As of December 31, property and equipment, net consisted of the following (in thousands):
| 2009 | 2010 | |||||||
| Computer equipment (1) |
$ | 8,333 | $ | 10,622 | ||||
| Computer software |
977 | 1,004 | ||||||
| Furniture and fixtures |
854 | 1,040 | ||||||
| Leasehold improvements |
565 | 678 | ||||||
| Other |
141 | 269 | ||||||
|
|
|
|
|
|||||
| 10,870 | 13,613 | |||||||
| Less accumulated depreciation (2) |
(4,239 | ) | (6,503 | ) | ||||
|
|
|
|
|
|||||
| Total property and equipment—net |
$ | 6,631 | $ | 7,110 | ||||
|
|
|
|
|
|||||
Notes:
| (1) | Includes equipment under capital lease obligations of approximately $6,121 and $6,578 as of December 31, 2009 and 2010, respectively. |
| (2) | Includes $2,144 and $3,381 of accumulated depreciation of equipment under capital leases as of December 31, 2009 and 2010, respectively. |
F-12
Table of Contents
NOTES TO THE FINANCIAL STATEMENTS (continued)
3. Accrued Expenses and Other Current Liabilities
As of December 31, accrued expenses and other current liabilities consisted of the following (in thousands):
| 2009 | 2010 | |||||||
| Accrued compensation |
$ | 1,638 | $ | 1,988 | ||||
| Accrued content fees |
217 | 314 | ||||||
| Unearned revenue on contracts |
605 | 627 | ||||||
| Other |
368 | 343 | ||||||
|
|
|
|
|
|||||
| Total |
$ | 2,828 | $ | 3,272 | ||||
|
|
|
|
|
|||||
4. Bank Financing
During 2009, the Company amended its existing loan and security agreement, pursuant to which the Company can borrow $1,000 under an equipment line available to be drawn upon for a period of 12 months from agreement execution. Additionally the Company can borrow under a revolving credit line of $5,000 for an extended term of 24 months from agreement execution. Borrowings under the revolving credit line can take place until June 2011. Any borrowings under the equipment line and the revolving credit line accrue interest at the greater of 4% or prime rate plus margins of 0.50% and 0.25%, respectively, and must be repaid by June 2012 and June 2011, respectively. Both the equipment line and the revolving credit line agreement contain provisions that allow the lender to accelerate repayment of the borrowing upon a material adverse change as defined in the agreement. The equipment line and the revolving credit line agreement contain certain financial performance and reporting covenants and at December 31, 2010 and 2009 the Company was in compliance with all of their covenants.
There were no borrowings on the revolving credit line as of December 31, 2010 and 2009. During 2009, the Company borrowed $412 of the equipment line, of which $103 was current and $309 was long-term at December 31, 2009. During 2010, the Company borrowed the remaining $588 balance of the equipment line. As of December 31, 2010, the Company’s balance of the equipment line is $750, of which $500 is current and $250 is long-term.
5. Income Taxes
The provision for income taxes for the years ended December 31, 2008, 2009, and 2010, comprised the following (in thousands):
| 2008 | 2009 | 2010 | ||||||||||
| Current: |
||||||||||||
| United States Federal |
$ | — | $ | 9 | $ | 2 | ||||||
| State |
— | — | — | |||||||||
| Foreign |
10 | 6 | 9 | |||||||||
|
|
|
|
|
|
|
|||||||
| Total current provision for income taxes |
10 | 15 | 11 | |||||||||
|
|
|
|
|
|
|
|||||||
| Deferred: |
||||||||||||
| United States Federal |
(1,719 | ) | 186 | (786 | ) | |||||||
| State |
(396 | ) | 35 | (158 | ) | |||||||
| Foreign |
— | — | — | |||||||||
|
|
|
|
|
|
|
|||||||
| Total deferred provision (benefit) for income taxes |
(2,115 | ) | 221 | (944 | ) | |||||||
| Less increase (decrease) in valuation allowance |
2,115 | (221 | ) | 944 | ||||||||
|
|
|
|
|
|
|
|||||||
| Total provision for income taxes |
$ | 10 | $ | 15 | $ | 11 | ||||||
|
|
|
|
|
|
|
|||||||
F-13
Table of Contents
NOTES TO THE FINANCIAL STATEMENTS (continued)
The income tax effects of significant temporary differences and carryforwards that give rise to deferred income tax assets and liabilities as of December 31, 2009 and 2010 are as follows (in thousands):
| 2009 | 2010 | |||||||
| Deferred income tax assets: |
||||||||
| Stock and other compensation expense |
$ | 171 | $ | 334 | ||||
| Net operating losses |
7,692 | 8,638 | ||||||
| Credit carryforwards |
135 | 136 | ||||||
| Other |
362 | 94 | ||||||
|
|
|
|
|
|||||
| Gross deferred tax assets |
8,360 | 9,202 | ||||||
| Valuation allowance |
(7,506 | ) | (8,450 | ) | ||||
|
|
|
|
|
|||||
| Net deferred tax assets |
854 | 752 | ||||||
|
|
|
|
|
|||||
| Deferred income tax liabilities: |
||||||||
| Fixed assets |
(849 | ) | (497 | ) | ||||
| Other |
(5 | ) | (11 | ) | ||||
|
|
|
|
|
|||||
| Gross deferred tax liabilities |
(854 | ) | (508 | ) | ||||
|
|
|
|
|
|||||
| Subtotal |
— | 244 | ||||||
| Less unrecognized tax benefit liability |
— | (244 | ) | |||||
|
|
|
|
|
|||||
| Net deferred tax assets |
$ | — | $ | — | ||||
|
|
|
|
|
|||||
A reconciliation of the beginning and ending amount of unrecognized tax benefits is as follows (in thousands):
| 2008 | 2009 | 2010 | ||||||||||
| Balance—beginning of year |
$ | 557 | $ | 41 | $ | — | ||||||
| Additions for tax positions of prior years |
— | — | 244 | |||||||||
| Reductions for tax positions of prior years |
(516 | ) | (41 | ) | — | |||||||
|
|
|
|
|
|
|
|||||||
| Balance—end of year |
$ | 41 | $ | — | $ | 244 | ||||||
|
|
|
|
|
|
|
|||||||
The tax positions at the end of 2010 were primarily related to changes in tax depreciation methods related to prior year fixed assets.
Income tax expense for the years ended December 2008, 2009, and 2010, differs from the expected income tax (benefit) expense calculated using the statutory U.S. Federal income tax rate as follows:
| 2008 | 2009 | 2010 | ||||||||||||||||||||||
| Federal income tax (benefit) expense at statutory rate |
$ | (1,956 | ) | 34 | % | $ | 105 | 34 | % | $ | (1,217 | ) | 34 | % | ||||||||||
| State and local taxes—net of federal benefit |
(357 | ) | 6 | 99 | 32 | (158 | ) | 4 | ||||||||||||||||
| Expiration of state NOLs |
— | — | — | — | 135 | (4 | ) | |||||||||||||||||
| Valuation allowance |
2,115 | (37 | ) | (221 | ) | (71 | ) | 944 | (26 | ) | ||||||||||||||
| Permanent differences |
229 | (3 | ) | 336 | 108 | 256 | (7 | ) | ||||||||||||||||
| Uncertain tax position current activity |
(516 | ) | 8 | (41 | ) | (13 | ) | — | — | |||||||||||||||
| Other |
495 | (8 | ) | (263 | ) | (85 | ) | 51 | (1 | ) | ||||||||||||||
|
|
|
|
|
|
|
|
|
|
|
|
|
|||||||||||||
| Total |
$ | 10 | — | % | $ | 15 | 5 | % | $ | 11 | — | % | ||||||||||||
|
|
|
|
|
|
|
|
|
|
|
|
|
|||||||||||||
F-14
Table of Contents
NOTES TO THE FINANCIAL STATEMENTS (continued)
The Company had federal and state net operating loss carryforwards (“NOL”) of approximately $21,100 and $19,800, respectively, at December 31, 2010. The Company had federal and state NOL carryforwards of approximately $18,500 and $16,800, respectively, at December 31, 2009. The NOLs will begin to expire in 2018. Due to the uncertainty as to the Company’s ability to generate sufficient taxable income in the future and utilize the NOLs before they expire, the Company has recorded a valuation allowance to reduce the net deferred tax asset to zero. The Company’s ability to use the operating loss carryforwards to offset the future taxable income is subject to restrictions enacted in the United States Internal Revenue Code of 1986. These restrictions limit the future use of the operating loss carryforwards if certain ownership changes described in the Internal Revenue Code occur.
6. Information about Segment and Geographic Areas
The Company considers operating segments to be components of the Company in which separate financial information is available that is evaluated regularly by the Company’s chief operating decision maker in deciding how to allocate resources and in assessing performance. The chief operating decision maker for the Company is the Chief Executive Officer. The Chief Executive Officer reviews financial information presented on a total Company basis, accompanied by information about revenue by major service line for purposes of allocating resources and evaluating financial performance. The Company has one business activity and there are no segment managers who are held accountable for operations, operating results or plans for levels or components below the Company level. Accordingly, the Company has determined that it has a single reporting segment and operating unit structure of providing personalized Internet platforms and online entertainment services to high-speed Internet subscribers.
The following table sets forth revenue and long-lived tangible assets by geographic area:
| Years Ended December 31, | ||||||||||||
| 2008 | 2009 | 2010 | ||||||||||
| Revenue: |
||||||||||||
| United States |
$ | 51,210 | $ | 59,356 | $ | 65,180 | ||||||
| United Kingdom |
1,361 | 888 | 766 | |||||||||
| Netherlands |
— | 554 | 286 | |||||||||
|
|
|
|
|
|
|
|||||||
| Total revenue |
$ | 52,571 | $ | 60,798 | $ | 66,232 | ||||||
|
|
|
|
|
|
|
|||||||
| Years Ended December 31, |
||||||||||||
| 2009 | 2010 | |||||||||||
| Long-lived tangible assets: |
||||||||||||
| United States |
|
$ | 5,978 | $ | 6,236 | |||||||
| Netherlands |
|
653 | 874 | |||||||||
|
|
|
|
|
|||||||||
| Total long-lived tangible assets |
|
$ | 6,631 | $ | 7,110 | |||||||
|
|
|
|
|
|||||||||
7. Commitments and Contingencies
Lease Commitments—The Company leases office space and data center space under operating lease agreements and certain equipment under capital lease agreements with interest rates ranging from 5% to 8%.
Rent expense for operating leases was approximately $944, $995, and $1,048 for 2008, 2009, and 2010, respectively.
F-15
Table of Contents
NOTES TO THE FINANCIAL STATEMENTS (continued)
Lease commitments as of December 31, 2010 can be summarized as follows (in thousands):
| Years Ending December 31 |
Operating Lease Commitments |
|||
| 2011 |
$ | 1,095 | ||
| 2012 |
959 | |||
| 2013 |
594 | |||
| 2014 |
472 | |||
| 2015 |
472 | |||
| Due after 5 years |
118 | |||
|
|
|
|||
| Total lease commitments |
$ | 3,710 | ||
|
|
|
|||
| Years Ending December 31 |
Capital Lease Commitments |
|||
| 2011 |
$ | 1,563 | ||
| 2012 |
665 | |||
| 2013 |
330 | |||
|
|
|
|||
| Gross lease commitment |
2,558 | |||
| Less interest |
(127 | ) | ||
|
|
|
|||
| Net lease commitments |
$ | 2,431 | ||
|
|
|
|||
Contract Commitments—The Company is obligated to make payments under various contracts with vendors and other business partners, principally for revenue-share and content arrangements. Contract commitments as of December 31, 2010 can be summarized as follows (in thousands):
| Years Ending December 31 |
Contract Commitments |
|||
| 2011 |
$ | 5,422 | ||
| 2012 |
3,451 | |||
| 2013 |
3,275 | |||
| 2014 |
275 | |||
|
|
|
|||
| Total contract commitments |
$ | 12,423 | ||
|
|
|
|||
Litigation—From time to time, the Company is a party to legal actions. In the opinion of management, the outcome of these matters will not have a material impact on the financial statements of the Company.
8. Equity
Common Stock—On July 28, 2008, the Company’s board of directors and stockholders approved the First Certificate of Amendment to the Fourth Amended and Restated Certificate of Incorporation. The total number of common shares that the Company is authorized to issue is 60 million with a par value of $0.01 per share.
Restricted Stock—On April 19, 2007, the Company completed a restricted stock sale of 540,000 shares of common stock to its chief financial officer pursuant to the terms of the related stock purchase agreement, which included a repurchase right held by the Company. The chief financial officer tendered cash of $250, or $0.46 per share, to the Company in return for the shares of restricted common stock. During 2008, 225,000 restricted shares were vested, and the chief financial officer tendered his resignation effective December 31, 2008. In 2009, the Company repurchased 315,000 unvested and 225,000 vested shares at a price of $0.46 per share.
F-16
Table of Contents
NOTES TO THE FINANCIAL STATEMENTS (continued)
Treasury Stock—In August of 2009, the Company repurchased 264,000 common shares from executives of the Company at $1.00 per share. In September of 2010, the Company repurchased 150,000 common shares from an executive of the Company at $1.34 per share.
Convertible Preferred Stock
Conversion—Each share of Series A, A-1, B, and C preferred stock is convertible at the option of the holder at any time into common stock. The conversion rate is the quotient obtained by dividing the original issue price of the Series A, A-1, B, or C by the conversion price. Subsequent to the First Certificate of Amendment to the Fourth Amended and Restated Certificate of Incorporation on July 31, 2008, the conversion price has been adjusted to effect a conversion of one preferred share into three common shares. The conversion price is subject to adjustment as set forth in the restated certificate of incorporation for certain dilutive issuances, splits, and combinations, as therein defined. Conversion is automatic upon either the consent of the holders or 66% of the outstanding shares of preferred stock or the effective date of a firm commitment underwritten public offering of the Company’s common stock in which the post-offering valuation on a fully diluted basis is at least $150 million and the proceeds are not less than $25 million.
Voting—Each share of A, A-1, B, and C preferred stock has voting rights, on an as-if-converted basis, identical to common stock and votes together as one class with the common stock.
Dividends—The holders of shares of Series C preferred stock shall be entitled to receive dividends, out of any assets legally available therefore, prior and in preference to any declaration or payment of any dividend on the Series A preferred stock, Series A-1 preferred stock, Series B preferred stock, and common stock of the Company. The holders of shares of Series B preferred stock shall be entitled to receive dividends, out of any assets legally available therefore, prior and in preference to any declaration or payment of any dividend on the Series A preferred stock, Series A-1 preferred stock, and common stock of the Company. The holders of shares of Series A preferred stock and Series A-1 preferred stock shall be entitled to receive dividends, on a pari passu basis, out of any assets legally available therefore, prior and in preference to any declaration or payment of any dividend on the common stock of the Company. Dividends are payable when, as, and if declared by the board of directors. Such dividends are not cumulative.
Redemption—The Series A, A-1, B and C preferred stock is not redeemable at the option of the holder.
Liquidation—In the event of any liquidation, dissolution, or winding down of the Company, either voluntary or involuntary, including a merger, acquisition, or sale of assets where the beneficial owners of the Company’s common stock and convertible preferred stock own less than 50% of the resulting voting power (“Liquidation Event”), the holders of shares of Series C preferred stock shall be entitled to receive, prior and in preference to any distribution of the proceeds of such Liquidation Event to the holders of Series A, A-1, and B preferred stock and common stock by reason of their ownership thereof, an amount equal to 100% per share of the original issue price for each share of Series C preferred stock then held by them, plus declared but unpaid dividends on such share. Upon completion of the distribution required to Series C stockholders, the holders of shares of Series B preferred stock shall be entitled to receive, prior and in preference to any distribution of the proceeds of such Liquidation Event to the holders of Series A and A-1 preferred stock and common stock by reason of their ownership thereof, an amount equal to 100% per share of the original issue price for each share of Series B preferred stock then held by them, plus declared but unpaid dividends on such share. Upon completion of the distribution required to Series B stockholders, the Series A and A-1 stockholders are entitled to receive 100% per share of the original issue price, plus any declared but unpaid dividends prior and in preference to any distribution to the common stockholders. Upon completion of the distribution required to Series B, A, and A-1 stockholders, the holders of common stock are entitled to receive an amount per share equal to declared but unpaid dividends. After payment of the above distributions, the remaining assets of the Company shall be
F-17
Table of Contents
NOTES TO THE FINANCIAL STATEMENTS (continued)
distributed to the common and Series C, B, A, and A-1 stockholders pro rata based on the number of common shares held by each (on an as-if-converted basis).
9. Stock-based Compensation
Stock Option Re-Pricings—In June 2009, the Company’s Board of Directors, with input from management, determined that the fair value of the Company’s common stock had declined to $1.26 per share based on an independent valuation performed for the Company. In connection with this decline, option grants totaling 2,217,694 options, during the period from July 31, 2007 through September 16, 2008 with an exercise price above $1.99 were amended to have an exercise price of $1.26. The vesting commencement date and the length of the vesting period for each of these grants were not altered.
In February 2008, the Company’s board of directors, with input from management, determined that the fair value of the Company’s common stock had declined to $2.00 per share based on an independent valuation performed for the Company. In connection with this decline, the board of directors approved the following:
Non-Executive Level Employees—All options grants during 2007 with exercise prices above $2.00 were amended to reflect an exercise price of $2.00. During the year ended December 31, 2007, the Company had granted 587,694 of stock options with per-share exercise prices of $2.47 that were re-priced. The vesting commencement date and the length of the vesting period for each of these grants were not changed.
Executive Level Employees—All executive level employees chose to re-price their 2007 option grants to a $2.00 exercise price and to reset their vesting commencement date to the re-pricing date. During the year ended December 31, 2007, the Company had granted 1,395,000 of stock options to executive-level employees with per-share exercise prices of $2.47 that were re-priced. No executive level employees chose to retain their original options at $2.47 with the original vesting commencement date.
These modifications resulted in additional employee stock-based compensation expense of $179 and $387 for the years ended December 31, 2008 and 2009, respectively, to be expensed over the remaining vesting period of these grants.
The Company recorded $668, $901, and $868 of stock-based compensation for the years ended December 31, 2008, 2009, and 2010, respectively. No income tax deduction is allowed for incentive stock options. Accordingly, no deferred income tax asset is recorded for the expense related to these options.
Stock Option Plans—The Company has adopted three stock option plans, which authorize the grant of up to 11,679,717 options to officers and other key employees to purchase the Company’s common stock, subject to the terms of the plans. The options generally vest ratably over four years. The options are generally exercisable after the date of grant, and typically expire 10 years from their respective grant dates or earlier if employment is terminated. In connection with the early exercise of stock options, the Company has the right, but not the obligation, to repurchase shares of common stock upon termination of the individual’s service to the Company at the amount equal to the lower of the original exercise price per share or the fair market value at the time the repurchase is exercised. During the years ended December 31, 2009 and 2010 there were no early exercises.
F-18
Table of Contents
NOTES TO THE FINANCIAL STATEMENTS (continued)
A summary of the status of options granted under all option plans is presented below:
| Number of Stock Options |
Weighted Average Exercise Price |
|||||||
| Outstanding—January 1, 2010 |
8,855,206 | $ | 0.62 | |||||
| Granted |
2,043,966 | 1.37 | ||||||
| Exercised |
(138,415 | ) | 0.21 | |||||
| Forfeited |
(969,461 | ) | 1.80 | |||||
|
|
|
|||||||
| Outstanding—December 31, 2010 |
9,791,296 | 0.67 | ||||||
|
|
|
|||||||
| Expected to vest—December 31, 2010 |
9,274,589 | 0.66 | ||||||
|
|
|
|||||||
| Vested and exercisable—December 31, 2010 |
7,361,452 | 0.46 | ||||||
|
|
|
|||||||
The weighted-average remaining contractual life of the options outstanding and expected to vest were 6.2, 5.4, and 5.2 years as of December 31, 2008, 2009, and 2010, respectively. The aggregate intrinsic value for outstanding, expected to vest, and vested and exercisable shares were $7,494, $7,268, and $7,234, respectively, as of December 31, 2010. The total intrinsic value of options exercised during the year ended December 31, 2010, was $170. The aggregate intrinsic value represents the total pre-tax intrinsic value (the difference between the Company’s estimated stock value and the exercise price, multiplied by the number of in-the-money stock options) had all stock option holders exercised their stock options on the balance sheet date. This amount will change based on the fair market value of the Company’s stock.
The Company determines the fair value of its stock-based awards on the date of grant using the Black-Scholes option-pricing model. The determination of fair value using the Black-Scholes model requires a number of complex and subjective variables. One key input into the model is the estimated fair value of the Company’s common stock on the date of grant.
Other key variables in the Black-Scholes option-pricing model include the expected volatility of the Company’s common stock price, the expected term of the award, the risk-free interest rate, and the expected dividend yield. The Company determined that, as a private company, it was not practicable to estimate the volatility of the Company’s stock price, based on the low frequency of price observations. Therefore, expected volatilities were based on a volatility factor computed based upon an external peer group analysis of publicly-traded companies in 2010. The expected term for options granted prior to January 1, 2006, is 10 years. For options granted subsequent to December 31, 2005, the expected term is 6.25 years. The expected term was estimated by using the actual contractual term of the awards and the length of time for the employees to exercise the awards. The risk-free interest rate was based on the implied yield available at the time the options were granted on U.S. Treasury zero coupon issues with a remaining term equal to the expected term of the option. The expected dividend yield is 0% based upon the Company’s historical practice of electing not to declare or pay cash dividends on its common stock. In addition, under ASC 718, the Company is required to estimate forfeitures of unvested awards when recognizing compensation expense. An 8% and 11% annual forfeiture rate was used for the stock-based compensation expense recorded during the year ended December 31, 2010 for executives and non executives, respectively.
In connection with the preparation of the Company’s financial statements for the year ended December 31, 2010, the Company engaged Anvil Advisors LLC (“Anvil”), an unrelated valuation specialist as defined under the American Institute of Certified Public Accountants Practice Guide, Valuation of Privately-Held Company Equity Securities Issued as Compensation, to assist Company management in estimating the fair value of its common stock in connection with options granted during that period. In valuation reports dated May 2010
F-19
Table of Contents
NOTES TO THE FINANCIAL STATEMENTS (continued)
and November 2010, Anvil retrospectively valued the Company’s common stock. Similar valuation techniques were used in estimating the fair value of the Company’s common stock in connection with options granted during 2008 and 2009.
In the 2008, 2009 and 2010 valuations, Anvil estimated the enterprise value of the Company on each applicable valuation date using a combination of the discounted future cash flow method, the market multiple method and the comparable transaction method and then computed a weighted average of the applicable combination based on the likelihood of an initial public offering. During the periods where an initial public offering was thought to be likely, the market multiple method was given greater weight. Subsequent to the withdrawal of a registration statement for an initial public offering in October 2008, the discounted cash flow method was given greater weight. In 2010, because the Company did not have sufficient profitability, the discounted future cash flow method was not used. Anvil then used the company security valuation method to allocate the enterprise value of the Company among its various classes of equity to derive a fully marketable value per share for the common stock. Anvil applied an appropriate discount for lack of marketability to this fully marketable value to arrive at the fair value per share of common stock.
The difference between the exercise price of the options and the Company’s estimate of the fair value has been factored into the compensation expense.
The following is a summary of the valuation dates and corresponding common stock fair values during 2010:
| Valuation Date |
Common Stock Fair Value Per Share |
|||
| March 31, 2010 |
$ | 1.34 | ||
| September 30, 2010 |
1.44 | |||
Assumptions for the 2008 and 2009 common stock valuations were based upon the Company’s circumstances and market conditions at the time of the valuations. The following is a description of the significant assumptions used in the valuations of the Company’s common stock during 2010:
March 31, 2010 Valuation—Market conditions continued to be poor from the December 31, 2009 valuation date through March 31, 2010. The probabilities of an initial public offering and a sale of the Company were 20% and 80%, respectively. The weightings given to the market multiple method and the comparable transaction method were 50% and 50%, respectively. The company-specific volatility was 70% and the lack-of-marketability discount was 20%.
September 30, 2010 Valuation—Market conditions continued to be unfavorable during the second quarter and just began to improve in the third quarter. The probabilities of an initial public offering and a sale of the Company remained at 20% and 80%, respectively. The weightings given to each method was 50%. The company-specific volatility was 70% and the lack-of-marketability discount was 20%.
F-20
Table of Contents
NOTES TO THE FINANCIAL STATEMENTS (continued)
For options granted during the years ended December 31, 2008 and 2009, the weighted-average fair value of the stock options granted, estimated on the date of the grant using the Black-Scholes option-pricing model, was $0.84 and $1.25 and used the following assumptions:
| 2008 |
2009 |
|||||||
| Expected life of options (in years) |
6.25 | 6.25 | ||||||
| Risk-free interest rate |
3.1 | % | 3.4 | % | ||||
| Expected volatility |
54 | 52 | ||||||
| Expected dividend yield |
— | — | ||||||
A summary of the option grants and assumptions used in the Black-Scholes option-pricing model to value the options during the year ended December 31, 2010, is as follows:
| Grant Date |
Options Granted |
Weighted- Average Fair Value |
Expected Life of Options (In years) |
Risk-Free Interest Rate |
Expected Volatility |
Expected Dividend Yield |
||||||||||||||||||
| February 25, 2010 |
265,750 | $ | 0.59 | 6.25 | 3.09 | % | 49 | % | — | % | ||||||||||||||
| May 12, 2010 |
198,966 | 0.74 | 6.25 | 2.97 | 55 | — | ||||||||||||||||||
| June 29, 2010 |
71,000 | 0.72 | 6.25 | 2.43 | 54 | — | ||||||||||||||||||
| August 10, 2010 |
381,750 | 0.71 | 6.25 | 2.14 | 54 | — | ||||||||||||||||||
| September 22, 2010 |
122,500 | 0.71 | 6.25 | 1.96 | 54 | — | ||||||||||||||||||
| November 18, 2010 |
981,000 | 0.76 | 6.25 | 2.20 | 53 | — | ||||||||||||||||||
| December 17, 2010 |
23,000 | 0.77 | 6.25 | 2.69 | 53 | — | ||||||||||||||||||
|
|
|
|||||||||||||||||||||||
| Total grants |
2,043,966 | |||||||||||||||||||||||
|
|
|
|||||||||||||||||||||||
Stock option information at December 31, 2010, is as follows:
| Range of Exercise Prices |
Number of Options Outstanding |
Weighted- Average Exercise Price |
Number of Options Exercisable |
Weighted- Average Exercise Price |
||||||||||||||
| $ 0.02 | 3,418,870 | $ | 0.02 | 3,418,870 | $ | 0.02 | ||||||||||||
| 0.10 | 1,561,776 | 0.10 | 1,561,776 | 0.10 | ||||||||||||||
| 0.46 | 913,106 | 0.46 | 879,124 | 0.46 | ||||||||||||||
| 1.20 | 406,500 | 1.20 | 100,426 | 1.20 | ||||||||||||||
| 1.26 | 1,654,444 | 1.26 | 1,195,496 | 1.26 | ||||||||||||||
| 1.29 | 154,250 | 1.29 | 78,212 | 1.29 | ||||||||||||||
| 1.34 | 661,250 | 1.34 | 73,617 | 1.34 | ||||||||||||||
| 1.44 | 1,004,000 | 1.44 | 36,831 | 1.44 | ||||||||||||||
| 50.00 | 17,100 | 50.00 | 17,100 | 50.00 | ||||||||||||||
|
|
|
|
|
|||||||||||||||
| 9,791,296 | 0.67 | 7,361,452 | 0.46 | |||||||||||||||
|
|
|
|
|
|||||||||||||||
As of December 31, 2010, the unrecognized compensation cost related to non-vested options granted, for which vesting is probable, under the plan was approximately $2,274. This cost is expected to be recognized over a weighted-average period of 1.8 years. The total fair value of shares vested was $453, $845, and $624 during the years ended December 31, 2008, 2009, and 2010, respectively.
F-21
Table of Contents
NOTES TO THE FINANCIAL STATEMENTS (continued)
Total stock-based compensation expense included in the accompanying statements of operations for the years ended December 31, 2008, 2009, 2010 and, is as follows (in thousands):
| 2008 |
2009 |
2010 |
||||||||||
| Research and development |
$ | 221 | $ | 252 | $ | 398 | ||||||
| Sales and marketing |
142 | 189 | 202 | |||||||||
| General and administrative |
305 | 460 | 268 | |||||||||
|
|
|
|
|
|
|
|||||||
| Total stock-based compensation expense |
$ | 668 | $ | 901 | $ | 868 | ||||||
|
|
|
|
|
|
|
|||||||
10. Net Income (Loss) Per Common Share Data
Basic and diluted net income (loss) per common share is presented in conformity with the two-class method required for participating securities. The Company has determined that its Series C, B, A, and A-1 convertible preferred stock represent participating securities because they participate with common stock in dividends and unallocated income. Historically, the Company has not paid dividends. The holders of the Series C, B, A, and A-1 convertible preferred stock do not have a contractual obligation to share in the losses of the Company. The Company considers its preferred stock to be participating securities and, in accordance with the two-class method, earnings allocated to preferred stock and the related number of outstanding shares of preferred stock have been excluded from the computation of basic and diluted net income (loss) per common share.
F-22
Table of Contents
NOTES TO THE FINANCIAL STATEMENTS (continued)
The table below summarizes the calculation of basic and diluted net income (loss) per share for the years ended December 31, 2008, 2009 and 2010 (in thousands, except share and per share amounts):
| Year Ended December 31, | ||||||||||||
| 2008 | 2009 | 2010 | ||||||||||
| Net income (loss) |
$ | (5,764 | ) | $ | 304 | $ | (3,591 | ) | ||||
| Less: Undistributed earnings allocated to preferred stockholders |
— | (279 | ) | — | ||||||||
|
|
|
|
|
|
|
|||||||
| Net income (loss) attributable to common stockholders |
$ | (5,764 | ) | $ | 25 | $ | (3,591 | ) | ||||
|
|
|
|
|
|
|
|||||||
| Weighted-average common shares used to compute net income (loss) per share attributable to common stockholders |
3,380,917 | 3,628,058 | 3,730,588 | |||||||||
|
|
|
|
|
|
|
|||||||
| Basic net income (loss) per share attributable to common stockholders |
$ | (1.70 | ) | $ | 0.01 | $ | (0.96 | ) | ||||
|
|
|
|
|
|
|
|||||||
| Diluted net income (loss) per share attributable to common stockholders: |
||||||||||||
| Net income (loss) |
$ | (5,764 | ) | $ | 25 | $ | (3,591 | ) | ||||
| Add: Undistributed earnings allocated to preferred stockholders |
— | 279 | — | |||||||||
|
|
|
|
|
|
|
|||||||
| Net income (loss) attributable to common stockholders |
$ | (5,764 | ) | $ | 304 | $ | (3,591 | ) | ||||
|
|
|
|
|
|
|
|||||||
| Number of shares used in basic calculation |
3,380,917 | 3,628,058 | 3,730,588 | |||||||||
| Weighted-average effect of dilutive securities |
||||||||||||
| Add: |
||||||||||||
| Conversion of preferred stock (as-if converted basis) |
— | 34,790,277 | — | |||||||||
| Stock options |
— | 6,167,807 | — | |||||||||
|
|
|
|
|
|
|
|||||||
| Number of shares used in diluted calculation (1) |
3,380,917 | 44,586,142 | 3,730,588 | |||||||||
|
|
|
|
|
|
|
|||||||
| Diluted net income (loss) per share attributable to common stockholders |
$ | (1.70 | ) | $ | 0.01 | $ | (0.96 | ) | ||||
|
|
|
|
|
|
|
|||||||
Note:
| (1) | Stock options, restricted stock shares and convertible preferred shares are not included in the calculation of diluted net loss per share for the years ended December 31, 2008 and 2010 because the Company had a net loss for each year. Accordingly, the inclusion of these equity awards would have had an antidilutive effect on the calculation of diluted loss per share. |
The following equivalent shares were excluded from the calculation of diluted net income (loss) per share because their effect would have been anti-dilutive for the periods presented:
| Year Ended December 31, | ||||||||||||
| Antidilutive Equity Awards |
2008 | 2009 | 2010 | |||||||||
| Stock options |
3,749,797 | 4,562,267 | 4,685,388 | |||||||||
| Restricted stock shares |
315,000 | — | — | |||||||||
| Convertible preferred shares |
34,790,277 | — | 34,790,277 | |||||||||
|
|
|
|
|
|
|
|||||||
| Total |
38,855,074 | 4,562,267 | 39,475,665 | |||||||||
|
|
|
|
|
|
|
|||||||
F-23
Table of Contents
NOTES TO THE FINANCIAL STATEMENTS (continued)
Pro Forma Net Loss Per Share (Unaudited)—The shares used in computing pro forma net loss per share for the year ended December 31, 2010 have been adjusted to assume the conversion of preferred to common shares occurred at the beginning of the fiscal year (in thousands, except share and per share amounts):
| Year
Ended December 31, 2010 |
||||
| Net loss attributable to common stockholders |
$ | (3,591 | ) | |
|
|
|
|||
| Weighted average shares used to compute net loss per share attributable to common stockholders |
3,730,588 | |||
| Effect of pro forma adjustments: |
||||
| Conversion of preferred to common shares |
34,790,277 | |||
|
|
|
|||
| Pro forma weighted average shares used to compute net loss per share attributable to common stockholders—basic and diluted (unaudited) |
38,520,865 | |||
|
|
|
|||
| Pro forma net loss per share attributable to common stockholders |
$ | (0.09 | ) | |
|
|
|
|||
11. EMPLOYEE BENEFIT PLAN
The Company sponsors a 401(k) profit sharing plan that covers substantially all employees. Under the plan, eligible employees are permitted to contribute a portion of gross compensation not to exceed standard limitations provided by the Internal Revenue Service. The Company maintains the right to match employee contributions; however, no matching contributions were made during the years ended December 31, 2008, 2009, or 2010.
12. OTHER OPERATING EXPENSES
During 2008, the Company completed relocating its data center operations from Buffalo, New York, to Atlanta, Georgia. The total cost of this project included the following (in thousands):
| Moving expenses and consulting fees |
$ | 697 | ||
| Accelerated depreciation on old data center fixed assets |
424 | |||
|
|
|
|||
| Total other operating expense |
$ | 1,121 | ||
|
|
|
******
F-24
Table of Contents
CONDENSED BALANCE SHEETS—UNAUDITED
AS OF DECEMBER 31, 2010 AND SEPTEMBER 30, 2011
(In thousands except for share and per share data)
| December 31, 2010 |
September 30, 2011 |
Pro Forma Stockholders’ Equity as of September 30, 2011 (note 1) |
||||||||||
| ASSETS |
||||||||||||
| CURRENT ASSETS: |
||||||||||||
| Cash and cash equivalents |
$ | 5,412 | $ | 7,253 | ||||||||
| Accounts receivable—net of allowance of $19 and $16 |
9,654 | 12,004 | ||||||||||
| Prepaid expenses and other current assets |
1,536 | 1,451 | ||||||||||
|
|
|
|
|
|||||||||
| Total current assets |
16,602 | 20,708 | ||||||||||
| PROPERTY AND EQUIPMENT—Net |
7,110 | 7,377 | ||||||||||
| OTHER LONG-TERM ASSETS |
615 | 716 | ||||||||||
|
|
|
|
|
|||||||||
| TOTAL ASSETS |
$ | 24,327 | $ | 28,801 | ||||||||
|
|
|
|
|
|||||||||
| LIABILITIES AND STOCKHOLDERS’ EQUITY |
||||||||||||
| CURRENT LIABILITIES: |
||||||||||||
| Accounts payable |
$ | 7,612 | $ | 8,319 | ||||||||
| Accrued expenses and other current liabilities |
3,272 | 4,081 | ||||||||||
| Current portion of bank financing |
500 | 375 | ||||||||||
| Current portion of capital lease obligations |
1,478 | 1,167 | ||||||||||
|
|
|
|
|
|||||||||
| Total current liabilities |
12,862 | 13,942 | ||||||||||
| LONG-TERM PORTION OF BANK FINANCING |
250 | — | ||||||||||
| LONG-TERM PORTION OF CAPITAL LEASE OBLIGATIONS |
953 | 1,501 | ||||||||||
| OTHER LONG-TERM LIABILITIES |
106 | 80 | ||||||||||
|
|
|
|
|
|||||||||
| Total liabilities |
14,171 | 15,523 | ||||||||||
|
|
|
|
|
|||||||||
| COMMITMENTS AND CONTINGENCIES (Note 6) |
||||||||||||
| STOCKHOLDERS’ EQUITY: |
||||||||||||
| Common stock, $0.01 par value—authorized, 60,000,000 shares; 5,839,102 issued and 5,200,102 outstanding at September 30, 2011 and 3,808,308 issued and 3,169,308 shares outstanding at December 31, 2010 |
38 | 58 | $ | 406 | ||||||||
| Convertible preferred stock (liquidation value of $5,240 at September 30, 2011), $0.01 par value—authorized Series A, 5,709,638 shares; issued and outstanding, 5,548,508 shares at September 30, 2011 and December 31, 2010 |
5,077 | 5,077 | — | |||||||||
| Convertible preferred stock (liquidation value of $750 at September 30, 2011), $0.01 par value—authorized Series A-1, 570,344 shares; issued and outstanding, 570,344 shares at September 30, 2011 and December 31, 2010 |
730 | 730 | — | |||||||||
| Convertible preferred stock (liquidation value of $5,475 at September 30, 2011), $0.01 par value—authorized Series B, 3,500,000 shares; issued and outstanding, 2,737,500 shares at September 30, 2011 and December 31, 2010 |
5,401 | 5,401 | — | |||||||||
| Convertible preferred stock (liquidation value of $17,374 at September 30, 2011), $0.01 par value—authorized Series C, 2,740,407 shares; issued and outstanding, 2,740,407 shares at September 30, 2011 and December 31, 2010 |
17,224 | 17,224 | — | |||||||||
| Treasury stock—at cost, 639,000 shares at September 30, 2011 and December 31, 2010 |
(569 | ) | (569 | ) | (569 | ) | ||||||
| Additional paid-in capital |
44,340 | 45,254 | 73,338 | |||||||||
| Accumulated deficit |
(62,085 | ) | (59,897 | ) | (59,897 | ) | ||||||
|
|
|
|
|
|
|
|||||||
| Total stockholders’ equity |
10,156 | 13,278 | 13,278 | |||||||||
|
|
|
|
|
|
|
|||||||
| TOTAL LIABILITIES AND STOCKHOLDERS’ EQUITY |
$ | 24,327 | $ | 28,801 | $ | 28,801 | ||||||
|
|
|
|
|
|
|
|||||||
The accompanying notes are an integral part of these condensed financial statements.
F-25
Table of Contents
CONDENSED STATEMENTS OF OPERATIONS—UNAUDITED
FOR THE NINE MONTHS ENDED SEPTEMBER 30, 2010 AND 2011
(In thousands except for share and per share data)
| Nine Months
Ended September 30, |
||||||||
| 2010 | 2011 | |||||||
| REVENUE |
$ | 48,041 | $ | 62,115 | ||||
| COSTS AND OPERATING EXPENSES: |
||||||||
| Cost of revenue (exclusive of depreciation shown separately below) |
26,907 | 32,872 | ||||||
| Research and development (exclusive of depreciation shown separately below) |
13,710 | 14,270 | ||||||
| Sales and marketing |
4,597 | 5,811 | ||||||
| General and administrative (exclusive of depreciation shown separately below) |
3,941 | 4,887 | ||||||
| Depreciation |
1,884 | 1,950 | ||||||
|
|
|
|
|
|||||
| Total costs and operating expenses |
51,039 | 59,790 | ||||||
|
|
|
|
|
|||||
| INCOME (LOSS) FROM OPERATIONS |
(2,998 | ) | 2,325 | |||||
| OTHER EXPENSE |
17 | 18 | ||||||
| INTEREST EXPENSE |
189 | 64 | ||||||
|
|
|
|
|
|||||
| INCOME (LOSS) BEFORE INCOME TAXES |
(3,204 | ) | 2,243 | |||||
| PROVISION FOR INCOME TAXES |
18 | 55 | ||||||
|
|
|
|
|
|||||
| NET INCOME (LOSS) |
(3,222 | ) | 2,188 | |||||
|
|
|
|
|
|||||
| UNDISTRIBUTED EARNINGS ALLOCATED TO PREFERRED STOCKHOLDERS |
— | 1,903 | ||||||
|
|
|
|
|
|||||
| NET INCOME (LOSS) ATTRIBUTABLE TO COMMON STOCKHOLDERS |
$ | (3,222 | ) | $ | 285 | |||
|
|
|
|
|
|||||
| NET INCOME (LOSS) PER SHARE ATTRIBUTABLE TO COMMON STOCKHOLDERS: |
||||||||
| Basic |
$ | (0.87 | ) | $ | 0.07 | |||
|
|
|
|
|
|||||
| Diluted |
$ | (0.87 | ) | $ | 0.05 | |||
|
|
|
|
|
|||||
| WEIGHTED AVERAGE SHARES USED TO COMPUTE NET INCOME (LOSS) PER SHARE ATTRIBUTABLE TO COMMON STOCKHOLDERS: |
||||||||
| Basic |
3,711,130 | 4,013,478 | ||||||
|
|
|
|
|
|||||
| Diluted |
3,711,130 | 44,866,723 | ||||||
|
|
|
|
|
|||||
| PRO FORMA NET INCOME PER SHARE ATTRIBUTABLE TO COMMON STOCKHOLDERS (NOTE 1): |
||||||||
| Basic |
$ | 0.06 | ||||||
|
|
|
|||||||
| Diluted |
$ | 0.05 | ||||||
|
|
|
|||||||
| PRO FORMA WEIGHTED AVERAGE SHARES USED TO COMPUTE NET INCOME PER SHARE ATTRIBUTABLE TO COMMON STOCKHOLDERS (NOTE 1): |
||||||||
| Basic |
38,803,755 | |||||||
|
|
|
|||||||
| Diluted |
44,866,723 | |||||||
|
|
|
|||||||
The accompanying notes are an integral part of these condensed financial statements.
F-26
Table of Contents
CONDENSED STATEMENTS OF CASH FLOWS—UNAUDITED
FOR THE NINE MONTHS ENDED SEPTEMBER 30, 2010 AND 2011
(In thousands)
| Nine Months
Ended September 30, |
||||||||
| 2010 | 2011 | |||||||
| CASH FLOWS FROM OPERATING ACTIVITIES: |
||||||||
| Net income (loss) |
$ | (3,222 | ) | $ | 2,188 | |||
| Adjustments to reconcile net income (loss) to net cash provided by (used in) operating activities: |
||||||||
| Depreciation |
1,884 | 1,950 | ||||||
| Stock-based compensation expense |
605 | 640 | ||||||
| Loss on disposal of property and equipment |
3 | 10 | ||||||
| Change in assets and liabilities: |
||||||||
| Accounts receivable, net |
219 | (2,350 | ) | |||||
| Prepaid expenses and other current assets |
(442 | ) | 121 | |||||
| Other long-term assets |
(235 | ) | (38 | ) | ||||
| Accounts payable |
(1,078 | ) | 707 | |||||
| Accrued expenses and other current liabilities |
130 | 809 | ||||||
| Other long-term liabilities |
(162 | ) | (26 | ) | ||||
|
|
|
|
|
|||||
| Net cash provided by (used in) operating activities |
(2,298 | ) | 4,011 | |||||
|
|
|
|
|
|||||
| CASH FLOWS FROM INVESTING ACTIVITIES—Purchases of property and equipment |
(1,279 | ) | (1,478 | ) | ||||
|
|
|
|
|
|||||
| CASH FLOWS FROM FINANCING ACTIVITIES: |
||||||||
| Borrowings on bank financing |
588 | |||||||
| Proceeds from sale/leaseback |
794 | |||||||
| Repayment on bank financing |
(125 | ) | (375 | ) | ||||
| Repayments on capital lease obligations |
(1,700 | ) | (1,400 | ) | ||||
| Proceeds from exercise of common stock options |
26 | 289 | ||||||
|
|
|
|
|
|||||
| Net cash used in financing activities |
(1,211 | ) | (692 | ) | ||||
|
|
|
|
|
|||||
| NET INCREASE (DECREASE) IN CASH AND CASH EQUIVALENTS |
(4,788 | ) | 1,841 | |||||
| CASH AND CASH EQUIVALENTS—Beginning of year |
10,462 | 5,412 | ||||||
|
|
|
|
|
|||||
| CASH AND CASH EQUIVALENTS—End of period |
$ | 5,674 | $ | 7,253 | ||||
|
|
|
|
|
|||||
| SUPPLEMENTAL DISCLOSURES OF CASH FLOW INFORMATION: |
||||||||
| Cash paid for interest |
$ | 189 | $ | 64 | ||||
|
|
|
|
|
|||||
| Non cash financing and investing activity—property and equipment acquired under capital lease obligations and bank financing |
$ | 1,698 | $ | 843 | ||||
|
|
|
|
|
|||||
The accompanying notes are an integral part of these condensed financial statements.
F-27
Table of Contents
SYNACOR, INC.
NOTES TO THE CONDENSED FINANCIAL STATEMENTS—UNAUDITED
AS OF DECEMBER 31, 2010 AND SEPTEMBER 30, 2011, AND
FOR THE NINE MONTHS ENDED SEPTEMBER 30, 2010 AND 2011
(In thousands except for share and per share data)
1. The Company and Summary of Significant Accounting Policies
Synacor, Inc. (the “Company”) is a leading provider of authentication and aggregation solutions for delivery of online content and services. The Company delivers solutions as a set of services through its hosted and managed platform, enabling cable and telecom service providers and consumer electronics manufacturers to provide the online content and services that their consumers increasingly demand. The Company’s platform allows its customers to package a wide array of online content and services with their high-speed Internet, communications, television and other offerings. Synacor’s customers offer the Company’s services under their own brands on Internet-enabled devices such as PCs, tablets, smartphones and connected TVs.
Basis of Presentation—The accompanying interim condensed financial statements are unaudited and have been prepared by the Company’s management in accordance with accounting principles generally accepted in the United States of America (“GAAP”). In the opinion of management, all significant adjustments, which include all normal recurring adjustments, considered necessary for the fair presentation of the unaudited condensed financial statements have been included, and the unaudited condensed financial statements present fairly the financial position and results of operations for the interim periods presented. These unaudited condensed financial statements should be read in conjunction with the audited financial statements and related footnotes of the Company included elsewhere in this prospectus. Results of operations and cash flows for the interim period are not necessarily indicative of future results.
Accounting Estimates—The preparation of financial statements in conformity with GAAP in the U.S. requires management to make estimates, judgments and assumptions that affect the amounts reported and disclosed in the financial statements and the accompanying notes. We base our estimates on historical experience and on various other assumptions that are believed to be reasonable, the results of which form the basis for making judgments about the carrying values of assets and liabilities. Such estimates primarily relate to unsettled transactions and events as of the date of the financial statements. Accordingly, actual results may differ from estimated amounts.
Concentrations of Risk—As of September 30, 2011, and for the nine months ended September 30, 2010 and 2011, the Company had concentrations equal to or exceeding 10% of the Company’s accounts receivable and revenue as follows:
| Accounts Receivable | Revenue | |||||||||||
| September
30, 2011 |
Nine months
ended September 30, |
|||||||||||
| 2010 | 2011 | |||||||||||
| |
38 | % | 47 | % | 55 | % | ||||||
| Platform Customer A (1) |
13 | 15 | 9 | |||||||||
Note:
| (1) | For this purpose revenue includes only revenue earned directly by the Company from this platform customer for subscriber-based services and excludes revenue attributable to search and display advertising on the customer’s website(s). |
For the nine months ended September 30, 2010 and 2011, the following platform customers received revenue-share payments equal to or exceeding 10% of the Company’s cost of revenue. The costs represent revenue share paid to them for their supply of Internet traffic on our customer branded platforms.
| Cost of Revenue | ||||||||
| Nine months
ended September 30, |
||||||||
| 2010 | 2011 | |||||||
| Platform Customer A |
20 | % | 15 | % | ||||
| Platform Customer B |
25 | 19 | ||||||
F-28
Table of Contents
NOTES TO THE CONDENSED FINANCIAL STATEMENTS—UNAUDITED (continued)
Fair Value Measurements—The provisions of the Financial Accounting Standards Board (“FASB”) Accounting Standard Codification (“ASC”) 820, Fair Value Measurements and Disclosures, establishes a framework for measuring the fair value in accounting principles generally accepted in the U.S. and establishes a hierarchy that categorizes and prioritizes the sources to be used to estimate fair value as follows:
Level 1—Level 1 inputs are defined as observable inputs such as quoted prices in active markets.
Level 2—Level 2 inputs include quoted prices for similar assets and liabilities in active markets, quoted prices for identical or similar assets or liabilities in markets that are not active, inputs other than quoted prices that are observable for the asset or liability (interest rates, yield curves, etc.), and inputs that are derived principally from or corroborated by observable market data by correlation or other means (market corroborated inputs).
Level 3—Level 3 inputs are unobservable inputs that reflect the Company’s determination of assumptions that market participants would use in pricing the asset or liability. These inputs are developed based on the best information available, including the Company’s own data.
In accordance with ASC 820, included within the Company’s cash and cash equivalents at September 30, 2011 are $1,294 of money market funds that are classified as Level 1 financial assets. The fair value of cash and cash equivalents are primarily composed of the Company’s investments in money market instruments with original maturities of three months or less. The Company’s cash and cash equivalent balances excluded above are composed of cash, certificates of deposits with original maturities of one month or less, and overnight investments.
The estimated fair value of the bank financing liabilities and capital lease obligations approximate their carrying value.
Pro Forma Stockholder’s Equity and Pro Forma Net Income Per Share—If an initial public offering results in a post-offering valuation of the Company’s common stock on a fully diluted basis of at least $150,000 and the proceeds are not less than $25,000, all 11,596,759 shares of convertible preferred stock will be mandatorily converted into shares of common stock on a 3:1 ratio, resulting in a total of 34,790,277 common shares. The pro forma stockholder’s equity as of September 30, 2011 and the pro forma net income per common share data for the nine months ended September 30, 2011 have been prepared assuming that the conversion of preferred stock occurred on January 1, 2011. Refer to Note 8, Net Income (Loss) Per Common Share Data, for disclosure of the calculation of pro forma net income per share.
Recently Issued Accounting Standards—In the normal course of business, management evaluates all new accounting pronouncements issued by the Financial Accounting Standards Board, Securities and Exchange Commission, Emerging Issues Task Force, American Institute of Certified Public Accountants or other authoritative accounting bodies to determine the potential impact they may have on the Company’s Financial Statements. Based upon this review, except as noted below, management does not expect any of the recently issued accounting pronouncements, which have not already been adopted, to have a material impact on the Company’s Financial Statements.
In May 2011, the FASB issued guidance that establishes a global standard for applying fair value measurement. In addition to a few updates to the measurement guidance it includes enhanced disclosure requirements. The most significant change for companies reporting under GAAP is an expansion of the disclosures required for Level 3 measurements; that is, measurements based on unobservable inputs, such as a company’s own data. This update is effective for the Company beginning in fiscal year 2012. The adoption of this guidance is not expected to have a material impact on the Company’s financial statements.
Subsequent Events—The Company has evaluated subsequent events from September 30, 2011 through November 18, 2011, the date the financial statements were available to be issued.
F-29
Table of Contents
NOTES TO THE CONDENSED FINANCIAL STATEMENTS—UNAUDITED (continued)
2. Property and Equipment—Net
As of September 30, 2011, property and equipment, net consisted of the following (in thousands):
| 2011 | ||||
| Computer equipment (1) |
$ | 12,289 | ||
| Computer software |
1,376 | |||
| Furniture and fixtures |
1,047 | |||
| Leasehold improvements |
689 | |||
| Other |
172 | |||
|
|
|
|||
| 15,573 | ||||
| Less accumulated depreciation (2) |
(8,196 | ) | ||
|
|
|
|||
| Total property and equipment—net |
$ | 7,377 | ||
|
|
|
|||
Notes:
| (1) | Includes equipment under capital lease obligations of approximately $5,569 as of September 30, 2011. |
| (2) | Includes $2,028 of accumulated depreciation of equipment under capital leases as of September 30, 2011. |
3. Accrued Expenses and Other Current Liabilities
As of September 30, 2011, accrued expenses and other current liabilities consisted of the following (in thousands):
| 2011 | ||||
| Accrued compensation |
$ | 2,451 | ||
| Accrued content fees |
607 | |||
| Unearned revenue on contracts |
241 | |||
| Other |
782 | |||
|
|
|
|||
| Total |
$ | 4,081 | ||
|
|
|
|||
4. Bank Financing
In July 2011, the Company amended its existing loan and security agreement, pursuant to which the Company can refinance its existing term loan with a new term loan of $3,000. The ability to refinance can take place until January 2012. If the existing term loan is refinanced, payments will be interest only until January 2012. Thereafter, the loan principal payment will be due in 30 equal installments ending in July 2014. Any borrowings under the equipment line accrue interest at the greater of 4% or prime rate plus margin of 0.50%. As of September 30, 2011 the term loan has not been refinanced and the outstanding balance is $375, all of which is current. At December 31, 2010 the term loan balance was $750, of which $500 was current and $250 was long-term.
Additionally, the July 2011 amended agreement increased the Company’s ability to borrow under a revolving credit line from $5,000 at December 31, 2010 to $6,000 for an extended term of 24 months from agreement execution, ending July 2013. Any borrowings under the revolving credit line accrue interest at the greater of 4% or prime rate plus margin of 0.25% and must be repaid by July 2013. There were no borrowings outstanding on the revolving credit line as of September 30, 2011.
F-30
Table of Contents
NOTES TO THE CONDENSED FINANCIAL STATEMENTS—UNAUDITED (continued)
Both the term loan and the revolving credit line agreement contain provisions that allow the lender to accelerate repayment of the borrowing upon a material adverse change as defined in the agreement. The term loan and the revolving credit line agreement contain certain financial performance and reporting covenants, and at September 30, 2011, the Company was in compliance with the covenants.
5. Information About Segment and Geographic Areas
The Company considers operating segments to be components of the Company in which separate financial information is available that is evaluated regularly by the Company’s chief operating decision maker in deciding how to allocate resources and in assessing performance. The chief operating decision maker for the Company is the Chief Executive Officer. The Chief Executive Officer reviews financial information presented on a total Company basis, accompanied by information about revenue by major service line for purposes of allocating resources and evaluating financial performance. The Company has one business activity and there are no segment managers who are held accountable for operations, operating results or plans for levels or components below the Company level. Accordingly, the Company has determined that it has a single reporting segment and operating unit structure of providing personalized Internet platforms and online entertainment services to high-speed Internet subscribers.
The following table sets forth revenue and long-lived tangible assets by geographic area (in thousands):
| Nine Months
Ended September 30, |
||||||||
| 2010 | 2011 | |||||||
| Revenue: |
||||||||
| United States |
$ | 47,074 | $ | 61,270 | ||||
| United Kingdom |
687 | 845 | ||||||
| Netherlands |
280 | — | ||||||
|
|
|
|
|
|||||
| Total revenue |
$ | 48,041 | $ | 62,115 | ||||
|
|
|
|
|
|||||
| September 30, 2011 |
||||
| Long-lived tangible assets: |
||||
| United States |
$ | 6,693 | ||
| Netherlands |
684 | |||
|
|
|
|||
| Total long-lived tangible assets |
$ | 7,377 | ||
|
|
|
|||
6. Commitments and Contingencies
From time to time, the Company is a party to legal actions. In the opinion of management, the outcome of these matters will not have a material impact on the financial statements of the Company.
F-31
Table of Contents
NOTES TO THE CONDENSED FINANCIAL STATEMENTS—UNAUDITED (continued)
7. Stock-based Compensation
The Company recorded stock-based compensation expense of $605 and $640 for the nine months ended September 30, 2010 and 2011, respectively. No income tax deduction is allowed for incentive stock options. Accordingly, no deferred income tax asset is recorded for the expense related to these options.
Total stock-based compensation expense included in the accompanying condensed statements of operations for the nine months ended September 30, 2010 and 2011, is as follows (in thousands):
| Nine Months
Ended September 30, |
||||||||
| 2010 | 2011 | |||||||
| Research and development |
$ | 278 | $ | 205 | ||||
| Sales and marketing |
140 | 141 | ||||||
| General and administrative |
187 | 294 | ||||||
|
|
|
|
|
|||||
| Total stock-based compensation expense |
$ | 605 | $ | 640 | ||||
|
|
|
|
|
|||||
Stock Option Plans—The Company has adopted three stock option plans, which authorize the grant of up to 14,340,717 options to officers and other key employees to purchase the Company’s common stock, subject to the terms of the plans. The options generally vest ratably over four years. The options are generally exercisable after the date of grant, and typically expire 10 years from their respective grant dates or earlier if employment is terminated. In connection with the early exercise of stock options, the Company has the right, but not the obligation, to repurchase shares of common stock upon termination of the individual’s service to the Company at the original price per share. During the nine months ended September 30, 2011 there were no early exercises.
A summary of the status of options granted under all option plans is presented below:
| Number of Stock Options |
Weighted Average Exercise Price |
|||||||
| Outstanding—January 1, 2011 |
9,791,296 | $ | 0.67 | |||||
| Granted |
2,621,350 | 1.65 | ||||||
| Exercised |
(2,030,795 | ) | 0.14 | |||||
| Forfeited |
(452,158 | ) | 1.23 | |||||
|
|
|
|||||||
| Outstanding—September 30, 2011 |
9,929,693 | 0.93 | ||||||
|
|
|
|||||||
| Expected to vest—September 30, 2011 |
9,403,390 | 0.90 | ||||||
|
|
|
|||||||
| Vested and exercisable—September 30, 2011 |
5,669,166 | 0.47 | ||||||
|
|
|
|||||||
The weighted-average remaining contractual life of the options outstanding and expected to vest were 5.2 and 6.3 years as of December 31, 2010 and September 30, 2011, respectively. The aggregate intrinsic value for outstanding, expected to vest, and vested and exercisable shares were $9,100, $8,949, and $7,804, respectively, as of September 30, 2011. The total intrinsic value of options exercised during the nine months ended September 30, 2011, was $3,463. The aggregate intrinsic value represents the total pre-tax intrinsic value (the difference between the Company’s estimated stock value and the exercise price, multiplied by the number of in-the-money stock options) had all stock option holders exercised their stock options on the balance sheet date. This amount will change based on the fair market value of the Company’s stock.
F-32
Table of Contents
NOTES TO THE CONDENSED FINANCIAL STATEMENTS—UNAUDITED (continued)
The Company uses the Black-Scholes-Merton option-pricing model to determine the fair value of stock options. The determination of the grant date fair value of options using an option-pricing model is affected by our estimated common stock fair value as well as assumptions regarding a number of other complex and subjective variables. These variables include the fair value of our common stock, our expected stock price volatility over the expected term of the options, stock option exercise and cancellation behaviors, risk-free interest rates, and expected dividends, which are estimated as follows:
| • | Fair Value of Common Stock—Because the Company’s stock has not been publicly traded, it must estimate the fair value of common stock. |
| • | Expected Term—The expected term represents the period of time the stock options are expected to be outstanding and is based on the “simplified method” allowed under SEC guidance. The Company uses the “simplified method” due to the lack of sufficient historical exercise data to provide a reasonable basis upon which to otherwise estimate the expected life of the stock options. |
| • | Volatility—Since the Company does not have a trading history for its common stock, the expected stock price volatility was estimated by taking the average historic price volatility for publicly-traded options of comparable industry peers similar in size, stage of life cycle and financial leverage, based on daily price observations over a period equivalent to the expected term of the stock option grants. The Company did not rely on implied volatilities of traded options in its industry peers’ common stock because the volume of activity was relatively low. The Company intends to continue to consistently apply this process using the same or similar public companies until a sufficient amount of historical information regarding the volatility of its common stock share price becomes available, or unless circumstances change such that the identified companies are no longer similar, in which case, more suitable companies whose share prices are publicly available would be utilized in the calculation. |
| • | Risk-Free Interest Rate—The risk-free interest rate is based on the yields of U.S. Treasury securities with maturities similar to the expected term of the options for each option group. |
| • | Dividend Yield—The expected dividend yield is 0% based upon the Company’s historical practice of electing not to declare or pay cash dividends on its common stock. |
In addition, the Company is required to estimate the expected forfeiture rate and only recognize expense for those shares expected to vest. The forfeiture rate is estimated based on historical experience. To the extent the actual forfeiture rate is different from the estimate, stock-based compensation expense is adjusted accordingly.
In connection with the preparation of the Company’s financial statements, the Company engaged Anvil Advisors LLC (“Anvil”), an unrelated valuation specialist as defined under the American Institute of Certified Public Accountants Practice Guide, Valuation of Privately-Held Company Equity Securities Issued as Compensation, to assist Company management in estimating the fair value of its common stock in connection with options granted. In the valuation report dated April 2011, Anvil retrospectively valued the Company’s common stock. In the 2011 valuation, the Anvil estimated the enterprise value of the Company on each applicable valuation date using the market multiple method and the comparable transaction method and then computed a weighted average of the applicable combination based on the likelihood of an initial public offering. Anvil then used the company security valuation method to allocate the enterprise value of the Company among its various classes of equity to derive a fully marketable value per share for the common stock. Anvil applied an appropriate discount for lack of marketability to this fully marketable value to arrive at the fair value per share of common stock.
F-33
Table of Contents
NOTES TO THE CONDENSED FINANCIAL STATEMENTS—UNAUDITED (continued)
The following is a summary of the valuation dates and corresponding common stock fair values during 2011:
| Valuation Date |
Common Stock Fair Value Per Share |
|||
| March 31, 2011 |
$ | 1.66 | ||
| September 30, 2011 |
1.85 | |||
The following is a description of the significant assumptions used in the valuations of the Company’s common stock during 2011:
March 31, 2011 Valuation—The US economy and financial market conditions continued to improve from the September 30, 2010 valuation date through March 31, 2011. The probabilities of an initial public offering and a sale of the Company were 20% and 80%, respectively. The weightings given to the market multiple method and the comparable transaction method were 50% and 50%, respectively. The company-specific volatility was 70% and the lack-of-marketability discount was 20%.
September 30, 2011 Valuation—The US economy and financial market conditions were difficult from March 31, 2011 to September 30, 2011, however the Company’s business continued to grow. The probabilities of an initial public offering and a sale of the Company were 20% and 80%, respectively. The weightings given to the market multiple method and the comparable transaction method were 50% and 50%, respectively. The company-specific volatility was 70% and the lack-of-marketability discount was 20%.
For options granted during the year ended December 31, 2010, the weighted-average fair value of the stock options granted, estimated on the date of the grant using the Black-Scholes option-pricing model was $0.72 and used the following assumptions:
| Expected life of options (in years) |
6.25 | |||
| Risk-free interest rate |
2.4 | % | ||
| Expected volatility |
53 | % | ||
| Expected dividend yield |
— |
A summary of the option grants and assumptions used in the Black-Scholes option-pricing model to value the options during the period ended September 30, 2011, is as follows:
| Grant Date |
Options Granted |
Weighted- Average Fair Value |
Expected Life of Options (In years) |
Risk-Free Interest Rate |
Expected Volatility |
Expected Dividend Yield |
||||||||||||||||||
| February 3, 2011 |
31,000 | $ | 0.75 | 6.25 | 2.92 | % | 50 | % | — | % | ||||||||||||||
| March 16, 2011 |
114,750 | 0.73 | 6.25 | 2.56 | 50 | — | ||||||||||||||||||
| May 5, 2011 |
9,000 | 0.84 | 6.25 | 2.54 | 50 | — | ||||||||||||||||||
| June 16, 2011 |
112,000 | 0.83 | 6.25 | 2.22 | 50 | — | ||||||||||||||||||
| August 16, 2011 |
2,354,600 | 0.83 | 6.25 | 1.54 | 51 | — | ||||||||||||||||||
|
|
|
|||||||||||||||||||||||
| Total grants |
2,621,350 | |||||||||||||||||||||||
|
|
|
|||||||||||||||||||||||
F-34
Table of Contents
NOTES TO THE CONDENSED FINANCIAL STATEMENTS—UNAUDITED (continued)
Stock option information at September 30, 2011, is as follows:
| Exercise Prices |
Number of Options Outstanding |
Weighted- Average Exercise Price |
Number of Options Vested and Exercisable |
Weighted- Average Exercise Price |
||||||||||||
| $0.02 |
1,647,322 | $ | 0.02 | 1,647,322 | $ | 0.02 | ||||||||||
| 0.10 |
1,497,576 | 0.10 | 1,497,576 | 0.10 | ||||||||||||
| 0.46 |
865,575 | 0.46 | 865,575 | 0.46 | ||||||||||||
| 1.20 |
266,500 | 1.20 | 120,186 | 1.20 | ||||||||||||
| 1.26 |
1,354,620 | 1.26 | 1,275,982 | 1.26 | ||||||||||||
| 1.29 |
130,250 | 1.29 | 90,374 | 1.29 | ||||||||||||
| 1.34 |
547,500 | 1.34 | 163,513 | 1.34 | ||||||||||||
| 1.44 |
1,144,750 | 1.44 | 8,638 | 1.44 | ||||||||||||
| 1.66 |
2,475,600 | 1.66 | — | 1.66 | ||||||||||||
|
|
|
|
|
|||||||||||||
| 9,929,693 | 0.93 | 5,669,166 | 0.47 | |||||||||||||
|
|
|
|
|
|||||||||||||
As of September 30, 2011, the unrecognized compensation cost related to non-vested options granted, for which vesting is probable, under the plan was approximately $2,820. This cost is expected to be recognized over a weighted-average period of 1.8 years. The total fair value of shares vested was $549 and $373 during the nine months ended September 30, 2010 and 2011, respectively.
Subsequent Event
The Company granted 198,000 options in November 2011, based on its estimate of the fair value of its common stock in part on a report dated November 2011 from Anvil, which concluded that the common stock value was $1.85 per share as of September 30, 2011.
8. Net Income (Loss) Per Common Share Data
Basic and diluted net income (loss) per common share is presented in conformity with the two-class method required for participating securities. The Company has determined that its Series C, B, A, and A-1 convertible preferred stock represent participating securities because they participate with common stock in dividends and unallocated income. Historically, the Company has not paid dividends. The holders of the Series C, B, A, and A-1 convertible preferred stock do not have a contractual obligation to share in the losses of the Company. The Company considers its preferred stock to be participating securities and, in accordance with the two-class method, earnings allocated to preferred stock and the related number of outstanding shares of preferred stock have been excluded from the computation of basic and diluted net income (loss) per common share.
F-35
Table of Contents
NOTES TO THE CONDENSED FINANCIAL STATEMENTS—UNAUDITED (continued)
The following table presents the calculation of basic and diluted net income (loss) per share for the nine-month periods ended September 30, 2011 and 2010 (in thousands, except share and per share amounts):
| Nine Months
Ended, September 30, |
||||||||
| 2010 | 2011 | |||||||
| Net income (loss) |
$ | (3,222 | ) | $ | 2,188 | |||
| Less: undistributed earnings allocated to preferred stockholders |
— | (1,903 | ) | |||||
|
|
|
|
|
|||||
| Net income (loss) attributable to common stockholders |
$ | (3,222 | ) | $ | 285 | |||
|
|
|
|
|
|||||
| Weighted-average common shares used to compute net income (loss) per share attributable to common stockholders |
3,711,130 | 4,013,478 | ||||||
|
|
|
|
|
|||||
| Basic net income (loss) per share attributable to common stockholders |
$ | (0.87 | ) | $ | 0.07 | |||
|
|
|
|
|
|||||
| Diluted net income (loss) per share attributable to common stockholders |
||||||||
| Net income (loss) |
$ | (3,222 | ) | $ | 285 | |||
| Add: undistributed earnings allocated to preferred stockholders |
— | 1,903 | ||||||
|
|
|
|
|
|||||
| Net income (loss) attributable to common stockholders |
$ | (3,222 | ) | $ | 2,188 | |||
|
|
|
|
|
|||||
| Number of shares used in basic calculation |
3,711,130 | 4,013,478 | ||||||
| Weighted-average effect of dilutive securities |
||||||||
| Add: |
||||||||
| Conversion of preferred stock (as-if converted basis) |
— | 34,790,277 | ||||||
| Stock options |
— | 6,062,968 | ||||||
|
|
|
|
|
|||||
| Number of shares used in diluted calculation (1) |
3,711,130 | 44,866,723 | ||||||
|
|
|
|
|
|||||
| Diluted net income (loss) per share attributable to common stockholders |
$ | (0.87 | ) | $ | 0.05 | |||
|
|
|
|
|
|||||
Note:
| (1) | Stock options and convertible preferred shares are not included in the calculation of diluted net loss per share for the nine-month period ended September 30, 2010 because the Company had a net loss for that period. Accordingly, the inclusion of these equity awards would have had an antidilutive effect on the calculation of diluted loss per share. |
The following equivalent shares were excluded from the calculation of diluted net income (loss) per share because their effect would have been anti-dilutive for the period presented:
| Nine Months
Ended September 30, |
||||||||
| 2010 | 2011 | |||||||
| Antidilutive equity awards |
||||||||
| Stock options |
4,743,951 | 4,109,496 | ||||||
| Convertible preferred shares |
34,790,277 | — | ||||||
|
|
|
|
|
|||||
| Total |
39,534,228 | 4,109,496 | ||||||
|
|
|
|
|
|||||
F-36
Table of Contents
NOTES TO THE CONDENSED FINANCIAL STATEMENTS—UNAUDITED (continued)
Pro Forma Net Income Per Share—The shares used in computing pro forma net income per share for the nine months ended September 30, 2011 have been adjusted to assume the conversion of preferred to common shares occurred at the beginning of the fiscal year (in thousands, except share and per share amounts):
| Nine
Months Ended September 30, 2011 |
||||
| Net income attributable to common stockholders |
$ | 2,188 | ||
|
|
|
|||
| Weighted average shares used to compute net income per share attributable to common stockholders |
4,013,478 | |||
| Effect of pro forma adjustments: |
||||
| Conversion of preferred to common shares |
34,790,277 | |||
|
|
|
|||
| Pro forma weighted average shares used to compute basic net income per share attributable to common stockholders |
38,803,755 | |||
|
|
|
|||
| Diluted shares: |
||||
| Stock options |
6,062,968 | |||
|
|
|
|||
| Pro forma weighted average shares used to compute diluted net income per share attributable to common stockholders |
44,866,723 | |||
|
|
|
|||
| Pro forma net income per share attributable to common stockholders: |
||||
| Basic |
$ | 0.06 | ||
|
|
|
|||
| Diluted |
$ | 0.05 | ||
|
|
|
|||
* * * * * *
F-37
Table of Contents
Until , (25 days after the date of this prospectus), all dealers that effect transactions in these securities, whether or not participating in this offering, may be required to deliver a prospectus. This is in addition to the dealer’s obligation to deliver a prospectus when acting as an underwriter and with respect to unsold allotments or subscriptions.
Shares
Common Stock
P R O S P E C T U S
BofA Merrill Lynch
Citigroup
Stifel Nicolaus Weisel
BMO Capital Markets
Needham & Company, LLC
Oppenheimer & Co.
,
Table of Contents
PART II
Information Not Required in Prospectus
| Item 13. | Other Expenses of Issuance and Distribution |
The following table presents the costs and expenses, other than underwriting discounts and commissions, payable by us in connection with the sale of common stock being registered. All amounts are estimates except the SEC registration fee, the FINRA filing fee and listing fee.
| SEC Registration fee (1) |
$ | 8,595 | ||
| FINRA filing fee |
8,000 | |||
| NASDAQ Global Market listing fee |
150,000 | |||
| Printing and engraving expenses |
* | |||
| Legal fees and expenses |
* | |||
| Accounting fees and expenses |
* | |||
| Blue sky fees and expenses |
* | |||
| Custodian and transfer agent fees |
* | |||
| Miscellaneous fees and expenses |
* | |||
|
|
|
|||
| Total |
$ | * | ||
|
|
|
Notes:
| * | To be furnished by amendment. |
| (1) | Of the total fee, $5,947 was paid concurrently with the initial filing of this registration statement. Pursuant to Rule 457(p) under the Securities Act, the registration fee was offset by the $2,648 registration fee previously paid by the registrant, Synacor, Inc., in connection with the registration statement on Form S-1 (File No. 333-145077) initially filed by the registrant on August 2, 2007 and subsequently withdrawn. |
| Item 14. | Indemnification of Directors and Officers |
Our amended and restated certificate of incorporation and amended and restated bylaws contain provisions relating to the limitation of liability and indemnification of directors and officers. The amended and restated certificate of incorporation provides that our directors will not be personally liable to us or our stockholders for monetary damages for any breach of fiduciary duty as a director, except for liability:
| • | for any breach of the director’s duty of loyalty to us or our stockholders; |
| • | for acts or omissions not in good faith or that involve intentional misconduct or a knowing violation of law; |
| • | in respect of unlawful payments of dividends or unlawful stock repurchases or redemptions as provided in Section 174 of the Delaware General Corporation Law; or |
| • | for any transaction from which the director derives any improper personal benefit. |
Our amended and restated certificate of incorporation also provides that if Delaware law is amended after the approval by our stockholders of the certificate of incorporation to authorize corporate action further eliminating or limiting the personal liability of directors, then the liability of our directors will be eliminated or limited to the fullest extent permitted by Delaware law.
Our amended and restated bylaws provide that we will indemnify our directors and officers to the fullest extent permitted by Delaware law, as it now exists or may in the future be amended, against all expenses and
II-1
Table of Contents
liabilities reasonably incurred in connection with their service for us or on our behalf. Our amended and restated bylaws provide that we shall advance the expenses incurred by a director or officer in advance of the final disposition of an action or proceeding. The bylaws also authorize us to indemnify any of our employees or agents and permit us to secure insurance on behalf of any officer, director, employee or agent for any liability arising out of his or her action in that capacity, whether or not Delaware law would otherwise permit indemnification.
Prior to the completion of this offering, we expect to enter into indemnification agreements with each of our directors and executive officers and certain other key employees, a form of which is attached as Exhibit 10.1. The form of agreement will provide that we will indemnify each of our directors, executive officers and such other key employees against any and all expenses incurred by that director, executive officer or other key employee because of his or her status as one of our directors, executive officers or other key employees, to the fullest extent permitted by Delaware law, our amended and restated certificate of incorporation and our amended and restated bylaws (except in a proceeding initiated by such person without board approval). In addition, the form agreement provides that, to the fullest extent permitted by Delaware law, we will advance all expenses incurred by our directors, executive officers and other key employees in connection with a legal proceeding.
Insofar as indemnification for liabilities arising under the Securities Act may be permitted to our directors, officers or persons controlling us pursuant to the foregoing provisions, we have been informed that, in the opinion of the SEC, such indemnification is against public policy as expressed in the Securities Act and is therefore unenforceable.
Reference is made to Section 6(b) of the underwriting agreement contained in Exhibit 1.1 to this registration statement, indemnifying our directors and officers against limited liabilities. In addition, Section 1.9 of our investors’ rights agreement contained in Exhibit 4.3 to this registration statement provides for indemnification of certain of our stockholders against liabilities described in our investors’ rights agreement.
We maintain directors’ and officers’ liability insurance for our officers and directors.
| Item 15. | Recent Sales of Unregistered Securities |
In the three years preceding the filing of this registration statement, we have issued the following securities that were not registered under the Securities Act:
1. Since January 1, 2008, we granted stock options to purchase an aggregate of 7,111,566 shares of our common stock at exercise prices ranging from $1.20 to $2.98 per share (on a post-split basis) to executive officers, employees, consultants, directors and other service providers under our 2006 Stock Plan. On February 26, 2008 we re-priced the then-outstanding options held by employees and service providers with an exercise price of $2.466667 per share (on a post-split basis) to an exercise price of $2.00 per share (on a post-split basis). On June 10, 2009, we re-priced the then-outstanding options held by employees and service providers with exercise prices of $2.00 (on a post-split basis) and $1.99 to an exercise price of $1.26 per share.
2. Since January 1, 2008, we issued and sold an aggregate of 2,276,633 shares of our common stock for aggregate consideration of approximately $86,323.87 upon the exercise of stock options that were granted under our 2000 Stock Plan.
3. Since January 1, 2008, we issued and sold an aggregate of 265,848 shares of our common stock for aggregate consideration of approximately $285,457.51 upon the exercise of stock options and stock awards that were granted under our 2006 Stock Plan.
The sale of securities described in Items 15(1) through (3) were deemed to be exempt from registration under the Securities Act in reliance upon Rule 701 promulgated under the Securities Act, except to the extent they included options granted to directors and executive officers, which were deemed to be exempt under
II-2
Table of Contents
Section 4(2) of the Securities Act because they are “accredited investors” as defined in Rule 501 of Regulation D promulgated under the Securities Act. The recipients of securities in each transaction represented their intentions to acquire the securities for investment only and not with a view to or for sale in connection with any distribution and appropriate legends were affixed to the share certificates issued in these transactions.
| Item 16. | Exhibits and Financial Statement Schedules |
(a) Exhibits
| Exhibit No. |
Description | |
| 1.1* | Form of Underwriting Agreement | |
| 3.1† | Fourth Amended and Restated Certificate of Incorporation | |
| 3.2* | Form of Fifth Amended and Restated Certificate of Incorporation to be effective upon closing | |
| 3.3† | Amended and Restated Bylaws | |
| 3.4* | Form of Amended and Restated Bylaws to be effective upon closing | |
| 4.1† | Reference is made to Exhibits 3.1, 3.2, 3.3 and 3.4 | |
| 4.2* | Form of certificate for common stock | |
| 4.3† | Third Amended and Restated Investors’ Rights Agreement by and among Synacor, Inc., certain stockholders and the investors listed on the signature pages thereto | |
| 4.4† | Third Amended and Restated Stock Restriction, First Refusal and Co-Sale Agreement by and among Synacor, Inc., certain stockholders and the investors listed on the signature pages thereto | |
| 4.5† | Third Amended and Restated Voting Agreement by and among Synacor, Inc., certain stockholders and the investors listed on the signature pages thereto | |
| 5.1* | Opinion of Gunderson Dettmer Stough Villeneuve Franklin & Hachigian, LLP | |
| 10.1† | Form of Indemnification Agreement between the Registrant and each of its directors and executive officers and certain key employees | |
| 10.2.1† | 2000 Stock Plan | |
| 10.2.2† | Amendment to 2000 Stock Plan, adopted September 30, 2004 | |
| 10.2.3† | Amendment to 2000 Stock Plan, adopted June 9, 2006 | |
| 10.2.4† | Amendment to 2000 Stock Plan, adopted October 19, 2006 | |
| 10.2.5† | Amendment to 2000 Stock Plan, adopted July 31, 2008 | |
| 10.3.1† | 2006 Stock Plan | |
| 10.3.2† | Amendment No. 1 to 2006 Stock Plan | |
| 10.3.3† | Amendment No. 2 to 2006 Stock Plan | |
| 10.3.4† | Amendment No. 3 to 2006 Stock Plan | |
| 10.3.5† | Amendment No. 4 to 2006 Stock Plan | |
| 10.3.6† | Amendment No. 5 to 2006 Stock Plan | |
| 10.3.7† | Amendment No. 6 to 2006 Stock Plan | |
| 10.4* | 2012 Equity Incentive Plan | |
| 10.5.1† | Letter Agreement dated July 31, 2007 with Ronald N. Frankel | |
II-3
Table of Contents
| Exhibit No. |
Description | |
| 10.5.2 | Severance Agreement with Ronald N. Frankel | |
| 10.6† | Letter Agreement dated October 15, 2010 with Scott A. Bailey | |
| 10.7.1† | Employment and Noncompetition Agreement dated December 22, 2000 between George G. Chamoun and CKMP, Inc. | |
| 10.7.2 | Severance Agreement with George G. Chamoun | |
| 10.8† | Letter Agreement dated August 3, 2011 with William J. Stuart | |
| 10.9.1* | Amended and Restated Master Services Agreement between Charter Communications Operating, LLC and Synacor, Inc. dated as of April 1, 2010 | |
| 10.9.2* | Amendment #1 to Amended and Restated Master Services Agreement between Charter Communications Operating, LLC and Synacor, Inc. dated as of October 1, 2010 | |
| 10.9.3* | Amendment #2 to Amended and Restated Master Services Agreement between Charter Communications Operating, LLC and Synacor, Inc. dated as of May 25, 2011 | |
| 10.9.4* | Amendment #3 to Amended and Restated Master Services Agreement between Charter Communications Operating, LLC and Synacor, Inc. dated as of December 9, 2011 | |
| 10.10* | Master Services Agreement between Qwest Corporation and Synacor, Inc. dated as of July 1, 2010 | |
| 10.11.1* | Master Services Agreement between Embarq Management Company and Synacor, Inc. dated as of December 4, 2006 | |
| 10.11.2* | Contract Order between Embarq Management Company and Synacor, Inc. dated as of December 4, 2006. | |
| 10.11.3* | Amendment to Contract Order between Embarq Management Company and Synacor, Inc. dated as of December 19, 2007 | |
| 10.11.4* | Second Amendment to Contract Order between Embarq Management Company and Synacor, Inc. dated as of February 6, 2008 | |
| 10.11.5* | Third Amendment to Contract Order between Embarq Management Company and Synacor, Inc. dated as of December 17, 2007 | |
| 10.11.6* | Fourth Amendment to Contract Order between Embarq Management Company and Synacor, Inc. dated as of April 15, 2008 | |
| 10.11.7* | Fifth Amendment to Contract Order between Embarq Management Company and Synacor, Inc. dated as of March 12, 2009 | |
| 10.11.8* | Sixth Amendment to Contract Order between Embarq Management Company and Synacor, Inc. dated as of March 12, 2009 | |
| 10.11.9* | Seventh Amendment to Contract Order between Embarq Management Company and Synacor, Inc. dated as of May 12, 2009 | |
| 10.11.10* | Eighth Amendment to Contract Order between Embarq Management Company and Synacor, Inc. dated as of August 11, 2009 | |
| 10.11.11* | Amendment #9 to Master Services Agreement between Embarq Management Company and Synacor, Inc. dated as of January 28, 2010 | |
| 10.11.12* | Amendment #10 to Master Services Agreement between Embarq Management Company and Synacor, Inc. dated as of February 12, 2010 | |
| 10.11.13* | Amendment #11 to Master Services Agreement between Embarq Management Company and Synacor, Inc. dated as of February 24, 2010 | |
| 10.11.14* | Amendment #12 to Master Services Agreement between Embarq Management Company and Synacor, Inc. dated as of March 5, 2010 | |
| 10.11.15* | Amendment #13 to Master Services Agreement between Embarq Management Company and Synacor, Inc. dated as of September 22, 2010 | |
II-4
Table of Contents
| Exhibit No. |
Description | |
| 10.11.16* | Amendment #14 to Master Services Agreement between Embarq Management Company and Synacor, Inc. dated as of July 25, 2011 | |
| 10.11.17* | Amendment #15 to Master Services Agreement between Embarq Management Company and Synacor, Inc. dated as of August 31, 2011 | |
| 10.11.18* | Amendment #16 to Master Services Agreement between Embarq Management Company and Synacor, Inc. dated as of October 1, 2011 | |
| 10.11.19* | Amendment #17 to Master Services Agreement between Embarq Management Company and Synacor, Inc. dated as of October 1, 2011 | |
| 10.12* | Master Services and Linking Agreement between Toshiba America Information Systems, Inc. and Synacor, Inc. dated as of July 1, 2010 | |
| 10.13.1* | Google Services Agreement between Google Inc. and Synacor, Inc. dated as of March 1, 2011 | |
| 10.13.2* | Amendment Number One to Google Services Agreement between Google Inc. and Synacor, Inc. dated as of July 1, 2011 | |
| 10.14.1† | Sublease dated March 3, 2006 between Ludlow Technical Products Corporation and Synacor, Inc. | |
| 10.14.2† | First Amendment to Sublease dated as of September 25, 2006 | |
| 10.14.3† | Second Amendment to Sublease dated as of February 27, 2007 | |
| 23.1 | Consent of Deloitte & Touche LLP | |
| 23.2 | Consent of Anvil Advisors, LLC | |
| 23.3* | Consent of Gunderson Dettmer Stough Villeneuve Franklin & Hachigian, LLP (contained in Exhibit 5.1). | |
| 24.1† | Power of Attorney (contained in the signature page of the original filing) | |
| 24.2 | Power of Attorney from Marwan Fawaz and Gary L. Ginsberg (contained in the signature page to this registration statement) | |
Notes:
| * | To be filed by amendment. |
| † | Previously filed. |
(b) Financial Statement Schedules
| Item 17. | Undertakings |
Insofar as indemnification for liabilities arising under the Securities Act may be permitted to directors, officers and controlling persons of the registrant pursuant to the foregoing provisions, or otherwise, the registrant has been advised that in the opinion of the SEC such indemnification is against public policy as expressed in the Securities Act and is, therefore, unenforceable. In the event that a claim for indemnification against such liabilities (other than the payment by the registrant of expenses incurred or paid by a director, officer or controlling person of the registrant in the successful defense of any action, suit or proceeding) is asserted by such director, officer or controlling person in connection with the securities being registered, the registrant will, unless in the opinion of its counsel the matter has been settled by controlling precedent, submit to a court of appropriate jurisdiction the question whether such indemnification by it is against public policy as expressed in the Act and will be governed by the final adjudication of such issue.
The undersigned registrant hereby undertakes that:
1. For purposes of determining any liability under the Securities Act, the information omitted from the form of prospectus filed as part of this registration statement in reliance upon Rule 430A and
II-5
Table of Contents
contained in a form of prospectus filed by the registrant pursuant to Rule 424(b)(1) or (4) or 497(h) under the Securities Act shall be deemed to be part of this registration statement as of the time it was declared effective.
2. For the purpose of determining any liability under the Securities Act, each post-effective amendment that contains a form of prospectus shall be deemed to be a new registration statement relating to the securities offered therein, and the offering of such securities at that time shall be deemed to be the initial bona fide offering thereof.
3. The undersigned registrant hereby undertakes to provide to the underwriters at the closing specified in the underwriting agreement certificates in such denominations and registered in such names as required by the underwriter to permit prompt delivery to each purchaser.
II-6
Table of Contents
SIGNATURES
Pursuant to the requirements of the Securities Act of 1933, as amended, the registrant has duly caused this amendment no. 1 to the registration statement to be signed on its behalf by the undersigned, thereunto duly authorized, in the City of Buffalo, State of New York, on this 22nd day of December, 2011.
| SYNACOR, INC. | ||
| By: | /s/ RONALD N. FRANKEL | |
| Ronald N. Frankel | ||
| President and Chief Executive Officer | ||
II-7
Table of Contents
POWER OF ATTORNEY
In accordance with the requirements of the Securities Act of 1933, as amended, this amendment no. 1 to the registration statement has been signed by Marwan Fawaz and Gary L. Ginsberg in the capacities and on the dates stated. Each of Messrs. Fawaz and Ginsberg constitutes and appoints Ronald N. Frankel and William J. Stuart, and each of them severally, as his or her true and lawful attorney-in-fact and agent, each acting alone with full power of substitution and resubstitution, for him and in his name, place and stead, in any and all capacities, to sign any or all amendments (including post-effective amendments) and exhibits to the Registration Statement on Form S-1, and to any registration statement filed under Commission Rule 462, and to file the same, with all exhibits thereto, and all documents in connection therewith, with the Commission, granting unto said attorney-in-fact and agent, full power and authority to do and perform each and every act and thing requisite and necessary to be done in and about the premises, as fully to all intents and purposes as he might or could do in person, hereby ratifying and confirming all that said attorney-in-fact and agent, or his substitute or substitutes, may lawfully do or cause to be done by virtue hereof.
Pursuant to the requirements of the Securities Act, this amendment no. 1 to the registration statement has been signed by the following persons on behalf of the registrant and in the capacities and on the dates indicated:
| Signature |
Title |
Date | ||
| /s/ RONALD N. FRANKEL Ronald N. Frankel |
President, Chief Executive Officer and Director (Principal Executive Officer) |
December 22, 2011 | ||
| /s/ WILLIAM J. STUART William J. Stuart |
Chief Financial Officer (Principal Financial and Accounting Officer) |
December 22, 2011 | ||
| /s/ MARWAN FAWAZ Marwan Fawaz |
Director |
December 22, 2011 | ||
| /s/ GARY L. GINSBERG Gary L. Ginsberg |
Director |
December 22, 2011 | ||
| * Andrew Kau |
Director |
December 22, 2011 | ||
| * Thomas W. Keaveney |
Director |
December 22, 2011 | ||
| * Jordan Levy |
Director |
December 22, 2011 | ||
| * Mark Morrissette |
Director |
December 22, 2011 | ||
| * Joseph Tzeng |
Director |
December 22, 2011 | ||
| *By: | /s/ RONALD N. FRANKEL | |
| Ronald N. Frankel, attorney-in-fact | ||
II-8
Table of Contents
INDEX TO EXHIBITS
| Exhibit No. |
Description | |
| 1.1* | Form of Underwriting Agreement | |
| 3.1† | Fourth Amended and Restated Certificate of Incorporation | |
| 3.2* | Form of Fifth Amended and Restated Certificate of Incorporation to be effective upon closing | |
| 3.3† | Amended and Restated Bylaws | |
| 3.4* | Form of Amended and Restated Bylaws to be effective upon closing | |
| 4.1† | Reference is made to Exhibits 3.1, 3.2, 3.3 and 3.4 | |
| 4.2* | Form of certificate for common stock | |
| 4.3† | Third Amended and Restated Investors’ Rights Agreement by and among Synacor, Inc., certain stockholders and the investors listed on the signature pages thereto | |
| 4.4† | Third Amended and Restated Stock Restriction, First Refusal and Co-Sale Agreement by and among Synacor, Inc., certain stockholders and the investors listed on the signature pages thereto | |
| 4.5† | Third Amended and Restated Voting Agreement by and among Synacor, Inc., certain stockholders and the investors listed on the signature pages thereto | |
| 5.1* | Opinion of Gunderson Dettmer Stough Villeneuve Franklin & Hachigian, LLP | |
| 10.1† | Form of Indemnification Agreement between the Registrant and each of its directors and executive officers and certain key employees | |
| 10.2.1† | 2000 Stock Plan | |
| 10.2.2† | Amendment to 2000 Stock Plan, adopted September 30, 2004 | |
| 10.2.3† | Amendment to 2000 Stock Plan, adopted June 9, 2006 | |
| 10.2.4† | Amendment to 2000 Stock Plan, adopted October 19, 2006 | |
| 10.2.5† | Amendment to 2000 Stock Plan, adopted July 31, 2008 | |
| 10.3.1† | 2006 Stock Plan | |
| 10.3.2† | Amendment No. 1 to 2006 Stock Plan | |
| 10.3.3† | Amendment No. 2 to 2006 Stock Plan | |
| 10.3.4† | Amendment No. 3 to 2006 Stock Plan | |
| 10.3.5† | Amendment No. 4 to 2006 Stock Plan | |
| 10.3.6† | Amendment No. 5 to 2006 Stock Plan | |
| 10.3.7† | Amendment No. 6 to 2006 Stock Plan | |
| 10.4* | 2012 Equity Incentive Plan | |
| 10.5.1† | Letter Agreement dated July 31, 2007 with Ronald N. Frankel | |
| 10.5.2 | Severance Agreement with Ronald N. Frankel | |
| 10.6† | Letter Agreement dated October 15, 2010 with Scott A. Bailey | |
| 10.7.1† | Employment and Noncompetition Agreement dated December 22, 2000 between George G. Chamoun and CKMP, Inc. | |
| 10.7.2 | Severance Agreement with George G. Chamoun | |
| 10.8† | Letter Agreement dated August 3, 2011 with William J. Stuart | |
Table of Contents
| Exhibit No. |
Description | |
| 10.9.1* | Amended and Restated Master Services Agreement between Charter Communications Operating, LLC and Synacor, Inc. dated as of April 1, 2010 | |
| 10.9.2* | Amendment #1 to Amended and Restated Master Services Agreement between Charter Communications Operating, LLC and Synacor, Inc. dated as of October 1, 2010 | |
| 10.9.3* | Amendment #2 to Amended and Restated Master Services Agreement between Charter Communications Operating, LLC and Synacor, Inc. dated as of May 25, 2011 | |
| 10.9.4* | Amendment #3 to Amended and Restated Master Services Agreement between Charter Communications Operating, LLC and Synacor, Inc. dated as of December 9, 2011 | |
| 10.10* | Master Services Agreement between Qwest Corporation and Synacor, Inc. dated as of July 1, 2010 | |
| 10.11.1* | Master Services Agreement between Embarq Management Company and Synacor, Inc. dated as of December 4, 2006 | |
| 10.11.2* | Contract Order between Embarq Management Company and Synacor, Inc. dated as of December 4, 2006. | |
| 10.11.3* | Amendment to Contract Order between Embarq Management Company and Synacor, Inc. dated as of December 19, 2007 | |
| 10.11.4* | Second Amendment to Contract Order between Embarq Management Company and Synacor, Inc. dated as of February 6, 2008 | |
| 10.11.5* | Third Amendment to Contract Order between Embarq Management Company and Synacor, Inc. dated as of December 17, 2007 | |
| 10.11.6* | Fourth Amendment to Contract Order between Embarq Management Company and Synacor, Inc. dated as of April 15, 2008 | |
| 10.11.7* | Fifth Amendment to Contract Order between Embarq Management Company and Synacor, Inc. dated as of March 12, 2009 | |
| 10.11.8* | Sixth Amendment to Contract Order between Embarq Management Company and Synacor, Inc. dated as of March 12, 2009 | |
| 10.11.9* | Seventh Amendment to Contract Order between Embarq Management Company and Synacor, Inc. dated as of May 12, 2009 | |
| 10.11.10* | Eighth Amendment to Contract Order between Embarq Management Company and Synacor, Inc. dated as of August 11, 2009 | |
| 10.11.11* | Amendment #9 to Master Services Agreement between Embarq Management Company and Synacor, Inc. dated as of January 28, 2010 | |
| 10.11.12* | Amendment #10 to Master Services Agreement between Embarq Management Company and Synacor, Inc. dated as of February 12, 2010 | |
| 10.11.13* | Amendment #11 to Master Services Agreement between Embarq Management Company and Synacor, Inc. dated as of February 24, 2010 | |
| 10.11.14* | Amendment #12 to Master Services Agreement between Embarq Management Company and Synacor, Inc. dated as of March 5, 2010 | |
| 10.11.15* | Amendment #13 to Master Services Agreement between Embarq Management Company and Synacor, Inc. dated as of September 22, 2010 | |
| 10.11.16* | Amendment #14 to Master Services Agreement between Embarq Management Company and Synacor, Inc. dated as of July 25, 2011 | |
| 10.11.17* | Amendment #15 to Master Services Agreement between Embarq Management Company and Synacor, Inc. dated as of August 31, 2011 | |
Table of Contents
| Exhibit No. |
Description | |
| 10.11.18* | Amendment #16 to Master Services Agreement between Embarq Management Company and Synacor, Inc. dated as of October 1, 2011 | |
| 10.11.19* | Amendment #17 to Master Services Agreement between Embarq Management Company and Synacor, Inc. dated as of October 1, 2011 | |
| 10.12* | Master Services and Linking Agreement between Toshiba America Information Systems, Inc. and Synacor, Inc. dated as of July 1, 2010 | |
| 10.13.1* | Google Services Agreement between Google Inc. and Synacor, Inc. dated as of March 1, 2011 | |
| 10.13.2* | Amendment Number One to Google Services Agreement between Google Inc. and Synacor, Inc. dated as of July 1, 2011 | |
| 10.14.1† | Sublease dated March 3, 2006 between Ludlow Technical Products Corporation and Synacor, Inc. | |
| 10.14.2† | First Amendment to Sublease dated as of September 25, 2006 | |
| 10.14.3† | Second Amendment to Sublease dated as of February 27, 2007 | |
| 23.1 | Consent of Deloitte & Touche LLP | |
| 23.2 | Consent of Anvil Advisors, LLC | |
| 23.3* | Consent of Gunderson Dettmer Stough Villeneuve Franklin & Hachigian, LLP (contained in Exhibit 5.1). | |
| 24.1† | Power of Attorney (contained in the signature page of the original filing) | |
| 24.2 | Power of Attorney from Marwan Fawaz and Gary L. Ginsberg (contained in the signature page to this registration statement) | |
Notes:
| * | To be filed by amendment. |
| † | Previously filed. |