Attached files
| file | filename |
|---|---|
| 8-K - 8-K - Aquilex Holdings LLC | d273078d8k.htm |
Exhibit 99.1

Exhibit 99.1
October 2011
Selected pages for the bondholders
Executive summary
Executive summary
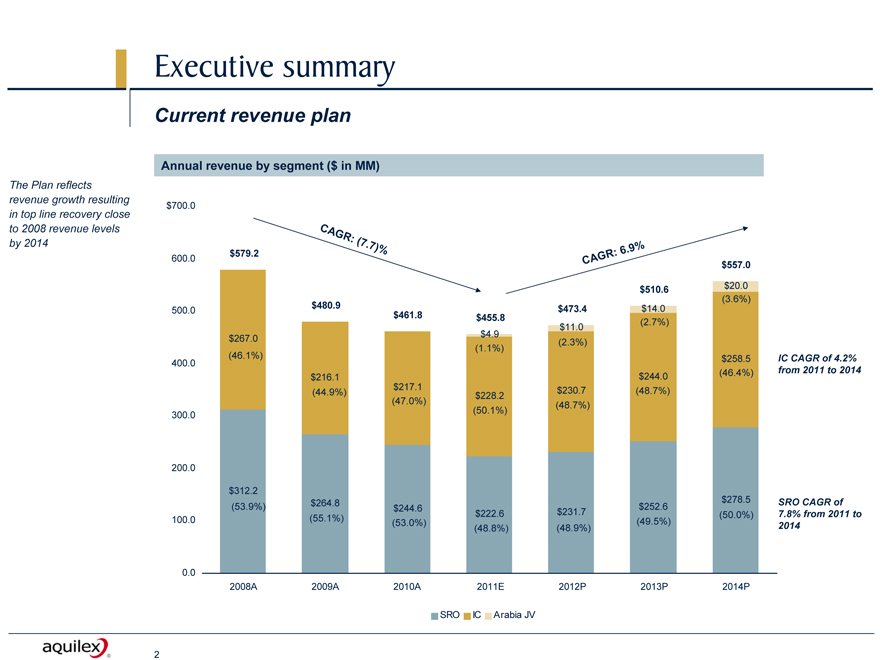
Current revenue plan
Annual revenue by segment ($ in MM)
The Plan reflects revenue growth resulting in top line recovery close to 2008 revenue levels by 2014
Annual revenue by segment ($ in MM)
$700.0
CAGR: (7.7)%
600.0 $579.2 CAGR:6.9%
$557.0
$510.6 $20.0
$480.9 (3.6%)
500.0 $473.4 $14.0
$461.8 $455.8 (2.7%)
$11.0
$4.9
$267.0 (2.3%)
(1.1%)
(46.1%) $258.5 IC CAGR of 4.2%
400.0
$216.1 $244.0 (46.4%) from 2011 to 2014
(44.9%) $217.1 $230.7 (48.7%)
$228.2
(47.0%) (48.7%)
300.0 (50.1%)
200.0
$312.2
$264.8 $278.5 SRO CAGR of
(53.9%) $244.6 $252.6
$222.6 $231.7 (50.0%) 7.8% from 2011 to
100.0 (55.1%) (53.0%) (48.8%) (48.9%) (49.5%) 2014
0.0
2008A 2009A 2010A 2011E 2012P 2013P 2014P
SRO IC Arabia JV
2
Executive summary
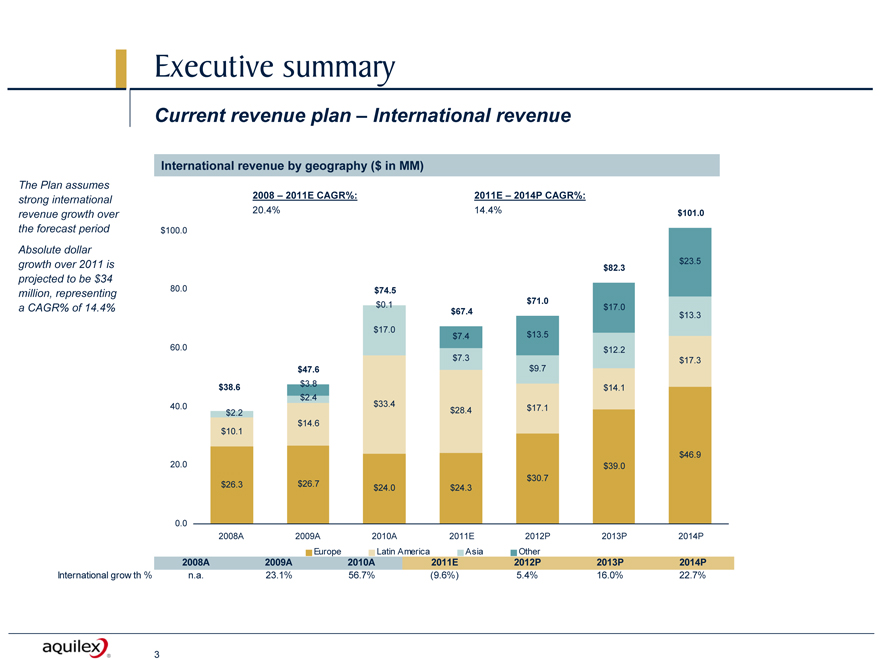
Current revenue plan – International revenue
International revenue by geography ($ in MM)
The Plan assumes strong international revenue growth over the forecast period Absolute dollar growth over 2011 is projected to be $34 million, representing a CAGR% of 14.4%
2008 – 2011E CAGR%: 2011E – 2014P CAGR%:
20.4% 14.4% $101.0
$100.0
$23.5
$82.3
80.0 $74.5
$0.1 $71.0 $17.0
$67.4 $13.3
$17.0 $7.4 $13.5
60.0 $12.2
$7.3 $17.3
$47.6 $9.7
$38.6 $3.8 $14.1
$2.4
40.0 $2.2 $33.4 $28.4 $17.1
$14.6
$10.1
$46.9
20.0 $39.0
$30.7
$26.3 $26.7 $24.0 $24.3
0.0
2008A 2009A 2010A 2011E 2012P 2013P 2014P
Europe Latin America Asia Other
2008A 2009A 2010A 2011E 2012P 2013P 2014P
n.a. 23.1% 56.7% (9.6%) 5.4% 16.0% 22.7%
International growth %
| 3 |
|
Executive summary
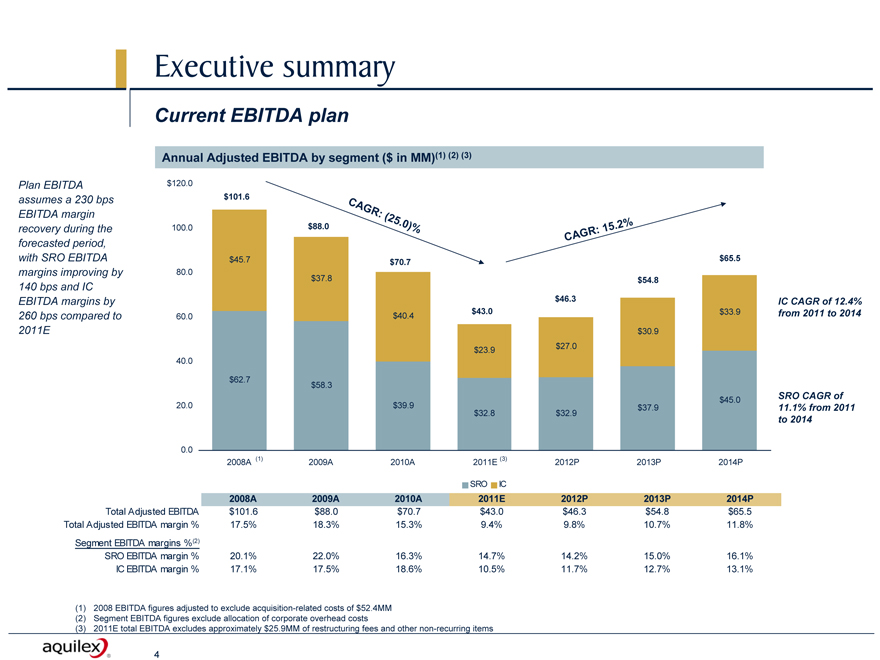
Current EBITDA plan
Annual Adjusted EBITDA by segment ($ in MM)(1) (2) (3)
Plan EBITDA assumes a 230 bps EBITDA margin recovery during the forecasted period, with SRO EBITDA margins improving by 140 bps and IC EBITDA margins by 260 bps compared to 2011E
$120.0
$101.6
CAGR: (25.0)%
100.0 $88.0 CAGR: 15.2%
$45.7 $70.7 $65.5
80.0
$37.8 $54.8
$46.3
60.0 $40.4 $43.0 $33.9
$30.9
$23.9 $27.0
40.0
$62.7 $58.3
$45.0
20.0 $39.9 $37.9
$32.8 $32.9
0.0
2008A (1) 2009A 2010A 2011E (3) 2012P 2013P 2014P
IC CAGR of 12.4% from 2011 to 2014
SRO CAGR of 11.1% from 2011 to 2014
SRO IC
2008A 2009A 2010A 2011E 2012P 2013P 2014P
Total Adjusted EBITDA $101.6 $88.0 $70.7 $43.0 $46.3 $54.8 $65.5
Total Adjusted EBITDA margin % 17.5% 18.3% 15.3% 9.4% 9.8% 10.7% 11.8%
Segment EBITDA margins %(2)
SRO EBITDA margin % 20.1% 22.0% 16.3% 14.7% 14.2% 15.0% 16.1%
IC EBITDA margin % 17.1% 17.5% 18.6% 10.5% 11.7% 12.7% 13.1%
(1) 2008 EBITDA figures adjusted to exclude acquisition-related costs of $52.4MM (2) Segment EBITDA figures exclude allocation of corporate overhead costs
| (3) |
|
2011E total EBITDA excludes approximately $25.9MM of restructuring fees and other non-recurring items |
| 4 |
|
Executive summary
Gross margin plan
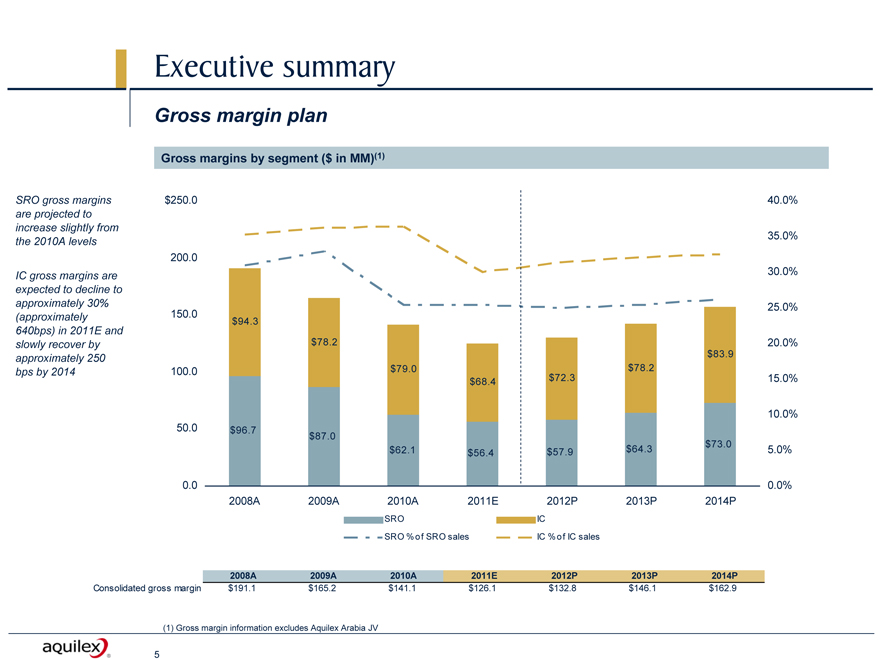
Gross margins by segment ($ in MM)(1)
SRO gross margins are projected to increase slightly from the 2010A levels
IC gross margins are expected to decline to approximately 30% (approximately 640bps) in 2011E and slowly recover by approximately 250 bps by 2014
$250.0 40.0%
35.0%
200.0
30.0%
150.0 25.0%
$94.3
$78.2 20.0%
$83.9
100.0 $79.0 $78.2
$68.4 $72.3 15.0%
10.0%
50.0 $96.7 $87.0
$73.0
$62.1 $56.4 $57.9 $64.3 5.0%
0.0 0.0%
2008A 2009A 2010A 2011E 2012P 2013P 2014P
SRO % of SRO sales IC % of IC sales
2008A 2009A 2010A 2011E 2012P 2013P 2014P
Consolidated gross margin $191.1 $165.2 $141.1 $126.1 $132.8 $146.1 $162.9
| (1) |
|
Gross margin information excludes Aquilex Arabia JV |
| 5 |
|
Executive summary
SG&A expense projection
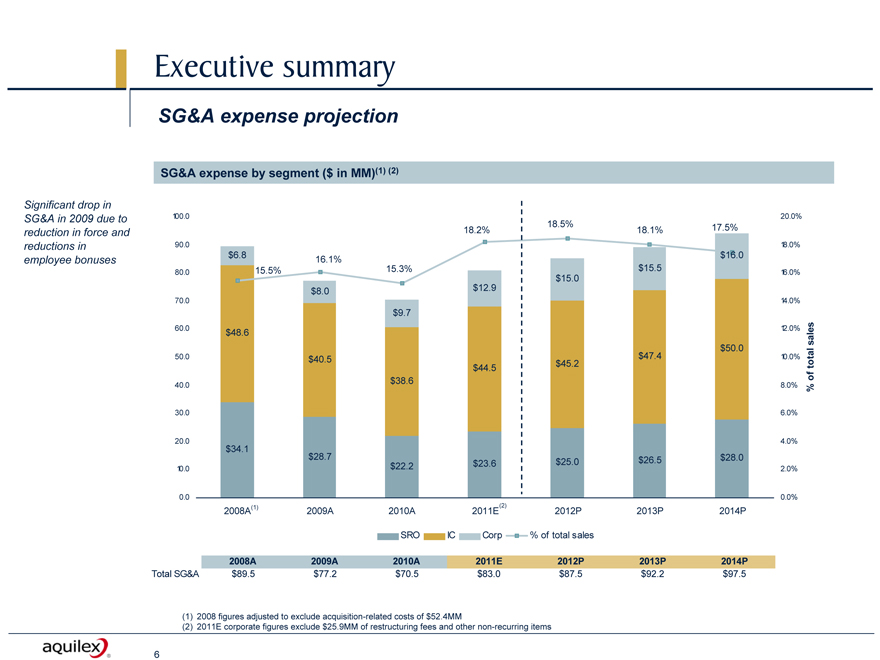
SG&A expense by segment ($ in MM)(1) (2)
Significant drop in SG&A in 2009 due to reduction in force and reductions in employee bonuses
100.0 20.0%
18.2% 18.5% 18.1% 17.5%
90.0 18.0%
$6.8 $16.0
16.1%
80.0 15.5% 15.3% $15.5 16.0%
$15.0
$8.0 $12.9
70.0 14.0%
$9.7
60.0 $48.6 12.0% sales
$50.0
$47.4
50.0 $40.5 $45.2 10.0% total
$44.5
$38.6 of
40.0 8.0% %
30.0 6.0%
20.0 4.0%
$34.1
$28.7 $22.2 $23.6 $25.0 $26.5 $28.0
10.0 2.0%
0.0 0.0%
2008A(1) 2009A 2010A 2011E(2) 2012P 2013P 2014P
SRO IC Corp % of total sales
2008A 2009A 2010A 2011E 2012P 2013P 2014P
Total SG&A $89.5 $77.2 $70.5 $83.0 $87.5 $92.2 $97.5
| (1) |
|
2008 figures adjusted to exclude acquisition-related costs of $52.4MM |
| (2) |
|
2011E corporate figures exclude $25.9MM of restructuring fees and other non-recurring items |
| 6 |
|
Executive summary
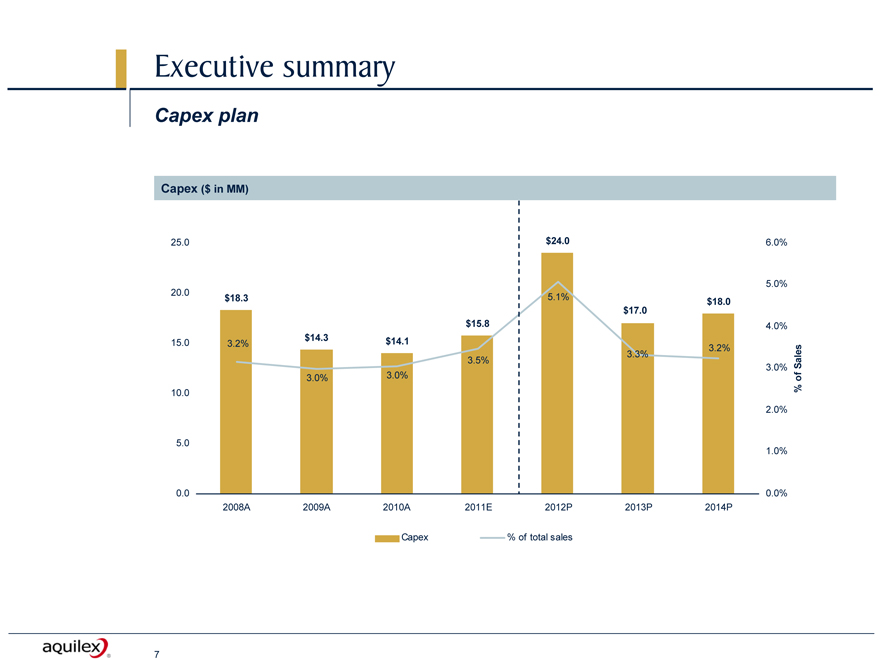
Capex plan
Capex ($ in MM)
25.0 20.0 15.0 10.0 5.0 0.0
$24.0
$18.3 5.1%
$17.0 $18.0
$15.8
$14.3 $14.1
3.2%
3.2%
3.3%
3.5%
3.0% 3.0%
2008A 2009A 2010A 2011E 2012P 2013P 2014P
6.0% 5.0% 4.0% 3.0% 2.0% 1.0% 0.0%
% of Sales
Capex % of total sales
| 7 |
|
Appendix
Appendix
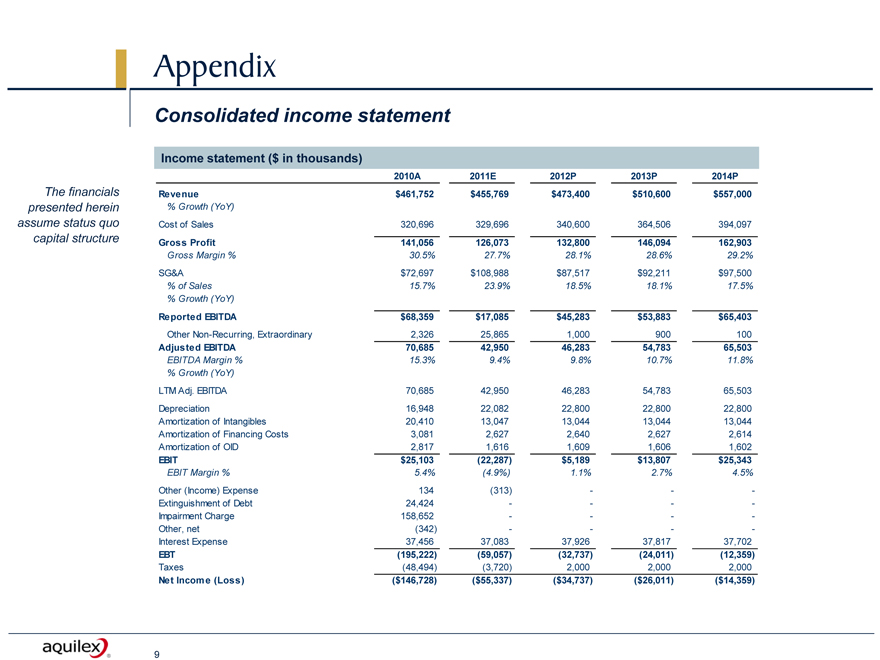
Consolidated income statement
The financials presented herein assume status quo capital structure
Income statement ($ in thousands)
2010A 2011E 2012P 2013P 2014P
Revenue $461,752 $455,769 $473,400 $510,600 $557,000
% Growth (YoY)
Cost of Sales 320,696 329,696 340,600 364,506 394,097
Gross Profit 141,056 126,073 132,800 146,094 162,903
Gross Margin % 30.5% 27.7% 28.1% 28.6% 29.2%
SG&A $72,697 $108,988 $87,517 $92,211 $97,500
% of Sales 15.7% 23.9% 18.5% 18.1% 17.5%
% Growth (YoY)
Reported EBITDA $68,359 $17,085 $45,283 $53,883 $65,403
Other Non-Recurring, Extraordinary 2,326 25,865 1,000 900 100
Adjusted EBITDA 70,685 42,950 46,283 54,783 65,503
EBITDA Margin % 15.3% 9.4% 9.8% 10.7% 11.8%
% Growth (YoY)
LTM Adj. EBITDA 70,685 42,950 46,283 54,783 65,503
Depreciation 16,948 22,082 22,800 22,800 22,800
Amortization of Intangibles 20,410 13,047 13,044 13,044 13,044
Amortization of Financing Costs 3,081 2,627 2,640 2,627 2,614
Amortization of OID 2,817 1,616 1,609 1,606 1,602
EBIT $25,103 (22,287) $5,189 $13,807 $25,343
EBIT Margin % 5.4% (4.9%) 1.1% 2.7% 4.5%
Other (Income) Expense 134 (313) - - -
Extinguishment of Debt 24,424 - - -
Impairment Charge 158,652 - - -
Other, net (342) - - -
Interest Expense 37,456 37,083 37,926 37,817 37,702
EBT (195,222) (59,057) (32,737) (24,011) (12,359)
Taxes (48,494) (3,720) 2,000 2,000 2,000
Net Income (Loss) ($146,728) ($55,337) ($34,737) ($26,011) ($14,359)
9
450276
Appendix
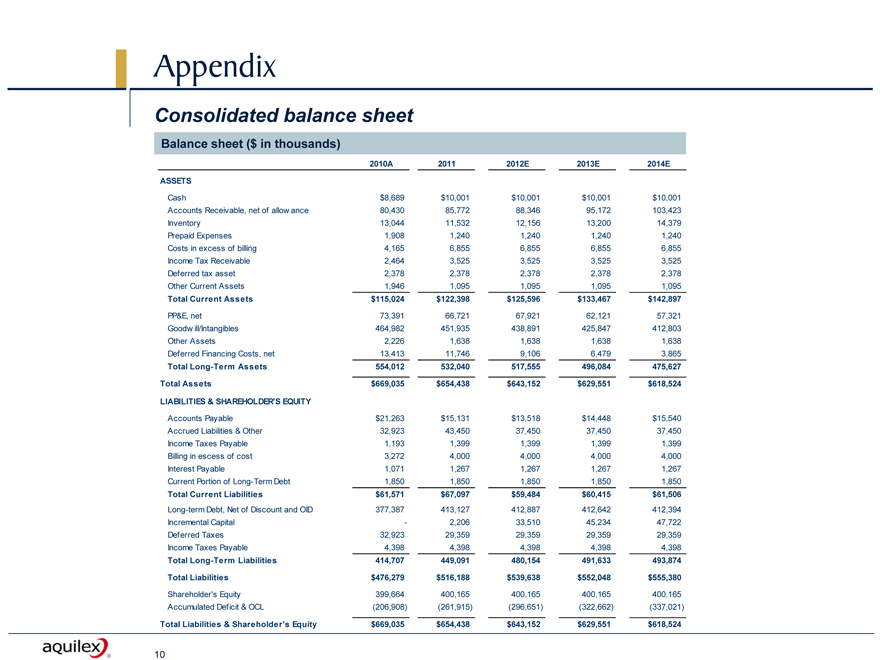
Consolidated balance sheet
Balance sheet ($ in thousands)
2010A 2011 2012E 2013E 2014E
ASSETS
Cash $8,689 $10,001 $10,001 $10,001 $10,001
Accounts Receivable, net of allowance 80,430 85,772 88,346 95,172 103,423
Inventory 13,044 11,532 12,156 13,200 14,379
Prepaid Expenses 1,908 1,240 1,240 1,240 1,240
Costs in excess of billing 4,165 6,855 6,855 6,855 6,855
Income Tax Receivable 2,464 3,525 3,525 3,525 3,525
Deferred tax asset 2,378 2,378 2,378 2,378 2,378
Other Current Assets 1,946 1,095 1,095 1,095 1,095
Total Current Assets $115,024 $122,398 $125,596 $133,467 $142,897
PP&E, net 73,391 66,721 67,921 62,121 57,321
Goodwill/Intangibles 464,982 451,935 438,891 425,847 412,803
Other Assets 2,226 1,638 1,638 1,638 1,638
Deferred Financing Costs, net 13,413 11,746 9,106 6,479 3,865
Total Long-Term Assets 554,012 532,040 517,555 496,084 475,627
Total Assets $669,035 $654,438 $643,152 $629,551 $618,524
LIABILITIES & SHAREHOLDER’S EQUITY
Accounts Payable $21,263 $15,131 $13,518 $14,448 $15,540
Accrued Liabilities & Other 32,923 43,450 37,450 37,450 37,450
Income Taxes Payable 1,193 1,399 1,399 1,399 1,399
Billing in escess of cost 3,272 4,000 4,000 4,000 4,000
Interest Payable 1,071 1,267 1,267 1,267 1,267
Current Portion of Long-Term Debt 1,850 1,850 1,850 1,850 1,850
Total Current Liabilities $61,571 $67,097 $59,484 $60,415 $61,506
Long-term Debt, Net of Discount and OID 377,387 413,127 412,887 412,642 412,394
Incremental Capital — 2,206 33,510 45,234 47,722
Deferred Taxes 32,923 29,359 29,359 29,359 29,359
Income Taxes Payable 4,398 4,398 4,398 4,398 4,398
Total Long-Term Liabilities 414,707 449,091 480,154 491,633 493,874
Total Liabilities $476,279 $516,188 $539,638 $552,048 $555,380
Shareholder’s Equity 399,664 400,165 400,165 400,165 400,165
Accumulated Deficit & OCL (206,908) (261,915) (296,651) (322,662) (337,021)
Total Liabilities & Shareholder’s Equity $669,035 $654,438 $643,152 $629,551 $618,524
10
Appendix
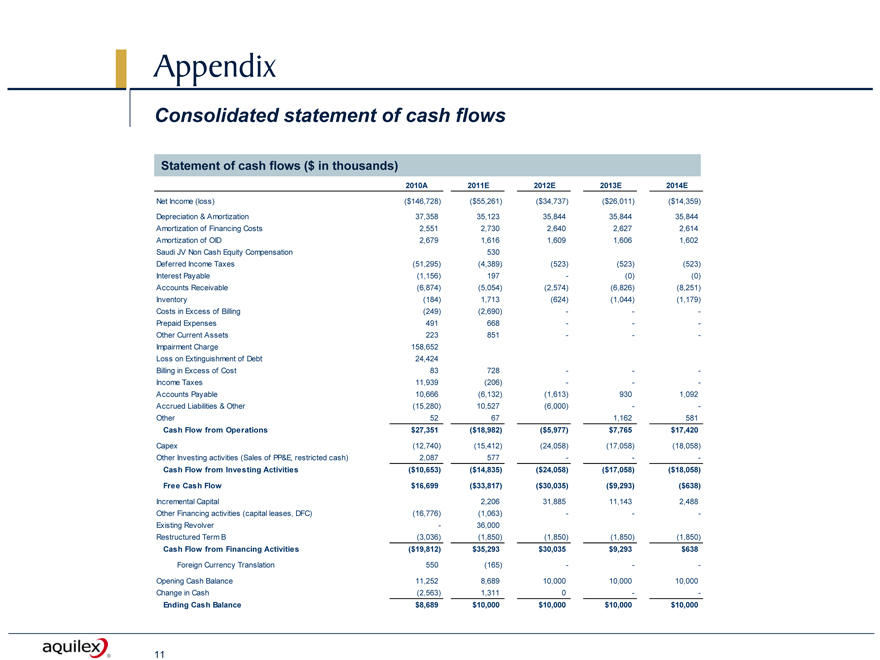
Consolidated statement of cash flows
Statement of cash flows ($ in thousands)
2010A 2011E 2012E 2013E 2014E
Net Income (loss) ($146,728) ($55,261) ($34,737) ($26,011) ($14,359)
Depreciation & Amortization 37,358 35,123 35,844 35,844 35,844
Amortization of Financing Costs 2,551 2,730 2,640 2,627 2,614
Amortization of OID 2,679 1,616 1,609 1,606 1,602
Saudi JV Non Cash Equity Compensation 530
Deferred Income Taxes (51,295) (4,389) (523) (523) (523)
Interest Payable (1,156) 197 - (0) (0)
Accounts Receivable (6,874) (5,054) (2,574) (6,826) (8,251)
Inventory (184) 1,713 (624) (1,044) (1,179)
Costs in Excess of Billing (249) (2,690) - - -
Prepaid Expenses 491 668 - - -
Other Current Assets 223 851 - - -
Impairment Charge 158,652
Loss on Extinguishment of Debt 24,424
Billing in Excess of Cost 83 728 - - -
Income Taxes 11,939 (206) - - -
Accounts Payable 10,666 (6,132) (1,613) 930 1,092
Accrued Liabilities & Other (15,280) 10,527 (6,000) - - -
Other 52 67 1,162 581
Cash Flow from Operations $27,351 ($18,982) ($5,977) $7,765 $17,420
Capex (12,740) (15,412) (24,058) (17,058) (18,058)
Other Investing activities (Sales of PP&E, restricted cash) 2,087 577 - - -
Cash Flow from Investing Activities ($10,653) ($14,835) ($24,058) ($17,058) ($18,058)
Free Cash Flow $16,699 ($33,817) ($30,035) ($9,293) ($638)
Incremental Capital 2,206 31,885 11,143 2,488
Other Financing activities (capital leases, DFC) (16,776) (1,063) - - -
Existing Revolver - 36,000
Restructured Term B (3,036) (1,850) (1,850) (1,850) (1,850)
Cash Flow from Financing Activities ($19,812) $35,293 $30,035 $9,293 $638
Foreign Currency Translation 550 (165) - - -
Opening Cash Balance 11,252 8,689 10,000 10,000 10,000
Change in Cash (2,563) 1,311 0 - - -
Ending Cash Balance $8,689 $10,000 $10,000 $10,000 $10,000
11