Attached files
| file | filename |
|---|---|
| EXCEL - IDEA: XBRL DOCUMENT - RED METAL RESOURCES, LTD. | Financial_Report.xls |
| EX-32 - EXHIBIT 32 - RED METAL RESOURCES, LTD. | ex32.htm |
| EX-31.2 - EXHIBIT 31.2 - RED METAL RESOURCES, LTD. | ex31-2.htm |
| EX-31.1 - EXHIBIT 31.1 - RED METAL RESOURCES, LTD. | ex31-1.htm |
UNITED STATES
SECURITIES AND EXCHANGE COMMISSION
Washington, D.C. 20549
________
FORM 10-Q
________
|
[ X ]
|
QUARTERLY REPORT UNDER SECTION 13 0R 15(d) OF THE SECURITIES EXCHANGE ACT OF 1934
|
For the quarterly period ended: October 31, 2011
|
[ ]
|
TRANSITION REPORT UNDER SECTION 13 0R 15(d) OF THE SECURITIES EXCHANGE ACT OF 1934
|
For the transition period from_______to_______
Commission file number 000-52055
|
RED METAL RESOURCES LTD.
|
|
(Exact name of small business issuer as specified in its charter)
|
|
Nevada
(State or other jurisdiction
of incorporation or organization)
|
20-2138504
(I.R.S. Employer
Identification No.)
|
195 Park Avenue, Thunder Bay Ontario, Canada P7B 1B9
(Address of principal executive offices) (Zip Code)
(807) 345-7384
(Issuer’s telephone number)
Indicate by check mark whether the registrant (1) has filed all reports required to be filed by Section 13 or 15(d) of the Exchange Act during the past 12 months (or for such shorter period that the registrant was required to file such reports), and (2) has been subject to such filing requirements for the past 90 days. [ X ] Yes [ ] No
Indicate by check mark whether the registrant has submitted electronically and posted on its corporate Web site, if any, every Interactive Data File required to be submitted and posted pursuant to Rule 405 of Regulation S-T (§232.405 of this chapter) during the preceding 12 months (or for such shorter period that the registrant was required to submit and post such files). [ X ] Yes [ ] No
Indicate by check mark whether the registrant is a large accelerated filer, an accelerated filer, a non-accelerated filer, or a smaller reporting company. See the definitions of “large accelerated filed,” “accelerated filer” and “smaller reporting company” in Rule 12b-2 of the Exchange Act.
|
Large accelerated filer
|
o
|
Accelerated filer
|
o
|
|
|
Non-accelerated filer
|
o
|
(Do not check if a smaller reporting company)
|
Smaller reporting company
|
x
|
Indicate by check mark whether the registrant is a shell company (as defined in Rule 12b-2 of the Act). [ ] Yes [ X ] No
Indicate the number of shares outstanding of each of the issuer’s classes of common stock, as of the latest practicable date. As of December 12, 2011 the number of shares of the registrant’s common stock outstanding was 17,139,634.
TABLE OF CONTENTS
|
PART I—FINANCIAL INFORMATION
|
3
|
|
ITEM 1. FINANCIAL STATEMENTS.
|
3
|
|
CONSOLIDATED BALANCE SHEETS
|
3
|
|
CONSOLIDATED STATEMENTS OF OPERATIONS
|
4
|
|
CONSOLIDATED STATEMENT OF STOCKHOLDERS' EQUITY
|
5
|
|
CONSOLIDATED STATEMENTS OF CASH FLOWS
|
6
|
|
ITEM 2. MANAGEMENT’S DISCUSSION AND ANALYSIS OF FINANCIAL CONDITION AND RESULTS OF OPERATIONS.
|
12
|
|
ITEM 3. QUANTITATIVE AND QUALITATIVE DISCLOSURES ABOUT MARKET RISK.
|
27
|
|
ITEM 4. CONTROLS AND PROCEDURES.
|
27
|
|
PART II—OTHER INFORMATION
|
27
|
|
ITEM 1. LEGAL PROCEEDINGS.
|
27
|
|
ITEM 1A. RISK FACTORS.
|
27
|
|
ITEM 2. UNREGISTERED SALES OF EQUITY SECURITIES AND USE OF PROCEEDS.
|
27
|
|
ITEM 3. DEFAULTS UPON SENIOR SECURITIES.
|
27
|
|
ITEM 4. (REMOVED AND RESERVED).
|
27
|
|
ITEM 5. OTHER INFORMATION.
|
27
|
|
ITEM 6. EXHIBITS.
|
28
|
2
PART I—FINANCIAL INFORMATION
Item 1. Financial Statements.
RED METAL RESOURCES, LTD.
(AN EXPLORATION STAGE COMPANY)
CONSOLIDATED BALANCE SHEETS
(UNAUDITED)
|
October 31, 2011
|
January 31, 2011
|
|||||||
|
ASSETS
|
||||||||
|
Current assets
|
||||||||
|
Cash
|
$ | 104,029 | $ | 8,655 | ||||
|
Prepaids and other receivables
|
115,197 | 37,572 | ||||||
|
Total current assets
|
219,226 | 46,227 | ||||||
|
Equipment
|
18,178 | - | ||||||
|
Unproved mineral properties
|
886,779 | 662,029 | ||||||
|
Total assets
|
$ | 1,124,183 | $ | 708,256 | ||||
|
LIABILITIES AND STOCKHOLDERS' EQUITY (DEFICIT)
|
||||||||
|
Current liabilities
|
||||||||
|
Accounts payable
|
$ | 168,996 | $ | 196,657 | ||||
|
Accrued liabilities
|
85,192 | 91,990 | ||||||
|
Due to related parties
|
689,779 | 510,111 | ||||||
|
Notes payable to related party
|
170,757 | 113,648 | ||||||
|
Total liabilities
|
1,114,724 | 912,406 | ||||||
|
Stockholders' equity (deficit)
|
||||||||
|
Common stock, $0.001 par value, authorized 500,000,000, 16,939,634 and 10,216,301 issued and outstanding at October 31, 2011 and January 31, 2011
|
16,940 | 10,217 | ||||||
|
Obligation to issue shares
|
60,000 | - | ||||||
|
Additional paid in capital
|
5,424,192 | 2,913,300 | ||||||
|
Deficit accumulated during the exploration stage
|
(5,410,471 | ) | (3,056,819 | ) | ||||
|
Accumulated other comprehensive loss
|
(81,202 | ) | (70,848 | ) | ||||
|
Total stockholders' equity (deficit)
|
9,459 | (204,150 | ) | |||||
|
Total liabilities and stockholders' equity (deficit)
|
$ | 1,124,183 | $ | 708,256 | ||||
The accompanying notes are an integral part of these consolidated financial statements
3
RED METAL RESOURCES LTD.
(AN EXPLORATION STAGE COMPANY)
CONSOLIDATED STATEMENTS OF OPERATIONS
(UNAUDITED)
|
Three months ended
|
Nine months ended
|
From January 10,
|
||||||||||||||||||
|
October 31
|
October 31
|
2005 (Inception) to
|
||||||||||||||||||
|
2011
|
2010
|
2011
|
2010
|
October 31, 2011
|
||||||||||||||||
|
Revenue
|
||||||||||||||||||||
|
Royalties
|
$ | - | $ | - | $ | - | $ | - | $ | 15,658 | ||||||||||
|
Operating Expenses
|
||||||||||||||||||||
|
Administration
|
5,612 | 27,812 | 36,370 | 66,527 | 311,510 | |||||||||||||||
|
Advertising and promotion
|
75,734 | 25,488 | 176,820 | 83,097 | 501,930 | |||||||||||||||
|
Automobile
|
8,179 | 5,709 | 27,843 | 18,346 | 93,562 | |||||||||||||||
|
Bank charges
|
1,009 | 1,068 | 5,142 | 2,854 | 21,754 | |||||||||||||||
|
Consulting fees
|
82,378 | 38,800 | 239,011 | 107,795 | 705,359 | |||||||||||||||
|
Interest on current debt
|
26,687 | 7,978 | 62,134 | 23,870 | 170,928 | |||||||||||||||
|
Mineral exploration costs
|
396,245 | 548 | 849,800 | 13,519 | 1,598,186 | |||||||||||||||
|
Office
|
4,905 | 3,069 | 20,220 | 6,296 | 47,526 | |||||||||||||||
|
Professional development
|
- | - | - | 4,008 | 5,116 | |||||||||||||||
|
Professional fees
|
16,491 | 19,661 | 122,747 | 72,178 | 591,026 | |||||||||||||||
|
Rent
|
3,385 | 3,333 | 10,339 | 9,566 | 52,028 | |||||||||||||||
|
Regulatory
|
8,153 | 425 | 23,551 | 11,865 | 72,197 | |||||||||||||||
|
Travel and entertainment
|
64,534 | 18,299 | 148,304 | 47,007 | 344,970 | |||||||||||||||
|
Salaries, wages and benefits
|
29,250 | 2,161 | 54,276 | 3,168 | 106,958 | |||||||||||||||
|
Stock based compensation
|
559,516 | - | 559,516 | - | 559,516 | |||||||||||||||
|
Foreign exchange loss
|
3,457 | 85 | 14,670 | (530 | ) | 14,969 | ||||||||||||||
|
Write-down of unproved mineral properties
|
- | - | 2,909 | - | 228,594 | |||||||||||||||
|
Total operating expenses
|
1,285,535 | 154,436 | 2,353,652 | 469,566 | 5,426,129 | |||||||||||||||
|
Net loss
|
$ | (1,285,535 | ) | $ | (154,436 | ) | $ | (2,353,652 | ) | $ | (469,566 | ) | $ | (5,410,471 | ) | |||||
|
Net loss per share - basic and diluted
|
$ | (0.08 | ) | $ | (0.02 | ) | $ | (0.15 | ) | $ | (0.05 | ) | ||||||||
|
Weighted average number of shares outstanding - basic and diluted
|
16,939,634 | 10,216,301 | 15,338,840 | 10,099,524 | ||||||||||||||||
The accompanying notes are an integral part of these consolidated financial statements
4
RED METAL RESOURCES LTD.
(AN EXPLORATION STAGE COMPANY)
CONSOLIDATED STATEMENT OF STOCKHOLDERS' EQUITY (DEFICIT)
(UNAUDITED)
|
|
Common Stock Issued
|
Accumulated
|
||||||||||||||||||||||||||
|
|
Additional
|
Common
|
Other
|
|||||||||||||||||||||||||
|
|
Number of
|
Paid-in
|
Stock
|
Accumulated
|
Comprehensive
|
|||||||||||||||||||||||
|
|
Shares
|
Amount
|
Capital
|
Subscribed
|
Deficit
|
Loss
|
Total
|
|||||||||||||||||||||
|
Balance at January 10, 2005 (Inception)
|
- | $ | - | $ | - | $ | - | $ | - | $ | - | $ | - | |||||||||||||||
|
|
||||||||||||||||||||||||||||
|
Net loss
|
- | - | - | - | (825 | ) | - | (825 | ) | |||||||||||||||||||
|
|
||||||||||||||||||||||||||||
|
Balance at January 31, 2005
|
- | - | - | - | (825 | ) | - | (825 | ) | |||||||||||||||||||
|
|
||||||||||||||||||||||||||||
|
Common stock issued for cash
|
5,525,000 | 5,525 | 53,725 | - | - | - | 59,250 | |||||||||||||||||||||
|
Common stock adjustment
|
45 | - | - | - | - | - | - | |||||||||||||||||||||
|
Donated services
|
- | - | 3,000 | - | - | - | 3,000 | |||||||||||||||||||||
|
Net loss
|
- | - | - | - | (12,363 | ) | - | (12,363 | ) | |||||||||||||||||||
|
|
||||||||||||||||||||||||||||
|
Balance at January 31, 2006
|
5,525,045 | 5,525 | 56,725 | - | (13,188 | ) | - | 49,062 | ||||||||||||||||||||
|
|
||||||||||||||||||||||||||||
|
Donated services
|
- | - | 9,000 | - | - | - | 9,000 | |||||||||||||||||||||
|
Net loss
|
- | - | - | - | (43,885 | ) | - | (43,885 | ) | |||||||||||||||||||
|
|
||||||||||||||||||||||||||||
|
Balance at January 31, 2007
|
5,525,045 | 5,525 | 65,725 | - | (57,073 | ) | - | 14,177 | ||||||||||||||||||||
|
|
||||||||||||||||||||||||||||
|
Donated services
|
- | - | 2,250 | - | - | - | 2,250 | |||||||||||||||||||||
|
Return of common stock to treasury
|
(1,750,000 | ) | (1,750 | ) | 1,749 | - | - | - | (1 | ) | ||||||||||||||||||
|
Common stock issued for cash
|
23,810 | 24 | 99,976 | - | - | - | 100,000 | |||||||||||||||||||||
|
Net loss
|
- | - | - | - | (232,499 | ) | - | (232,499 | ) | |||||||||||||||||||
|
|
||||||||||||||||||||||||||||
|
Balance at January 31, 2008
|
3,798,855 | 3,799 | 169,700 | - | (289,572 | ) | - | (116,073 | ) | |||||||||||||||||||
|
|
||||||||||||||||||||||||||||
|
Common stock issued for cash
|
357,147 | 357 | 1,299,643 | - | - | - | 1,300,000 | |||||||||||||||||||||
|
Net loss
|
- | - | - | - | (1,383,884 | ) | - | (1,383,884 | ) | |||||||||||||||||||
|
Foreign exchange loss
|
- | - | - | - | - | (21,594 | ) | (21,594 | ) | |||||||||||||||||||
|
Balance at January 31, 2009
|
4,156,002 | 4,156 | 1,469,343 | - | (1,673,456 | ) | (21,594 | ) | (221,551 | ) | ||||||||||||||||||
|
Common stock issued for cash
|
1,678,572 | 1,678 | 160,822 | - | - | - | 162,500 | |||||||||||||||||||||
|
Common stock issued for debt
|
3,841,727 | 3,843 | 1,148,675 | - | - | - | 1,152,518 | |||||||||||||||||||||
|
Net loss
|
- | - | - | - | (710,745 | ) | - | (710,745 | ) | |||||||||||||||||||
|
Foreign exchange loss
|
- | - | - | - | - | (35,816 | ) | (35,816 | ) | |||||||||||||||||||
|
|
||||||||||||||||||||||||||||
|
Balance at January 31, 2010
|
9,676,301 | 9,677 | 2,778,840 | - | (2,384,201 | ) | (57,410 | ) | 346,906 | |||||||||||||||||||
|
Common stock issued for cash
|
540,000 | 540 | 134,460 | - | - | - | 135,000 | |||||||||||||||||||||
|
Net loss
|
- | - | - | - | (469,566 | ) | - | (469,566 | ) | |||||||||||||||||||
|
Foreign exchange loss
|
- | - | - | - | - | (9,450 | ) | (9,450 | ) | |||||||||||||||||||
|
Balance at October 31, 2010
|
10,216,301 | 10,217 | 2,913,300 | - | (2,853,767 | ) | (66,860 | ) | 2,890 | |||||||||||||||||||
|
Common stock issued for cash
|
- | - | - | - | - | - | - | |||||||||||||||||||||
|
Net loss
|
- | - | - | - | (203,052 | ) | - | (203,052 | ) | |||||||||||||||||||
|
Foreign exchange loss
|
- | - | - | - | - | (3,988 | ) | (3,988 | ) | |||||||||||||||||||
|
Balance at January 31, 2011
|
10,216,301 | 10,217 | 2,913,300 | - | (3,056,819 | ) | (70,848 | ) | (204,150 | ) | ||||||||||||||||||
|
Common stock issued for cash
|
6,290,000 | 6,290 | 1,821,809 | - | - | - | 1,828,099 | |||||||||||||||||||||
|
Common stock issued for debt
|
433,333 | 433 | 129,567 | - | - | - | 130,000 | |||||||||||||||||||||
|
Obligation to issue shares
|
- | - | - | 60,000 | - | - | 60,000 | |||||||||||||||||||||
|
Stock options
|
- | - | 559,516 | - | - | - | 559,516 | |||||||||||||||||||||
|
Net loss
|
- | - | - | - | (2,353,652 | ) | - | (2,353,652 | ) | |||||||||||||||||||
|
Foreign exchange loss
|
- | - | - | - | - | (10,354 | ) | (10,354 | ) | |||||||||||||||||||
|
Balance at October 31, 2011
|
16,939,634 | $ | 16,940 | $ | 5,424,192 | $ | 60,000 | $ | (5,410,471 | ) | $ | (81,202 | ) | $ | 9,459 | |||||||||||||
The accompanying notes are an integral part of these consolidated financial statements
5
RED METAL RESOURCES LTD.
(AN EXPLORATION STAGE COMPANY)
CONSOLIDATED STATEMENTS OF CASH FLOWS
(UNAUDITED)
|
For the nine months
|
From January 10,
|
|||||||||||
|
Ended October 31,
|
2005 (Inception)
|
|||||||||||
|
2011
|
2010
|
to October 31, 2011
|
||||||||||
|
Cash flows used in operating activities:
|
||||||||||||
|
Net loss
|
$ | (2,353,652 | ) | $ | (469,566 | ) | $ | (5,410,471 | ) | |||
|
Adjustments to reconcile net loss to net cash used in operating activities:
|
||||||||||||
|
Donated services and rent
|
- | - | 14,250 | |||||||||
|
Write-down of unproved mineral properties
|
2,909 | - | 228,594 | |||||||||
|
Amortization
|
1,642 | - | 1,642 | |||||||||
|
Stock based compensation
|
559,516 | - | 559,516 | |||||||||
|
Changes in operating assets and liabilities:
|
||||||||||||
|
Prepaids and other receivables
|
(77,625 | ) | (18,812 | ) | (115,197 | ) | ||||||
|
Accounts payable
|
(27,661 | ) | 79,769 | 168,997 | ||||||||
|
Accrued liabilities
|
(4,365 | ) | (32,856 | ) | 226,680 | |||||||
|
Due to related parties
|
179,668 | 263,684 | 1,027,803 | |||||||||
|
Accrued interest on notes payable to related party
|
5,411 | 2,193 | 79,161 | |||||||||
|
Net cash used in operating activities
|
(1,714,157 | ) | (175,588 | ) | (3,219,025 | ) | ||||||
|
Cash flows used in investing activities:
|
||||||||||||
|
Purchase of equipment
|
(19,820 | ) | - | (19,820 | ) | |||||||
|
Acquisition of unproved mineral properties
|
(230,092 | ) | (17,336 | ) | (1,256,861 | ) | ||||||
|
Net cash used in investing activities
|
(249,912 | ) | (17,336 | ) | (1,276,681 | ) | ||||||
|
Cash flows provided by financing activities:
|
||||||||||||
|
Cash received on issuance of notes payable to related party
|
181,698 | 60,000 | 1,036,088 | |||||||||
|
Proceeds from issuance of common stock
|
1,828,099 | 135,000 | 3,584,849 | |||||||||
|
Proceeds from subscriptions received
|
60,000 | - | 60,000 | |||||||||
|
Net cash provided by financing activities
|
2,069,797 | 195,000 | 4,680,937 | |||||||||
|
Effects of foreign currency exchange
|
(10,354 | ) | (9,450 | ) | (81,202 | ) | ||||||
|
Increase/(decrease) in cash
|
95,374 | (7,374 | ) | 104,029 | ||||||||
|
Cash, beginning
|
8,655 | 7,951 | - | |||||||||
|
Cash, ending
|
$ | 104,029 | $ | 577 | $ | 104,029 | ||||||
|
Supplemental disclosures:
|
||||||||||||
|
Cash paid for:
|
||||||||||||
|
Income tax
|
$ | - | $ | - | $ | - | ||||||
|
Interest
|
$ | - | $ | - | $ | - | ||||||
The accompanying notes are an integral part of these consolidated financial statements
6
RED METAL RESOURCES LTD.
(AN EXPLORATION STAGE COMPANY)
NOTES TO THE CONSOLIDATED FINANCIAL STATEMENTS
OCTOBER 31, 2011
(UNAUDITED)
NOTE 1 – ORGANIZATION AND BASIS OF PRESENTATION
Red Metal Resources Ltd. (the “Company”) was incorporated on January 10, 2005 under the laws of the state of Nevada as Red Lake Exploration, Inc. and changed its name to Red Metal Resources Ltd. on August 27, 2008. On August 21, 2007, the Company acquired a 99% interest in Minera Polymet Limitada (“Polymet”), a limited liability company formed on August 21, 2007 under the laws of the Republic of Chile. The Company is involved in acquiring and exploring mineral properties in Chile. The Company has not determined whether its properties contain mineral reserves that are economically recoverable.
The Company evaluated events up to the date the financial statements were issued. There were no subsequent events that provided additional evidence about conditions that existed at the date of the balance sheet, including the estimates inherent in the process of preparing financial statements.
Unaudited Interim Consolidated Financial Statements
The unaudited interim financial statements of the Company have been prepared in accordance with United States generally accepted accounting principles (“GAAP”) for interim financial information and the rules and regulations of the Securities and Exchange Commission (“SEC”). They do not include all information and footnotes required by GAAP for complete financial statements. Except as disclosed herein, there have been no material changes in the information disclosed in the notes to the financial statements for the year ended January 31, 2011 included in the Company’s Annual Report on Form 10-K, filed with the SEC. The interim unaudited financial statements
should be read in conjunction with those financial statements included in Form 10-K. In the opinion of management, all adjustments considered necessary for fair presentation, consisting solely of normal recurring adjustments, have been made. Operating results for the nine month period ended October 31, 2011 are not necessarily indicative of the results that may be expected for the year ending January 31, 2012.
Recent Accounting Pronouncements
The Company has reviewed recently issued accounting pronouncements and plans to adopt those that are applicable to it. It does not expect the adoption of these pronouncements to have a material impact on its financial position, results of operations or cash flows.
NOTE 2 – RELATED-PARTY TRANSACTIONS
The following amounts were due to related parties at October 31, 2011 and January 31, 2011:
|
October 31, 2011
|
January 31, 2011
|
|||||||
|
Due to a company owned by an officer
|
$ | 127,645 | $ | 228,330 | ||||
|
Due to a company controlled by directors
|
503,475 | 207,742 | ||||||
|
Due to a company controlled by a relative of the president
|
54,328 | 63,692 | ||||||
|
Due to a shareholder
|
4,331 | 10,347 | ||||||
|
Total due to related parties (a)
|
$ | 689,779 | $ | 510,111 | ||||
|
Note payable to a company controlled by directors (b)
|
$ | 63,376 | $ | - | ||||
|
Note payable to a company owned by a relative of the president (c)
|
55,323 | 52,902 | ||||||
|
Note payable to a director
|
- | 60,746 | ||||||
|
Note payable to a relative of the president (d)
|
52,058 | - | ||||||
|
Total notes payable to related parties
|
$ | 170,757 | $ | 113,648 | ||||
7
(a) Amounts due to related parties are unsecured, due on demand, and bear no interest.
(b) The principal amount of the note payable to a company owned by the Company's directors is $62,797 ($62,389 CDN); it is due on demand, unsecured and bears interest at 8% per annum. Interest of $579 had accrued as at October 31, 2011.
(c) The principal amount of the note payable to a related party is $50,000, is due on demand, unsecured and bears interest at 6% per annum. Interest of $5,323 had accrued as at October 31, 2011.
(d) The principal amount of the note payable due to a relative of the president is $51,000 and is due on demand, unsecured and bears interest at 8% per annum. Interest of $1,058 had accrued as at October 31, 2011.
During the nine months ended October 31, 2011, the Company borrowed $70,000 US and $10,000 Cdn from its CFO. The notes payable were due on demand, unsecured and bore interest at 8% per annum compounded monthly. The CFO converted the equivalent of $80,000 US in principal into 266,667 units sold in the private offering completed on April 7, 2011. The remaining principal and accrued interest outstanding was repaid in cash.
Transactions with Related Parties
During the nine months ended October 31, 2011 and 2010 the Company incurred the following expenses with related parties:
|
|
•
|
$225,491 and $119,273, respectively, in consulting and other business expenses with a company owned by the chief financial officer of the Company
|
|
|
•
|
$555,678 and $104,125, respectively, in administration, advertising and promotion, mineral exploration, travel and other business expenses with a company controlled by two directors
|
|
|
•
|
$51,788 and $46,470, respectively, in administration, automobile, rental, and other business expenses with a company owned by a major shareholder and a relative of the president
|
|
|
•
|
$37,242 and $18,608, respectively, in administration expenses, salary and other reimbursable expenses with a shareholder
|
The above amounts represent services provided directly by related parties or expenses paid by related parties on the Company’s behalf.
NOTE 3 – UNPROVED MINERAL PROPERTIES
|
October 31, 2011
|
January 31, 2011
|
|||||||
|
Unproved mineral properties, beginning
|
$ | 662,029 | $ | 643,481 | ||||
|
Acquisition
|
230,092 | 18,548 | ||||||
|
Unproved mineral properties written down
|
(5,342 | ) | - | |||||
|
Unproved mineral properties, ending
|
$ | 886,779 | $ | 662,029 | ||||
Farellon Property
Farellon Alto Uno al Ocho Mineral Claim
On April 25, 2008, the Company acquired the Farellon Alto Uno al Ocho mining claim located in the Commune of Freirina, Province of Huasco, III Region of Atacama, Chile for $550,000. The claim is subject to a 1.5% royalty on the net sales of minerals extracted from the property to a total of $600,000. The royalty payments are due monthly once exploitation begins, and are subject to minimum payments of $1,000 per month. The Company has no obligation to pay the royalty if it does not commence exploitation. At October 31, 2011, the Company had spent a total of $552,272 on the acquisition of this claim. At January 31, 2011, the Company had spent $550,844 on the acquisition of
this claim.
8
Cecil Mineral Claims
On September 17, 2008, the Company acquired the Cecil mining claims for $20,000. The claims are located near the Farellon property in commune of Freirina, Province of Huasco, III Region of Atacama, Chile. At October 31, 2011, the Company had spent a total of $38,650 on the acquisition of these claims and accrued $3,096 in unpaid property taxes. At January 31, 2011, the Company had spent $32,803 on the acquisition of these claims and accrued $3,096 in unpaid property taxes.
Perth Property
Perth Claims
On March 10, 2011, the Company purchased the Perth mining claims for $35,000. The properties are located in Sierra Pan de Azucar in commune of Freirina, Province of Huasco, III Region of Atacama, Chile. On March 14, 2011, the Company entered into an agreement on the Perth property with Revonergy Inc. Revonergy Inc. paid $35,000 on signing the agreement and can earn a 35% interest in the Perth property if it spends a minimum $1,450,000 on the three phase exploration program. Revonergy Inc. can earn a further 15% interest if it completes a preliminary feasibility study within four years from the signing of the agreement. At October 31, 2011, the Company had spent $54,371
in acquisition costs for this property, which were offset against the joint venture payment of $35,000.
Mateo Property
Margarita Claim
On November 27, 2008, the Company acquired the Margarita mining claim for $16,072. At October 31, 2011, the Company had spent a total of $17,528 on the acquisition of this claim and accrued $667 in unpaid property taxes. At January 31, 2011, the Company had spent $17,078 on the acquisition of this claim and accrued $667 in unpaid property taxes.
Che Claims
On October 10, 2008, the Company acquired an option to purchase the Che Uno and Che Dos mining claims. Under the terms of the option, as amended, the Company agreed to pay $444 on December 2, 2008 as consideration for the option agreement and $20,000 by April 10, 2011 to acquire the Che claims. The Company exercised the option on April 7, 2011. The claims are subject to a 1% royalty on the net sales of minerals extracted from the property to a total of $100,000. The royalty payments are due monthly once exploitation begins and are not subject to minimum payments. The Company has no obligation to pay the royalty if it does not commence exploitation. At October 31,
2011, the Company had spent a total of $22,631 on the acquisition of these claims and accrued $1,264 in unpaid property taxes. At January 31, 2011, the Company had spent $1,313 on the acquisition of these claims and accrued $1,264 in unpaid property taxes.
Irene Claims
On September 7, 2010 the Company entered into a purchase agreement with a related company to acquire the Irene claims. Under the terms of the agreement, as amended, the Company paid $45,174 (equivalent of 21 million Chilean pesos) on May 10, 2011 to exercise the option and purchase the Irene claims. At October 31, 2011, the Company had spent $47,174 in acquisition costs for these claims. At January 31, 2011, the Company capitalized $838 in the acquisition of these claims.
Mateo Exploration Claims
At October 31, 2011 the Company had spent a total of $20,049 on the acquisition of these claims and accrued $4,698 in unpaid property taxes and other costs. During the nine months ended October 31, 2011 the Company decided not to maintain several Mateo claims and wrote off $4,287 in acquisition costs. At January 31, 2011, the Company had spent $6,833 on the acquisition of these claims and accrued $8,304 in unpaid property taxes and other costs.
9
Veta Negra Property
Veta Negra Claims
On June 30, 2011, the Company entered into an agreement with a related company to acquire its options to purchase the Veta Negra and Exon mining claims and the Trixy exploration claims for $107,500. Under the terms of the option, the Company agreed to transfer its interest in several generative claims with the net book value of $4,504. The claims are subject to a 1.5% royalty on the net sales of minerals extracted to a total of $500,000. The royalty payments are due monthly once exploitation begins. At October 31, 2011 the Company paid $10,000 in option payments and capitalized an additional $4,504 as cost of transferred generative claims.
Other Generative Claims
Este Claims
On August 3, 2011 Minera Polymet entered into an option purchase agreement with unrelated vendors to acquire the Este y Este Uno al Veinte claims for 100,000,000 pesos (approximately $204,127 US) and payable within 30 months, of which the first instalment of 5,000,000 pesos ($10,852 US) was paid on August 3, 2011. The property is subject to a 1.5% royalty on the net sales of minerals extracted from the property to a total of 100,000,000 pesos (approximately $204,127 US). The royalty payments are due monthly once exploitation begins, and are subject to a maximum payment of 500,000 pesos (approximately $1,100 US) per month and no minimum payment. The Company has no obligation to pay the
royalty if it does not commence exploitation. At October 31, 2011, the Company had spent $12,562 in acquisition costs for these claims.
At October 31, 2011, the Company had a net total of $1,926 in acquisition costs and write-offs for other generative claims. On January 31, 2011, the Company spent $5,209 in acquisition costs on these claims.
Chilean Value Added Tax
At October 31, 2011 and January 31, 2011, the Company had capitalized $134,674 and $33,780, respectively, in Chilean value-added tax (VAT) as part of the unproved mineral claims. This VAT is recoverable from future VAT payable.
NOTE 4 – COMMON STOCK
On April 7, 2011, the Company issued 6,723,333 units at a price of $0.30 per unit. Each unit consists of one share of common stock and one common share purchase warrant. The warrants have an exercise price of $0.50 per share and are exercisable for a period of two years. The warrants contain a call provision which allows the Company to call the warrants upon the occurrence of certain conditions. The net proceeds to the Company from the offering were approximately $1,862,462. Commissions of $58,900 were paid and 196,333 common share purchase warrants were issued to agents in connection with this financing.
As part of the private placement of units described above, the Company’s CEO converted loans in the amount of $50,000 into 166,666 units and the Company’s CFO converted loans in the amount of $80,000 into 266,667 units.
Warrants
|
October 31, 2011
|
January 31, 2011
|
|||||||
|
Warrants, beginning
|
790,000 | 607,147 | ||||||
|
Granted
|
6,919,666 | 540,000 | ||||||
|
Exercised
|
(200,000 | ) | - | |||||
|
Expired
|
- | (357,147 | ) | |||||
|
Warrants, ending
|
7,509,666 | 790,000 | ||||||
10
The weighted average life and weighted average exercise price of the warrants at October 31, 2011 is 1.35 years and $0.48, respectively.
On September 2, 2011, the Company adopted the Red Metal Resources Ltd. 2011 Equity Incentive Plan (the “Plan”) and reserved 1,600,000 shares of the Company’s common stock for awards under the Plan. The Plan will terminate 10 years from the date of adoption. On September 2, 2011, the Company’s board of directors granted 1,040,000 options to purchase the Company’s common stock to certain officers, directors, and consultants, including 230,000 options granted to each of the Company’s Chief Executive Officer, Chief Financial Officer, and Vice President of Exploration. The options are exercisable at $0.50 for a term of two years.
The Company recorded $559,516 as employee stock-based expense, which was calculated using the following assumptions under the Black-Scholes option-pricing model:
|
September 2, 2011
|
||||
|
Risk-free interest rate
|
0.20 | % | ||
|
Expected life of options
|
2 years
|
|||
|
Expected annualized volatility
|
321.63 | % | ||
|
Expected dividend rate
|
- | % | ||
11
Item 2. Management’s Discussion and Analysis of Financial Condition and Results of Operations.
Forward-Looking Statements
This quarterly report on form 10-Q filed by Red Metal Resources Ltd. contains forward-looking statements. These are statements regarding financial and operating performance and results and other statements that are not historical facts. The words “expect,” “project,” “estimate,” “believe,” “anticipate,” “intend,” “plan,” “forecast,” and similar expressions are intended to identify forward-looking statements. Certain important risks could cause results to differ materially from those anticipated by some of the forward-looking statements. Some, but not all, of these risks
include, among other things:
|
•
|
general economic conditions, because they may affect our ability to raise money
|
|
•
|
our ability to raise enough money to continue our operations
|
|
•
|
changes in regulatory requirements that adversely affect our business
|
|
•
|
changes in the prices for minerals that adversely affect our business
|
|
•
|
political changes in Chile, which could affect our interests there
|
|
•
|
other uncertainties, all of which are difficult to predict and many of which are beyond our control
|
We caution you not to place undue reliance on these forward-looking statements, which reflect our management’s view only as of the date of this report. We are not obligated to update these statements or publicly release the results of any revisions to them to reflect events or circumstances after the date of this report or to reflect the occurrence of unanticipated events. You should refer to, and carefully review, the information in future documents we file with the Securities and Exchange Commission.
General
You should read this discussion and analysis in conjunction with our interim unaudited consolidated financial statements and related notes included in this Form 10-Q and the audited consolidated financial statements and related notes included in our annual report on Form 10-K for the fiscal year ended January 31, 2011. The inclusion of supplementary analytical and related information may require us to make estimates and assumptions to enable us to fairly present, in all material respects, our analysis of trends and expectations with respect to our results of operations and financial position taken as a whole. Actual results may vary from the estimates and assumptions we
make.
Overview
Red Metal is a mineral exploration company engaged in locating, and eventually developing, mineral resources in Chile. Our business strategy is to identify, acquire and explore prospective mineral claims with a view to either developing them ourselves or, more likely, finding a joint venture partner with the mining experience and financial means to undertake the development. All of our claims are in the Candelaria IOCG belt in the Chilean Coastal Cordillera.
We have no revenue-generating operations and are dependent upon the equity markets for our working capital. Despite the current market volatility, prices of copper and gold overall are moving in a positive direction and we are optimistic that we can raise equity capital under these market conditions. We completed an offering of 6,723,333 units on April 7, 2011 at $0.30 per unit. Each unit consisted of one share of our common stock and one warrant for the purchase of one share of common stock exercisable at $0.50 per share for two years. We realized net proceeds of $1,862,462 from this offering. On September 2, 2011 we adopted the Red Metal Resources Ltd. 2011 Equity Incentive Plan and
reserved 1,600,000 shares of our common stock for awards under the Plan. On the same day we issued options to purchase 1,040,000 shares of our common stock to directors, officers, employees and consultants who provide services to Red Metal. The options have an exercise price of $0.50 per share and a term of 2 years.
12
Consistent with our historical practices, we continue to monitor our costs in Chile by reviewing our mineral claims to determine whether they possess the geological indicators to economically justify the capital to maintain or explore them. Currently, we have six employees in Chile and engage part time assistants during our exploration programs. Most of our support — such as, vehicles, office and equipment — is supplied under short-term contracts. The only long-term commitments that we have are for royalty payments on four of our mineral claims – Farellon, Che, Veta Negra and Este. These royalties are payable once exploitation begins. Two of the above claims – Veta
Negra and Este – have option payments payable during the next three years under the option to purchase contracts.
In September of 2009 we conducted a drilling program on our Farellon property which proved that further drilling of the property is warranted. Micon International Limited, from whom we commissioned a Canadian National Instrument 43-101 technical report summarizing the drilling results, has recommended that we conduct a two-phase drilling program. On June 25, 2011 we started a first phase of the program which was concluded on August 29, 2011. The drill program consisted of 2,233 meters of combined RC and diamond drilling. This phase’s main purpose was to define the structural controls on the mineralization and assist in defining the depth and nature of the sulphide mineralization. The
cost of this phase was approximately $775,000.
In June 2011 we also started initial exploration programs on the Mateo and Veta Negra properties, which included geophysics, surface mapping, sampling, high resolution ground magnetic survey, and a 1,000-metre RC drill program. As of date of this report we completed most of the planned activities. The cost of these activities was approximately $210,000.
On March 14, 2011, we entered into a joint venture earn-in agreement on the Perth property with Revonergy Inc. According to the agreement Revonergy Inc. can earn a 35% interest in the Perth property if it spends a minimum $1,450,000 on a three-phase exploration program; and can earn a further 15% interest if it completes a preliminary feasibility study within four years from the signing of the agreement.
The cost and timing of all planned exploration programs are subject to the availability of qualified mining personnel, such as consulting geologists and geo-technicians, and drillers and drilling equipment. If we are unable to find the personnel and equipment that we need when we need them and at the prices that we have estimated today, we might have to revise or postpone our plans.
Results of operations
summary of financial condition
Table 1 summarizes and compares our financial condition at the nine months ended October 31, 2011 to the year-ended January 31, 2011.
Table 1: Comparison of financial condition
|
October 31, 2011
|
January 31, 2011
|
|||||||
|
Working capital (deficit)
|
$ | (895,498 | ) | $ | (866,179 | ) | ||
|
Current assets
|
$ | 219,226 | $ | 46,227 | ||||
|
Equipment
|
$ | 18,178 | - | |||||
|
Unproved mineral properties
|
$ | 886,779 | $ | 662,029 | ||||
|
Total liabilities
|
$ | 1,114,724 | $ | 912,406 | ||||
|
Common stock and additional paid in capital
|
$ | 5,501,132 | $ | 2,923,517 | ||||
|
Deficit
|
$ | (5,410,471 | ) | $ | (3,056,819 | ) | ||
13
comparison of prior quarterly results
Tables 2.1 and 2.2 present selected financial information for each of the past eight quarters.
Table 2.1: Summary of quarterly results (January 31, 2011 – October 31, 2011)
|
January 31,
2011
|
April 30,
2011
|
July 31,
2011
|
October 31,
2011
|
|||||||||||||
|
Revenue
|
– | – | – | – | ||||||||||||
|
Net loss
|
$ | (203,052 | ) | $ | (285,276 | ) | $ | (782,841 | ) | $ | (1,285,535 | ) | ||||
|
Basic and diluted loss per share
|
$ | (0.02 | ) | $ | (0.02 | ) | $ | (0.05 | ) | $ | (0.08 | ) | ||||
Table 2.2: Summary of quarterly results (January 31, 2010 – October 31, 2010)
|
January 31,
2010
|
April 30,
2010
|
July 31,
2010
|
October 31,
2010
|
|||||||||||||
|
Revenue
|
– | – | – | – | ||||||||||||
|
Net loss
|
$ | (204,061 | ) | $ | (196,851 | ) | $ | (118,279 | ) | $ | (154,436 | ) | ||||
|
Basic and diluted loss per share
|
$ | (0.03 | ) | $ | (0.02 | ) | $ | (0.01 | ) | $ | (0.02 | ) | ||||
During the quarters ended July 31, 2011 and October 31, 2011 we experienced substantially higher operating expenses mainly due to the drilling program on the Farellon property and exploration campaigns on other properties, including associated travel and geological consulting expenses, which we incurred between May and September 2011. During the quarter ended October 31, 2011, we granted 1,040,000 stock options to certain directors, employees, and consultants that resulted in a non-cash expense of $559,516, increasing our net loss.
Selected Financial Results
three and nine months ended October 31, 2011 and October 31, 2010
Our operating results for the three and nine months ended October 31, 2011 and 2010 and the changes in the operating results between those periods are summarized in Table 3.
Table 3: Changes in operating results
|
Three months
ended October 31,
|
Changes between the periods ended
October 31
|
Nine months
ended October 31,
|
Changes between the periods ended
October 31,
|
|||||||||||||||||||||
|
2011
|
2010 | 2011 and 2010 |
2011
|
2010 | 2011 and 2010 | |||||||||||||||||||
|
Operating Expenses
|
||||||||||||||||||||||||
|
Administration
|
$ | 5,612 | $ | 27,812 | $ | (22,200 | ) | 36,370 | 66,527 | $ | (30,157 | ) | ||||||||||||
|
Advertising and promotion
|
75,734 | 25,488 | 50,246 | 176,820 | 83,097 | 93,723 | ||||||||||||||||||
|
Automobile
|
8,179 | 5,709 | 2,470 | 27,843 | 18,346 | 9,497 | ||||||||||||||||||
|
Bank charges
|
1,009 | 1,068 | (59 | ) | 5,142 | 2,854 | 2,288 | |||||||||||||||||
|
Consulting fees
|
82,378 | 38,800 | 43,578 | 239,011 | 107,795 | 131,216 | ||||||||||||||||||
|
Interest on current debt
|
26,687 | 7,978 | 18,709 | 62,134 | 23,870 | 38,264 | ||||||||||||||||||
|
Mineral exploration costs
|
396,245 | 548 | 395,697 | 849,800 | 13,519 | 836,281 | ||||||||||||||||||
|
Office
|
4,905 | 3,069 | 1,836 | 20,220 | 6,296 | 13,924 | ||||||||||||||||||
|
Professional development
|
- | - | - | - | 4,008 | (4,008 | ) | |||||||||||||||||
|
Professional fees
|
16,491 | 19,661 | (3,170 | ) | 122,747 | 72,178 | 50,569 | |||||||||||||||||
|
Rent
|
3,385 | 3,333 | 52 | 10,339 | 9,566 | 773 | ||||||||||||||||||
|
Regulatory
|
8,153 | 425 | 7,728 | 23,551 | 11,865 | 11,686 | ||||||||||||||||||
|
Travel and entertainment
|
64,534 | 18,299 | 46,235 | 148,304 | 47,007 | 101,297 | ||||||||||||||||||
|
Salaries and wages
|
29,250 | 2,161 | 27,089 | 54,276 | 3,168 | 51,108 | ||||||||||||||||||
|
Stock based compensation
|
559,516 | - | 559,516 | 559,516 | - | 559,516 | ||||||||||||||||||
|
Foreign exchange loss
|
3,457 | 85 | 3,372 | 14,670 | (530 | ) | 15,200 | |||||||||||||||||
|
Write-down of unproved mineral properties
|
- | - | - | 2,909 | - | 2,909 | ||||||||||||||||||
|
Net loss
|
$ | 1,285,535 | $ | 154,436 | $ | 1,131,099 | $ | 2,353,652 | $ | 469,566 | $ | 1,884,086 | ||||||||||||
14
Operating expenses. Our operating expenses increased by $1,131,099, or 732%, from $154,436 for the three months ended October 31, 2010 to $1,285,535 for the three months ended October 31, 2011.
On a year-to-date basis, our operating expenses increased by $1,884,086, or 401%, from $469,566 for the nine months ended October 31, 2010 to $2,353,652 for the nine months ended October 31, 2011.
The following are our most significant changes for the three and nine months ended October 31, 2011 and 2010:
|
•
|
We restructured our administrative operations, which resulted in savings of $22,200 for the three month period and $30,157 for the nine month period ended October 31, 2011, compared to the period ended October 31, 2010.
|
|
•
|
We started a drilling program on our Farellon property and increased exploration activities on our Mateo and Veta Negra properties, which resulted in an increase of $395,697, or 72,207%, for the three months, and $836,281, or 6,186%, for the nine months, in mineral exploration expenses, from $548 for the three months ended October 31, 2010 to $396,245 for the three months ended October 31, 2011 and from $13,519 for the nine months ended October 31, 2010 to $849,800 during the nine months ended October 31, 2011.
|
|
•
|
During the second quarter drilling campaign we hired four assistant geotechnicians and additional office staff to keep up with the increased workload. This resulted in an increase of $27,089, or 1,254%, and $51,108, or 1,613%, for the three and nine month periods in salary and wage expense, from $2,161 during the three months ended October 31, 2010 to $29,250 during the three months ended October 31, 2011 and from $3,168 during the nine months ended October 31, 2010 to $54,276 during the nine months ended October 31, 2011.
|
|
•
|
Our travel and entertainment expenses increased from $18,299 to $64,534, or 253%, for the three month period and from $47,007 to $148,304, or 215%, for the nine month period ended October 31, 2011. These increases were mainly associated with travel time incurred by consulting geologists during the drilling programs that were undertaken during the period. These travel expenditures were budgeted under the exploration campaign.
|
|
•
|
Due to higher accounting and financial advisory requirements we incurred $82,378 and $239,011 in consulting fees during the three and nine months ended October 31, 2011, an increase of $43,578, or 112%, and $131,216, or 122%, respectively.
|
|
•
|
During the nine months ended October 31, 2011, we completed a private equity financing and prepared and filed a registration statement on form S-1, which resulted in an increase in our professional and legal fees of $50,569, or 70%, for the period, and an increase in regulatory fees of $11,686, or 98%. During the three months ended October 31, 2011, our professional and legal fees decreased by $3,170 or 16% because we had no extraordinary transactions during the quarter. However, during the three month period ended October 31, 2011 our regulatory fees increased by $7,728, or 1,818%, mainly due to increased interactive data filing and regulatory requirements.
|
|
•
|
To continue with our operational plans and to raise awareness of the drilling programs we increased our advertising and promotion costs during the three months and nine months ended October 31, 2011 by $50,246, or 197%, and $93,723, or 113%, respectively.
|
|
•
|
During the three months and nine months ended October 31, 2011, we expensed $26,687 and $62,134, respectively, in interest on current debt. This was an increase of $18,709, or 235%, during the three month period and an increase of $38,264, or 160%, during the nine month period. This increase was associated with larger outstanding payables, mainly to related parties.
|
|
•
|
On September 2, 2011 we adopted the Red Metal Resources Ltd. 2011 Equity Incentive Plan and granted 1,040,000 options to our officers, directors, and consultants. We recorded $559,516 in employee stock option expense associated with these grants. We had no such expense during the three month and the nine month periods ended October 31, 2010.
|
Net loss. We had a net loss of $1,285,535 for the three months and of $2,353,652 for the nine months ended October 31, 2011, compared to a net loss of $154,436 for the three months and $469,566 for the nine months ended October 31, 2010. The increase in net loss during the periods was due to the expense associated with the drilling program on our Farellon property as well as the exploration programs on our Mateo and Veta Negra properties, which resulted in increased exploration, travel, automobile costs, and increased salaries and wages; compensation in the form of employee stock option grants that we issued in
September 2011; and an increase in our advertising and promotion activities in order to raise awareness of our exploration activities and seek additional external financing, which resulted in increased advertising costs as well as increased consulting, professional and regulatory fees.
15
Liquidity
going concern
The consolidated financial statements included in this report have been prepared on a going concern basis, which implies that we will continue to realize our assets and discharge our liabilities in the normal course of business. We have not generated any significant revenues from mineral sales since inception, have never paid any dividends and are unlikely to pay dividends or generate significant earnings in the immediate or foreseeable future. Our continuation as a going concern depends upon the continued financial support of our shareholders, our ability to obtain necessary debt or equity financing to continue operations, and the attainment of profitable operations. Our ability to achieve
and maintain profitability and positive cash flow depends upon our ability to locate profitable mineral claims, generate revenue from mineral production and control our production costs. Based upon our current plans, we expect to incur operating losses in future periods, which we plan to mitigate by controlling our operating costs and sharing mineral exploration expenses through joint venture agreements when we are able to enter into them. In April 2011 we completed a financing of units consisting of our common stock and warrants to purchase shares of our common stock. We raised gross proceeds of $2,017,000, which we used to support our administrative overhead and fund our exploration campaigns on the Farellon, Mateo, and Veta Negra properties. We are continually reviewing potential properties to add to our portfolio and suitable acquisitions and project
development will require additional financing. Until we earn enough revenue to support our operations, which may never happen, we will continue to be dependent on loans and sales of our equity or debt securities to continue our development and exploration activities. If we do not find sources of financing as and when we need them, we may be required to severely curtail, or even to cease, our operations. At October 31, 2011, we had a working capital deficit of $895,498 and accumulated losses of $5,410,471 since inception. These factors raise substantial doubt about our ability to continue as a going concern. Our consolidated financial statements do not give effect to any adjustments that would be necessary should we be unable to continue as a going concern and therefore be required to realize our assets and discharge our liabilities in other than the normal
course of business and at amounts different from those reflected in our financial statements.
internal and external sources of liquidity
To date we have funded our operations by selling our securities and borrowing funds, and, to a minor extent, from mining royalties.
Sources and uses of cash
Nine months ended October 31, 2011 and 2010
Table 4 summarizes our sources and uses of cash for the nine months ended October 31, 2011 and 2010.
Table 4: Summary of sources and uses of cash
|
October 31,
|
||||||||
|
2011
|
2010
|
|||||||
|
Net cash provided by financing activities
|
$ | 2,069,797 | $ | 195,000 | ||||
|
Net cash used in operating activities
|
(1,714,157 | ) | (175,588 | ) | ||||
|
Net cash used in investing activities
|
(249,912 | ) | (17,336 | ) | ||||
|
Effect of foreign currency exchange
|
(10,354 | ) | (9,450 | ) | ||||
|
Net increase (decrease) in cash
|
$ | 95,374 | $ | (7,374 | ) | |||
16
Net cash provided by financing activities. During the nine months ended October 31, 2011, as part of the private offering completed on April 7, 2011, we issued 6,290,000 units at $0.30 per unit for cash proceeds of $1,828,099, net of $58,900 in commissions paid to agents. Each unit consists of one share of our common stock and a two-year warrant exercisable for one share of our common stock at $0.50 per share.
We received $60,000 on exercise of a warrant for 200,000 shares at $0.30 per share. These shares were issued on November 28, 2011.
During the nine months ended October 31, 2011 we borrowed $51,000 from the father of our president; $62,389 Cdn (approximately $62,797 US) from the company controlled by two directors, and $70,000 US and $10,000 Cdn (approximately $10,454 US) from our CFO. We also repaid $14,956 in loans including accrued interest and recognized foreign exchange adjustment of $2,402 on $50,000 Cdn that we borrowed during the year ended January 31, 2011 from our CEO. See Non-cash financing transactions below.
During the nine months ended October 31, 2010, we issued 540,000 shares of our common stock for $135,000, borrowed $50,000 from a company owned by the father of a director and $10,000 from our CEO.
Non-cash financing transactions. During the nine months ended October 31, 2011, as part of the private offering completed on April 7, 2011, the Company’s CEO converted loans in the amount of $50,000 into 166,666 units and the Company’s CFO converted loans in the amount of $80,000 into 266,667 units.
During the nine months ended October 31, 2010, we did not have any non-cash financing transactions.
Net cash used in operating activities. During the nine months ended October 31, 2011, we used net cash of $1,714,157 in operating activities. We used $2,353,652 to cover operating costs and increased prepaids and other receivables by $77,625. As part of our operating costs we recorded a non-cash employee stock based compensation expense of $559,516. We decreased accounts payable and accrued liabilities by $27,661 and $4,365, respectively. These uses of cash were offset by increases in accounts payable to related parties of $179,668 and accrued interest on our notes payable to related parties of $5,411.
During the nine months ended October 31, 2010, we used net cash of $175,588 in operating activities. We used $469,566 to cover operating costs, increased our prepaid expenses and other receivables by $18,812, and decreased accrued liabilities by $32,856. These uses of cash were offset by net increases in accounts payable of $79,769, accounts payable to related parties of $263,684 and accrued interest on our notes payable to a related party of $2,193.
Net cash used in investing activities. During the nine months ended October 31, 2011, we spent $230,092 acquiring mineral claims and paying property taxes associated with our mineral claims. We capitalized Chilean value-added tax as part of the unproved mineral claims. This VAT is recoverable from future VAT payable. During the same period we used $19,820 to purchase a pick-up truck that will be used in operations.
During the nine months ended October 31, 2010, we spent $17,336 acquiring mineral claims and options to acquire mineral claims.
Since inception through October 31, 2011, we have invested $1,256,861 in acquiring our mineral claims and $19,820 for acquisition of other capital assets.
Unproved mineral properties
We have four active properties which we have assembled since the beginning of 2007— the Farellon, Perth, Mateo, and Veta Negra. These properties consist of both mining and exploration claims and are grouped into two district areas – Carrizal Alto area properties and Vallenar area properties.
17
Active properties
Our active properties as of the date of this filing are set out in Table 5. These properties are accessible by road from Vallenar as illustrated in Figure 1.
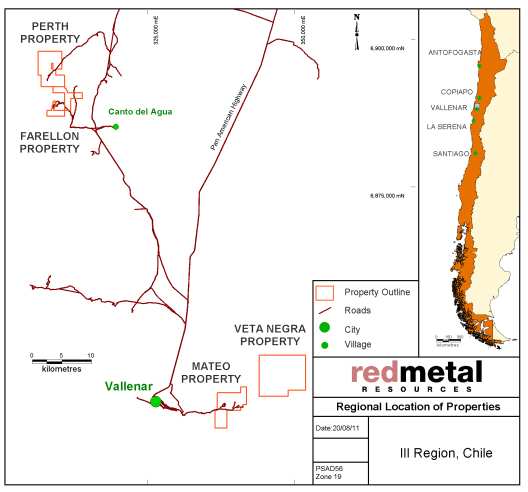
Figure 1: Location and access to active properties.
|
Table 5: Active properties
|
|||||||||
|
Property
|
Percentage, type of claim
|
Hectares
|
|||||||
|
Gross area
|
Net areaa
|
||||||||
|
Carrizal Alto area
|
|||||||||
|
Farellon
|
|||||||||
|
Farellon 1 – 8 claim
|
100%, mensura
|
66 | |||||||
|
Farellon 3, 4, 5, 6, 7, 8, 9 claims
|
100%, pedimento
|
1,800 | |||||||
|
Cecil 1 – 49 claim
|
100%, mensura
|
230 | |||||||
|
Cecil 1 – 40 and Burghley 1 – 60 claims
|
100%, manifestacion
|
500 | |||||||
| 2,596 | 2,596 | ||||||||
|
Perth
|
|||||||||
|
Perth 1 al 36 claim
|
100%, mensura
|
109 | |||||||
|
Lancelot I 1 al 30 claim
|
100%, mensura in process
|
300 | |||||||
|
Lancelot II 1 al 20 claim
|
100%, mensura in process
|
200 | |||||||
|
Rey Arturo 1 al 30 claim
|
100%, mensura in process
|
300 | |||||||
|
Merlin I 1 al 10 claim
|
100%, mensura in process
|
60 | |||||||
|
Merlin I 1 al 24 claim
|
100%, mensura in process
|
240 | |||||||
|
Galahad I 1 al 10 claim
|
100%, manifestacion
|
50 | |||||||
|
Galahad I A 1 al 46 claim
|
100%, manifestacion
|
230 | |||||||
|
Percival III 1 al 30 claim
|
100%, manifestacion
|
300 | |||||||
|
Tristan II 1 al 30 claim
|
100%, manifestacion
|
300 | |||||||
|
Tristan II A 1 al 5 claim
|
100%, manifestacion
|
15 | |||||||
|
Camelot claim
|
100%, pedimento
|
300 | |||||||
| 2,404 | |||||||||
|
Overlapped claims
|
(124 | ) | 2,280 | ||||||
18
|
Vallenar area
|
|||||||||
|
Mateo
|
|||||||||
|
Margarita claim
|
100%, mensura
|
56 | |||||||
|
Che 1 & 2 claims
|
100%, mensura
|
76 | |||||||
|
Irene & Irene II claims
|
100%, mensura
|
60 | |||||||
|
Mateo 1, 2, 3, 9, 10, 12, 13, 14 claims
|
100%, manifestacion
|
1,620 | |||||||
|
Mateo 4 and 5 claims
|
100%, pedimento
|
600 | |||||||
| 2,412 | |||||||||
|
Overlapped claims
|
(170 | ) | 2,242 | ||||||
|
Veta Negra
|
|||||||||
|
Veta Negra 1 al 7 claim
|
Option to purchase, mensura
|
28 | |||||||
|
Exon 1 al 4 claim
|
Option to purchase, mensura
|
16 | |||||||
|
Trixy 1, 2, 3, 4, 5, 10, 12, 13, 14, 15 claims
|
100%, manifestacion
|
2,900 | |||||||
|
Trixy 6, 7, 8, 9, 11, 16, 17, 18 claims
|
100%, pedimento
|
2,400 | |||||||
| 5,344 | |||||||||
|
Overlapped claims
|
(44 | ) | 5,300 | ||||||
| 12,418 | |||||||||
|
a Some pedimentos and manifestaciones overlap other claims. The net area is the total of the hectares we have in each property (i.e. net of our overlapped claims).
|
|||||||||
Recent exploration activities.
During May through October, 2011, we conducted a drill program on the Farellon property and exploration campaigns on the Mateo, Veta Negra and Perth properties.
Farellon Property
Drilling. During June through September 2011 we conducted a combined RC/diamond drill program on the Farellon property. The program was designed to continue to expand on the results of the 2009 drill program, as well as to continue confirming historical results along the strike. During this program we completed 11 drillholes for a total of 2,233m. Significant results of assays are presented in the Table 6 below.
Table 6: Farellon drilling results (2011)
|
Assay interval (m)
|
Assay grade
|
|||||||||||||||||||
|
Drill Hole ID
|
From
|
To
|
Length
|
Copper %
|
Gold g/t
|
|||||||||||||||
|
FAR-11-001
|
36 | 49 | 13 | 2.51 | 0.35 | |||||||||||||||
|
FAR-11-001
|
78 | 85 | 7 | 0.43 | 0.04 | |||||||||||||||
|
FAR-11-002
|
Zone faulted off
|
|||||||||||||||||||
|
FAR-11-003
|
150 | 155 | 5 | 0.40 | 0.28 | |||||||||||||||
|
FAR-11-003
|
177 | 182 | 5 | 0.44 | 0.15 | |||||||||||||||
|
FAR-11-004
|
141 | 145 | 4 | 0.73 | 0.01 | |||||||||||||||
|
FAR-11-005
|
124 | 133 | 9 | 0.84 | 0.26 | |||||||||||||||
|
FAR-11-006
|
80 | 112 | 32 | 1.35 | 0.99 | |||||||||||||||
|
FAR-11-007
|
56 | 74 | 18 | 0.50 | 0.40 | |||||||||||||||
|
FAR-11-008
|
98 | 102 | 4 | 0.85 | 0.26 | |||||||||||||||
|
FAR-11-009
|
202 | 211.55 | 9.55 | 0.95 | 0.42 | |||||||||||||||
|
FAR-11-010
|
179.13 | 183 | 3.87 | 0.50 | 0.39 | |||||||||||||||
|
FAR-11-011
|
54 | 56 | 2 | 0.97 | 0.48 | |||||||||||||||
19
QA/QC, sampling procedures and analytical methods. Samples were taken at intervals between 0.5 and 2 metres. Sampling started at the collar of the hole and proceeded to the toe or bottom of the drill hole. Samples were taken at two metre intervals outside the previously identified main zone of interest. Through the main zone of interest samples were taken at one metre intervals. Generally, the sample recovery was good to excellent for the 2011 drilling program. Table 6 above summarizes significant assay results. They are reported as drill lengths as we have not established the width of
the mineralized zone.
Our quality assurance, quality control (QA/QC) protocol consists of the addition of standards, blanks and laboratory duplicates to the sample stream. We inserted these into the sample series using the same number sequence as the samples themselves. One of the QA/QC check samples is inserted every 25 samples and it alternates between standards, blanks and laboratory duplicates.
Mateo Property
During August through October, 2011 we carried out an in-depth geological mapping and sampling program on the Mateo property. The Mateo property has very diverse mineralization styles through the property which includes mantos, veins, breccias and porphyries with significant gold and copper. A total of 138 reconnaissance samples were collected over the property. The highest assay values returned from reconnaissance samples were 21g/t Au and 10.3% Cu but more common values were between 1-3g/t Au and 1-3% Cu. Table 7 summarizes the significant assay results.
Table 7: significant intersections
|
Sample
|
Cu%
|
Au g/t
|
|
201272
|
7.37
|
1.12
|
|
202871
|
2.63
|
1.14
|
|
202852
|
7.11
|
1.18
|
|
202849
|
10.3
|
1.73
|
|
201220
|
4.29
|
2.07
|
|
201277
|
9.39
|
2.42
|
|
202850
|
2.58
|
2.46
|
|
202810
|
2.44
|
2.49
|
|
202882
|
2.57
|
3.08
|
|
202812
|
0.50
|
3.10
|
|
202815
|
0.62
|
3.57
|
|
202880
|
1.46
|
5.70
|
|
202826
|
5.30
|
6.85
|
|
201217
|
3.46
|
10.11
|
|
202813
|
0.69
|
21.72
|
The detailed mapping identified nine significant mineralized zones where further work is recommended.
We also engaged Quantec Geoscience to complete a ground magnetic survey over the Mateo property in September 2011.
20
Veta Negra
During June and July 2011 we carried out a preliminary exploration program on the Veta Negra property. As a result of the program we discovered a defined and continuous copper mineralized manto in addition to the main manto previously known to exist. At the conclusion of this program three mantos were traced on surface, one manto, the East Manto, was traced for 1.9km on surface before becoming buried by surface rock, a second manto, the West Manto, was traced for a one kilometer strike length and a third manto, the Far West Manto, was traced for a 500 metre strike length.
During this program, 65 reconnaissance samples were collected along the strike length of these three mantos. Table 8 summarizes the significant assay results.
Table 8: Results from reconnaissance samples
|
Sample ID
|
Easting
|
Northing
|
Au g/t
|
Cu %
|
Manto
|
|
200903
|
348488
|
6842508
|
0.16
|
1.01
|
East Manto
|
|
200932
|
348335
|
6843938
|
0.08
|
1.03
|
East Manto
|
|
200925
|
348440
|
6843689
|
0.43
|
1.08
|
East Manto
|
|
200913
|
348690
|
6842997
|
0.33
|
1.62
|
East Manto
|
|
200928
|
348522
|
6843441
|
0.19
|
1.68
|
East Manto
|
|
200943
|
348093
|
6844433
|
0.17
|
1.9
|
East Manto
|
|
200931
|
348349
|
6843900
|
0.2
|
1.91
|
East Manto
|
|
200905
|
348653
|
6842700
|
0.93
|
2.69
|
East Manto
|
|
200904
|
348545
|
6842549
|
0.20
|
3.56
|
East Manto
|
|
200958
|
347107
|
6844288
|
0
|
1.19
|
undefined
|
|
200957
|
347206
|
6843278
|
0.15
|
2.13
|
undefined
|
|
200908
|
348644
|
6841365
|
0.33
|
4.48
|
undefined
|
|
200961
|
346021
|
6843847
|
0.07
|
1.87
|
Far West Manto
|
|
200939
|
347947
|
6843726
|
0.35
|
1.11
|
West Manto
|
|
200921
|
348146
|
6843366
|
0.59
|
1.25
|
West Manto
|
|
200924
|
348183
|
6843307
|
0.19
|
1.3
|
West Manto
|
|
200937
|
348068
|
6843553
|
0.92
|
1.75
|
West Manto
|
|
200911
|
347927
|
6843510
|
0.14
|
1.84
|
West Manto
|
|
200938
|
348004
|
6843660
|
0.09
|
2.09
|
West Manto
|
Perth Property
During August and September 2011, we completed a preliminary mapping and sampling program on the Perth property. Through the program several new mineralized veins were identified on the north half of the property. A total of 129 reconnaissance samples were collected. Of the 129 samples collected, 48 samples returned gold grades greater than 1.00 g/t and 46 samples returned copper grades of over 1%. Table 9 summarizes the significant assay results.
Table 9: Results from reconnaissance samples
|
Sample ID
|
Au (g/t)
|
Cu (%)
|
Co (ppm)
|
|
0003
|
7.47
|
1.73
|
915
|
|
0010
|
7.37
|
3.63
|
45
|
|
0016
|
8.86
|
2.29
|
664
|
|
0017
|
29.93
|
1.10
|
1139
|
|
0033
|
21.66
|
2.85
|
1086
|
|
0042
|
0.90
|
7.74
|
283
|
|
0077
|
10.20
|
2.43
|
62
|
|
0078
|
8.39
|
3.78
|
24
|
|
0097
|
4.42
|
0.14
|
275
|
|
0098
|
10.27
|
0.51
|
110
|
|
0099
|
3.61
|
0.19
|
482
|
|
0100
|
6.37
|
0.22
|
25
|
|
0110
|
22.58
|
1.51
|
115
|
|
0121
|
11.12
|
3.90
|
82
|
21
Capital resources
Our ability to acquire and explore our Chilean claims is subject to our ability to obtain the necessary funding. We expect to raise funds through loans from private or affiliated persons and sales of our debt or equity securities. We have no committed sources of capital. If we are unable to raise funds as and when we need them, we may be required to curtail, or even to cease, our operations.
On April 7, 2011, we completed a private equity financing for net proceeds after commissions, legal and closing fees of $1,862,462. We paid the placement agent a cash commission of $58,900 and issued a warrant to purchase 196,333 shares of our common stock. The securities offered were not registered under the Securities Act of 1933 and may not be offered or sold in the United States absent registration or an applicable exemption from the registration requirements. On May 13, 2011, we filed registration statement on form S-1 to register 4,623,333 shares of our common stock, and 4,819,666 shares of common stock underlying warrants which were a part of the above private equity
financing.
Contingencies and commitments
We had no contingencies at October 31, 2011.
Contractual Obligations
Our commitments under the Farellon, Che, Veta Negra and Este contracts are the only contractual obligations that we have. Table 10 summarizes contractual obligations and commitments as of December 12, 2011 for the next five fiscal years.
Table 10: Contractual Obligations
| Payments due by period | ||||||||||||||||||||
|
Less than 1 year
|
1 – 3 years
|
3 – 5 years
|
More than 5 years *
|
Total
|
||||||||||||||||
|
Option payments
|
$ | 88,532 | $ | 202,889 | $ | - | $ | - | $ | 291,421 | ||||||||||
|
Royalty payments
|
- | - | - | 1,404,127 | 1,404,127 | |||||||||||||||
|
Total
|
$ | 88,532 | $ | 202,889 | $ | - | $ | 1,404,127 | $ | 1,695,548 | ||||||||||
*The royalty payments are due once exploration begins.
|
•
|
Farellon royalty. We are committed to paying the vendor a royalty equal to 1.5% on the net sales of minerals extracted from the Farellon claims up to a total of $600,000. The royalty payments are due monthly once exploitation begins and are subject to minimum payments of $1,000 per month. We have no obligation to pay the royalty if we do not commence exploitation. As of the date of this report we have not commenced exploitation.
|
22
|
•
|
Che royalty. We are committed to paying a royalty equal to 1% of the net sales of minerals extracted from the claims to a maximum of $100,000 to the former owner. The royalty payments are due monthly once exploitation begins, and are not subject to minimum payments.
|
|
•
|
Veta Negra option. On June 30, 2011, Minera Farellon agreed to sell us its option to purchase the Veta Negra and Exon claims for the total cash payment of $107,500 ($17,500 payable to Minera Farellon to exercise the option, and $90,000 payable to the vendors). As of the date of this report, we must pay $97,500 payable in two installments over 14 months to exercise the option. If we complete acquisition of the property we are committed to paying the vendor a royalty equal to 1.5% of the net sales of minerals extracted from the claims to a total maximum of $500,000. The royalty can also be bought for $500,000 at any time. The royalty payments are due monthly once
exploitation begins, and are not subject to minimum payments.
|
|
•
|
Este option. On August 3, 2011, we entered into an option to purchase contract with unrelated vendors. Under the terms of the agreement, we paid 5,000,000 Chilean Pesos ($10,900 US) upon execution of the contract, and agreed to pay 95,000,000 Pesos ($193,100 US) in various stages by February 3, 2014 to complete acquisition of the property. After we complete acquisition of the property we are committed to paying the vendor a royalty equal to 1.5% of the net sales of minerals extracted from the claims to a total maximum of 100,000,000 Pesos (approximately $204,000 US).
|
Equity financing
To generate working capital, between January 31, 2009 and December 12, 2011, we issued 12,983,632 shares of our common stock and warrants for the purchase of 7,509,666 shares to raise $3,527,017 under Regulations S and D promulgated under the Securities Act of 1933.
We anticipate incurring operating losses in the foreseeable future and will require additional equity capital to support our operations and develop our business plan. If we succeed in completing future equity financing, the issuance of additional shares will result in dilution to our existing shareholders.
Debt financing
On February 22, 2010, we borrowed US $50,000 and issued a demand promissory note payable to the lender for the principal sum together with interest at 6% per annum. See Related-party transactions below.
On March 2, 2011, we borrowed US $11,000 and issued a demand promissory note payable to the lender for the principal sum together with interest at 8% per annum. See Related-party transactions below.
On August 25, 2011, we borrowed US $30,000 and issued a demand promissory note payable to the lender for the principal sum together with interest at 8% per annum. See Related-party transactions below.
On September 19, 2011, we borrowed Cdn $62,387 (equivalent to US $62,797) and issued a demand promissory note payable to the lender for the principal sum together with interest at 8% per annum. See Related-party transactions below.
On October 25, 2011, we borrowed US $10,000 and issued a demand promissory note payable to the lender for the principal sum together with interest at 8% per annum. See Related-party transactions below.
Challenges and risks
We do not anticipate generating any revenue over the next twelve months. We plan to fund our operations through any combination of equity or debt financing from the sale of our securities, private loans, joint ventures or through the sale of part interest in our mineral properties. Although we have succeeded in raising funds as we have needed them, we cannot assure you that this will continue in the future. Many things, such as the continued general downturn, worldwide, of the economy or a significant decrease in the price of minerals, could affect the willingness of potential investors to invest in risky ventures such as ours. In addition to the Perth joint venture earn-in
agreement, we may consider entering into a joint venture partnership with a more senior resource company to complete a mineral exploration program on other properties in Chile. If we enter into a joint venture arrangement, we would likely have to assign a percentage of our interest in our mineral claims to our joint venture partner in exchange for the funding.
23
Investments in and expenditures on mineral interests
Realization of our investments in mineral properties depends upon our maintaining legal ownership, producing from the properties or gainfully disposing of them.
Title to mineral claims involves risks inherent in the difficulties of determining the validity of claims as well as the potential for problems arising from the ambiguous conveyancing history characteristic of many mineral claims. Our contracts and deeds have been notarized, recorded in the registry of mines and published in the mining bulletin. We review the mining bulletin regularly to discover whether other parties have staked claims over our ground. We have discovered no such claims. To the best of our knowledge, we have taken the steps necessary to ensure that we have good title to our mineral claims.
Foreign exchange
We are subject to foreign exchange risk for transactions denominated in foreign currencies. Foreign currency risk arises from the fluctuation of foreign exchange rates and the degree of volatility of these rates relative to the United States dollar. We do not believe that we have any material risk due to foreign currency exchange.
Trends, events or uncertainties that may impact results of operations or liquidity
The economic crisis in the United States and the resulting economic uncertainty and market instability may make it harder for us to raise capital as and when we need it and have made it difficult for us to assess the impact of the crisis on our operations or liquidity and to determine if the prices we will receive on the sale of minerals will exceed the cost of mineral exploitation. If we are unable to raise cash, we may be required to cease our operations. Other than as discussed in this quarterly report, we know of no other trends, events or uncertainties that have or are reasonably likely to have a material impact on our short-term or long-term liquidity.
Off-balance sheet arrangements
We have no off-balance sheet arrangements and no non-consolidated, special-purpose entities.
Related-party transactions
Table 11 describes amounts that were due to related parties at the fiscal year ended January 31, 2011 and the period ended October 31, 2011.
|
Table 11: Due to related parties
|
||||||||
|
October 31, 2011
|
January 31, 2011
|
|||||||
|
Due to Da Costa Management Corp.
|
$ | 127,645 | $ | 228,330 | ||||
|
Due to Fladgate Exploration Consulting Corporation
|
$ | 503,475 | $ | 207,742 | ||||
|
Due to Minera Farellon Limitada
|
$ | 54,328 | $ | 63,692 | ||||
|
Due to Kevin Mitchell
|
$ | 4,331 | $ | 10,347 | ||||
During the nine months ended October 31, 2011 and 2010 we incurred the following expenses with related parties:
|
•
|
$225,491 and $119,273, respectively, in consulting and other business expenses for services provided by Da Costa Management Corp., a company owned by our CFO and treasurer
|
|
•
|
$555,678 and $104,125, respectively, in administration, advertising and promotion, mineral exploration, travel and other business expenses for services provided by or paid on our behalf by Fladgate Exploration Consulting Corporation, a company controlled by our directors
|
24
|
•
|
$51,788 and $46,470, respectively, in administration, automobile, rental, and other business expenses for services provided by Minera Farellon Limitada, a company owned by Richard Jeffs, the father of our president
|
|
•
|
$37,242 and $18,608, respectively, in administration expenses, salary and other reimbursable expenses with Kevin Mitchell
|
On April 1, 2011, we engaged Fladgate Exploration to manage the exploration programs on our properties in Chile. The engagement is expected to last until December 2011 although either party can cancel it with a 30 days’ notice. Under the terms of the engagement Fladgate agreed to supply its professional geo consulting services within the industry standard rates. This agreement was conducted in the normal course of operations on terms no less favorable than terms available to or from independent third parties.
Notes payable to related parties
Table 12 describes the promissory notes and accrued interest payable to related parties at October 31, 2011, and January 31, 2011.
Table 12: Notes payable to related parties
|
October 31,
2011
|
January 31,
2011
|
|||||||
|
Note payable to the company owned by Richard Jeffs a
|
$ | 55,323 | $ | 52,902 | ||||
|
Notes payable to Richard Jeffs b
|
52,058 | – | ||||||
|
Notes payable to Caitlin Jeffs c
|
– | 60,746 | ||||||
|
Notes payable to Fladgate Exploration Consulting Corporation d
|
63,376 | – | ||||||
|
Total notes payable to related parties
|
$ | 170,757 | $ | 113,648 | ||||
|
a The principle amount is $50,000. It is payable on demand, unsecured and bears interest at 6% per annum compounded monthly. Interest of $5,323 had accrued as at October 31, 2011.
b The principle amount of the notes payable is $51,000. They are payable on demand, unsecured and bear interest at 8% per annum compounded monthly. Interest of $1,058 had accrued as at October 31, 2011.
c The principle amounts of the notes payable to Caitlin Jeffs were $10,000 US and $50,000 Cdn. They were payable on demand, unsecured and bore interest at 8% per annum compounded monthly. Interest of $1,837 had accrued as at April 8, 2011 when the notes were paid in full.
d The principle amount is $62,389 Cdn ($62,797 US). It is payable on demand, unsecured and bears interest at 8% per annum compounded monthly. Interest of $579 had accrued as at October 31, 2011.
|
||||||||
Critical Accounting Estimates
An appreciation of our critical accounting judgments is necessary to understand our financial results. These policies may require that we make difficult and subjective judgments regarding uncertainties, and as a result, such estimates may significantly impact our financial results. The precision of these estimates and the likelihood of future changes depend on a number of underlying variables and a range of possible outcomes. Other than our accounting for the fair value of our unproved mineral properties, accruals for accounting, auditing, legal expenses and mineral property costs, our critical accounting policies do not involve the choice between alternative methods of
accounting. We have applied our critical accounting judgments consistently.
25
Reclassifications
Certain comparative amounts in the accompanying consolidated financial statements have been reclassified to conform to the current year’s presentation. These reclassifications had no effect on the consolidated results of operations or financial position for any year presented.
Unproved mineral property costs
We have been in the exploration stage since our inception on January 10, 2005 and have not yet generated significant revenue from our operations. We are primarily engaged in acquiring and exploring mining claims. We expense our mineral exploration costs as we incur them. When we have determined that a mineral claim can be economically developed as a result of establishing proven and probable reserves, we capitalize the costs then incurred to develop the claim and will amortize them using the units-of-production method over the estimated life of the probable reserve. If mineral claims are subsequently abandoned or impaired we will charge capitalized costs to operations.
Financial instruments
Our financial instruments include cash, accounts receivable, accounts payable, accrued liabilities, accrued professional fees and accrued mineral property costs. The fair value of these financial instruments approximates their carrying values due to their short maturities.
Recently Adopted Accounting Guidance
The Company has reviewed recently issued accounting pronouncements and plans to adopt those that are applicable to it. We do not expect the adoption of these pronouncements to have a material impact on our financial position, results of operations or cash flows.
26
Item 3. Quantitative and Qualitative Disclosures about Market Risk.
As a smaller reporting company, we are not required to provide this disclosure.
Item 4. Controls and Procedures.
(a) Disclosure Controls and Procedures
Caitlin Jeffs, our chief executive officer and president, and John da Costa, our chief financial officer, have evaluated the effectiveness of our disclosure controls and procedures (as the term is defined in Rules 13a-15 and 15d-15 under the Securities Exchange Act of 1934) as of the end of the period covered by this report (the “evaluation date”). Based on their evaluation, they have concluded that, as of the evaluation date, our disclosure controls and procedures are effective to ensure that information required to be disclosed by us in the reports that we file or submit under the Exchange Act is recorded, processed, summarized and reported within the time periods
specified in the Securities and Exchange Commission’s rules and forms.
(b) Changes in internal control over financial reporting
During the period covered by this report, there were no changes to our internal control over financial reporting that have materially affected, or are reasonably likely to materially affect, our internal control over financial reporting.
PART II—OTHER INFORMATION
Item 1. Legal Proceedings.
We are not a party to any pending legal proceedings and, to the best of our knowledge, none of our properties or assets is the subject of any pending legal proceedings.
Item 1A. Risk Factors.
As a smaller reporting company we are not required to provide this information.
Item 2. Unregistered Sales of Equity Securities and Use of Proceeds.
On October 25, 2011 Susan Jeffs exercised a warrant to purchase 200,000 shares of common stock. The exercise price was $0.30 per share. We issued the certificate for the shares on November 28, 2011. We relied on Section 4(2) of the Securities Act of 1933 to issue the common stock inasmuch as the purchaser is an accredited investor.
Item 3. Defaults upon Senior Securities.
None.
Item 4. (Removed and Reserved).
Item 5. Other Information.
None.
27
Item 6. Exhibits.
The following table sets out the exhibits either filed herewith or incorporated by reference.
|
Exhibit
|
Description
|
|
3.1.1
|
Articles of Incorporation1
|
|
3.1.2
|
Certificate of Amendment to Articles of Incorporation2
|
|
3.2
|
By-laws1
|
|
10.1
|
Red Metal Resources Ltd. 2011 Equity Incentive Plan3
|
|
31.1
|
Certification pursuant to Rule 13a-14(a) and 15d-14(a)4
|
|
31.2
|
Certification pursuant to Rule 13a-14(a) and 15d-14(a)4
|
|
32
|
Certification pursuant to Section 1350 of Title 18 of the United States Code4
|
|
101.INS**
|
XBRL Instance
|
|
101.SCH**
|
XBRL Taxonomy Extension Schema
|
|
101.CAL**
|
XBRL Taxonomy Extension Calculation
|
|
101.DEF**
|
XBRL Taxonomy Extension Definition
|
|
101.LAB**
|
XBRL Taxonomy Extension Labels
|
|
101.PRE**
|
XBRL Taxonomy Extension Presentation
|
|
1 Incorporated by reference from the registrant’s report on Form SB-2 filed with the Securities and Exchange Commission on May 22, 2006 as file number 333-134-363
2Incorporated by reference from the registrant’s Quarterly report on Form 10-Q for the period ended October 31, 2010 and filed with the Securities and Exchange Commission on December 13, 2010.
3Incorporated by reference from the registrant's registration statement on Form S-8 filed with the Securities and Exchange Commission on September 23, 2011.
4Filed herewith
|
|
| ** XBRL information is furnished and not filed or a part of a registration statement or prospectus for purposes of sections 11 or 12 of the Securities Act of 1933, as amended, is deemed not filed for purposes of section 18 of the Securities Exchange Act of 1934, as amended, and otherwise is not subject to liability under these sections. |
28
SIGNATURES
Pursuant to the requirements of the Securities Exchange Act of 1934, the registrant has duly caused this report to be signed on its behalf by the undersigned thereunto duly authorized.
December 15, 2011
|
RED METAL RESOURCES LTD.
|
|||
|
By:
|
/s/ Caitlin Jeffs | ||
| Caitlin Jeffs, Chief Executive Officer and President | |||
| By: | /s/ John da Costa | ||
| John da Costa, Chief Financial Officer | |||
29