Attached files
UNITED STATES
SECURITIES AND EXCHANGE COMMISSION
Washington, D.C. 20549
FORM 10-K
(Mark One)
|
x
|
ANNUAL REPORT PURSUANT TO SECTION 13 OR 15(d) OF THE SECURITIES EXCHANGE ACT OF 1934
|
For the fiscal year ended October 2, 2011
OR
|
o
|
TRANSITION REPORT PURSUANT TO SECTION 13 OR 15(d) OF THE SECURITIES EXCHANGE ACT OF 1934
|
For the transition period from ________ to ________
Commission file number 1-16699
OVERHILL FARMS, INC.
(Exact name of registrant as specified in its charter)
|
Nevada
|
75-2590292
|
|
|
(State or other jurisdiction of incorporation or organization)
|
(IRS Employer Identification Number)
|
|
|
2727 East Vernon Avenue
|
||
|
Vernon, California
|
90058
|
|
|
(Address of principal executive offices)
|
(Zip code)
|
(323) 582-9977
(Registrant’s telephone number, including area code)
Securities registered pursuant to Section 12(b) of the Act: None
| Title of each class | Name of each exchange on which registered | |
| Common Stock, par value $0.01 | NYSE AMEX |
Securities registered pursuant to Section 12(g) of the Act: None
Indicate by check mark if the registrant is a well-known seasoned issuer, as defined in Rule 405 of the Securities Act. Yes o No x
Indicate by check mark if the registrant is not required to file reports pursuant to Section 13 or Section 15(d) of the Act. Yes o No x
Indicate by check mark whether the registrant (1) has filed all reports required to be filed by Section 13 or 15(d) of the Securities Exchange Act of 1934 during the preceding 12 months (or for such shorter period that the registrant was required to file such reports), and (2) has been subject to such filing requirements for the past 90 days. Yes x No o
Indicate by check mark whether the registrant has submitted electronically and posted on its corporate Web site, if any, every Interactive Data File required to be submitted and posted pursuant to Rule 405 of Regulation S-T during the preceding 12 months (or for such shorter period that the registrant was required to submit and post such files). Yes x No o
Indicate by check mark if disclosure of delinquent filers pursuant to Item 405 of Regulation S-K is not contained herein, and will not be contained, to the best of registrant's knowledge, in definitive proxy or information statements incorporated by reference in Part III of this Form 10-K or any amendment to this Form 10-K. x
Indicate by check mark whether the registrant is a large accelerated filer, an accelerated filer, a non-accelerated filer or a smaller reporting company. See definitions of “large accelerated filer,” “accelerated filer,” and “smaller reporting company” in Rule 12b-2 of the Exchange Act. (Check one):
|
Large Accelerated Filer o
|
Accelerated Filer o
|
|
Non-Accelerated Filer o
|
Smaller Reporting Company x
|
(Do not check if smaller reporting company)
Indicate by check mark whether the registrant is a shell company (as defined in Rule 12b-2 of the Exchange Act). Yes o No x
The aggregate market value of voting common equity held by non-affiliates of the registrant, on April 1, 2011, which was the last trading day of the registrant’s second fiscal quarter ended April 3, 2011, was approximately $52.7 million based on a closing price of $6.08 per share on such date on the NYSE AMEX. For purposes of this computation, all executive officers, directors and 10% beneficial owners of the registrant are deemed to be affiliates. Such determination should not be deemed an admission that such executive officers, directors and 10% beneficial owners are affiliates. The registrant has no non-voting common equity.
There were 15,823,271 shares of the registrant’s common stock, $.01 par value, outstanding as of December 14, 2011.
Documents Incorporated By Reference: None
TABLE OF CONTENTS
|
PART I
|
||
|
Item 1
|
1
|
|
|
Item 1A
|
3
|
|
|
Item 1B
|
6
|
|
|
Item 2
|
6
|
|
|
Item 3
|
7
|
|
|
Item 4
|
8
|
|
|
PART II
|
||
|
Item 5
|
8
|
|
|
Item 6
|
9
|
|
|
Item 7
|
10
|
|
|
Item 7A
|
20
|
|
|
Item 8
|
20
|
|
|
Item 9
|
20
|
|
|
Item 9A
|
20
|
|
|
Item 9B
|
21
|
|
|
PART III
|
||
|
Item 10
|
22
|
|
|
Item 11
|
24
|
|
|
Item 12
|
30
|
|
|
Item 13
|
32
|
|
|
Item 14
|
33
|
|
|
PART IV
|
||
|
Item 15
|
34 | |
|
37
|
||
CAUTIONARY STATEMENT
All statements included or incorporated by reference in this Annual Report on Form 10-K, other than statements or characterizations of historical fact, are forward-looking statements. Examples of forward-looking statements include, but are not limited to, statements concerning projected net revenues, costs and expenses and gross margins; our accounting estimates, assumptions and judgments; our success in pending litigation; the demand for our products; the availability and pricing of commodities; the competitive nature of and anticipated growth in our industry; manufacturing capacity and goals; our ability to consummate acquisitions and integrate their operations successfully; and our prospective needs for additional capital.
These forward-looking statements are based on our current expectations, estimates, approximations and/or projections about our industry and business, management’s beliefs, and certain assumptions made by us, all of which are subject to change. Forward-looking statements can often be identified by words such as “anticipates,” “expects,” “intends,” “plans,” “predicts,” “believes,” “seeks,” “estimates,” “may,” “will,” “should,” “would,” “could,” “potential,” “continue,” “on-going,” similar expressions, and variations or negatives of these words. These statements are not guarantees of future performance and are subject to risks, uncertainties and assumptions that are difficult to predict. Therefore, our actual results could differ materially from those expressed in any forward-looking statements as a result of various factors, some of which are listed under “Risk Factors” in Item 1A of this report. These forward-looking statements speak only as of the date of this report. We undertake no obligation to revise or update publicly any forward-looking statement for any reason, except as otherwise required by law.
PART I
ITEM 1. Business
History
Overhill Farms, Inc. was formed in 1995 as a Nevada corporation, with the acquisition of substantially all of the assets of IBM Foods, Inc., founded in 1968. Our headquarters and manufacturing facilities are located in Vernon, California. Our products are sold nationwide.
Products and Services
We are a value-added manufacturer of high quality, prepared frozen food products for branded retail, private label, foodservice and airline customers. Our product line includes entrées, plated meals, bulk-packed meal components, pastas, soups, sauces, poultry, meat and fish specialties, and organic and vegetarian offerings. Our extensive research and development efforts, combined with our extensive catalogue of recipes and flexible manufacturing capabilities, provide customers with a one-stop solution for new product ideas, formulations and product manufacturing, as well as precise replication of existing recipes. Our capabilities allow customers to outsource product development, product manufacturing and packaging, thereby avoiding significant fixed-cost and variable investments in resources and equipment. Our customers include prominent nationally recognized names such as Panda Restaurant Group, Inc., Jenny Craig, Inc., Safeway Inc., Target Corporation, Pinnacle Foods Group LLC, and American Airlines, Inc. We also sell frozen foods under the Boston Market brand, under exclusive license with Boston Market Corporation.
Sales and Marketing
We operate as a single business segment – the development and production of frozen food products. We market our products through an internal sales force, outside food brokers and other business affiliations. Our customers are foodservice, retail and airline accounts.
A significant portion of our total net revenues during the last three fiscal years was derived from three customers as described below:
|
Net Revenues
|
||||||||||||
|
|
|
|
|
|||||||||
|
|
October 2,
|
September 26,
|
September 27,
|
|||||||||
|
Customer
|
2011
|
2010
|
2009
|
|||||||||
|
Jenny Craig, Inc.
|
29 | % | 28 | % | 27 | % | ||||||
|
Panda Restaurant Group, Inc.
|
26 | % | 27 | % | 22 | % | ||||||
|
Safeway Inc.
|
16 | % | 18 | % | 17 | % | ||||||
Manufacturing and Sourcing
Our headquarters, entrée manufacturing and warehousing, product development, sales and quality control facilities are located in Vernon, California. We also maintain a separate protein cooking facility in Vernon, California.
Our ability to cost-effectively produce large quantities of our products, while maintaining a high degree of quality, is partially dependent on our ability to procure raw materials on an economical and competitive cost basis. We rely on numerous suppliers, large and small, for our products, with multiple suppliers for most items. While commodity prices are rising we do not anticipate any particular difficulty in acquiring these materials in the future. We store raw materials, packaging and finished goods on-site and in public frozen and dry food storage facilities until shipment. When possible and practical, we negotiate supply contracts at fixed prices to protect against the risk of market fluctuations.
Backlog
We typically deliver products directly from finished goods inventory. As a result, we do not maintain a large backlog of unfilled purchase orders. While at any given time there may be a small backlog of orders, our backlog is not material in relation to our total revenues, nor is it necessarily indicative of trends in our business.
Competition
Our products compete with those produced by numerous regional and national firms. Many of our competitors, including diversified food companies, are large and have greater financial resources than we do. Competition is strong, with many firms producing alternative products for the foodservice and retail industries. Competitive factors include price, reliability, food safety standards, product quality, flexibility, product development, customer service and, on a retail basis, name recognition. We compete in this market based on our ability to produce mid-sized to large custom product runs within a short time frame on a cost-effective basis and our ability to provide ancillary support services such as research and development, assistance with regulatory matters, production planning and logistics.
Product Development and Marketing
We maintain a comprehensive, fully staffed research and development department that formulates recipes and upgrades specific products and product lines for current and prospective customers and establishes production and quality standards. We develop products based upon customer specifications, conventional recipes, new product trends or our own product initiatives. We are continuously developing recipes as customers’ tastes and client requirements change. We also maintain a quality control department for inspection, testing, monitoring and compliance to ensure that our products are produced consistently in accordance with our standards. In May 2010, our food safety systems were certified as meeting standards of the global Food Safety Management System standard FSSC 22000, which is the latest and most complete safety certification standard for food manufacturers.
Intellectual Property
We have registered the “Overhill Farms” and “Chicago Brothers” trademarks with the United States Patent and Trademark Office. Also, during fiscal year 2008, we entered into a five-year licensing agreement with Better Living Brands tm Alliance for the exclusive right to produce and sell certain frozen entrées under the Eating Right tm and O Organics tm brands.
On November 4, 2010, we entered into a five-year licensing agreement with Boston Market Corporation (“BMC”) for the exclusive right to use BMC’s trademarks, trade dress and copyrights in connection with the manufacturing, advertising, promotion, sales and distribution of frozen food and certain shelf-stable licensed products. The agreement commenced on July 1, 2011. The agreement also contains options for two sixty-month renewal terms.
Employees
Our total hourly and salaried workforce consisted of 736 employees at October 2, 2011. Most of our operations are labor intensive, generally requiring unskilled and semi-skilled employees. Approximately 78% of our employees are unionized with the United Food & Commercial Workers Union, Local 770 and are covered by a two-year collective bargaining agreement that was ratified by the union on August 7, 2011. We believe our relations with our employees and the union are good.
Regulation
Food manufacturers are subject to strict government regulation, particularly in the health and environmental areas, by the United States Department of Agriculture (“USDA”) and the Food and Drug Administration (“FDA”), as well as the Occupational Safety and Health Administration (“OSHA”), the Environmental Protection Agency (“EPA”) and the federal Food, Drug and Cosmetic Act. Our food processing facilities are subject to continuous on-site examination, inspection and regulation by the USDA. Compliance with the current applicable federal, state and local environmental regulations has not adversely affected our financial position, results of operations or competitive position. However, we cannot predict whether regulation by various federal, state or local governmental entities and agencies may adversely affect our future business and financial results. If a product recall were to occur, we have processes and procedures in place to assist in the recall of products. Since 1997, we have used a Hazard Analysis Critical Point Plan to ensure proper handling of all food items. In May 2010, our food safety systems were certified as meeting the standards of FSSC 22000, which is the latest and most complete safety certification standard for food manufacturers.
Additional Information
Our Annual Reports on Form 10-K, Quarterly Reports on Form 10-Q, Current Reports on Form 8-K, and amendments to those reports filed or furnished pursuant to Section 13(a) or 15(d) of the Securities Exchange Act of 1934, as amended (“Exchange Act”), are available free of charge on our website at www.overhillfarms.com as soon as reasonably practicable after being filed or furnished to the Securities and Exchange Commission (“Commission”). Our reports filed with the Commission are also made available to read and copy at the Commission’s Public Reference Room at 100 F Street, N.E., Washington, D.C. 20549. You may obtain information about the Public Reference Room by contacting the Commission at 1-800-SEC-0330. Reports filed with the Commission are also made available on its website at www.sec.gov.
Our ability to compete effectively in the highly competitive food industry may affect our operational performance and financial results.
Our continued success depends in part on our ability to be an efficient producer in the highly competitive food industry. We face competition in all of our markets from large, national companies and smaller, regional operators. Many of our competitors, including diversified food companies, are larger and have greater financial resources than we do. From time to time, we experience price pressure in some of our markets as a result of competitors’ promotional pricing practices as well as general market conditions. Our failure to match or exceed our competitors’ cost reductions through productivity gains and other improvements could weaken our competitive position. Competition is based on product quality, reliability, food safety, distribution effectiveness, brand loyalty, price, effective promotional activities, the ability to identify and satisfy emerging consumer preferences and the ability to provide ancillary support services. We may not be able to effectively compete with these larger, more diversified companies. Also, a disruption of our supply chain could impair our ability to manufacture or supply goods. In addition, products have life cycles, and as the lives of our products diminish, we may not be able to replace our existing customers.
The loss or consolidation of any of our key customers could adversely affect our financial results by decreasing our existing sales opportunities and prices and increasing our marketing and promotional expenses.
The largest purchasers of our products, Jenny Craig, Inc., Panda Restaurant Group, Inc. and Safeway Inc., accounted for approximately 29%, 26% and 16%, respectively, of our total net revenues during fiscal year 2011. We expect that our sales to these customers will continue to constitute a significant percentage of our net revenues in fiscal year 2012 and beyond. The loss of any of these customers as a significant outlet for our products could adversely affect our competitive position and operating results if we do not continue to obtain additional customers to offset any change in these accounts.
Some of our significant customer and supplier contracts are short-term and may not be renewable on terms favorable to us or at all.
Some of our customers and suppliers operate through purchase orders or short-term contracts. Though we have long-term business relationships with many of our customers and suppliers and alternative sources of supply for key items, we cannot be sure that any of these customers or suppliers will continue to do business with us on the same basis. Additionally, although we try to renew these contracts as they expire, there can be no assurance that these customers or suppliers will renew these contracts on terms that are favorable to us, if at all. The termination of, or modification to, any number of these contracts may adversely affect our business and prospects, including our financial performance and results of operations.
Financial difficulties of foodservice and retail customers due to the economic downturn may adversely affect our revenues, costs and collections.
While we have not historically experienced material write-offs, as the domestic economic recovery continues to stall, collectability of receivables from our customers may be adversely affected, causing an increase in aged receivables and/or a reduced collection rate. Our margins could be adversely affected if we are forced to write off uncollectible accounts. In addition, the economic downturn could and may continue to adversely affect the fiscal health of key customers or impair their ability to continue to operate during a recessionary period, which would decrease our revenues unless we are able to replace any lost business.
Future airline mergers or bankruptcies, additional cost-cutting in the airline industry or other financial difficulties of our airline customers may adversely affect our revenues, costs and collections.
In fiscal year 2011, sales to airline customers were approximately $8.1 million, or 4.8% of total net revenues, compared to sales of $8.0 million in fiscal year 2010 and $11.1 million in fiscal year 2009, representing 4.1% and 5.3% of total net revenues in fiscal years 2010 and 2009, respectively. Additionally, accounts receivable from airline-related customers accounted for approximately 6.6% and 4.8% of the total accounts receivable balance at October 2, 2011 and September 26, 2010, respectively. Given the financial and business challenges facing the airline industry, we carefully monitor our receivables from all of our customers in this sector. The on-going effect of these challenges on the airline industry, airline revenues, and on our business in particular cannot be accurately determined and could further adversely affect our financial position, results of operations or cash flows by, among other things, decreasing our sales to and making it more difficult to collect receivables from airline customers.
We are a major purchaser of many commodities that we use as raw materials and for packaging, and price changes for the commodities we depend on may adversely affect our profitability.
When possible, we enter into contracts for the purchase of raw materials at fixed prices, which are designed to protect us against raw material price increases during the terms of the contracts. Where appropriate, we attempt to recover our commodity cost increases by increasing prices, promoting a higher-margin product mix and creating additional operating efficiencies.
We also use materials, such as corrugated cardboard, aluminum products, films and plastics to package our products. Substantial increases in prices of packaging materials or higher prices of our raw materials could adversely affect our operating performance and financial results. In addition, transportation costs have been unpredictable. If such costs rise to the levels seen in past years, our operating margins could be eroded.
Commodity price changes may result in unexpected increases in raw materials and packaging costs, and we may be unable to immediately increase our prices to offset these increased costs without suffering reduced volume, revenue and income. Any substantial fluctuation in the prices we pay for raw materials and packaging, if not offset by increases in our sales prices, a higher-margin product mix or additional operating efficiencies, could adversely affect our profitability.
If our food products become adulterated or misbranded, we would need to recall those items and may experience product liability claims if consumers are injured as a result.
Food products occasionally contain contaminants due to inherent defects or improper storage or handling. Under adverse circumstances, food manufacturers such as us may need to recall some of their products if they become adulterated or misbranded or as a result of a government-mandated recall.
The scope of such a recall could result in significant costs incurred as a result of the recall, potential destruction of inventory, and lost sales. Should consumption of any product cause injury, we may be liable for monetary damages as a result of a settlement or judgment against us. A widespread product recall could result in changes to one or more of our business processes, product shortages, a loss of customer confidence in our food or other adverse effects on our business.
If we are required to defend against a product liability claim, whether or not we are found liable under the claim, we could incur substantial costs, our reputation could suffer and our customers might substantially reduce their existing or future orders from us.
Concerns with the safety and quality of food products could cause customers to avoid our products.
We could be adversely affected if our customers and the ultimate consumers of our products lose confidence in the safety and quality of various food products. Adverse publicity about these types of concerns, such as the publicity about genetically modified organisms and avian influenza, whether or not valid, may discourage our customers from buying our products or cause production and delivery disruptions. Negative changes in customer perceptions about the safety and quality of products we produce could adversely affect our business and financial condition.
Our business is subject to federal, state and local government regulations that could adversely affect our business and financial position.
Virtually all food manufacturing operations are subject to regulation by various federal, state and local government entities and agencies. As a producer of food products for human consumption, our operations are subject to stringent production, packaging, quality, labeling and distribution standards, including regulations mandated by the federal Food, Drug and Cosmetic Act, the FDA, OHSA, the EPA and the USDA. Future regulation by various federal, state or local governmental entities or agencies could, among other things, increase our cost of production, cause us to incur unexpected expenditures or encumber productivity, any of which may adversely affect our business and financial results.
In addition, our business operations are subject to federal, state and local environmental laws and regulations, which may change from time to time, pertaining to the discharge of materials into the environment, the handling and disposition of wastes (including solid and hazardous wastes) or otherwise relating to protection of the environment. We cannot predict whether environmental issues relating to presently known matters or identified sites or to other matters or sites will require currently unanticipated investigation, assessment or expenditures.
Future instability or tightening in the credit markets could impair our ability to obtain financing as and when needed.
Future instability or tightening in the credit markets could impair our ability to obtain additional credit if and when needed to finance our operations and fund future plant or business expansions. In addition, tight credit markets or inflation could eventually result in an increase in interest rates, which would adversely affect us, as we have $10.8 million in long-term debt outstanding as of December 14, 2011 under our senior secured credit facility with Bank of America, with interest rates that adjust quarterly.
If we violate our financial and other covenants under our secured credit facility, our financial condition, results of operations or cash flows may be adversely affected if secured parties foreclose on our assets or impose default rates of interest.
Our senior secured credit facility with Bank of America, under which $10.8 million was outstanding as of December 14, 2011, is secured by a first-priority lien on substantially all of our assets. The facility contains covenants whereby, among other things, we are required to maintain compliance with agreed levels of fixed charge coverage, total leverage and incremental indebtedness limits. While we are currently in compliance with all covenants, if we violate these covenants and are unable to obtain waivers or renegotiate the terms of the covenants, we could become subject to, among other things, interest rate increases and acceleration of maturity of the facility, which could adversely affect our financial condition, results of operations or cash flows.
A change in control could result in an event of default under our secured credit facility, which could adversely affect our financial condition, results of operations or cash flows.
Our secured credit facility with Bank of America provides that a change in control would occur if, among other occurrences, any person or group becomes the beneficial owner of 35% or more of our voting stock, or certain changes in the composition of our board occur during any period of twelve consecutive months. The occurrence of a change in control could permit Bank of America to terminate the credit facility, declare all or a portion of loans then outstanding to be due and payable, and/or exercise other available rights and remedies. Depending on our financial condition at the time, we may not be able to raise sufficient funds to repay this indebtedness upon an event of default. Accordingly, the occurrence of a change in control could adversely affect our financial condition, results of operations or cash flows.
A small number of stockholders beneficially own a significant percentage of our outstanding common stock and therefore could significantly influence or control matters requiring stockholder approval.
Assuming the exercise of the aggregate options issued to our executive officers and directors to purchase shares of our common stock, our executive officers, directors and stockholders who beneficially own greater than 5% of our common stock would collectively beneficially own, in the aggregate, approximately 47% of our outstanding common stock as of December 14, 2011. These stockholders, if acting together, could be able to significantly influence or control matters requiring approval by our stockholders, including the election of directors and the approval of mergers or other business combination transactions.
Our failure to attract and retain key management personnel could adversely affect our business.
Our business requires managerial, financial and operational expertise, and our future success depends upon the continued service of key personnel. As a value-added manufacturer of quality frozen food products and custom prepared foods, we operate in a specialized industry. Our key personnel have experience and skills specific to this industry, and there are a limited number of individuals with the relevant experience and skills. Though we have an employment agreement with James Rudis, our CEO and President, the agreement permits the voluntary resignation on the part of Mr. Rudis prior to the end of the term of the agreement. If we lose any of our key personnel, our business operations could be adversely affected.
We may not be able to protect our intellectual property and proprietary rights or may become subject to claims relating to our use of our customers’ trademarks, which could harm our competitive position, resulting in decreased revenue.
We believe that our trademarks and other proprietary rights, though few in number, are important to our success and competitive position. Accordingly, we devote what we believe are adequate resources to the establishment and protection of our trademarks and proprietary rights. However, these actions may be inadequate to prevent imitation of our products by others or to prevent others from claiming violations of their trademarks and proprietary rights by us.
We manufacture products under our customers’ trademarks. While we generally require them to agree to indemnify us in connection with our use of their trademarks, it is possible that we could face infringement actions based upon the content provided by our customers. If any of these claims are proved valid, through litigation or otherwise, we may be required to cease using the trademarks and/or pay financial damages and/or expenses for which we are not indemnified.
Our common stock price is subject to significant volatility, which could result in substantial losses for investors.
During the 52-week period ended December 14, 2011, the high and low sales prices of our common stock on the NYSE AMEX were $6.30 per share and $3.15 per share, respectively. Prices for our shares are determined in the marketplace and may accordingly be influenced by many factors, including, but not limited to:
|
|
·
|
the depth and liquidity of the market for the shares;
|
|
|
·
|
announcements about our performance as well as the announcements of our competitors about the performance of their businesses;
|
|
|
·
|
investors’ evaluations of our future prospects and the food industry generally;
|
|
|
·
|
changes in earnings estimates by, or failure to meet the expectations of, securities analysts; and
|
|
|
·
|
general economic and market conditions.
|
In addition, the stock market has been experiencing significant volatility that may be unrelated to the operating performance of the specific companies whose stock is traded. This volatility could adversely affect the trading price of our shares.
The price at which investors purchase shares of our common stock may not be indicative of the price that will prevail in the trading market. Investors may be unable to sell their shares of common stock at or above their purchase price, which may result in substantial losses.
Future sales of shares of our common stock by our stockholders could cause our stock price to decline
We cannot predict the effect, if any, that sales of shares of our common stock or the availability of shares of common stock for sale will have on the market price prevailing from time to time. As of December 14, 2011, we had outstanding 15,823,271 shares of common stock, most or all of which were eligible for resale without registration. Also, as of December 14, 2011, there were outstanding options to purchase up to 521,000 shares of common stock. All of the shares of common stock underlying these options are covered by an existing effective registration statement. Sales of shares of our common stock in the public market, or perceptions that those sales may occur, could cause the trading price of our common stock to decrease or to be lower than it might be in the absence of those sales or perceptions.
Certain provisions of our articles of incorporation, bylaws and Nevada law could make it more difficult for a third party to acquire us, even if doing so could be in our stockholders’ best interest.
Provisions of our articles of incorporation and bylaws require that certain procedures be followed, including advance notice, before matters can be proposed for consideration at meetings of our stockholders. This may make it difficult for a potential acquirer to bring an acquisition proposal to a vote of our stockholders. In addition, our board of directors has the right to fix the rights and preferences of an issue of shares of preferred stock without stockholder action. Our board could establish and issue a series of preferred stock with rights that make an acquisition less desirable by certain potential acquirers.
Provisions of Nevada’s business combinations statute also restrict certain business combinations with interested stockholders. We have elected not to be governed by these provisions in our amended and restated articles of incorporation. However, this election may not be effective unless we meet certain conditions under the Nevada statute.
ITEM 1B. Unresolved Staff Comments
Not applicable.
ITEM 2. Properties
We lease two manufacturing facilities in Vernon, California. In January 2002, we entered into a ten-year lease, with an option for a five-year renewal, for a facility, Plant No. 1, that has been expanded to 170,000 square feet. On May 16, 2011, we finalized a second amendment to the lease, which was entered into as of May 6, 2011. The lease expires on September 30, 2016. Most of our principal executive office, manufacturing and warehousing, product development and sales and quality control facilities have been consolidated into this single location. In December 2008, we entered into a 60-month lease, with an option for a 60-month renewal, for a facility, Plant No. 2, that has been expanded to 123,000 square feet. Plant No. 2 is used primarily for cooking protein as well as dry and cold storage. In addition, we lease a 25,000 square foot dry goods storage facility in Vernon, California.
We believe that Plant No. 1, currently operating at approximately 50% capacity, is adequate to meet our requirements for the near future. In fiscal year 2011, items that were processed at Plant No. 1 (some of which included components that were processed at Plant No. 2) accounted for sales of approximately $116.8 million. Items that were processed in Plant No. 2 that did not require further processing in Plant No. 1 accounted for the balance of sales in fiscal year 2011 of approximately $49.4 million. As our need for cooked protein grows, it may become necessary to augment the cooking capacity that we now have at Plant No. 2. We continue to monitor our cooking capacity. If we deem additional cooking capacity to be necessary, we expect capital expenditures for that capacity could range from $5 million to $10 million during fiscal years 2012 and 2013, depending on the amount of additional cooking capacity added.
ITEM 3. Legal Proceedings
We are involved in certain legal actions and claims arising in the ordinary course of business. Management believes that such contingencies, including the matters described below, will be resolved without materially and adversely affecting our financial position, results of operations or cash flows. We intend to vigorously contest all claims and grievances described below.
Overhill Farms v. Larry (Nativo) Lopez, et al.
On June 30, 2009, we filed a lawsuit against Nativo Lopez and six other leaders of what we believe to be an unlawful campaign to force us to continue the employment of workers who had used invalid social security numbers to hide their illegal work status. Among other things, we allege that the defendants defamed us by calling our actions “racist” and unlawful. We have asserted claims for defamation, extortion, intentional interference with prospective economic advantage, and intentional interference with contractual relations. We filed the lawsuit in Orange County, California, and seek damages and an injunction barring the defendants from continuing their conduct.
All of the named defendants tried unsuccessfully to dismiss the action. In refusing to dismiss the case, the court ruled on November 13, 2009, that we had established a probability of prevailing on the merits, and that we had submitted substantial evidence that the defendants’ accusations of racism were not true. The defendants thereafter filed an appeal, which was denied by the California court of appeals. The defendants petitioned for review by the California Supreme Court, which denied review on March 2, 2011. The action has returned to the trial court for further proceedings.
Five of the six defendants have now agreed to withdraw their defamatory statements. They also agreed to a permanent injunction prohibiting them from publishing the defamatory statements they made against us. They further agreed to withdraw from and opt-out of any claims asserted on their behalf in the Agustiana case described below. Based on these agreements, we have dismissed our claims against these five defendants. We continue to press our claims against defendant Nativo Lopez, and the case is scheduled for trial in early 2012.
Agustiana, et al. v. Overhill Farms.
On July 1, 2009, Bohemia Agustiana, Isela Hernandez, and Ana Munoz filed a purported “class action” against us in which they asserted claims for failure to pay minimum wage, failure to furnish wage and hour statements, waiting time penalties, conversion and unfair business practices. The plaintiffs are former employees who had been terminated one month earlier because they had used invalid social security numbers in connection with their employment with us. They filed the case in Los Angeles County on behalf of themselves and a class which they say includes all non-exempt production and quality control workers who were employed in California during the four-year period prior to filing their complaint. The plaintiffs seek unspecified damages, restitution, injunctive relief, attorneys’ fees and costs.
We filed a motion to dismiss the conversion claim, and the motion was granted by the court on February 2, 2010.
On May 12, 2010, Alma Salinas filed a separate purported “class action” in Los Angeles County Superior Court against us in which she asserted claims on behalf of herself and all other similarly situated current and former production workers for failure to provide meal periods, failure to provide rest periods, failure to pay minimum wage, failure to make payments within the required time, unfair business practice in violation of Section 17200 of the California Business and Professions Code and Labor Code Section 2698 (known as the Private Attorney General Act (“PAGA”)). Salinas is a former employee who had been terminated because she had used an invalid social security number in connection with her employment with us. Salinas sought allegedly unpaid wages, waiting time penalties, PAGA penalties, interest and attorneys’ fees, the amounts of which are unspecified. The Salinas action has been consolidated with the Agustiana action.
In about September 2011, plaintiffs Agustiana and Salinas agreed to voluntarily dismiss and waive all of their claims against us. They also agreed to abandon their allegations that they could represent any other employees in the alleged class. We did not pay them any additional wages or money.
One former employee remains as a plaintiff, Isela Hernandez. She has not requested the court to certify her as a class representative, and no class has been certified. We have asked the court to disqualify this remaining plaintiff as a class representative, and her attorneys have asked the court to add four former employees as plaintiffs and potential class representatives. These pending motions are scheduled for hearing on December 21, 2011. Three of the four proposed new plaintiffs are former employees that we terminated one month before this case was filed because they had used invalid social security numbers in connection with their employment with us. The fourth proposed plaintiff has not worked for us since February 2007.
The parties are engaged in the discovery phase of the case, and the court has scheduled a class certification hearing date for April 2012. We believe we have valid defenses to the plaintiff’s remaining claims and that we paid all wages due to these employees.
ITEM 4. (Removed and Reserved)
ITEM 5. Market for Registrant’s Common Equity, Related Stockholder Matters and Issuer Purchases of Equity Securities
Market Information and Record Holders
Our common stock has traded on NYSE AMEX under the symbol “OFI” since November 1, 2002. At December 14, 2011, we had approximately 125 stockholders of record. These holders of record include depositories that hold shares of stock for brokerage firms which, in turn, hold shares of stock for numerous beneficial owners. On December 14, 2011, the closing sale price of our common stock on NYSE AMEX was $3.91. The following table sets forth the range of high and low sales prices for our common stock on NYSE AMEX for the periods indicated:
|
Fiscal 2010
|
High
|
Low
|
||||||
|
First Quarter from September 28, 2009 to December 27, 2009
|
$ | 6.60 | $ | 4.11 | ||||
|
Second Quarter from December 28, 2009 to March 28, 2010
|
6.35 | 4.25 | ||||||
|
Third Quarter from March 29, 2010 to June 27, 2010
|
6.67 | 5.36 | ||||||
|
Fourth Quarter from June 28, 2010 to September 26, 2010
|
6.16 | 4.05 | ||||||
|
|
||||||||
|
Fiscal 2011
|
High
|
Low
|
||||||
|
First Quarter from September 27, 2010 to January 2, 2011
|
$ | 5.90 | $ | 4.47 | ||||
|
Second Quarter from January 3, 2011 to April 3, 2011
|
6.30 | 5.55 | ||||||
|
Third Quarter from April 4, 2011 to July 3, 2011
|
6.30 | 5.38 | ||||||
|
Fourth Quarter from July 4, 2011 to October 2, 2011
|
5.65 | 3.60 | ||||||
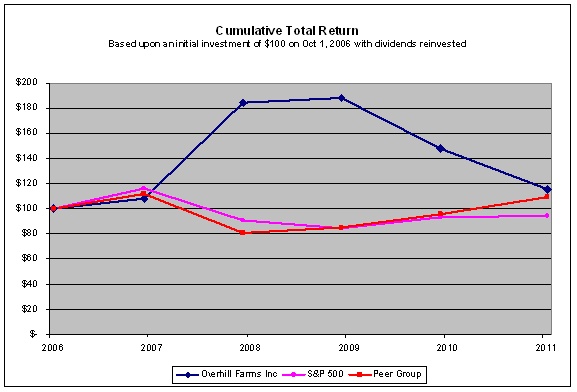
Performance Graph
The following is a line graph comparing the yearly percentage change in the cumulative total return of our common stock to the cumulative total return of the Standard & Poor’s 500 Index and a peer group for the period commencing October 1, 2006 and ending October 2, 2011. The peer group is comprised of Tyson Foods, Inc.; Cuisine Solutions, Inc.; ConAgra Foods, Inc.; Armanino Foods of Distinction, Inc.; Smithfield Foods, Inc.; and Bridgford Foods Corporation.
The graph assumes that $100 was invested in our common stock, the Standard & Poor’s 500 Index and the peer group on September 24, 2006 and that all the dividends were reinvested on a quarterly basis. Returns for the companies included in the peer group have been weighted on the basis of the market capitalization for each company.
|
Fiscal Year-Ended
|
||||||||||||||||||||||||
|
10/1/06
|
9/30/07
|
9/28/08
|
9/27/09
|
9/26/10
|
10/2/11
|
|||||||||||||||||||
|
Overhill Farms Inc
|
100.00 | 108.13 | 184.38 | 188.44 | 148.13 | 115.63 | ||||||||||||||||||
|
S&P 500
|
100.00 | 116.44 | 90.85 | 84.58 | 93.17 | 94.24 | ||||||||||||||||||
|
Peer Group
|
100.00 | 111.57 | 80.75 | 85.19 | 95.58 | 109.52 | ||||||||||||||||||
Dividends
We have never paid cash dividends on our common stock. We currently anticipate that no cash dividends will be paid on our common stock in the near term.
Recent Sales of Unregistered Securities
None.
The following selected financial data as of and for each of our last five fiscal years are derived from our financial statements, which have been audited by Ernst & Young LLP as our independent registered public accounting firm.
The data may not necessarily be indicative of our future results of operations or financial position. The historical data should be read in conjunction with “Management's Discussion and Analysis of Financial Condition and Results of Operation” and the financial statements and the related notes included elsewhere in this report.
|
|
Fiscal Year Ended
|
|||||||||||||||||||
|
Statements of Income Data
(in thousands, except per share data):
|
October 2,
2011 |
September 26,
2010 |
September 27,
2009 |
September 28,
2008 |
September 30,
2007 |
|||||||||||||||
|
|
|
|
|
|
||||||||||||||||
|
(53 weeks)
|
(52 weeks)
|
(52 weeks)
|
(52 weeks)
|
(52 weeks)
|
||||||||||||||||
|
|
|
|
|
|
||||||||||||||||
|
Net revenues
|
$ | 169,218 | $ | 194,482 | $ | 209,877 | $ | 238,780 | $ | 192,642 | ||||||||||
|
Operating income
|
2,601 | 13,925 | 15,579 | 20,616 | 11,900 | |||||||||||||||
|
Net income
|
1,442 | 7,575 | 8,301 | 10,321 | 4,562 | |||||||||||||||
|
Net income per share – Basic
|
$ | 0.09 | $ | 0.48 | $ | 0.52 | $ | 0.66 | $ | 0.30 | ||||||||||
|
Net income per share – Diluted
|
$ | 0.09 | $ | 0.47 | $ | 0.52 | $ | 0.65 | $ | 0.29 | ||||||||||
|
Weighted average shares outstanding - Basic
|
15,823,271 | 15,823,271 | 15,823,271 | 15,747,434 | 15,338,038 | |||||||||||||||
|
Weighted average shares outstanding - Diluted
|
16,051,058 | 16,049,587 | 16,028,698 | 15,992,467 | 15,803,109 | |||||||||||||||
|
As of Fiscal Year Ended
|
||||||||||||||||||||
|
Balance Sheet Data
(in thousands)
|
October 2,
2011 |
September 26,
2010 |
September 27,
2009 |
September 28,
2008 |
September 30,
2007 |
|||||||||||||||
|
(53 weeks)
|
(52 weeks)
|
(52 weeks)
|
(52 weeks)
|
(52 weeks)
|
||||||||||||||||
|
Total assets
|
$ | 67,310 | $ | 65,777 | $ | 73,637 | $ | 79,420 | $ | 76,150 | ||||||||||
|
Long-term debt
|
10,773 | 13,198 | 21,891 | 33,479 | 41,383 | |||||||||||||||
|
Total liabilities
|
26,797 | 26,706 | 42,141 | 56,224 | 63,731 | |||||||||||||||
|
Retained earnings
|
28,796 | 27,355 | 19,780 | 11,479 | 1,157 | |||||||||||||||
|
Stockholders’ equity
|
40,513 | 39,071 | 31,497 | 23,195 | 12,419 | |||||||||||||||
No cash dividends on our common stock were declared during any of the periods presented above.
Item 7. Management’s Discussion and Analysis of Financial Condition and Results of Operations
The following discussion and analysis should be read in conjunction with our consolidated financial statements and notes to consolidated financial statements included elsewhere in this report. This report and our consolidated financial statements and notes to consolidated financial statements contain forward-looking statements, which generally include the plans and objectives of management for future operations, including plans and objectives relating to our future economic performance and our current beliefs regarding revenues we might generate and profits we might earn if we are successful in implementing our business and growth strategies. The forward-looking statements and associated risks may include, relate to or be qualified by other important factors, including, without limitation:
|
|
●
|
the impact of competitive products and pricing;
|
|
|
●
|
market conditions that may affect the costs and/or availability of raw materials, fuels, energy, logistics and labor as well as the market for our products, including our customers’ ability to pay and consumer demand;
|
|
|
●
|
changes in our business environment, including actions of competitors and changes in customer preferences, as well as disruptions to our customers’ businesses;
|
|
|
●
|
seasonality in the retail category;
|
|
●
|
loss of key customers due to competitive environment or production being self-manufactured by customers with such capabilities;
|
|
|
●
|
commodity prices and fulfillment by suppliers of existing raw material contracts;
|
|
|
●
|
natural disasters that can impact, among other things, costs of fuel and raw materials;
|
|
|
●
|
the occurrence of acts of terrorism or acts of war;
|
|
●
|
changes in governmental laws and regulations, including those concerning the food industry, healthcare and income taxes;
|
|
|
●
|
change in control due to takeover or other significant changes in ownership;
|
|
●
|
financial viability and resulting effect on revenues and collectability of accounts receivable of our customers during the on-going economic recovery and any future deep recessionary periods;
|
|
●
|
ability to obtain additional financing as and when needed, and rising costs of credit that may be associated with new borrowings;
|
|
●
|
continued unfavorable operating variances due to lower sales volume;
|
|
●
|
voluntary or government-mandated food recalls;
|
|
●
|
effects of legal proceedings or labor disputes in which we are or may become involved from time to time;
|
|
●
|
uncertainty of untested new initiatives, such as our collaboration with Bellisio Foods, Inc.; and
|
|
●
|
other factors discussed in this report.
|
We do not undertake to update, revise or correct any forward-looking statements, except as otherwise required by law.
Any of the factors described above or in the “Risk Factors” contained in Item 1A of this report could cause our financial results, including our net income or loss or growth in net income or loss to differ materially from prior results, which in turn could, among other things, cause the price of our common stock to fluctuate substantially.
Overview
We are a value-added manufacturer of high quality, prepared frozen food products for branded retail, private label, foodservice and airline customers. Our product line includes entrées, plated meals, bulk-packed meal components, pastas, soups, sauces, poultry, meat and fish specialties, and organic and vegetarian offerings. Our extensive research and development efforts, combined with our extensive catalogue of recipes and flexible manufacturing capabilities, provide customers with a one-stop solution for new product ideas, formulations and product manufacturing, as well as precise replication of existing recipes. Our capabilities allow customers to outsource product development, product manufacturing and packaging, thereby avoiding significant fixed-cost and variable investments in resources and equipment. Our customers include prominent nationally recognized names such as Panda Restaurant Group, Inc., Jenny Craig, Inc., Safeway Inc., Target Corporation, Pinnacle Foods Group LLC, and American Airlines, Inc. We also sell frozen foods under the Boston Market brand, under exclusive license with Boston Market Corporation.
Our goal is to continue as a leading developer and manufacturer of value-added food products and provider of custom prepared frozen foods. We intend to continue to execute our growth and operating strategies, including:
|
|
●
|
diversifying and expanding our customer base by focusing on sectors we believe have attractive growth characteristics, such as foodservice and retail;
|
|
|
●
|
investing in and operating efficient production facilities;
|
|
|
●
|
providing value-added ancillary support services to customers;
|
|
|
●
|
offering a broad range of products to customers in multiple channels of distribution; and
|
|
|
●
|
exploring strategic acquisitions and investments.
|
Despite reduced sales in virtually all of our sectors and a generally weak economy we remained profitable with net revenues of $169.2 million and net income of $1.4 million for fiscal year 2011. Sales during fiscal year 2011 reflected the impact of a continued weak economy, failing consumer confidence and reduced demand. Most of our customers have experienced decreased sales and in turn have reduced their orders as they manage lower inventory levels. We have also incurred costs related to the launch of 16 new products for the Boston Market line and 16 for Target Corporation (“Target”). Fiscal year 2011 revenue includes some early Target and Boston Market pipeline sales which began in July 2011. As part of these two major launches, during the second half of fiscal year 2011 we increased headcount by an average of 90 temporary production employees and incurred significant overtime expenses as we built an inventory pipeline for the two product lines.
Like most companies, we unfortunately expect to continue to face headwinds related to the economy, including higher fuel and commodity costs and sluggish consumer demand. In an effort to offset these ongoing challenges and to improve operating margins, we continue to aggressively seek new business opportunities and to closely monitor all categories of operating expenses. We believe one of our core strengths has been our ability to mitigate rising food costs through strategic forward buying. We expect that this strength will again play a positive role in our future operations. Additionally, as customer contracts come to renewal and as other opportunities develop, we intend to take advantage of improved product pricing.
Also, in an effort to expedite the recovery of retail sales to existing customers, we have been working with our major existing retail accounts to refresh product lines and to introduce additional lines of products. With these new products and lines for our existing customers, as well as anticipated increases from our recently added Boston Market and Target products, we are optimistic for future retail sales.
Fiscal year 2011 was a 53-week period while 2010 and 2009 were 52-week periods. For fiscal year 2011, net revenues of $169.2 million reflected a 13.0% decrease as compared to fiscal year 2010. During fiscal year 2011, decreased sales in virtually all categories contributed to the decline. We experienced a 7.3% decrease in net revenues for fiscal year 2010, to $194.5 million, compared to $209.9 million for fiscal year 2009. The decrease in net revenues during fiscal year 2010 was due to decreased sales in the retail and airline categories.
During the fourth quarter of fiscal year 2011, as previously reported, we entered into a Co-Manufacturing, Sales and Distribution Agreement (the “Agreement”) with Bellisio Foods, Inc. (“Bellisio”). The Agreement covers a collaborative arrangement between us and Bellisio regarding the co-manufacture, sale and distribution of Boston Market products. The Agreement provides that we and Bellisio will each manufacture approximately 50% of the total production volume of current and future Boston Market Products during the term of the Agreement. We began manufacturing Boston Market products in June, 2011 and Bellisio began its manufacturing of Boston Marketing products in August, 2011.
Gross profit was $13.0 million in fiscal year 2011, compared to $23.7 million in fiscal year 2010 and $25.6 million in fiscal year 2009. Gross profit as a percentage of net revenues, or gross margin, during fiscal years 2011, 2010 and 2009 were 7.7%, 12.2% and 12.2%, respectively. The gross margin decrease was driven largely by higher variable overhead costs as a percentage of net revenues, a less favorable sales mix and higher conversion costs, specifically higher unfavorable indirect labor variances as a result of smaller production runs that were required to manage lower customer order levels. In addition, freight and storage expenses increased $844,000 (primarily in the fourth quarter of fiscal year 2011) for fiscal year 2011compared to fiscal year 2010, due predominantly to increased shipments for Boston Market products and higher fuel surcharges. Gross profit also decreased due to $217,000 in slotting fees and our share of other start-up costs ($129,000) related to Boston Market products. We also had start-up costs of $179,000 related to the test run and initial launch of the Boston Market brand. In addition, experienced less favorable commodity prices compared to the same period last year due to increases in the cost of certain commodities. Although we see indications of inflation on commodities for the rest of calendar year 2011 and the beginning of 2012, we plan to mitigate increases with forward buying and pricing opportunities where appropriate. The decrease in gross profit in fiscal year 2010 compared to 2009 was due to lower net revenues and increased investment spending to achieve certification under the global Food Safety Management System standard FSSC 22000.
Towards the end of the third quarter of fiscal year 2010, Safeway Inc. changed its in-store sales and marketing model thereby eliminating its previous brokerage arrangement. As a result, we are no longer paying brokerage to an independent third party but now pay Safeway Inc., which is recorded as a reduction to net revenues rather than as a selling, general and administrative (“SG&A”) expense and thus adversely affects gross margin. The additional amount recorded as a reduction to net revenues rather than as SG&A, for fiscal year 2011, was $580,000.
Operating income as a percentage of net revenues for fiscal year 2011 was 1.5% compared to 7.1% in fiscal year 2010 and 7.4% in fiscal year 2009, due primarily to decreased gross profit and increased selling, general and administrative (“SG&A”) expenses. SG&A expenses as a percentage of net revenues increased to 6.1% in fiscal year 2011, compared to 5.0% in fiscal year 2010 and 4.8% in fiscal year 2009. SG&A expenses increased $622,000 in fiscal year 2011 due to one-time start-up fees of $175,000, one-time start-up marketing expenses, including package design, website development and retail store material design and production of $134,000 stemming from the launch of the Boston Market product line and $813,000 in marketing, brokerage, and royalty related expenses for the Boston Market brand (incurred primarily in the fourth quarter of fiscal year 2011). There were also increases in personnel related expenses ($207,000), data processing expense ($108,000) and travel expense ($87,000). There was also an increase in amortization expense as we took a $412,000 impairment charge due to the write-off of the Better Living Brands tm Alliance (“Alliance”) license fee intangible asset. These increases were offset by a reduction in brokerage expense to Safeway Inc. of $580,000 as it changed its in-store sales marketing model thereby eliminating its previous brokerage arrangement. As a result, we are no longer paying brokerage to an independent third party but now pay Safeway Inc. directly, which is recorded as a reduction to net revenues rather than SG&A. In addition we reduced our legal expense by $687,000 due to the conclusion of various legal proceedings. Net income decreased as a percentage of net revenues to 0.9% in fiscal year 2011 versus 3.9% in fiscal year 2010 and 4.0% in fiscal year 2009.
As described under “Liquidity and Capital Resources” below, during fiscal year 2010 we refinanced our then existing debt with Guggenheim Corporate Funding, LLC (“GCF”) by entering into a new credit facility with Bank of America, N.A.. The Bank of America facility is a $30 million three-year senior secured credit facility that is secured by a first priority lien on substantially all of our assets. In September 2010 we made an initial loan drawdown of $13.2 million under the Bank of America facility, the proceeds of which were used to pay-off our debt to GCF. In fiscal year 2011, we paid off a net amount of $2.4 million ($5.5 million in voluntary payments offset by $3.1 million in new borrowings) on our Bank of America facility, leaving us with a balance of $10.8 million.
Results of Operations
The tables presented below, which compare our results of operations from one period to another, present the results for each period, the change in those results from one period to another in both dollars and percentage change, and the results for each period as a percentage of net revenues. The columns present the following:
|
|
·
|
First four data columns in each table show the absolute results for each period presented and results for each period as a percentage of net revenues.
|
|
|
·
|
Last two columns entitled “Dollar Variance” and “% Variance” show the change in results, both in dollars and percentages for the fiscal years presented. These two columns show favorable changes as positives and unfavorable changes as negatives. For example, when our net revenues increase from one period to the next, that change is shown as a positive number in both columns. Conversely, when expenses increase from one period to the next, that change is shown as a negative in both columns.
|
Fiscal Year Ended October 2, 2011 Compared to Fiscal Year Ended September 26, 2010
|
|
Fiscal Year Ended
|
Change 2011 vs 2010
|
||||||||||||||||||||||
|
|
October 2, 2011
|
September 26, 2010
|
Dollar
Variance
|
% Variance
|
||||||||||||||||||||
|
|
Dollars
|
% of Net
Revenues |
Dollars
|
% of Net
Revenues |
Favorable
(Unfavorable) |
Favorable
(Unfavorable) |
||||||||||||||||||
|
(Dollars in thousands)
|
|
|
|
|
|
|
||||||||||||||||||
|
|
|
|
|
|
|
|||||||||||||||||||
|
Net revenues
|
$ | 169,218 | 100.0 | % | $ | 194,482 | 100.0 | % | $ | (25,264 | ) | (13.0 | )% | |||||||||||
|
Cost of sales
|
156,265 | 92.4 | 170,826 | 87.8 | 14,561 | 8.5 | ||||||||||||||||||
|
Gross profit
|
12,954 | 7.7 | 23,656 | 12.2 | (10,702 | ) | (45.2 | ) | ||||||||||||||||
|
Selling, general and administrative expenses
|
10,353 | 6.1 | 9,731 | 5.0 | (622 | ) | (6.4 | ) | ||||||||||||||||
|
Operating income
|
2,601 | 1.5 | 13,925 | 7.1 | (11,324 | ) | (81.3 | ) | ||||||||||||||||
|
Interest and other (income) expense, net
|
335 | 0.2 | 1,668 | 0.9 | 1,333 | 79.9 | ||||||||||||||||||
|
Income before income taxes
|
2,267 | 1.3 | 12,257 | 6.3 | (9,990 | ) | (81.5 | ) | ||||||||||||||||
|
Income tax provision
|
825 | 0.5 | 4,682 | 2.4 | 3,857 | 82.4 | ||||||||||||||||||
|
Net income
|
$ | 1,442 | 0.9 | % | $ | 7,575 | 3.9 | % | $ | (6,133 | ) | (81.0 | )% | |||||||||||
Net Revenues. Net revenues for fiscal year 2011 decreased $25.3 million (13.0%) to $169.2 million from $194.5 million for fiscal year 2010, due to lower sales volume, a less favorable sales mix resulting from a lower percentage of retail and foodservice sales, decreases in retail and food service net revenues, partially offset by a small increase in airline net revenues.
Retail net revenues decreased $15.1 million (11.8%) to $112.9 million for fiscal year 2011 from $128.0 million for fiscal year 2010. The decrease in retail net revenues was largely due to the previously disclosed reduced volume from H. J. Heinz Company, which resulted in a $9.5 million decline in sales for fiscal year 2011 as compared to fiscal year 2010. The remaining decrease in retail net revenues is attributable to a $7.7 million decline in sales to Safeway Inc. and a $5.6 million decline to Jenny Craig, Inc. These declines were partially offset by net revenues related to the sale of Boston Market products (sold to various third party customers) totaling $7.7 million and $3.3 million in sales to Target Corporation. A majority of the Boston Market net revenues were for pipeline sales as we were required to produce 100% of the Boston Market products until Bellisio started its production in mid-August. As of October 2, 2011, our cases accounted for approximatly 84% of the total Boston Market products sold. Going forward, our Boston Market products should account for approximately 50% of the total Boston Market products sold, in accordance with the Agreement noted in Exhibit 10.22 of this report. For fiscal year 2011, the retail category as a percentage of net revenues increased to 66.7% from 65.8% for fiscal year 2010 due to Boston Market product sales.
Foodservice net revenues decreased $10.3 million (17.6%) to $48.2 million for fiscal year 2011 from $58.5 million for fiscal year 2010 due primarily to a $9.8 million reduction in sales to Panda Restaurant Group Inc. For fiscal year 2011, the foodservice category as a percentage of net revenues decreased to 28.5% from 30.1% for fiscal year 2010. Notwithstanding the decline, we continue to increase our sales efforts in this category and believe that foodservice represents a significant opportunity for us in 2012 and beyond.
Airline net revenues increased $139,000 (1.7%) to $8.1 million for fiscal year 2011 from $8.0 million for fiscal year 2010 due to increased sales to an existing customer stemming from new products we have developed for them. However, due to continuing airline industry initiatives to cut cost, airline net revenues are not likely to increase again and may decrease in future periods. For fiscal year 2011, the airline category as a percentage of net revenues increased to 4.8% from 4.1% for fiscal year 2010.
Subsequent to October 2, 2011 American Airlines, Inc., a major airline customer, filed for Chapter 11 bankruptcy protection. However, American Airlines, Inc., has assured its suppliers that it will use its large cash surplus to conduct business as usual. As of the date of this filing, all receivables outstanding from American Airlines, Inc. (through its distributors), as of October 2, 2011 have been collected. All receivables outstanding for sales subsequent to October 2, 2011 are current and considered fully collectible.
Gross Profit. Gross profit for fiscal year 2011 decreased $10.7 million (45.2%) to $13.0 million from $23.7 million for fiscal year 2010. The decrease in gross profit dollars was due to lower sales volume as well as a less favorable sales mix resulting from lower retail sales. Gross margin decreased to 7.7% for fiscal years 2011 from 12.2% for fiscal year 2010 due to higher variable overhead costs as a percentage of net revenues, a less favorable sales mix and higher conversion costs, specifically higher unfavorable indirect labor variances and higher variable overhead cost as a result of smaller production runs that were required to manage lower customer order levels. In addition, freight and storage expenses increased $844,000 (primarily all in the fourth quarter of fiscal year 2011) for fiscal year 2011compared to fiscal year 2010, due predominantly to increased shipments for Boston Market products and higher fuel surcharges. We anticipate continued increased freight and storage expenses as sales volumes for Boston Market continue to grow and if fuel prices increase. Gross profit also decreased due to $217,000 in slotting fees and our share of other start-up costs ($129,000) at the Bellisio factory related to Boston Market products. We also had start-up costs of $179,000 related to the test run and initial launch of the Boston Market brand.
We also experienced less favorable commodity prices compared to fiscal year 2010 due to increases in the cost of certain commodities such as beef, dairy and soybean oil. Although we see indications of inflation on commodities for the rest of calendar year 2011 and the beginning of 2012, we plan to mitigate increases with forward buying and pricing opportunities where appropriate.
Towards the end of the third quarter of fiscal year 2010, Safeway Inc. changed its in-store sales and marketing model thereby eliminating its previous brokerage arrangement. As a result, we are no longer paying brokerage to an independent third party but now pay Safeway Inc., which is recorded as a reduction to net revenues rather than as a selling, general and administrative (“SG&A”) expense and thus adversely affects gross margin. The additional amount recorded as a reduction to net revenues rather than as SG&A, for fiscal year 2011, was $580,000.
Selling, General and Administrative Expenses. SG&A expenses increased $622,000 (6.4%) to $10.4 million for fiscal year 2011 from $9.7 million for fiscal year 2010. SG&A expenses as a percentage of net revenues increased to 6.1% for fiscal year 2011 from 5.0% for fiscal year 2010. The increase in SG&A expenses was due to $801,000 in recurring marketing, brokerage, and royalty related expenses for the Boston Market brand (incurred primarily in the fourth quarter of fiscal year 2011). There were also increases in personnel related expenses ($207,000), data processing expenses ($108,000) for compliance with XBRL mandates and travel expense ($87,000). These increases were offset by a reduction in brokerage expense to Safeway Inc. of $580,000 as it changed its in-store sales marketing model thereby eliminating its previous brokerage arrangement. As a result, we are no longer paying brokerage to an independent third party but now pay Safeway Inc. directly, which is recorded as a reduction to net revenues rather than SG&A. In addition, we reduced our legal expense by $687,000 due to the conclusion of various legal proceedings.
In addition, during fiscal year 2011, we made one-time payments for pre-launch sales activities, including $100,000 for start-up management fees and $75,000 for start-up brokerage fees to Bellisio and also had one-time start-up marketing expenses, including package design, website development and retail store material design and production of $134,000 stemming from the launch of the Boston Market product line. There was also an increase in amortization expense as we took a $412,000 impairment charge due to the write-off of the Better Living Brands tm Alliance (“Alliance”) license fee intangible asset. During the fourth quarter of fiscal year 2011, the Alliance lost distribution and recorded no sales through the date of this report. Therefore, as of October 2, 2011, the Company determined that the license agreement with the Alliance had been fully impaired and recorded an impairment charge of $412,000, bringing the asset value to zero. During the first eleven months of fiscal year 2011 and prior fiscal years under the licensing agreement, sales and future discounted cash flows to the Alliance did not signify any impairment indications. Although there might be future revenue associated with the license agreement through the end of the original term, the Company determined that any future discounted cash flows would not substantiate a carrying value for the asset.
Excluding the one-time items, we expect SG&A expense to increase as we continue to contest remaining claims and grievances as described in Part I, Item 3 of this report and as we incur additional selling expenses, specifically royalty expenses, as volume increases for Boston Market products.
Operating Income. Operating income decreased $11.3 million (81.3%) to $2.6 million for fiscal year 2011 from $13.9 million for fiscal year 2010. The decrease in operating income was the result of the decrease in gross profit as noted above.
Interest and Other (Income) Expense, net. Interest expense decreased $1.3 million (79.9%) to $335,000 for fiscal year 2011 from $1.7 million for fiscal year 2010 due to lower debt balances and lower variable interest rates as well as a decrease in debt extinguishment expense of $301,000 stemming from the refinancing of the GCF credit facility we did not incur any comparable expense in fiscal year 2011.
Income Tax Provision. Income tax expense was $825,000 for fiscal year 2011 compared to $4.7 million for fiscal year 2010. The difference was a result of income before taxes decreasing $10.0 million from $12.3 million for fiscal year 2010 to $2.3 million during fiscal year 2011. The effective tax rates were 36.4% and 38.2% for fiscal years 2011 and 2010, respectively.
Net Income. Net income for fiscal year 2011 was $1.4 million, or $0.09 per basic and diluted shares, compared to net income of $7.6 million, or $0.48 per basic and $0.47 per diluted share for fiscal year 2010.
We currently expect to continue profitable operations primarily through (a) growing revenues from profitable product lines, increasing our customer base and replacing lower margin accounts; (b) improving gross margins by increasing prices to customers where appropriate, streamlining additional costs and continuing to leverage our manufacturing and storage facilities to improve manufacturing efficiency; and (c) reducing future interest costs on outstanding debt through pre-payments on our debt. However, no assurance can be given that we will be successful in any of these initiatives. However, as discussed in “Risk Factors” contained in Item 1A of this report, we may be unable to improve our operating results, and could perhaps even operate at a loss, if we suffer a decline in our manufacturing efficiency, the loss of major customers, continued cost-cutting measures in the airline industry, adverse changes in our operating costs or raw materials costs or other adverse changes to our business.
Fiscal Year Ended September 26, 2010 Compared to Fiscal Year Ended September 27, 2009
|
|
Fiscal Year Ended
|
Change 2010 vs 2009
|
||||||||||||||||||||||
|
|
September 26,2010
|
September 27,2009
|
Dollar
Variance
|
% Variance
|
||||||||||||||||||||
|
|
Dollars
|
% of Net
Revenues |
Dollars
|
% of Net
Revenues |
Favorable
(Unfavorable) |
Favorable
(Unfavorable) |
||||||||||||||||||
|
(Dollars in thousands)
|
|
|
|
|
|
|
||||||||||||||||||
|
|
|
|
|
|
|
|||||||||||||||||||
|
Net revenues
|
$ | 194,482 | 100.0 | % | $ | 209,877 | 100.0 | % | $ | (15,395 | ) | (7.3 | )% | |||||||||||
|
Cost of sales
|
170,826 | 87.8 | 184,326 | 87.8 | 13,500 | 7.3 | ||||||||||||||||||
|
Gross profit
|
23,656 | 12.2 | 25,551 | 12.2 | (1,895 | ) | (7.4 | ) | ||||||||||||||||
|
Selling, general and administrative expenses
|
9,731 | 5.0 | 9,972 | 4.8 | 241 | 2.4 | ||||||||||||||||||
|
Operating income
|
13,925 | 7.1 | 15,579 | 7.4 | (1,654 | ) | (10.6 | ) | ||||||||||||||||
|
Interest and other (income) expense, net
|
1,668 | 0.9 | 2,279 | 1.1 | 611 | 26.8 | ||||||||||||||||||
|
Income before income taxes
|
12,257 | 6.3 | 13,300 | 6.3 | (1,043 | ) | (7.8 | ) | ||||||||||||||||
|
|
||||||||||||||||||||||||
|
Income tax provision
|
4,682 | 2.4 | 4,999 | 2.4 | 317 | 6.3 | ||||||||||||||||||
|
|
||||||||||||||||||||||||
|
Net income
|
$ | 7,575 | 3.9 | % | $ | 8,301 | 4.0 | % | $ | (726 | ) | (8.7 | )% | |||||||||||
Net Revenues. Net revenues for fiscal year 2010 decreased $15.4 million (7.3%) (5.5% was attributable to a volume/mix decrease and 1.8% was attributable to a pricing decrease) to $194.5 million from $209.9 million for fiscal year 2009, due to decreases in airline and retail net revenues offset partially by higher foodservice revenue as discussed below.
Retail net revenues decreased $18.4 million (12.6%) to $128.0 million for fiscal year 2010 from $146.4 million for fiscal year 2009. The decrease in retail net revenues was largely due to the previously disclosed reduced volume from H. J. Heinz Company, which resulted in a $14.3 million decline in sales for fiscal year 2010 as compared to fiscal year 2009. Fiscal year 2010 includes $10.1 million in net revenues from sales to Heinz as Heinz was delayed in transitioning to its own plants. The remaining decrease in retail net revenues is attributable to a $4.5 million decline in three other customers from the retail category due to the lagging economic recovery and their inventory management plans. For fiscal year 2010, the retail category as a percentage of net revenues decreased to 65.8% from 69.7% for fiscal year 2009.
Foodservice net revenues increased $6.2 million (11.9%) to $58.5 million for fiscal year 2010 from $52.3 million for fiscal year 2009 due to the introduction of new products and increased volume from an existing customer offset by the conclusion of an existing customer’s promotional item ($2.4 million). For fiscal year 2010, the foodservice category as a percentage of net revenues increased to 30.1% from 24.9% for fiscal year 2009.
Airline net revenues decreased $3.1 million (27.9%) to $8.0 million for fiscal year 2010 from $11.1 million for fiscal year 2009. For fiscal year 2010, the airline category as a percentage of net revenues decreased to 4.1% from 5.3% for fiscal year 2009.
Gross Profit. Gross profit for fiscal year 2010 decreased $1.9 million (7.4%) to $23.7 million from $25.6 million for fiscal year 2009. Gross margin remained unchanged at 12.2% for fiscal years 2010 and 2009 due to increased efficiencies and yields and favorable commodity prices offset by increased investment spending in our plants to achieve certification under the new global Food Safety Management Systems standard FSSC 22000 and brokerage paid to Safeway Inc. of $262,000 as a reduction to net revenues. During the latter part of the third quarter of fiscal year 2010, Safeway Inc. ended its brokerage agreement and took the function in-house, so the brokerage we paid to Safeway Inc. was recorded as a reduction of revenue.
Selling, General and Administrative Expenses. SG&A expenses decreased $241,000 (2.4%) to $9.7 million for fiscal year 2010 from $10.0 million for fiscal year 2009. SG&A expenses as a percentage of net revenues increased slightly to 5.0% for fiscal year 2010 from 4.8% for fiscal year 2009 due to the year-over-year decrease in net revenues. The decrease in SG&A expenses resulted from a decrease in brokerage fees ($315,000) stemming primarily from the change in recording of brokerage expense for Safeway Inc. as described above and a decrease in personnel related expenses ($146,000). These reductions were partially offset by an increase in professional service fees ($178,000) relating primarily to previously disclosed legal matters.
Operating Income. Operating income decreased $1.7 million (10.9%) to $13.9 million for fiscal year 2010 from $15.6 million for fiscal year 2009. The decrease in operating income was the result of the decrease in gross profit as noted above.
Interest and Other (Income) Expense, net. Interest expense decreased $611,000 (26.6%) to $1.7 million for fiscal year 2010 from $2.3 million for fiscal year 2009 due to lower debt balances and lower variable interest rates offset by an increase of $301,000 in debt extinguishment expenses stemming from the refinancing of the GCF credit facility.
Income Tax Provision. Income tax expense was $4.7 million for fiscal year 2010 compared to $5.0 million for fiscal year 2009. The difference was a result of income before taxes decreasing $1.0 million from $13.3 million for fiscal year 2009 to $12.3 million during fiscal year 2010. The effective tax rates were 38.2% and 37.6% for fiscal years 2010 and 2009, respectively.
Net Income. Net income for fiscal year 2010 was $7.6 million, or $0.48 per basic share and $0.47 per diluted share, compared to net income of $8.3 million, or $0.52 per basic and diluted share for fiscal year 2009.
Liquidity and Capital Resources
For fiscal years ended 2011 and 2010, our operating activities provided cash of $3.2 million and $16.9 million, respectively. Cash generated from operations before working capital changes for fiscal year 2011 was $5.4 million. Cash used by changes in working capital was $2.2 million for fiscal year 2011 and resulted from increases in inventory of $5.1 million due to a build up of inventory for Boston Market and $403,000 increase in prepaid expenses and other assets. This was partially offset by an increase in accounts payable and accrued liabilities of $2.4 million and $572,000, respectively and a decrease in accounts receivable of $378,000. At October 2, 2011, we had working capital of $25.9 million compared to working capital of $24.4 million at September 26, 2010.
During fiscal year 2011, our investing activities, consisting primarily of capital expenditures of $1.3 million, resulted in a net use of cash of approximately $1.3 million, compared to a net use of cash of approximately $1.8 million during fiscal year 2010. The property and equipment additions were made to accommodate additional business opportunities, meet anticipated growth and improve operating efficiency. We anticipate that cash generated from operating activities and borrowing availability under our existing credit facility will fund revenue growth and working capital needs in the near term.
During fiscal year 2011, our financing activities used cash of $2.4 million, compared to cash used by financing activities of $14.6 million during fiscal year 2010. Our net use of cash in fiscal year 2011 consisted primarily of $5.5 million of principal payments that reduced our outstanding debt offset by $3.1 million in new borrowings under our credit facility during the second half of fiscal year 2011, predominantly to fund working capital requirements for Boston Market products.
We executed a senior secured credit agreement with Bank of America on September 24, 2010. The facility is structured as a $30 million three-year senior secured revolving credit facility, secured by a first priority lien on substantially all of our assets. We made an initial loan drawdown of $13.2 million, which was used to pay off our prior credit facility with GCF. Under the Bank of America facility we have the ability to increase the aggregate amount of the financing by $20 million under certain conditions.
The Bank of America facility bears annual interest at the British Bankers Association LIBOR Rate, or LIBOR, plus an applicable margin (listed below). The Margin was initially 1.75% and beginning no later than December 25, 2010, and adjusted quarterly thereafter, shall be calculated as follows:
|
Ratio of aggregate outstanding funded
commitments under the facility (including letter
of credit obligations) to EBITDA for the
preceding four quarters
|
|
Applicable Margin
|
|
Greater than or equal to 1.50:1
|
|
2.00%
|
|
|
|
|
|
Greater than or equal to 0.50:1
but less than 1.50:1 |
|
1.75%
|
|
|
|
|
|
Less than 0.50:1
|
|
1.50%
|
At October 2, 2011, there was $10.8 million outstanding under the Bank of America facility with an applicable interest rate of 1.9%. In addition, we paid an unused fee equal to 0.25% per annum. For fiscal year 2011, we incurred $225,000 in interest expense, excluding amortization of deferred financing costs. During fiscal year 2011, we reduced the outstanding balance of the facility by $2.4 million ($5.5 million in voluntary payments offset by $3.1 million in new borrowing). As of October 2, 2011, we had $19.2 million available to borrow under the new credit facility.
The Bank of America facility contains covenants whereby, among other things, we are required to maintain compliance with agreed levels of fixed charge coverage and total leverage. The facility also contains customary restrictions on incurring indebtedness and liens, making investments and paying dividends.
We previously executed a senior secured credit agreement with Guggenheim Corporate Funding, LLC (“GCF”) on April 17, 2006. Under the credit agreement, GCF acted as collateral agent, administrative agent, arranger and syndication agent in connection with loans made by various lenders, including affiliates of GCF. The facility was originally structured as a $7.5 million non-amortizing revolving loan, a $25.0 million amortizing Tranche A Term Loan and a $15.0 million non-amortizing Tranche B Term Loan. On March 9, 2007, we executed a second amendment to the senior secured credit agreement allowing for $7.0 million of additional capital expenditures to facilitate new business by increasing plant capacity and improving line efficiency, to be funded by increases of $3.5 million in each of the Tranche A and Tranche B Term Loans. As of September 27, 2009, the facility was structured as a $7.5 million non-amortizing revolving loan, a $26.5 million amortizing Tranche A Term Loan and a $15.7 million non-amortizing Tranche B Term Loan. At September 27, 2009, interest rates on the Tranche A Term Loans and Tranche B Term Loans were 3.5% and 6.0%, respectively. The GCF facility was paid off on September 24, 2010 with the initial proceeds from the Bank of America facility. For fiscal year 2010, we incurred $959,000 in interest expense, excluding amortization of deferred financing cost.
We believe that funds available to us from operations and existing capital resources will be adequate for our capital requirements for at least the next twelve months.
Contractual Obligations and Other Commitments
We are obligated to make future payments under various contracts such as debt agreements, lease obligations and other purchase obligations.
Following is a summary of our contractual obligations at October 2, 2011:
|
Payments Due By Period
|
||||||||||||||||||||
|
CONTRACTUAL
OBLIGATIONS
|
Total
|
Remainder
of Fiscal
Year 2011
|
2-3 Years
|
4-5 Years
|
More than 5
Years
|
|||||||||||||||
|
|
|
|
|
|
||||||||||||||||
|
Debt maturities
|
$ | 10,772,647 | $ | - | $ | 10,772,647 | $ | - | $ | - | ||||||||||
|
Interest Expense(1)
|
565,034 | 281,837 | 283,197 | - | - | |||||||||||||||
|
Operating lease obligations(2)
|
8,834,256 | 2,590,297 | 3,957,158 | 2,286,801 | - | |||||||||||||||
|
Other Contractual obligations
|
128,464 | 128,464 | - | - | - | |||||||||||||||
|
Open purchase orders
|
21,063,232 | 20,655,232 | 408,000 | - | - | |||||||||||||||
|
Total contractual obligations
|
$ | 41,363,633 | $ | 23,655,830 | $ | 15,421,002 | $ | 2,286,801 | $ | - | ||||||||||
|
(1)
|
Assumes only mandatory principal pay-down and the use of LIBOR as of October 2, 2011 on the Bank of America debt.
|
|
(2)
|
Includes real estate leases.
|
The above table outlines our obligations as of October 2, 2011 and does not reflect the changes in our obligations that occurred after that date. There have been no other material changes to our obligations as of December 14, 2011.
Recent Accounting Pronouncements
In September 2011, the Financial Accounting Standard Board (“FASB”) issued an update to its authoritative guidance regarding the methods used to test goodwill for impairment. The amendment allows the option to first assess qualitative factors to determine whether it is necessary to perform the two-step quantitative goodwill impairment test currently required. Under that option, an entity would no longer be required to calculate the fair value of a reporting unit unless the entity determines, based on that qualitative assessment, that it is more likely than not that its fair value is less than its carrying amount. If an entity concludes otherwise, then it must perform the two-step impairment test currently required. We will adopt this guidance commencing in fiscal year 2013, effective October 1, 2012, and apply it prospectively.
In June 2011, the FASB issued authoritative guidance that revised its requirements related to the presentation of comprehensive income. This guidance eliminates the option to present components of other comprehensive (“OCI”) as part of the consolidated statement of equity. It requires presentation of comprehensive income, the components of net income, and the components of other comprehensive income either in a single continuous statement of comprehensive income or in two separate but consecutive statements. We will adopt this guidance commencing in fiscal year 2013, effective October 1, 2012, and apply it retrospectively.
In May 2011, the FASB issued an update to its authoritative guidance regarding fair value measurements to clarify disclosure requirements and improve comparability. Additional disclosure requirements include: (a) for level 3 fair value measurements, quantitative information about significant unobservable inputs used, qualitative information about the sensitivity of the measurements to change in the unobservable inputs disclosed including the interrelationship between inputs, and a description of the Company’s valuation processes; (b) all, not just significant, transfers between level 1 and 2 of the fair value hierarchy; (c) the reason why, if applicable, the current use of a nonfinancial asset measured at fair value differs from its highest and best use; (d) the categorization in the fair value hierarchy for financial instruments not measured at fair value but for which disclosure of fair value is required. The Company will adopt this guidance commencing in the second quarter of fiscal 2012, effective January 2, 2012, and apply it retrospectively.
Critical Accounting Policies
Management’s discussion and analysis of our financial condition and results of operations is based upon our financial statements, which have been prepared in accordance with accounting principles generally accepted in the United States. The preparation of these financial statements requires management to make estimates and assumptions that affect the amounts reported in the financial statements and accompanying notes. Actual results could differ from those estimates. See Note 2 to the financial statements contained elsewhere in this report for a summary of our significant accounting policies. Management believes the following critical accounting policies are related to our more significant estimates and assumptions used in the preparation of our financial statements.
Concentrations of Credit Risk. Our financial instruments that are exposed to concentrations of credit risk consist primarily of trade receivables. We perform on-going credit evaluations of each customer’s financial condition and generally require no collateral from our customers. A bankruptcy or other significant financial deterioration of any customer could impact its future ability to satisfy its receivables with us. Our allowance for doubtful accounts is calculated based primarily upon historical bad debt experience and current market conditions. Bad debt expense and accounts receivable write-offs, net of recoveries, historically have been relatively small, as we generally transact the substantial portion of our business with large, established food or service related businesses. For fiscal years 2011, 2010 and 2009, our write-offs, net of recoveries, to the allowance for doubtful accounts were approximately $1,000, $23,000 and $2,000, respectively.
A significant portion of our total net revenues and receivables during the last two fiscal years were derived from three and four customers, respectively, as described below:
|
Net Revenues
|
||||||||
|
|
||||||||
|
Customer
|
October 2,
2011 |
September 26,
2010 |
||||||
|
Jenny Craig, Inc.
|
29 | % | 28 | % | ||||
|
Panda Restaurant Group, Inc.
|
26 | % | 27 | % | ||||
|
Safeway Inc.
|
16 | % | 18 | % | ||||
|
Receivables
|
||||||||
|
|
||||||||
|
Customer
|
October 2,
2011 |
September 26,
2010 |
||||||
|
Panda Restaurant Group, Inc. (through its distributors)
|
28 | % | 29 | % | ||||
|
Jenny Craig, Inc.
|
22 | % | 24 | % | ||||
|
Safeway Inc.
|
17 | % | 17 | % | ||||
|
Bellisio Foods, Inc. (for various third party customers)
|
17 | % | 0 | % | ||||
Inventories. Inventories, which include material, labor and manufacturing overhead, are stated at the lower of cost, which approximates the first-in, first-out (“FIFO”) method, or market. We use a standard costing system to estimate our FIFO cost of inventory at the end of each reporting period. Historically, standard costs have been materially consistent with actual costs. We periodically review our inventory for excess items, and write it down based upon the age of specific items in inventory and the expected recovery from the disposition of the items.
We write-down our inventory for the estimated aged surplus, spoiled or damaged products and discontinued items and components. We determine the amount of the write-down by analyzing inventory composition, expected usage, historical and projected sales information and other factors. Changes in sales volume due to unexpected economic or competitive conditions are among the factors that could result in material increases in the write-down of our inventory.
Property and Equipment. The cost of property and equipment is depreciated over the estimated useful lives of the related assets, which range from three to ten years. Leasehold improvements to our Plant No. 1 in Vernon, California are amortized over the lesser of the initial lease term plus one lease extension period, initially totaling 15 years, or the estimated useful lives of the assets. Other leasehold improvements are amortized over the lesser of the term of the related lease or the estimated useful lives of the assets. Depreciation is generally computed using the straight-line method.
We assess property and equipment for impairment whenever events or changes in circumstances indicate that an asset’s carrying amount may not be recoverable.
Expenditures for maintenance and repairs are charged to expense as incurred. The cost of materials purchased and labor expended in betterments and major renewals are capitalized. Costs and related accumulated depreciation of properties sold or otherwise retired are eliminated from the accounts, and gains or losses on disposals are included in operating income.
Goodwill. We evaluate goodwill at least annually for impairment. We have one reporting unit and estimate fair value based on a variety of market factors, including discounted cash flow analysis, market capitalization, and other market-based data. At October 2, 2011, we had goodwill of $12.2 million. A deterioration of our operating results and the related cash flow effect could decrease the estimated fair value of our business and, thus, cause our goodwill to become impaired and cause us to record a charge against operations in an amount representing the impairment.
Income Taxes. We evaluate the need for a valuation allowance on our deferred tax assets based on whether we believe that it is more likely than not that all deferred tax assets will be realized. We consider future taxable income and on-going prudent and feasible tax planning strategies in assessing the need for valuation allowances. In the event we were to determine that we would not be able to realize all or part of our deferred tax assets, we would record an adjustment to the deferred tax asset and a charge to income at that time.
We adopted the provisions of FASB guidance on accounting for uncertainty of income taxes on October 1, 2007. The guidance clarifies the accounting for uncertainty in income taxes recognized in an enterprise's financial statements in accordance with the standard on accounting for income taxes. This guidance prescribes a recognition threshold and measurement attribute for the financial statement recognition and measurement of a tax position taken or expected to be taken in a tax return. It also provides guidance on derecognition of tax benefits, classification on the balance sheet, interest and penalties, accounting in interim periods, disclosure and transition. As a result of the implementation of the guidance, we recorded no increase in the liability for unrecognized tax benefits, and the balance of unrecognized tax benefits was zero at October 2, 2011.
We have also adopted the accounting policy that interest and penalties recognized are classified as part of income taxes. No interest and penalties were recognized in the statement of income for fiscal year 2011.
ITEM 7A. Quantitative and Qualitative Disclosures About Market Risk
Interest Rate Risk – Obligations. We are subject to interest rate risk on variable interest rate obligations. A hypothetical 10% increase in average market interest rates would increase by approximately $21,000 the annual interest expense on our debt outstanding as of October 2, 2011.
ITEM 8. Financial Statements and Supplementary Data
See the index to financial statements included in Part IV, Item 15. The supplementary financial information required by Item 302 of Regulation S-K is contained in Note 12 of the notes to financial statements included in this report.
ITEM 9. Changes in and Disagreements With Accountants on Accounting and Financial Disclosure
None.
ITEM 9A. Controls and Procedures
Evaluation of Disclosure Controls and Procedures
Our Chief Executive Officer and Chief Financial Officer (our principal executive officer and principal financial officer, respectively) have concluded, based on their evaluation as of October 2, 2011, that the design and operation of our “disclosure controls and procedures” (as defined in Rules 13a-15(e) and 15d-15(e) under the Exchange Act) are effective at a reasonable assurance level to ensure that information required to be disclosed by us in the reports filed or submitted by us under the Exchange Act is recorded, processed, summarized and reported, within the time periods specified in the Commission’s rules and forms, including to ensure that information required to be disclosed by us in the reports we file or submit under the Exchange Act is accumulated and communicated to our management, including our Chief Executive Officer and Chief Financial Officer, as appropriate to allow timely decisions regarding required disclosure.
Management’s Report on Internal Control Over Financial Reporting
Management is responsible for establishing and maintaining adequate “internal control over financial reporting” as defined in Rules 13a-15(f) and 15d-15(f) under the Exchange Act. Internal control over financial reporting refers to the process designed by, or under the supervision of, our Chief Executive Officer and Chief Financial Officer, and effected by our Board of Directors, management and other personnel, to provide reasonable assurance regarding the reliability of financial reporting and the preparation of financial statements for external purposes in accordance with generally accepted accounting principles, and includes those policies and procedures that:
(i) pertain to the maintenance of records that, in reasonable detail, accurately and fairly reflect the transactions and dispositions of our assets;
(ii) provide reasonable assurance that transactions are recorded as necessary to permit preparation of financial statements in accordance with generally accepted accounting principles, and that receipts and expenditures are being made only in accordance with authorizations of our management and directors; and
(iii) provide reasonable assurance regarding prevention or timely detection of unauthorized acquisition, use or disposition of our assets that could have a material effect on our financial statements.
Because of its inherent limitations, internal control over financial reporting may not prevent or detect misstatements. Also, projections of any evaluation of effectiveness to future periods are subject to the risk that controls may become inadequate because of changes in conditions, or that the degree of compliance with the policies or procedures may deteriorate.
Management has used the framework set forth in the report entitled “Internal Control—Integrated Framework” published by the Committee of Sponsoring Organizations of the Treadway Commission to evaluate the effectiveness of our internal control over financial reporting. Management has concluded that our internal control over financial reporting was effective at a reasonable assurance level as of the end of the most recent fiscal year.
This report does not include an attestation report of our independent registered public accounting firm regarding internal control over financial reporting. Management’s report was not subject to attestation by our independent registered public accounting firm pursuant to rules of the Commission that permit us to provide only management’s report in this report.
Inherent Limitations on the Effectiveness of Controls
Management does not expect that our disclosure controls and procedures or our internal control over financial reporting will prevent or detect all errors and all fraud. A control system, no matter how well conceived and operated, can provide only reasonable, not absolute, assurance that the objectives of the control systems are met. Further, the design of a control system must reflect the fact that there are resource constraints, and the benefits of controls must be considered relative to their costs. Because of the inherent limitations in a cost-effective control system, no evaluation of internal control over financial reporting can provide absolute assurance that misstatements due to error or fraud will not occur or that all control issues and instances of fraud, if any, have been or will be detected.
These inherent limitations include the realities that judgments in decision-making can be faulty and that breakdowns can occur because of a simple error or mistake. Controls can also be circumvented by the individual acts of some persons, by collusion of two or more people, or by management override of the controls. The design of any system of controls is based in part on certain assumptions about the likelihood of future events, and there can be no assurance that any design will succeed in achieving its stated goals under all potential future conditions. Projections of any evaluation of controls’ effectiveness to future periods are subject to risks. Over time, controls may become inadequate because of changes in conditions or deterioration in the degree of compliance with policies or procedures.
Changes in Internal Control Over Financial Reporting
During the quarter ended October 2, 2011, there were no changes in our “internal control over financial reporting” (as defined in Rule 13a-15(f) under the Exchange Act) that have materially affected, or are reasonably likely to materially affect, our internal control over financial reporting.
ITEM 9B. Other Information
Not applicable.
ITEM 10. Directors, Executive Officers and Corporate Governance
The following table sets forth certain information regarding our directors and executive officers as of December 14, 2011.
|
Name
|
|
Age
|
|
Positions Held
|
|
Director
Since |
|
|
|
|
|
|
|
|
|
James Rudis
|
|
62
|
|
Chairman of the Board, President, Chief Executive Officer and Director
|
|
1995
|
|
Tracy E. Quinn
|
|
57
|
|
Chief Financial Officer
|
|
-
|
|
Robert A. Olivarez
|
|
33
|
|
Vice President-Finance and Secretary
|
|
-
|
|
Harold Estes(1)
|
|
71
|
|
Director
|
|
2002
|
|
Geoffrey A. Gerard(1)(2)(3)
|
|
66
|
|
Director
|
|
2002
|
|
Alexander Auerbach(2)(3)
|
|
67
|
|
Director
|
|
2004
|
|
Alexander Rodetis, Jr.(1)
|
|
69
|
|
Director
|
|
2004
|
|
(1)
|
Member of audit committee.
|
|
(2)
|
Member of compensation committee.
|
|
(3)
|
Member of nominating and governance committee.
|
The following information regarding the principal occupations and other employment of our directors and executive officers during the past five years and their directorships in certain companies is as reported to us by each of them.
James Rudis was elected to our board of directors in April 1995 and has served as our President and Chief Executive Officer since June 1997. He also served as a director of TreeCon Resources, Inc. (our former parent company) from December 1992 to December 2003, and until December 2003 served as president of TreeCon Resources since July 1997 and chairman and chief executive officer of TreeCon Resources since February 1998. He served as executive vice president of TreeCon Resources from March 1994 until July 1997. Prior to his employment with us and with TreeCon Resources, Mr. Rudis was president of Quorum Corporation, a private consulting firm involved in acquisitions and market development. From 1970 until 1984, he held various executive positions in CIT Financial Corporation, including vice president and regional manager of that company’s commercial finance division.
Mr. Rudis’ experience as our President and Chief Executive Officer gives him unique insights into our challenges, opportunities and operations. He contributes to our board his strategic vision for growth, business strategy and strategic planning skills and marketing acumen. In addition, Mr. Rudis’ prior experience sitting on the boards of other publicly-traded companies and exposure to different industries provide our board with insights regarding governance, finance, compensation, and other key matters.
Tracy E. Quinn has served as our Interim Chief Financial Officer since September 2007, and our Chief Financial Officer since May 10, 2011. Ms. Quinn filled various senior-level finance and operating positions for the H. J. Heinz Company prior to taking early retirement in 2005 after 21 years with that company. At Heinz, she served as corporate controller and chief accounting officer; vice president-finance with one of its U.S. frozen foods divisions; vice president-strategy development at the corporate level; managing director of its U.S. infant foods business unit; and chief financial officer or chief executive officer of various Heinz international operations.
Robert A. Olivarez has served as our Secretary since May 2010 and has also served as our Vice President-Finance since February 2010. Prior to becoming Vice President-Finance, Mr. Olivarez was our Manager-Finance from June 2007. Prior to his employment with us, Mr. Olivarez was in the assurance practice of PricewaterhouseCoopers, LLP in the Los Angeles, California office since 2001.
Harold Estes was appointed to our board of directors in October 2002. Mr. Estes is the president of Texas Timberjack, Inc. (“TTI”), a wholly-owned subsidiary of TreeCon Resources. Mr. Estes was appointed to the board of directors of TreeCon Resources in March 2004. He was previously elected as a director of TreeCon Resources in February 1996 and resigned in April 1997. TTI is a distributor of industrial and commercial timber and logging equipment and is also engaged in certain related timber and sawmill operations. Mr. Estes has been president of TTI since 1984, when he acquired TTI from Eaton Corporation. Mr. Estes previously served as a director of Newton Bancshares, Inc., the parent of First National Bank of Newton (Texas), for approximately ten years until the sale of the bank in October 2001.
Mr. Estes management, operations and leadership experience as president of TTI as well as his experience on the boards of TreeCon Resources and Newton Bancshares, Inc., provides him with broad experience on manufacturing and business issues facing public companies.
Geoffrey A. Gerard was elected to our board of directors in February 2002. From 1975 to 1977, Mr. Gerard served as secretary and general counsel of Equivest, Inc., a third-party lessor of computer mainframes and large peripheral installations. Mr. Gerard then served as secretary and General Counsel for two privately held oil and gas exploration companies until 1978. Throughout this period, Mr. Gerard was a registered securities principal with NASD. Mr. Gerard has been in the private practice of law in Dallas County, Texas since 1978, specializing in business organization and transactions, including preparation of numerous private placements of equity and debt securities. Mr. Gerard received a B.S. in Business-Finance and Economics (1971) and a J.D. degree (1974) from Indiana University.
Mr. Gerard’s legal and business experience provides a unique prospective to our board. Mr. Gerard has been a registered principal through the Financial Industry Regulatory Authority (“FINRA”) for several years and has over 30 years experience as an attorney practicing in Dallas, TX, emphasizing on business organizations and investments. Mr. Gerard has written many private-placement memorandums for entities seeking investment capital and prepared several registration statements for public offerings and reviewed and analyzed numerous public and private offerings for potential investors.
Alexander Auerbach was appointed to our board of directors in September 2004. Mr. Auerbach is president of Alexander Auerbach & Co., Inc., a public relations and marketing services firm that he founded in 1986. Prior to establishing Alexander Auerbach & Co., Inc., Mr. Auerbach served as chief operating officer of two magazine publishing companies. Earlier in his career, Mr. Auerbach was a senior member of the business and financial news staff of The Los Angeles Times and a financial writer for The Boston Globe. Mr. Auerbach holds a B.A. from Columbia University and an M.B.A. from the University of California at Los Angeles.
As president of his own public relations and marketing services firm, Mr. Auerbach advises many national, regional and early-stage companies in a wide range of industries on strategic issues and dealing with institutional and individual investors. Mr. Auerbach provides our board with broad marketing, account management and customer service experience.
Alexander Rodetis, Jr. was appointed to our board of directors in September 2004. Mr. Rodetis is currently president and co-founder of Fairway Financial Services LLC, organized in October 2005, which provides financial and due diligence guidance to bank and non-bank lending institutions as well as to companies seeking solutions to their corporate finance requirements. In addition, Mr. Rodetis is president of Pegasus Financial Services, L.L.C., formed in September 1996 and is engaged, on a project basis, to perform credit and collateral assessments for bank and non-bank borrowers. Mr. Rodetis has been in the financial services community for over thirty-five years. Mr. Rodetis had been the marketing and strategic planning coordinator of the Daley-Hodkin Group from March 2004 to September 2007, a business valuation, asset disposition and consulting organization, and previously held the position of inventory appraisal business head for the Group. He served as senior vice president of General Motors Acceptance Corporation’s Commercial Finance division from 2002 to 2003, where he co-founded the Special Assets group. From 1998 to 2002, Mr. Rodetis served as executive vice president of the Merchants Bank of New York, where he co-founded the asset-based lending corporation for the bank. Prior to that, he served as vice president of Fremont Financial Corp. and of National Westminster Bancorp and held various credit and marketing positions at other banking institutions, including The Chase Manhattan Bank and Citibank North America, Inc. Mr. Rodetis earned a B.S. in Accounting, a B.A. in Business Administration and an M.B.A. in finance from Fairleigh Dickinson University. He has also completed financial analysis and corporate finance courses at The Harvard School of Business.
Mr. Rodetis has numerous years experience in investments and management as the president and senior lending officer of various financial services companies and provides our board with strong financial and accounting skills.
Term of Office and Family Relationships
Our directors are elected at each annual stockholders’ meeting or at such other times as reasonably determined by our board of directors. Each of our directors is to hold office until his successor is elected and qualified or until his earlier death, resignation or removal. Each of our executive officers serves at the discretion of our board of directors. There are no family relationships among our executive officers or directors.
Code of Ethics
Our board of directors has adopted a code of ethics that applies to all of our directors, officers and employees. The code of ethics constitutes our “code of ethics” within the meaning of Section 406 of the Sarbanes-Oxley Act of 2002 and is our “code of conduct” within the meaning of the listing standards of NYSE AMEX. We will provide a copy of our code of ethics to any person without charge, upon written request to Overhill Farms, Inc., Attention: Investor Relations, 2727 East Vernon Avenue, Vernon, California 90058.
Audit Committee Composition
During fiscal year 2011, our audit committee was composed of Messrs. Rodetis, Gerard and Estes, with Mr. Rodetis serving as the committee chairman. Our board of directors has determined that Mr. Rodetis is an “audit committee financial expert” and that each of Messrs. Rodetis, Gerard and Estes are “independent” as defined in Sections 803A and 803B of the NYSE AMEX listing standards.
Section 16(a) Beneficial Ownership Reporting Compliance
Section 16(a) of the Exchange Act, requires our executive officers and directors, and persons who beneficially own more than 10% of a registered class of our common stock, to file initial reports of ownership and reports of changes in ownership with the Commission. These officers, directors and stockholders are required by Commission regulations to furnish us with copies of all reports that they file.
Based solely upon a review of copies of the reports furnished to us during the fiscal year ended October 2, 2011 and thereafter, or any written representations received by us from directors, officers and beneficial owners of more than 10% of our common stock (“reporting persons”) that no other reports were required, we believe that all Section 16(a) filing requirements applicable to our reporting persons were met during fiscal year 2011.
ITEM 11. Executive Compensation
Compensation Discussion and Analysis
Compensation Governance
Our compensation committee is responsible for reviewing and making recommendations to our board of directors regarding compensation policy for our executive officers and also has the authority to approve grants under our option and stock plans.
Compensation Philosophy and Objectives
Our compensation programs for our executive officers are intended to reflect our performance and the value created for our stockholders. We are engaged in a very competitive industry, and our success depends upon our ability to attract and retain qualified executives through the competitive compensation packages we offer to these individuals. Our current compensation philosophy is based on three central objectives:
|
|
●
|
To provide an executive compensation structure and system that is both competitive in the marketplace and also internally equitable based upon the weight and level of responsibilities of each executive;
|
|
|
●
|
To attract, retain and motivate qualified executives within this structure, and reward them for outstanding performance-to-objectives and business results; and
|
|
|
●
|
To structure our compensation policy so that the compensation of executive officers is dependent in part on the achievement of our current year business plan objectives and dependent in part on the long-term increase in our net worth and the resultant improvement in stockholder value, and to maintain an appropriate balance between short and long-term performance objectives.
|
The compensation committee evaluates both performance and compensation to ensure that the total compensation paid to our executive officers is fair, reasonable and competitive. The principal components of compensation for our executives consist of base salary, discretionary bonuses and perquisites and other personal benefits.
From time to time we also offer alternative sources of compensation, such as stock options, to our executive officers. Options provide executive officers with the opportunity to buy and maintain an equity interest in our company and to share in the appreciation of the value of our common stock. In addition, if a participant were to leave prior to the exercise of the participant’s options, the unexercised options would be forfeited after the expiration of the period specified in the options. This makes it more difficult for competitors to recruit key employees away from us. We believe that option grants afford a desirable long-term compensation method because they closely align the interests of our management and other employees with stockholder value and motivate officers to improve our long-term stock performance. No stock options were granted in fiscal year 2011.
Section 162(m) of the Internal Revenue Code places a limit on the amount of compensation that may be deducted in any year with respect to each of our named executive officers. It is our policy that, to the extent possible, compensation will be structured so that the federal income tax deduction limitations will not be exceeded.
Executive Compensation for Fiscal Year 2011
Our compensation policy is designed to reward performance. In measuring our executive officers’ contributions to our company, our compensation committee considers numerous factors, including our growth and financial performance as measured by revenue, gross margin improvement, earnings per share, as well as cashflow targets, among other key performance indicators. We consider individual experience, responsibilities and tenure when determining base salaries, as well as industry averages for similar positions. In addition, we analyze qualitative and quantitative factors when awarding incentive compensation, such as the overall performance of our company and the relative contribution of each individual compared to pre-established performance goals.
Our chief executive officer makes recommendations to our compensation committee regarding the salaries, bonus arrangements and option grants, if any, for key employees, including all executive officers. For executive officers whose bonus awards are based partly on individual performance, our chief executive officer’s evaluation of such performance is provided to and reviewed by our compensation committee. Our compensation committee does not currently engage any consultant related to executive and/or director compensation matters.
Stock price performance has not been a factor in determining annual compensation because the price of our common stock is subject to a variety of factors outside of management’s control. We do not subscribe to an exact formula for allocating cash and non-cash compensation. However, a significant percentage of total executive compensation is performance-based. Historically, the majority of the incentives to our executives have been in the form of cash incentives, as we previously had debt restrictions that restricted the number of stock options granted.
For fiscal year 2011, our compensation for named executives consisted of base salary, discretionary bonuses and perquisites. No stock options or other equity incentives were granted.
Our board of directors, upon recommendation of our compensation committee, has approved limited bonuses for each executive officer for fiscal year 2011. The primary criteria used in determining bonuses related to our overall performance, progress on strategic objectives and each individual’s contribution to that performance.
During fiscal year 2011, although our net revenues decreased by $25.3 million, we were able to remain profitable despite a very poor economic climate, with net income of $1.4 million. We also strengthened our balance sheet by decreasing our long term debt by $2.4 million. As a result, Mr. Rudis received a total bonus of $38,500, Ms. Quinn received and Mr. Olivarez received a total bonus of $7,500 and $4,200, respectively, consisting of a 401(k) contribution. Further information regarding executive bonuses is contained below under the heading “Executive Bonuses.”
Executive Bonuses
Upon recommendation of the compensation committee, our board of directors approved limited bonuses for fiscal year 2011 for our named executive officers, based upon their contributions to our success during fiscal year 2011. The bonuses will be paid in fiscal year 2012.
For fiscal year 2011, Mr. Rudis served as our Chairman of the board of directors, Chief Executive Officer and President. As part of the function of all three roles, Mr. Rudis served as the relationship manager to stockholders, lenders and all four of our previously disclosed significant customers. In addition to setting the long-term strategy for us, Mr. Rudis was responsible for our overall profitability and maintained a close working relationship with all significant parties to help ensure positive results were achieved.
For fiscal year 2011, Ms. Quinn served as our Chief Financial Officer and was responsible for overseeing: all of our accounting practices and policies; Commission and other regulatory interaction and correspondence; the establishment and maintenance of adequate control over financial reporting; and the implementation of new rules and regulations resulting from recently enacted legislation relating to proxy statements, healthcare and financial regulatory reform. Ms. Quinn is also responsible for directing our financial strategy and forecasts and also overseeing our risk management process.
For fiscal year 2011, Mr. Olivarez served as our Vice President-Finance and Secretary and was responsible for ensuring that our board of directors and Audit Committee met regularly in accordance with NYSE AMEX standards and also for creating and gathering materials needed for the meetings as well as preparing the minutes for each meeting. Mr. Olivarez was also responsible for: implementing accounting practices and policies; interaction and correspondence with the Commission and other regulatory agencies; creating and submitting publicly filed documents; establishing and maintaining adequate internal control over financial reporting; implementing new rules and regulations resulting from recently enacted legislation relating to proxy statements, healthcare and financial regulatory reform; production of periodic financial reports; maintenance of company accounting records and safeguarding of company assets. Mr. Olivarez was also responsible for shareholder interaction and correspondence.
To determine the amounts of the executive bonuses for fiscal year 2011, the compensation committee considered these individual accomplishments and also reviewed some of the Company’s more significant financial benchmarks, including but not limited to net revenue growth, gross margin improvement, earnings per share, cash flow and earnings before interest, taxes, depreciation and amortization (“EBITDA”).
For the fiscal year ended October 2, 2011, amid a weak economy and the loss of $9.5 million in revenues from H. J. Heinz Company, Inc., we were able to remain profitable and not violate any of our debt covenants. Although our net revenues and gross profit decreased $25.3 million and $10.7 million, respectively, in fiscal year 2011 compared to fiscal year 2010, we had net income of $1.4 million and reduced our debt by $2.4 million. For fiscal year 2011, we had earnings per share of $0.09 per basic and diluted shares. Lastly, our EBITDA for fiscal year 2011 was $6.8 million. EBITDA for the fiscal year ended October 2, 2011, was calculated using the following measurements: net income of $1.4 million; interest expense of $225,000; tax expense of $825,000; depreciation and amortization expense of $4.2 million; and amortization expense of debt discount and deferred financing costs of $110,000.
The $38,500 bonus approved for James Rudis consisted of $31,000 in cash (approximately 7% of his base salary) and a $7,500 401(k) contribution. The bonus approved for Tracy E. Quinn consisted of a $7,500 401(k) contribution. The bonus approved for Robert A. Olivarez consisted of a $4,200 401(k) contribution, which represented 3% of Mr. Olivarez' gross W-2 earnings for calendar year 2011.
Conclusion
Although we have adopted from time to time in the past, and may again in the future adopt, a formal bonus plan involving certain pre-established goals, we did not adopt such a plan for our executives in fiscal years 2011, 2010 and 2009. Our policy is not to disclose target levels with respect to specific quantitative or qualitative performance-related factors or factors considered to involve confidential business information, because their disclosure would have an adverse effect on us. The adverse effect would stem from competitive harm that would occur if we were to disclose confidential trade secrets or confidential commercial or financial information or specific customer-related targets and objectives.
Attracting and retaining talented and motivated management and employees is essential in creating long-term stockholder value. Offering a competitive, performance-based compensation program helps to achieve this objective by aligning the interests of executive officers and other key employees with those of stockholders. We believe that our fiscal year 2011 compensation program met this objective.
Summary Compensation Table
The following table sets forth for fiscal years 2011, 2010 and 2009 compensation awarded or paid to Mr. James Rudis, our Chairman, Chief Executive Officer and President, Ms. Tracy E. Quinn, our Chief Financial Officer and Mr. Robert A. Olivarez, our Vice President-Finance and Secretary for services rendered to us. Messrs. Rudis, Olivarez and Ms. Quinn are also referred to as “named executive officers.” Other than as indicated in the table below, none of our executive officers received total compensation in excess of $100,000 for fiscal year 2011.
|
Name and
Principal Positions |
Year
|
Salary ($)
|
Bonus ($)
|
All Other
Compensation ($) |
Total ($)
|
|||||||||||||
|
|
|
|
|
|
||||||||||||||
|
James Rudis,
|
2011
|
$ | 475,645 | $ | 38,500 | $ | 276,277 | (1) | $ | 790,422 | ||||||||
|
Chairman, President and
|
2010
|
439,849 | 194,350 | 232,715 | 866,914 | |||||||||||||
|
Chief Executive Officer
|
2009
|
371,178 | 177,850 | 227,407 | 776,435 | |||||||||||||
|
|
||||||||||||||||||
|
Tracy E. Quinn,
|
2011
|
361,385 | 7,500 | 92,760 | (2) | 461,645 | ||||||||||||
|
Chief Financial Officer
|
2010
|
354,462 | 32,350 | 72,054 | 458,866 | |||||||||||||
|
2009
|
360,000 | 57,350 | 80,253 | 497,603 | ||||||||||||||
|
Robert A. Olivarez,
|
2011
|
142,692 | 4,200 | - | 146,892 | |||||||||||||
|
Vice President-Finance and Secretary
|
2010
|
134,808 | 16,642 | - | 151,450 | |||||||||||||
|
(1)
|
Mr. Rudis received certain perquisites and other personal benefits in fiscal year 2011, which consist of the following:
|
|
|
a.
|
Premium paid of $17,966 for term life insurance for the benefit of Mr. Rudis’ spouse; and
|
|
|
b.
|
Mr. Rudis maintains offices in both Vernon, California and New York. $258,311 represents perquisites or other benefits relating to payment of or reimbursement for commuting expenses between New York and California, including $182,554 for airfare, $46,217 for lodging and $29,540 for transportation, meals and other miscellaneous expenses.
|
|
(2)
|
Ms. Quinn received certain perquisites and other personal benefits in fiscal year 2011, which consist of the following:
|
|
|
Ms. Quinn maintains her principal residence in Pennsylvania. $92,760 represents perquisites or other benefits relating to payment of or reimbursement for commuting expenses between Pennsylvania and California, including $57,138 for airfare, $33,810 for lodging and $1,812 for transportation, meals and other miscellaneous expenses.
|
Executive Employment Agreements and Arrangements
James Rudis
Mr. Rudis’ employment agreement will expire on December 31, 2011. After the initial term, the relationship will be at-will and may be terminated by us at any time or by Mr. Rudis upon at least 60 days’ written notice. Upon termination, Mr. Rudis would be entitled to receive accrued and unpaid base salary, unreimbursed business expenses and accrued but unused vacation and unused sick pay.
Mr. Rudis’ base salary, as of October 2, 2011, was $458,000 per year and we will review his compensation annually and increase it in a percentage not less than that of the annual increase in the cost of living. The employment agreement contains a covenant by Mr. Rudis not to compete with us during the term of his employment and for a period of one year thereafter. We have agreed to provide at our expense a $1.0 million life insurance policy on Mr. Rudis’ life, payable to a beneficiary of his choice, and to pay to him up to $800 per month for an automobile lease and to reimburse him for all operating expenses relating to the leased automobile. In addition, if Mr. Rudis chooses not to participate in our existing group medical insurance plan, we have agreed to reimburse him for health insurance premiums he pays through the term of the employment agreement and any extensions for him and his immediate family, up to the amounts he paid for such coverage immediately prior to the effective date of the employment agreement. Mr. Rudis is entitled to four weeks vacation time annually and we have agreed to cash out and pay Mr. Rudis for the portion of any vacation time not used by the end of the calendar year in which it was earned or at such a later date as may be specified by Mr. Rudis.
Mr. Rudis is also entitled to receive a minimum payment of $300,000 (in addition to any other payments our compensation committee may award in its sole discretion) upon:
|
●
|
an individual, entity or group becoming the beneficial owner of more than 50% of the total voting power of our total outstanding voting securities on a fully-diluted basis;
|
|
●
|
an individual or entity acquiring substantially all of our assets and business; or
|
|
●
|
a merger, consolidation, reorganization, business combination or acquisition of assets or stock of another entity, other than in a transaction that results in our voting securities outstanding immediately before the transaction continuing to represent at least 50% of the combined voting power of the successor entity’s outstanding voting securities immediately after the transaction.
|
However, a change in control does not include a financing transaction approved by our board of directors and involving the offering and sale of shares of our capital stock.
The employment agreement also provides that if Mr. Rudis is terminated by reason of his death or disability, he or his estate is entitled to receive:
|
●
|
any accrued, unpaid base salary payable in effect on the date of termination
|
|
●
|
any unreimbursed business expenses outstanding as of the date of termination; and
|
|
●
|
any accrued but unused vacation pay as of the date of termination.
|
If Mr. Rudis voluntarily resigns prior to the end of the term, he will not be entitled to receive any bonus payments. If we terminate Mr. Rudis without cause, then subject to certain requirements, Mr. Rudis will be entitled to:
|
●
|
a severance benefit in the form of continuation of his base salary in effect at the date of termination and payment of COBRA health insurance premiums for the longer of twelve months or the remaining unexpired portion of the initial term of the agreement; and
|
|
●
|
a pro rated bonus payment under the terms of a bonus plan, if any, pursuant to which a bonus has been earned, payable at the time provided in the bonus plan.
|
In addition, Mr. Rudis maintains offices in both Vernon, California and New York. As of October 2, 2011 we paid $258,311 in perquisites or other benefits relating to payment of or reimbursement for commuting expenses between New York and California. This includes $182,554 for airfare, $46,217 for lodging and $29,540 for transportation, meals and other miscellaneous expenses.
Tracy E. Quinn
Ms. Quinn’s employment arrangement commenced on September 10, 2007. The initial term of Ms. Quinn’s employment was for 90 days, but is reviewable by us every 30 days, and terminable at-will by either party. Ms. Quinn receives a monthly base salary of $30,000. In addition, we have agreed to pay or reimburse Ms. Quinn for all reasonable travel expenses from the Pittsburgh, Pennsylvania area to southern California and all reasonable living expenses while she is conducting business on our behalf in southern California. As of October 2, 2011, we paid $92,760 in perquisites or other benefits relating to payment of or reimbursement for commuting expenses between Pennsylvania and California, including $57,138 for airfare, $33,810 for lodging and $1,812 for transportation, meals and other miscellaneous expenses.
Robert A. Olivarez
Mr. Olivarez receives an annual base salary of $140,000. Our board of directors determines Mr. Olivarez’ discretionary bonus based on performance and his contributions to our success.
Outstanding Equity Awards at Fiscal Year-End
The following table provides information regarding the number of shares of common stock underlying options held by the named executive officers at October 2, 2011.
|
|
Option Awards
|
||||||||||||||
|
Name
|
Number of
Securities Underlying
Unexercised Options (#) Exercisable
|
Number of
Securities Underlying
Unexercised Options (#) Unexercisable
|
Option
Exercise Price
($)
|
Option Expiration
Date
|
|||||||||||
|
|
|
|
|
||||||||||||
|
James Rudis
|
300,000 | - | $ | 1.60 | (1) | ||||||||||
| 69,136 | - | 1.47 | (2) | ||||||||||||
| 10,288 | - | 1.50 | (2) | ||||||||||||
| 10,288 | - | 2.00 | (2) | ||||||||||||
| 10,288 | - | 2.50 | (2) | ||||||||||||
|
Tracy E. Quinn
|
- | - | - | - | |||||||||||
|
Robert A. Olivarez
|
- | - | - | - | |||||||||||
|
(1)
|
Option expiration date is September 30, 2012.
|
|
(2)
|
Option expiration date is February 1, 2015.
|
Potential Payments Upon Termination or Change in Control
Executive Employment Agreements and Arrangements. We have entered into agreements with our named executive officers that provide certain benefits upon the termination of their employment under certain prescribed circumstances. Those agreements are described above under “ Executive Employment Agreements and Arrangements.”
Calculation of Potential Payments upon Termination or Change of Control. In accordance with the rules of the Commission, the following table presents our estimate of the benefits payable to the named executive officers under their employment agreements or arrangements assuming that their service to us terminated on September 30, 2011, the last business day of fiscal year 2011, under the following circumstances: (A) a change in control occurred, as defined under Mr. Rudis’ employment agreement; (B) a qualifying termination occurred, which is a termination by Mr. Rudis for “good reason” or by us without “cause” under his employment agreement; or (C) a non-qualifying termination occurred, which is a voluntary resignation by Mr. Rudis for other than “good reason,” by us for “cause,” as defined under Mr. Rudis’ employment agreement, or by us prior to renewal as provided in the executive employment agreements or by us upon Mr. Rudis’ death or disability, or any termination of Ms. Quinn or Mr. Olivarez.
|
Name
|
Trigger
|
Salary and
Bonus |
Continuation of
Benefits |
Total Value(5)
|
||||||||||
|
James Rudis
|
Change in Control | $ | 300,000 | (1) | $ | - | $ | 300,000 | ||||||
|
|
Qualifying Termination
|
696,859 | (2) | 28,933 | (3) | 725,792 | ||||||||
|
|
Non-Qualifying Termination
|
208,850 | (4) | - | 208,850 | |||||||||
|
|
||||||||||||||
|
Tracy E. Quinn
|
Change in Control
|
- | - | - | ||||||||||
|
|
Qualifying Termination
|
- | - | - | ||||||||||
|
|
Non-Qualifying Termination
|
37,381 | (4) | - | 37,381 | (4) | ||||||||
|
|
||||||||||||||
|
Robert A. Olivarez
|
Change in Control
|
- | - | - | ||||||||||
|
|
Qualifying Termination
|
- | - | - | ||||||||||
|
|
Non-Qualifying Termination
|
4,869 | (4) | - | 4,869 | (4) | ||||||||
|
(1)
|
Pursuant to Mr. Rudis’ employment agreement, Mr. Rudis is entitled to a $300,000 lump sum change in control payment.
|
|
(2)
|
Includes base salary for the remainder of the term of employment or twelve months, whichever is longer, any bonus earned through the date of termination, accrued but unused vacation and unused sick pay.
|
|
(3)
|
Includes monthly premiums required to maintain his health insurance for the remainder of the term of employment or twelve months, whichever is longer.
|
|
(4)
|
Includes accrued base salary, accrued but unused vacation and unused sick pay.
|
|
(5)
|
Excludes the value to the executive of the continuing right to indemnification and continuing coverage under our directors’ and officers’ liability insurance, if applicable.
|
Director Compensation
Non-employee directors are entitled to cash payments of $3,000 per month in consideration for their service on our board of directors. Also during fiscal year 2011, we gave a $20,000 bonus to each non-employee director due to the fact that we have not increased board fees over the past several years. We may also periodically award options to our directors under our existing option and stock plans or otherwise.
Mr. Rudis was compensated as a full-time employee and officer and received no additional compensation for service as a board member during fiscal year 2011. Information regarding the compensation awarded to Mr. Rudis is included in the “Summary Compensation Table” above.
Director Compensation Table
The following table summarizes the compensation of our directors for the year ended October 2, 2011:
|
Name
|
Fees Earned
or Paid |
Option
Awards |
Total
($) |
|||||||||
|
Geoffrey A. Gerard
|
$ | 60,500 | $ | - | $ | 60,500 | ||||||
|
Alexander Auerbach(3)
|
59,500 | - | 59,500 | |||||||||
|
Alexander Rodetis, Jr.
|
60,500 | - | 60,500 | |||||||||
|
Harold Estes
|
59,500 | - | 59,500 | |||||||||
| ____________ | ||||||||||||
|
|
(1)
|
For a description of annual director fees, see the disclosure above under “Director Compensation.” The value of perquisites and other personal benefits was less than $10,000 in aggregate for each director.
|
|
(2)
|
There were no stock options awarded during fiscal 2011. Outstanding options held by each director as of October 2, 2011 are as follows:
|
|
●
|
Geoffrey A. Gerard – 27,000 options, which are fully vested.
|
|
●
|
Alexander Auerbach – 25,000 options, which are fully vested.
|
|
●
|
Alexander Rodetis, Jr. – 25,000 options, which are fully vested.
|
|
(3)
|
Mr. Auerbach’s firm, Alexander Auerbach & Co. Inc., also provides us with public relations and marketing services, for which we paid $67,000 with respect to fiscal year 2011. See “Certain Relationships and Related Transactions, and Director Independence” in Item 13 of this report.
|
Compensation Committee Interlocks and Insider Participation
During fiscal year 2011, the compensation committee was composed of Messrs. Auerbach and Gerard, with Mr. Auerbach serving as the committee chairman. No director who was a member of the compensation committee during fiscal year 2011 was an officer or employee of Overhill Farms, Inc. during fiscal year 2011, was formerly an officer of Overhill Farms, Inc., or had any relationship requiring disclosure pursuant to Item 404 of Regulation S-K under the Securities Act of 1933, as amended, except that as disclosed in Item 13 of this report, Mr. Auerbach is a stockholder, director and officer of a company that provided us with public relations and marketing services in exchange for fees that constituted more than 5%, or approximately $67,000, for our fiscal year 2011, of that company’s gross revenues for its fiscal year ended January 31, 2011.
During fiscal year 2011, none of our executive officers served as a member of a compensation committee of another entity (or other board committee of such company performing similar functions or, in the absence of any such committee, the entire board of directors of such corporation), one of whose executive officers serves on our compensation committee. During fiscal year 2011, none of our executive officers served as a director of another entity, one of whose executive officers served on our compensation committee. During fiscal year 2011, none of our executive officers served as a member of the compensation committee of another entity, one of whose executive officers served as a director of our company.
The following Compensation Committee Report is not deemed filed with the Commission. Notwithstanding anything to the contrary set forth in any of our previous filings made under the Securities Act or under the Exchange Act that might incorporate future filings made by us under those statutes, the Compensation Committee Report will not be incorporated by reference into any such prior filings or into any future filings made by us under those statutes.
Compensation Committee Report
The Compensation Committee has reviewed and discussed the foregoing Compensation Discussion and Analysis with management, and based on that review and discussion, the Compensation Committee recommended to the board of directors that the Compensation Discussion and Analysis be included in the Annual Report on Form 10-K for the fiscal year ended October 2, 2011.
| Respectfully submitted,
Compensation Committee
|
|
| Alexander Auerbach, Chairman
Geoffrey A. Gerard
|
ITEM 12. Security Ownership of Certain Beneficial Owners and Management and Related Stockholder Matters
As of December 14, 2011, a total of 15,823,271 shares of our common stock were outstanding. The following table sets forth certain information as of that date regarding the beneficial ownership of our common stock by:
|
●
|
each of our directors;
|
|
●
|
each of the named executive officers included in the Summary Compensation Table contained in Item 11 of this report;
|
|
●
|
all of our directors and executive officers as a group; and
|
|
●
|
each person known by us to beneficially own more than 5% of the outstanding shares of our common stock.
|
Beneficial ownership is determined in accordance with Rule 13d-3 promulgated by the Commission and generally includes voting or investment power with respect to securities. Except as indicated below, we believe each holder possesses sole voting and investment power with respect to all of the shares of common stock owned by that holder, subject to community property laws where applicable. In computing the number of shares beneficially owned by a holder and the percentage ownership of that holder, shares of common stock subject to options held by that holder that are currently exercisable or are exercisable within 60 days after the date of the table are deemed outstanding. Those shares, however, are not deemed outstanding for the purpose of computing the percentage ownership of any other person or group.
The inclusion of shares in this table as beneficially owned is not an admission of beneficial ownership. Except as indicated below, the address for each named beneficial owner is the same as ours.
|
Name and Address of Beneficial Owner
|
Amount and Nature of
Beneficial Ownership |
Percent
of Class |
||||||
|
|
|
|||||||
|
Hotchkis and Wiley Capital Management, LLC
|
2,620,652 | (1) | 16.6 | % | ||||
|
Lord Abbett & Co. LLC
|
2,139,775 | (2) | 13.5 | % | ||||
|
Huber Capital Management, LLC
|
1,113,149 | (3) | 7.0 | % | ||||
|
Harold Estes
|
1,111,565 | (4) | 7.0 | % | ||||
|
James Rudis
|
605,550 | (5) | 3.7 | % | ||||
|
Geoffrey A. Gerard
|
36,500 | (6) | * | |||||
|
Alexander Auerbach
|
35,000 | (7) | * | |||||
|
Alexander Rodetis, Jr.
|
26,700 | (8) | * | |||||
|
Tracy E. Quinn
|
- | - | ||||||
|
Robert A. Olivarez
|
- | - | ||||||
|
All directors and executive officers as a group
|
1,815,315 | (9) | 11.1 | % | ||||
|
(7 persons)
|
||||||||
|
*
|
Less than 1.0%.
|
|
(1)
|
Based upon Schedule 13F-HR filed with the Commission for September 30, 2011. On behalf of its investment advisory clients, the holder has sole voting power over 1,237,500 shares and sole dispositive power over 2,620,652 shares. The address for the holder is 725 S. Figueroa Street 39th Floor, Los Angeles, California 90017.
|
|
(2)
|
Based upon Schedule 13F-HR filed with the Commission for September 30, 2011. On behalf of its investment advisory clients, the holder has sole voting power over 1,775,261 shares and sole dispositive power over 2,139,775 shares. The address for the holder is 90 Hudson Street, Jersey City, New Jersey 07302.
|
|
(3)
|
Based upon Schedule 13F-HR filed with the Commission for September 30, 2011. On behalf of its investment advisory clients, the holder has sole voting power over 456,991 shares and sole dispositive power over 1,113,149 shares. The address for the holder is 10940 Wilshire Blvd. Suite 925, Los Angeles, California 90024.
|
|
(4)
|
Mr. Estes’ address is 6004 South US Highway 59, Lufkin, Texas 75901.
|
|
(5)
|
Includes 400,000 shares of common stock underlying options.
|
|
(6)
|
Includes 27,000 shares of common stock underlying options.
|
|
(7)
|
Includes 25,000 shares of common stock underlying options.
|
|
(8)
|
Includes 25,000 shares of common stock underlying options.
|
|
(9)
|
Includes 477,000 shares of common stock underlying options.
|
Equity Compensation Plan Information
The following table gives information about our common stock that may be issued upon the exercise of options, warrants and rights under all of our existing equity compensation plans as of October 2, 2011.
|
Plan category
|
Number of
securities to be |
Weighted-average
exercise priceof outstanding options,
warrants
and rights |
Number of
securities remaining |
|||||||||
|
|
(a)
|
(b)
|
(c)
|
|||||||||
|
Equity compensation plans approved by security holders
|
521,000 | (1) | $ | 1.61 | 139,000 | (2) | ||||||
|
Equity compensation plans not approved by security holders
|
- | - | - | |||||||||
|
Total
|
521,000 | $ | 1.61 | 139,000 | ||||||||
|
(1)
|
Represents shares of common stock underlying options granted under our Amended and Restated 2002 Employee Stock Option Plan and Amended and Restated 2005 Stock Plan.
|
|
(2)
|
Represents shares of common stock authorized for issuance under our Amended and Restated 2002 Employee Stock Option Plan, which plan was originally adopted by our board of directors and then majority stockholder on September 25, 2002, to be effective as of October 29, 2002; the plan was further approved by our stockholders at our 2003 annual meeting and was amended and restated by our compensation committee (further stockholder approval was not required) on December 3, 2008. Also represents shares of common stock authorized for issuance under our Amended and Restated 2005 Stock Plan, which was adopted by our board of directors on February 1, 2005, approved by then majority stockholder on February 24, 2005 and approved by our stockholders at our 2005 annual meeting and was amended and restated by our compensation committee (further stockholder approval was not required) on December 3, 2008. Our Amended and Restated 2002 Employee Stock Option Plan and Amended and Restated 2005 Stock Plan each provide that if, at any time while that plan is in effect or unexercised options granted under that plan are outstanding, there is an increase or decrease in the number of issued and outstanding shares of common stock of Overhill Farms, Inc. through the declaration of a stock dividend or through a recapitalization that results in a stock split, combination or exchange of shares, then appropriate adjustment shall be made in the maximum number of shares authorized for issuance under that plan so that the same proportion of our issued and outstanding shares of common stock will continue to be subject to being optioned under the plan and appropriate adjustment will be made in the number of shares and the exercise price per share then subject to outstanding options so that the same proportion of our issued and outstanding shares will remain subject to purchase at the same aggregate exercise price.
|
ITEM 13. Certain Relationships and Related Transactions, and Director Independence
Review, Approval or Ratification of Transactions with Related Persons
Our board of directors has the responsibility to review and discuss with management and approve material transactions with related parties. These transactions are governed by our Policies and Procedures for the Approval of Related Party Transactions. During the review process, the material facts as to the related party’s interest in a transaction are disclosed to all board members. Under the policies and procedures, the board is to review each interested transaction with a related party that requires approval and either approve or disapprove of the entry into the related party transaction. A related party transaction is any transaction in which we are a participant and any related party has or will have a direct or indirect interest. Transactions that are in the ordinary course of business and would not require either disclosure pursuant to Item 404(a) of Regulation S-K or approval of the board would not be deemed a related party transaction. No director may participate in any discussion or approval of a related party transaction with respect to which he or she is a related party. Our board intends to approve only those related party transactions that are in our best interests.
Transactions with Related Persons
Other than as described below, there were no transactions or series of transactions to which we were or are a party involving an amount in excess of $120,000 and in which any director, executive officer, holder of more than 5% of our voting stock, or members of the immediate family of any foregoing persons, had or will have a direct or indirect material interest. The transaction listed below was approved by our board of directors, and the interest of Mr. Auerbach in this matter described below was disclosed to our board of directors before our board of directors approved the matter.
In February 2004, we engaged Alexander Auerbach & Co., Inc. (“AAPR”) to provide us with public relations and marketing services. AAPR provides public relations, media relations and communications marketing services to support our sales activities. Alexander Auerbach, who is one of our directors, is a stockholder, director and officer of AAPR. We paid to AAPR $67,000 for services rendered under this engagement during fiscal year 2011. These fees totaled more than 5% of AAPR’s gross revenues for its fiscal year ended January 31, 2010.
Director Independence
NYSE AMEX rules and the charters of our board committees provide that a majority of our board of directors and all members of our audit, compensation and nominating and governance committees of our board of directors will be independent. On an annual basis, each director and executive officer is obligated to complete a Director and Officer Questionnaire that requires disclosure of any transactions with us in which a director or executive officer, or any member of his or her immediate family, have a direct or indirect material interest. Following completion of these questionnaires, the board of directors, with the assistance of the nominating and governance committee, makes an annual determination as to the independence of each director using the current standards for “independence” established by the Commission and NYSE AMEX and consideration of any other material relationship a director may have with us.
Our board of directors has determined that each of our non-employee directors is “independent” as defined in the general board independence standard contained in Section 803A of the NYSE AMEX listing standards. Our board of directors also has determined that each of Messrs. Rodetis, Gerard,and Estes are “independent” as defined in Sections 803A and 803B of the NYSE AMEX listing standards applicable to audit committee members. In addition, our board of directors has determined that Mr. Auerbach is “independent” under Section 803A of the NYSE AMEX listing standards applicable to compensation committee members. Also, our board of directors has determined that Messrs. Gerard and Auerbach are “independent” under Section 803A of the NYSE AMEX listing standards applicable to nominating and governance committee members.
ITEM 14. Principal Accountant Fees and Services
Audit and Non-Audit Fees
The following table presents fees for professional audit services rendered by Ernst & Young LLP for the audit of our annual financial statements for fiscal years 2011 and 2010.
|
|
2011
|
2010
|
||||||
|
|
|
|
||||||
|
Audit Fees
|
$ | 444,000 | $ | 430,000 | ||||
|
Audit-Related Fees
|
-- | -- | ||||||
|
Tax Fees
|
-- | -- | ||||||
|
All Other Fees
|
-- | -- | ||||||
Audit Fees. Audit fees consist of amounts billed for professional services rendered for the audit of our annual financial statements included in our Annual Reports on Form 10-K, and reviews of our interim financial statements included in our Quarterly Reports on Form 10-Q and our Registration Statement on Form S-3, including amendments thereto.
Audit-Related Fees. Audit-Related Fees consist of fees billed for professional services that are reasonably related to the performance of the audit or review of our consolidated financial statements but are not reported under “Audit Fees.”
Tax Fees. Tax Fees consist of fees for professional services for tax compliance activities, including the preparation of federal and state tax returns and related compliance matters.
All Other Fees. Consists of amounts billed for services other than those noted above.
Pre-Approval Policy
Our audit committee’s policy is to pre-approve all auditing services and permitted non-audit services to be performed for us by our independent auditors, subject to the de minimis exceptions for non-audit services described in Section 10A(i)(1)(B) of the Exchange Act that are approved by the audit committee prior to the completion of the audit. During fiscal year 2011, all services performed by Ernst & Young LLP were pre-approved by our audit committee in accordance with these policies and applicable Commission regulations.
PART IV
ITEM 15. Exhibits and Financial Statement Schedules
(a) The following financial statements are filed as part of this report:
Report of Independent Registered Public Accounting Firm
Balance Sheets — October 2, 2011 and September 26, 2010
Statements of Income — Years Ended October 2, 2011, September 26, 2010 and September 27, 2009
Statements of Stockholders’ Equity — Years Ended October 2, 2011, September 26, 2010 and September 27, 2009
Statements of Cash Flows — Years Ended October 2, 2011, September 26, 2010 and September 27, 2009
Notes to Financial Statements
(b) The following exhibits are attached to or incorporated by reference herein:
|
Exhibit Number
|
Exhibit Title
|
|
|
3.1(2)
|
Second Amended and Restated Articles of Incorporation of Overhill Farms, Inc. filed on June 1, 2009 with the Nevada Secretary of State (Exhibit 3.1)
|
|
|
3.2(12)
|
Second Amended and Restated Bylaws of Overhill Farms, Inc., adopted effective as of April 2, 2009 (Exhibit 3.1)
|
|
|
4.1 (1)
|
Form of the specimen common stock certificate of Overhill Farms, Inc. (Exhibit 4.1)
|
|
|
10.1 (11)
|
Lease dated November 15, 2008 between U.S. Growers Cold Storage, Inc. and Overhill Farms, Inc. regarding premises located at 3055 E. 44th Street, 3021 E. 44th Street, 3009 E. 44th Street and 3001 E. 44th Street Vernon, California (Exhibit 10.1)
|
|
|
10.2 (3)
|
Master Lease Agreement dated as of August 1, 2002 between General Electric Capital Corporation and Overhill Farms, Inc. and related documentation regarding freezers and various other equipment (Exhibit 10.35)
|
|
|
10.3 (3)
|
Industrial Real Estate Lease (Single-Tenant Facility) dated April 22, 1994 between Vernon Associates and Ernest Paper Products, Inc. and related addendum regarding premises located at 2727 E. Vernon Avenue, Vernon, California (Exhibit 10.86)
|
|
10.4 (3)
|
Standard Industrial/Commercial Single-Tenant Lease – Net dated January 1, 2002 by and between Vernon Associates, LLC and Overhill Farms, Inc. regarding premises located at 2727 E. Vernon Avenue, Vernon, California (Exhibit 10.88)
|
|
|
10.5 (3)
|
Addendum to Standard Industrial/Commercial Single-Tenant Lease – Net regarding premises located at 2727 E. Vernon Avenue, Vernon, California (Exhibit 10.89)
|
|
|
10.6 (4)
|
Consulting Agreement dated February 18, 2004 between Overhill Farms, Inc. and Alexander Auerbach & Co., Inc. (Exhibit 10.1)
|
|
|
10.7 # (11)
|
Amended and Restated 2002 Employee Stock Option Plan of Overhill Farms, Inc. (Exhibit 10.8)
|
|
|
10.8 # (11)
|
Amended and Restated 2005 Stock Plan of Overhill Farms, Inc. (Exhibit 10.9)
|
|
|
10.9 # (5)
|
Form of Restricted Stock Purchase Agreement Under 2005 Stock Plan (Exhibit 10.3)
|
|
|
10.10 # (6)
|
Form of Stock Option Agreement Under 2005 Stock Plan (Exhibit 10.2)
|
|
10.11 # (10)
|
Form of Stock Option Agreement Under 2002 Employee Stock Option Plan (Exhibit 4.7)
|
|
|
10.12 (7)
|
Credit Agreement, dated September 24, 2010, between Overhill Farms, Inc. and Bank of America, N.A. (Exhibit 10.1)
|
|
|
10.13 (8)
|
Summary of Director Compensation (Exhibit 10.22)
|
|
|
10.14 # (9)
|
Description of Employment Arrangement between Overhill Farms, Inc. and Tracy E. Quinn
|
|
|
10.15 # (13)
|
Employment Agreement, entered into as of February 18, 2010 between Overhill Farms, Inc., and James Rudis (Exhibit 10.1)
|
|
|
10.16 # **
|
Description of Employment Arrangement between Overhill Farms, Inc. and Robert A. Olivarez
|
|
|
10.17 (14)
|
License Agreement, dated November 4, 2010, between Boston Market Corporation and Overhill Farms, Inc. (Exhibit 10.1)
|
|
|
10.18 # (15)
|
Form of Indemnification Agreement entered into between Overhill Farms, Inc. and each of its directors and officers (Exhibit 10.1)
|
|
|
10.19 (16)
|
Notice of Exercising Option to Renew - Standard Industrial/Commercial Singe Tenant Lease, dated January 13, 2011, executed by Overhill Farms, Inc. (Exhibit 10.1)
|
|
|
10.20 **
|
First Amendment to Lease, dated June 12, 2006, between Vernon Associates, LLC and Overhill Farms, Inc.
|
|
|
10.21 (17)
|
Second Amendment to Lease, dated May 6, 2011, between Vernon Associates, LLC and Overhill Farms, Inc. (10.1)
|
|
|
10.22** (18)
|
Co-Manufacturing, Sales and Distribution Agreement, dated August 4, 2011, between Bellisio Foods, Inc. and Overhill Farms, Inc.
|
|
|
23**
|
Consent of Independent Registered Public Accounting Firm
|
|
|
31.1**
|
Certification of Principal Executive Officer Required by Rule 13a-14(a) of the Securities Exchange Act of 1934, as amended, as Adopted Pursuant to Section 302 of the Sarbanes-Oxley Act of 2002 (2)
|
|
|
31.2**
|
Certification of Principal Financial Officer Required by Rule 13a-14(a) of the Securities Exchange Act of 1934, as amended, as Adopted Pursuant to Section 302 of the Sarbanes-Oxley Act of 2002 (2)
|
|
|
32**
|
Certification of Chief Executive Officer and Chief Financial Officer Pursuant to 18 U.S.C. Section 1350, as Adopted Pursuant to Section 906 of the Sarbanes-Oxley Act of 2002
|
__________________
** Filed herewith
# Management contract or compensatory plan or arrangement
|
|
(1)
|
Incorporated by reference to the exhibit shown in parentheses included in the Registrant’s Registration Statement on Form 10 (File No. 1-16699).
|
|
|
(2)
|
Incorporated by reference to the exhibit shown in parentheses included in the Registrant’s Quarterly Report on Form 10-Q for the fiscal quarter ended June 28, 2009.
|
|
|
(3)
|
Incorporated by reference to the exhibit shown in parentheses included in the Registrant’s Annual Report on Form 10-K for the fiscal year ended September 28, 2003.
|
|
|
(4)
|
Incorporated by reference to the exhibit shown in parentheses included in the Registrant’s Current Report on Form 8-K for September 17, 2004.
|
|
(5)
|
Incorporated by reference to the exhibit shown in parentheses included in the Registrant’s Current Report on Form 8-K for February 1, 2005.
|
|
(6)
|
Incorporated by reference to the exhibit shown in parentheses included in the Registrant’s Current Report on Form 8-K for February 24, 2005.
|
|
|
(7)
|
Incorporated by reference to the exhibit shown in parentheses included in the Registrant’s Current Report on Form 8-K for September 30, 2010.
|
|
|
(8)
|
Incorporated by reference to the exhibit shown in parentheses included in the Registrant’s Annual Report on Form 10-K for the fiscal year ended October 1, 2006.
|
|
|
(9)
|
Incorporated by reference to the exhibit shown in parentheses included in the Registrant’s Annual Report on Form 10-K for the fiscal year ended September 30, 2007.
|
|
|
(10)
|
Incorporated by reference to the exhibit shown in parentheses included in the Registrant’s Registration Statement on Form S-8 (Registration No. 333-127022).
|
|
|
(11)
|
Incorporated by reference to the exhibit shown in parentheses included in the Registrant’s Annual Report on Form 10-K for the fiscal year ended September 28, 2008.
|
|
|
(12)
|
Incorporated by reference to the exhibit shown in parentheses included in the Registrant’s Current Report on Form 8-K for April 9, 2009.
|
|
|
(13)
|
Incorporated by reference to the exhibit shown in parentheses included in the Registrant’s Current Report on Form 8-K for February 18, 2010.
|
|
|
(14)
|
Incorporated by reference to the exhibit shown in parentheses included in the Registrant’s Current Report on Form 8-K for November 4, 2010 filed on November 9, 2010.
|
|
|
(15)
|
Incorporated by reference to the exhibit shown in parentheses included in the Registrant’s Current Report on Form 8-K for November 11, 2010 filed on November 24, 2010.
|
|
|
(16)
|
Incorporated by reference to the exhibit shown in parentheses included in the Registrant’s Current Report on Form 8-K for January 13, 2011 filed on January 20, 2011.
|
|
|
(17)
|
Incorporated by reference to the exhibit shown in parentheses included in the Registrant’s Current Report on Form 8-K for May 16, 2011 filed on May 20, 2011.
|
|
|
(18)
|
Portions of this exhibit indicated by “***” have been omitted pursuant to the Company’s request for confidential treatment under Rule 24b-2 of the Securities Exchange Act of 1934, as amended, and the omitted material has been separately filed with the Securities and Exchange Commission.
|
(c) The following schedule is included herein:
Schedule II – Valuation and Qualifying Accounts and Reserves
Schedules for which provision is made in the applicable rules and regulations of the Commission and are not required under the related instructions or are inapplicable have been omitted.
SIGNATURES
Pursuant to the requirements of Section 13 or 15(d) of the Securities Exchange Act of 1934, the registrant has duly caused this report to be signed on its behalf by the undersigned, thereunto duly authorized.
|
By:
|
/s/ James Rudis
|
|
|
Name: James Rudis
|
||
|
Title: Chairman, President and Chief Executive Officer
|
||
|
Date: December 15, 2011
|
Pursuant to the requirements of the Securities Exchange Act of 1934, this report has been signed below by the following persons on behalf of the registrant and in the capacities and on the dates indicated.
|
Signature
|
Title
|
Date
|
||
|
/s/ James Rudis
James Rudis
|
Chairman of the Board of Directors, President and Chief Executive Officer (principal executive officer)
|
December 15, 2011
|
||
|
|
|
|||
|
/s/ Tracy E. Quinn
Tracy E. Quinn
|
Chief Financial Officer (principal financial and accounting officer)
|
December 15, 2011
|
||
|
|
|
|||
|
/s/ Alexander Auerbach
|
Director
|
December 15, 2011
|
||
|
Alexander Auerbach
|
||||
|
/s/ Harold Estes
|
Director
|
December 15, 2011
|
||
|
Harold Estes
|
||||
|
/s/ Geoffrey A. Gerard
|
Director
|
December 15, 2011
|
||
|
Geoffrey A. Gerard
|
||||
|
/s/ Alexander Rodetis, Jr.
|
Director
|
December 15, 2011
|
||
|
Alexander Rodetis, Jr.
|
OVERHILL FARMS, INC.
INDEX TO FINANCIAL STATEMENTS
|
Audited Financials Statements:
|
Page No.
|
|
Report of Independent Registered Public Accounting Firm
|
F-2
|
|
Balance Sheets as of October 2, 2011 and September 26, 2010
|
F-3
|
|
Statements of Income for the Years Ended October 2, 2011, September 26, 2010 and September 27, 2009
|
F-5
|
|
Statements of Stockholders’ Equity for the Years Ended October 2, 2011, September 26, 2010 and September 27, 2009
|
F-6
|
|
Statements of Cash Flows for the Years Ended October 2, 2011, September 26, 2010 and September 27, 2009
|
F-7
|
|
Notes to Financial Statements
|
F-8
|
|
Schedule II – Valuation and Qualifying Accounts and Reserves
|
F-21
|
REPORT OF INDEPENDENT REGISTERED PUBLIC ACCOUNTING FIRM
The Board of Directors and Stockholders of Overhill Farms, Inc.
We have audited the accompanying balance sheets of Overhill Farms, Inc. as of October 2, 2011 and September 26, 2010, and the related statements of income, stockholders’ equity, and cash flows for each of the three years in the period ended October 2, 2011. Our audits also included the financial statement schedule listed in the Index at Item 15(c). These financial statements and schedule are the responsibility of the Company’s management. Our responsibility is to express an opinion on these financial statements and schedule based on our audits.
We conducted our audits in accordance with the standards of the Public Company Accounting Oversight Board (United States). Those standards require that we plan and perform the audit to obtain reasonable assurance about whether the financial statements are free of material misstatement. We were not engaged to perform an audit of the Company's internal control over financial reporting. Our audits included consideration of internal control over financial reporting as a basis for designing audit procedures that are appropriate in the circumstances, but not for the purpose of expressing an opinion on the effectiveness of the Company's internal control over financial reporting. Accordingly, we express no such opinion. An audit also includes examining, on a test basis, evidence supporting the amounts and disclosures in the financial statements, assessing the accounting principles used and significant estimates made by management, and evaluating the overall financial statement presentation. We believe that our audits provide a reasonable basis for our opinion.
In our opinion, the financial statements referred to above present fairly, in all material respects, the financial position of Overhill Farms, Inc. at October 2, 2011 and September 26, 2010, and the results of its operations and its cash flows for each of the three years in the period ended October 2, 2011, in conformity with U.S. generally accepted accounting principles. Also, in our opinion, the related financial statement schedule, when considered in relation to the basic financial statements taken as a whole, presents fairly in all material respects the information set forth therein.
| /s/ ERNST & YOUNG LLP |
Los Angeles, California
December 15, 2011
OVERHILL FARMS, INC.
BALANCE SHEETS
Assets
|
|
October 2,
2011 |
September 26,
2010 |
||||||
|
|
|
|
||||||
|
Current assets:
|
|
|
||||||
|
Cash
|
$ | 5,470,362 | $ | 5,967,741 | ||||
|
Accounts receivable, net of allowance for doubtful accounts of $43,000 and zero in 2011 and 2010, respectively
|
13,700,034 | 14,121,600 | ||||||
|
Inventories
|
18,152,200 | 13,059,063 | ||||||
|
Prepaid expenses and other
|
2,013,222 | 1,611,049 | ||||||
|
Deferred income taxes
|
956,346 | 1,073,897 | ||||||
|
Total current assets
|
40,292,164 | 35,833,350 | ||||||
|
Property and equipment, at cost:
|
||||||||
|
Fixtures and equipment
|
25,981,572 | 25,041,914 | ||||||
|
Leasehold improvements
|
12,757,679 | 12,528,025 | ||||||
|
Automotive equipment
|
92,886 | 92,886 | ||||||
|
Property and equipment gross
|
38,832,137 | 37,662,825 | ||||||
|
Less accumulated depreciation and amortization
|
(25,686,444 | ) | (22,524,036 | ) | ||||
|
Total property and equipment
|
13,145,693 | 15,138,789 | ||||||
|
Other non-current assets:
|
||||||||
|
Goodwill
|
12,188,435 | 12,188,435 | ||||||
|
Deferred financing costs, net of accumulated amortization of $489,000 and $379,000 at October 2, 2011 and September 26, 2010, respectively
|
126,897 | 235,484 | ||||||
|
Other
|
1,556,656 | 2,381,261 | ||||||
|
Total other non-current assets
|
13,871,988 | 14,805,180 | ||||||
|
Total assets
|
$ | 67,309,845 | $ | 65,777,319 | ||||
The accompanying notes are an integral part
of these condensed financial statement
OVERHILL FARMS, INC.
BALANCE SHEETS (continued)
Liabilities and Stockholders’ Equity
|
|
October 2,
2011 |
September 26,
2010 |
||||||
|
|
|
|
||||||
|
Current liabilities:
|
|
|
||||||
|
Accounts payable
|
$ | 10,586,162 | $ | 8,203,803 | ||||
|
Accrued liabilities
|
3,820,199 | 3,248,436 | ||||||
|
Total current liabilities
|
14,406,361 | 11,452,239 | ||||||
|
Long-term accrued liabilities
|
616,890 | 536,730 | ||||||
|
Deferred tax liabilities
|
1,001,199 | 1,519,463 | ||||||
|
Long-term debt
|
10,772,647 | 13,197,647 | ||||||
|
Total liabilities
|
26,797,097 | 26,706,079 | ||||||
|
Stockholders’ equity:
|
||||||||
|
Preferred stock, $0.01 par value, authorized 50,000,000 shares, 4.43 designated as Series A Convertible Preferred Stock, 0 shares issued and outstanding
|
- | - | ||||||
|
Common stock, $0.01 par value, authorized 100,000,000 shares, 15,823,271 shares issued and outstanding at October 2, 2011 and September 26, 2010
|
158,233 | 158,233 | ||||||
|
Additional paid-in capital
|
11,558,479 | 11,558,479 | ||||||
|
Retained earnings
|
28,796,036 | 27,354,528 | ||||||
|
Total stockholders’ equity
|
40,512,748 | 39,071,240 | ||||||
|
Total liabilities and stockholders’ equity
|
$ | 67,309,845 | $ | 65,777,319 | ||||
The accompanying notes are an integral part
of these condensed financial statement
OVERHILL FARMS, INC.
STATEMENTS OF INCOME
|
|
For the Years Ended
|
|||||||||||
|
|
October 2,
|
September 26,
|
September 27,
|
|||||||||
|
|
2011
|
2010
|
2009
|
|||||||||
|
|
( 53 weeks)
|
( 52 weeks)
|
( 52 weeks)
|
|||||||||
|
|
|
|
|
|||||||||
|
Net revenues
|
$ | 169,218,474 | $ | 194,481,635 | $ | 209,877,039 | ||||||
|
Cost of sales
|
156,264,764 | 170,825,958 | 184,326,050 | |||||||||
|
Gross profit
|
12,953,710 | 23,655,677 | 25,550,989 | |||||||||
|
Selling, general and administrative expenses
|
10,352,586 | 9,730,674 | 9,971,692 | |||||||||
|
Operating income
|
2,601,124 | 13,925,003 | 15,579,297 | |||||||||
|
Interest expense:
|
||||||||||||
|
Interest expense
|
(224,866 | ) | (958,973 | ) | (1,873,574 | ) | ||||||
|
Amortization of debt discount and deferred financing costs
|
(109,704 | ) | (404,076 | ) | (406,016 | ) | ||||||
|
Debt extinguishment cost
|
- | (300,808 | ) | - | ||||||||
|
Total interest expense
|
(334,570 | ) | (1,663,857 | ) | (2,279,590 | ) | ||||||
|
Other expense
|
- | (3,991 | ) | - | ||||||||
|
Income before income taxes
|
2,266,554 | 12,257,155 | 13,299,707 | |||||||||
|
Income taxes
|
825,046 | 4,682,621 | 4,998,495 | |||||||||
|
Net income
|
$ | 1,441,508 | $ | 7,574,534 | $ | 8,301,212 | ||||||
|
Net income per share - basic
|
$ | 0.09 | $ | 0.48 | $ | 0.52 | ||||||
|
Weighted-average shares outstanding - basic
|
15,823,271 | 15,823,271 | 15,823,271 | |||||||||
|
Net income per share - diluted
|
$ | 0.09 | $ | 0.47 | $ | 0.52 | ||||||
|
Weighted-average shares outstanding - diluted
|
16,051,058 | 16,049,587 | 16,028,698 | |||||||||
The accompanying notes are an integral part
of these condensed financial statement
OVERHILL FARMS, INC.
STATEMENTS OF STOCKHOLDERS' EQUITY
|
|
Preferred Stock
|
Common Stock
|
Additional
Paid-In |
Retained
|
Accumulated
Other
Comprehensive |
|
||||||||||||||||||||||||||
|
|
Shares
|
Amount
|
Shares
|
Amount
|
Capital
|
Earnings
|
Loss
|
Total
|
||||||||||||||||||||||||
|
|
|
|
|
|
|
|
|
|
||||||||||||||||||||||||
|
Balance, September 28, 2008
|
- | $ | - | 15,823,271 | $ | 158,233 | $ | 11,558,479 | $ | 11,478,782 | $ | - | $ | 23,195,494 | ||||||||||||||||||
|
Comprehensive income:
|
||||||||||||||||||||||||||||||||
|
Net income
|
- | - | - | - | - | 8,301,212 | - | 8,301,212 | ||||||||||||||||||||||||
|
Total comprehensive income
|
8,301,212 | |||||||||||||||||||||||||||||||
|
Balance, September 27, 2009
|
- | - | 15,823,271 | 158,233 | 11,558,479 | 19,779,994 | - | 31,496,706 | ||||||||||||||||||||||||
|
Comprehensive income:
|
||||||||||||||||||||||||||||||||
|
Net income
|
- | - | - | - | - | 7,574,534 | - | 7,574,534 | ||||||||||||||||||||||||
|
Total comprehensive income
|
7,574,534 | |||||||||||||||||||||||||||||||
|
Balance, September 26, 2010
|
- | - | 15,823,271 | 158,233 | 11,558,479 | 27,354,528 | - | 39,071,240 | ||||||||||||||||||||||||
|
Comprehensive income:
|
||||||||||||||||||||||||||||||||
|
Net income
|
- | - | - | - | - | 1,441,508 | - | 1,441,508 | ||||||||||||||||||||||||
|
Total comprehensive income
|
1,441,508 | |||||||||||||||||||||||||||||||
|
Balance, October 02, 2011
|
- | $ | - | 15,823,271 | $ | 158,233 | $ | 11,558,479 | $ | 28,796,036 | $ | - | $ | 40,512,748 | ||||||||||||||||||
The accompanying notes are an integral part
of these condensed financial statement
OVERHILL FARMS, INC.
STATEMENTS OF CASH FLOWS
|
|
For the Years Ended
|
|||||||||||
|
|
October 2,
2011 |
September 26,
2010 |
September 27,
2009 |
|||||||||
|
|
|
|
|
|||||||||
|
Operating Activities:
|
|
|
|
|||||||||
|
Net income
|
$ | 1,441,508 | $ | 7,574,534 | $ | 8,301,212 | ||||||
|
Adjustments to reconcile net income to net cash provided by operating activities:
|
||||||||||||
|
Depreciation and amortization
|
4,216,353 | 3,999,687 | 3,455,560 | |||||||||
|
Amortization of debt discount and deferred financing costs
|
109,704 | 404,076 | 406,016 | |||||||||
|
Debt extinguishment cost
|
- | 300,808 | - | |||||||||
|
Loss (gain) on sale of property and equipment
|
- | 3,973 | (56,582 | ) | ||||||||
|
Recovery on recall products
|
- | (525,000 | ) | - | ||||||||
|
Provision (recovery) for doubtful accounts
|
43,402 | (15,000 | ) | 15,000 | ||||||||
|
Deferred income taxes
|
(400,713 | ) | (331,881 | ) | 270,503 | |||||||
|
Changes in:
|
||||||||||||
|
Accounts receivable
|
378,164 | 4,272,441 | 2,384,592 | |||||||||
|
Inventories
|
(5,093,137 | ) | 2,204,161 | 2,030,852 | ||||||||
|
Prepaid expenses and other assets
|
(402,602 | ) | 375,595 | (323,192 | ) | |||||||
|
Accounts payable
|
2,382,359 | (1,134,801 | ) | (1,839,082 | ) | |||||||
|
Accrued liabilities
|
571,763 | (191,490 | ) | 71,222 | ||||||||
|
Net cash provided by operating activities
|
3,246,801 | 16,937,103 | 14,716,101 | |||||||||
|
Investing Activities:
|
||||||||||||
|
Additions to property and equipment
|
(1,318,063 | ) | (1,828,703 | ) | (2,053,413 | ) | ||||||
|
Proceeds from sale of property and equipment
|
- | 637 | 61,980 | |||||||||
|
Acquisition of wastewater capacity units
|
- | - | (1,060,741 | ) | ||||||||
|
Net cash used in investing activities
|
(1,318,063 | ) | (1,828,066 | ) | (3,052,174 | ) | ||||||
|
Financing Activities:
|
||||||||||||
|
Borrowings under credit facility
|
3,100,000 | 13,197,647 | - | |||||||||
|
Principal payments on long-term debt
|
(5,525,000 | ) | - | - | ||||||||
|
Principal payments on previous credit facility
|
- | (27,275,028 | ) | (12,364,734 | ) | |||||||
|
Principal payments on equipment loans
|
- | (422,831 | ) | (227,052 | ) | |||||||
|
Principal payments on capital lease obligations
|
- | - | (279,422 | ) | ||||||||
|
Cash paid in association with previous financing arrangements
|
- | (71,379 | ) | - | ||||||||
|
Deferred financing costs
|
(1,117 | ) | - | - | ||||||||
|
Net cash used in financing activities
|
(2,426,117 | ) | (14,571,591 | ) | (12,871,208 | ) | ||||||
|
Net (decrease) increase in cash
|
(497,379 | ) | 537,446 | (1,207,281 | ) | |||||||
|
Cash at beginning of period
|
5,967,741 | 5,430,295 | 6,637,576 | |||||||||
|
Cash at end of period
|
$ | 5,470,362 | $ | 5,967,741 | $ | 5,430,295 | ||||||
|
Supplemental Schedule of Cash Flow Information:
|
||||||||||||
|
Cash paid during the period for:
|
||||||||||||
|
Interest
|
$ | 223,725 | $ | 1,060,037 | $ | 1,997,961 | ||||||
|
Income taxes
|
$ | 1,671,065 | $ | 4,803,946 | $ | 5,075,000 | ||||||
The accompanying notes are an integral part
of these condensed financial statement
OVERHILL FARMS, INC.
NOTES TO FINANCIAL STATEMENTS
October 2, 2011
|
1.
|
COMPANY AND ORGANIZATIONAL MATTERS
|
Nature of Business
Overhill Farms, Inc. (the “Company” or “Overhill Farms”) is a value-added manufacturer of high quality, prepared frozen food products for branded retail, private label, foodservice and airline customers. The Company’s product line includes entrées, plated meals, bulk-packed meal components, pastas, soups, sauces, poultry, meat and fish specialties, and organic and vegetarian offerings.
|
2.
|
SUMMARY OF SIGNIFICANT ACCOUNTING POLICIES
|
Fiscal Year
The Company utilizes a 52- to 53- week accounting period, which ends on the last Sunday of September in each fiscal year if September 30 does not fall on a Saturday, or October 1 if September 30 falls on a Saturday. The fiscal year ended October 2, 2011 was a 53-week period. September 26, 2010 and September 27, 2009 were 52-week periods.
Deferred Financing Costs and Debt Discount
Debt financing costs are deferred and amortized as additional interest expense over the term of the related debt. Deferred financing costs, net of accumulated amortization was $127,000 and $235,000 for fiscal years ended October 2, 2011 and September 26, 2010, respectively. Amortization of these costs totaled $110,000, $404,000 and $406,000 for the fiscal years ended October 2, 2011, September 26, 2010 and September 27, 2009, respectively. On September 24, 2010, the unamortized portions of the deferred financing costs ($18,000) and debt discount ($211,000) associated with the Guggenheim Corporate Funding, LLC (“GCF”) credit facility was written off in connection with the termination of the GCF facility.
Financial Instruments
The fair value of financial instruments is determined by reference to market data and by other valuation techniques as appropriate. The Company believes the carrying value of the debt approximates fair value at both October 2, 2011 and September 26, 2010, as the debt bears interest at variable rates based on prevailing market conditions. The fair values of other financial instruments approximate their recorded values due to their short-term nature.
Inventories
Inventories, which include material, labor, and manufacturing overhead, are stated at the lower of cost, using the first-in, first-out (“FIFO”) method, or market. The Company uses a standard costing system to estimate its FIFO cost of inventory at the end of each reporting period. Historically, standard costs have been materially consistent with actual costs. The Company periodically reviews its inventory for excess items, and writes it down based upon the age of specific items in inventory and the expected recovery from the disposition of the items.
The Company writes down its inventory for the estimated aged surplus, spoiled or damaged products, and discontinued items and components. The amount of the write-down is determined by analyzing inventory composition, expected usage, historical and projected sales information, and other factors. Changes in sales volume due to unexpected economic or competitive conditions are among the factors that could result in material increases to the write-down of the Company’s inventory.
Inventory write-offs were $835,000, $487,000 and $720,000 for fiscal years 2011, 2010 and 2009, respectively.
The Company classifies costs related to shipping as cost of sales in the accompanying statements of income.
Property and Equipment
The cost of property and equipment is depreciated over the estimated useful lives of the related assets, which range from three to ten years. Leasehold improvements to the Company’s Plant No.1 in Vernon, California are amortized over the lesser of the initial lease term plus one lease extension period, initially totaling 15 years, or the estimated useful life of the assets. Other leasehold improvements are amortized over the lesser of the term of the related lease or the estimated useful lives of the assets. Depreciation is generally computed using the straight-line method. Depreciation expense was $3.3 million, $3.5 million and $3.2 million for fiscal years 2011, 2010 and 2009, respectively.
Expenditures for maintenance and repairs are charged to expense as incurred. The cost of materials purchased and labor expended in betterments and major renewals are capitalized. The fixtures and equipment balances included $1.8 million and $1.4 million of construction in process at October 2, 2011 and September 26, 2010, respectively. Costs and related accumulated depreciation of properties sold or otherwise retired are eliminated from the accounts, and gains or losses on disposals are included in operating income.
Licensing Fee
During fiscal year 2008, the Company entered into a five-year licensing agreement (with two renewable five-year terms) with Better Living Brands tm Alliance (“Alliance”) for the exclusive right to produce and sell frozen entrées under the Eating Right tm and O Organics tm brands. The Company agreed to pay a one-time $1.25 million licensing fee that it is amortizing over five years.
Long-lived assets, subject to amortization, are reviewed for impairment whenever events or changes in circumstances indicate that the carrying amount of an asset may not be recoverable. Recoverability of assets to be held and used is measured by a comparison of the carrying amount of an asset to the estimated undiscounted future cash flows expected to be generated by an asset. If the carrying amount of an asset exceeds its estimated future cash flows, an impairment charge is recognized in the amount by which the carrying amount of the asset exceeds the estimated fair value, which is determined based on discounted future cash flows. The impairment loss calculation requires management to apply judgment in estimating future cash flows and the discount rates that reflect the risk inherent in future cash flows. The estimated cash flows used for this non-recurring fair value measurement is considered level 3 as defined in Note 12. During the fourth quarter of fiscal year 2011, the Alliance did not generate revenues consistent with that of prior periods, and it was determined that any future revenues were no longer estimable. As such, an impairment indicator is deemed to exist related to the Alliance licensing fee. The impairment charge of $412,000 is recorded as a selling expense in the statement of income for the year ended October 2, 2011. For the fiscal years 2011, 2010 and 2009, amortization expense, including the impairment charge, related to the licensing fee was $679,000, $261,000 and $226,000, respectively.
On November 4, 2010, the Company entered into a five-year licensing agreement with Boston Market Corporation (“BMC”) for the exclusive right to use BMC’s trademarks, trade dress and copyrights in connection with the manufacturing, advertising, promotion, sales and distribution of frozen food and certain shelf-stable licensed products. The agreement commenced on July 1, 2011. The agreement also contains options for two five-year renewal terms. The Company will pay BMC an earned royalty computed at four and a half percent of net sales during the initial term and a guaranteed minimum royalty of $2.75 million and $3.25 million for the first and second renewal terms, respectively. For fiscal year 2011, royalty expense was $354,000.
Goodwill
Goodwill is evaluated at least annually for impairment. The Company has one reporting unit and estimates fair value based upon a variety of factors, including discounted cash flow analysis, market capitalization and other market-based information. The Company performed its evaluation of goodwill for impairment as of October 2, 2011, which indicated that goodwill was not impaired.
Stock Options
The Company measures the cost of all employee stock-based compensation awards based on the grant date fair value of those awards using a Black-Scholes model and records that cost as compensation expense over the period during which the employee is required to perform service in exchange for the award (generally over the vesting period of the award). No options were granted or vested during fiscal years 2011, 2010 or 2009. Therefore, there was no impact on the income statement or cash flow statement as a result of stock-based compensation for any of these fiscal periods.
Revenue Recognition
The Company’s revenues arise from one business segment – the development and manufacture of frozen food products. Revenues are recognized when products are shipped and customer takes title and assumes risk of loss, collection of the relevant receivable is reasonably assured, pervasive evidence of an arrangement exists, and the sales price is fixed or determinable. The Company provides for estimated returns and allowances, which have historically been immaterial, at the time of sale. Shipping and handling revenues are included as a component of net revenue.
The Company classifies customer rebate costs and slotting fees as a reduction in net revenues. Customer rebate costs and slotting fees were $3.9 million ($2.8 million attributable to Boston Market products), $650,000 and $650,000 for fiscal years 2011, 2010 and 2009, respectively.
Income Taxes
The Company uses the asset and liability method of accounting for income taxes. Under this method, deferred income taxes are recognized for the future tax consequences attributable to differences between the financial statement carrying amounts of existing assets and liabilities and their respective tax bases. Deferred tax assets and liabilities are measured using enacted tax rates expected to be applied to taxable income in the years in which those temporary differences are expected to be recovered or settled. The effect on deferred taxes of a change in tax rates is recognized in income in the period that includes the enactment date.
The Company accounts for uncertainty in income taxes in accordance with authoritative guidance, which prescribes a recognition threshold and measurement attribute for the financial statement recognition and measurement of a tax position taken or expected to be taken in a tax return. It also provides guidance on derecognition, classification, interest and penalties, accounting for interim periods, disclosure, and transition. During the current fiscal year, the Company recorded no increase in the liability for unrecognized tax benefits, and the balance of unrecognized tax benefits was zero at October 2, 2011 and September 26, 2010.
The tax years 2008 through 2010 remain open to examination by the major tax jurisdictions to which the Company is subject.
The Company has also adopted the accounting policy that interest and penalties recognized are classified as part of income taxes. No interest and penalties were recognized in the statement of income for fiscal years 2011, 2010 and 2009.
The Company does not anticipate any significant change within twelve months of this reporting date of its uncertain tax positions.
Asset Retirement Obligations
The Company records liabilities related to asset retirement obligations in the period in which they are incurred and measures them at the net present value of the future estimated cost. The offset to the liability is capitalized as part of the carrying amount of the related long-lived asset. Changes in the liability due to the passage of time are recognized over the operating term in the income statement in cost of sales.
Recent Accounting Pronouncements
In September 2011, the Financial Accounting Standard Board (“FASB”) issued an update to its authoritative guidance regarding the methods used to test goodwill for impairment. The amendment allows the option to first assess qualitative factors to determine whether it is necessary to perform the two-step quantitative goodwill impairment test currently required. Under that option, an entity would no longer be required to calculate the fair value of a reporting unit unless the entity determines, based on that qualitative assessment, that it is more likely than not that its fair value is less than its carrying amount. If an entity concludes otherwise, then it must perform the two-step impairment test currently required. The Company will adopt this guidance commencing in fiscal 2013, effective October 1, 2012, and apply it prospectively.
In June 2011, the FASB issued authoritative guidance that revised its requirements related to the presentation of comprehensive income. This guidance eliminates the option to present components of other comprehensive (“OCI”) as part of the consolidated statement of equity. It requires presentation of comprehensive income, the components of net income, and the components of other comprehensive income either in a single continuous statement of comprehensive income or in two separate but consecutive statements. The Company will adopt this guidance commencing in fiscal 2013, effective October 1, 2012, and apply it retrospectively.
In May 2011, the FASB issued an update to its authoritative guidance regarding fair value measurements to clarify disclosure requirements and improve comparability. Additional disclosure requirements include: (a) for level 3 fair value measurements, quantitative information about significant unobservable inputs used, qualitative information about the sensitivity of the measurements to change in the unobservable inputs disclosed including the interrelationship between inputs, and a description of the Company’s valuation processes; (b) all, not just significant, transfers between level 1 and 2 of the fair value hierarchy; (c) the reason why, if applicable, the current use of a nonfinancial asset measured at fair value differs from its highest and best use; (d) the categorization in the fair value hierarchy for financial instruments not measured at fair value but for which disclosure of fair value is required. The Company will adopt this guidance commencing in the second quarter of fiscal 2012, effective January 2, 2012, and apply it retrospectively.
Reclassifications
Certain prior year amounts have been reclassified to conform to the current period presentation.
Use of Estimates
The preparation of financial statements in conformity with U.S. generally accepted accounting principles requires management to make estimates and assumptions that affect the amounts reported in the financial statements and accompanying notes. Actual results could differ materially from those estimates.
|
3.
|
RELATED PARTY TRANSACTIONS
|
In February 2004, the Company engaged Alexander Auerbach & Co., Inc. (“AAPR”) to provide the Company with public relations and marketing services. AAPR provides public relations, media relations and communications marketing services to support the Company’s sales activities. Alexander Auerbach, who is a director and stockholder of the Company, is a stockholder, director and officer of AAPR. The Company paid to AAPR $67,000, $47,000 and $51,000 for services rendered under this engagement during fiscal years 2011, 2010 and 2009, respectively. These fees totaled more than 5% of AAPR’s gross revenues for its fiscal years ended January 31, 2011, 2010 and 2009, respectively.
|
4.
|
INVENTORIES
|
Inventories are summarized as follows:
| October 2,
2011
|
September 26,
2010 |
|||||||
|
|
|
|
||||||
|
Raw ingredients
|
$ | 5,874,813 | $ | 5,223,444 | ||||
|
Finished product
|
10,312,375 | 6,225,935 | ||||||
|
Packaging
|
1,965,012 | 1,609,684 | ||||||
|
|
$ | 18,152,200 | $ | 13,059,063 | ||||
|
5.
|
LONG-TERM DEBT
|
Long-term debt of the Company is summarized as follows:
| October 2,
2011
|
September 26,
2010
|
|||||||
|
|
|
|
||||||
|
Bank of America Revolver
|
$ | 10,772,647 | $ | 13,197,647 | ||||
|
|
$ | 10,772,647 | $ | 13,197,647 | ||||
The Company executed a senior secured credit agreement with Bank of America on September 24, 2010. The facility is structured as a $30 million three-year senior secured revolving credit facility, secured by a first priority lien on substantially all the Company’s assets. The Company made an initial loan drawdown of $13.2 million on September 24, 2010, which was used to pay off the Company’s prior credit facility. Under the Bank of America facility the Company has the ability to increase the aggregate amount of the financing by $20 million under certain conditions.
The Bank of America facility bears annual interest at the British Bankers Association LIBOR Rate, or LIBOR, plus an applicable margin (listed below). The margin was initially 1.75%. Beginning on January 1, 2011, and adjusted quarterly thereafter, the margin is calculated as follows:
|
Ratio of aggregate outstanding funded
commitments under the facility (including letter
of credit obligations) to EBITDA for the
preceding four quarters
|
Applicable Margin
|
||
|
Greater than or equal to 1.50:1
|
2.00% | ||
|
|
|||
|
Greater than or equal to 0.50:1
but less than 1.50:1
|
1.75% | ||
|
|
|||
|
Less than 0.50:1
|
1.50% |
At October 2, 2011, there was $10.8 million outstanding under the Bank of America facility with an applicable interest rate of 1.9%. In addition, the Company paid an unused fee equal to 0.25% per annum. For fiscal year 2011, the Company incurred $225,000 in interest expense, excluding amortization of deferred financing costs. During fiscal year 2011, the Company reduced the outstanding balance of the facility by $2.4 million ($5.5 million in voluntary payments offset by $3.1 million in new borrowing). As of October 2, 2011, the Company had $19.2 million available to borrow under the new credit facility.
Initial proceeds from the Bank of America facility, received September 24, 2010, were used to repay approximately $13.2 million in existing debt in connection with the termination of the Company’s former financing arrangements.
The Bank of America facility contains covenants whereby, among other things, the Company is required to maintain compliance with agreed levels of fixed charge coverage and total leverage. The facility also contains customary restrictions on incurring indebtedness and liens, making investments and paying dividends. At October 2, 2011, the Company was in compliance with all covenants.
The Company previously executed a senior secured credit agreement with Guggenheim Corporate Funding, LLC (“GCF”) on April 17, 2006. Under the credit agreement, GCF acted as collateral agent, administrative agent, arranger and syndication agent in connection with loans made by various lenders, including affiliates of GCF. The facility was originally structured as a $7.5 million non-amortizing revolving loan, a $25.0 million amortizing Tranche A Term Loan and a $15.0 million non-amortizing Tranche B Term Loan. On March 9, 2007, the Company executed a second amendment to the senior secured credit agreement allowing for $7.0 million of additional capital expenditures to facilitate new business by increasing plant capacity and improving line efficiency, to be funded by increases of $3.5 million in each of the Tranche A and Tranche B Term Loans. As of September 27, 2009, the facility was structured as a $7.5 million non-amortizing revolving loan, a $26.5 million amortizing Tranche A Term Loan and a $15.7 million non-amortizing Tranche B Term Loan. At September 27, 2009, interest rates on the Tranche A Term Loans and Tranche B Term Loans were 3.5% and 6.0%, respectively. The GCF facility was paid off on September 24, 2010 with the initial proceeds from the Bank of America facility. For fiscal year 2010, the Company incurred $959,000 in interest expense, excluding amortization of deferred financing cost.
The Company entered into the following amortizing loans with Key Bank to finance the purchase of machinery used for manufacturing processes: a 5-year loan in the principal amount of $324,000 at a fixed interest rate of 7.5% on September 21, 2006, a 5-year loan in the principal amount of $216,617 at a fixed interest rate of 7.5% on November 27, 2006 and a 4-year loan in the principal amount of $476,043 at a fixed interest rate of 7.5% on January 9, 2007. On February 4, 2010, the Company repaid the balance of all three equipment loans.
The Company amended their existing operating lease agreements related to certain manufacturing equipment with General Electric Capital Corporation on October 2, 2006. The amended lease resulted in a three-year capital lease in the principal amount of $842,168 at a fixed interest rate of 8.15%, with a $1 bargain purchase option at the expiration of the lease. The assets acquired under this capital lease have an acquisition cost of $911,647. On September 2, 2009, the Company purchased the manufacturing equipment from General Electric Capital Corporation. As of October 2, 2011 the net book value of the assets was $129,000.
Mandatory payments on the Company’s long-term debt as of October 2, 2011 were as follows:
|
2011
|
$ | - | ||
|
2012
|
- | |||
|
2013
|
10,772,647 | |||
|
Total payments
|
$ | 10,772,647 |
|
6.
|
STOCKHOLDERS' EQUITY
|
Stock Options
The Company adopted stock option plans in October 2002 and May 2005. The Company reserved 800,000 and 550,000 shares of common stock under the plans adopted in October 2002 and May 2005, respectively, for the issuance to eligible directors and employees of, and consultants to, the Company under the plans. The plans provide for the grant of both incentive stock options (at exercise prices no less than fair value at the date of grant) and non-qualified stock options (at exercise prices as determined by the Company’s Compensation Committee). Such options may be exercisable as determined by such Committee. The plans expire ten years following their adoption.
A summary of the Company’s stock option activity and related information follows:
|
|
For the Fiscal Years Ended
|
|||||||||||||||||||||||
|
|
October 2,
|
September 26,
|
September 27,
|
|||||||||||||||||||||
|
|
2011
|
2010
|
2009
|
|||||||||||||||||||||
|
|
Options
|
Weighted-
Average |
Options
|
Weighted-
Average |
Options
|
Weighted-
Average |
||||||||||||||||||
|
Outstanding at beginning of year
|
521,000 | $ | 1.61 | 521,000 | $ | 1.61 | 521,000 | $ | 1.61 | |||||||||||||||
|
Outstanding at end of year
|
521,000 | $ | 1.61 | 521,000 | $ | 1.61 | 521,000 | $ | 1.61 | |||||||||||||||
|
Exercisable at end of year
|
521,000 | $ | 1.61 | 521,000 | $ | 1.61 | 521,000 | $ | 1.61 | |||||||||||||||
Exercise prices for the 521,000 options outstanding as of October 2, 2011 ranged from $1.47 to $2.50. The weighted-average remaining contractual life of those options is 1.9 years. The following table summarizes information about stock options outstanding as of October 2, 2011:
|
|
Options Outstanding
|
Options Exercisable
|
|||||||||||||||||||||||||||
|
|
Number
Outstanding |
Weighted-
Average |
Weighted -
Average |
Aggregate
Intrinsic |
Number
Exercisable |
Weighted-
Average |
Aggregate
Intrinsic |
||||||||||||||||||||||
| $ | 2.50 | 18,004 | 3.3 | $ | 2.50 | $ | 21,605 | 18,004 | $ | 2.50 | $ | 21,605 | |||||||||||||||||
| $ | 2.00 | 18,004 | 3.3 | $ | 2.00 | $ | 30,607 | 18,004 | $ | 2.00 | $ | 30,607 | |||||||||||||||||
| $ | 1.60 | 322,000 | 1.0 | $ | 1.60 | $ | 676,200 | 322,000 | $ | 1.60 | $ | 676,200 | |||||||||||||||||
| $ | 1.50 | 18,004 | 3.3 | $ | 1.50 | $ | 39,609 | 18,004 | $ | 1.50 | $ | 39,609 | |||||||||||||||||
| $ | 1.47 | 144,988 | 3.3 | $ | 1.47 | $ | 323,323 | 144,988 | $ | 1.47 | $ | 323,323 | |||||||||||||||||
| $ | 1.47 - 2.50 | 521,000 | 1.9 | $ | 1.61 | $ | 1,091,344 | 521,000 | $ | 1.61 | $ | 1,091,344 | |||||||||||||||||
|
(1)
|
Based on the last reported sale price of the Company’s common stock of $3.70 on September 30, 2011 (the last trading day of fiscal year 2011).
|
|
7.
|
NET INCOME PER SHARE
|
The following table sets forth the calculation of income per share (“EPS”) for the periods presented:
|
For the Fiscal Years Ended
|
||||||||||||
|
|
October 2,
2011 |
September 26,
2010 |
September 27,
2009 |
|||||||||
|
|
|
|
|
|||||||||
|
Basic EPS Computation:
|
|
|
|
|||||||||
|
Numerator:
|
|
|
|
|||||||||
|
Net income
|
$ | 1,441,508 | $ | 7,574,534 | $ | 8,301,212 | ||||||
|
Denominator:
|
||||||||||||
|
Weighted-average common shares outstanding
|
15,823,271 | 15,823,271 | 15,823,271 | |||||||||
|
Total shares
|
15,823,271 | 15,823,271 | 15,823,271 | |||||||||
|
Basic EPS
|
$ | 0.09 | $ | 0.48 | $ | 0.52 | ||||||
|
Diluted EPS Computation:
|
||||||||||||
|
Numerator:
|
||||||||||||
|
Net income
|
$ | 1,441,508 | $ | 7,574,534 | $ | 8,301,212 | ||||||
|
Denominator:
|
||||||||||||
|
Weighted-average common shares outstanding
|
15,823,271 | 15,823,271 | 15,823,271 | |||||||||
|
Incremental shares from assumed conversion of preferred stock and exercise of stock option and warrants
|
227,787 | 226,316 | 205,427 | |||||||||
|
Total shares
|
16,051,058 | 16,049,587 | 16,028,698 | |||||||||
|
Diluted EPS
|
$ | 0.09 | $ | 0.47 | $ | 0.52 | ||||||
|
8.
|
ACCRUED LIABILITIES
|
Accrued liabilities consisted of the following:
|
|
October 2,
2011 |
September 26,
2010 |
||||||
|
|
|
|
||||||
|
Compensation
|
$ | 2,617,533 | $ | 2,289,598 | ||||
|
Taxes other than income taxes
|
36,068 | 53,244 | ||||||
|
Interest
|
1,141 | - | ||||||
|
Long-term accrued liabilities
|
616,890 | 536,730 | ||||||
|
Royalty
|
405,827 | - | ||||||
|
Other
|
759,630 | 905,594 | ||||||
|
|
$ | 4,437,089 | $ | 3,785,166 | ||||
|
9.
|
INCOME TAXES
|
Income tax provision consisted of the following:
|
|
For the Fiscal Years Ended
|
|||||||||||
|
|
October 2,
2011 |
September 26,
2010 |
September 27,
2009 |
|||||||||
|
Current:
|
|
|
|
|||||||||
|
Federal
|
$ | 829,699 | $ | 3,843,948 | $ | 3,515,271 | ||||||
|
State
|
396,058 | 1,170,554 | 1,212,721 | |||||||||
|
Total current
|
1,225,757 | 5,014,502 | 4,727,992 | |||||||||
|
|
||||||||||||
|
Deferred:
|
||||||||||||
|
Federal
|
(206,922 | ) | (257,245 | ) | 303,322 | |||||||
|
State
|
(193,789 | ) | (74,636 | ) | (32,819 | ) | ||||||
|
Total deferred
|
(400,711 | ) | (331,881 | ) | 270,503 | |||||||
|
|
||||||||||||
|
Total income tax provision
|
$ | 825,046 | $ | 4,682,621 | $ | 4,998,495 | ||||||
The total income tax provision was 36.4%, 38.2% and 37.6% of pretax income for fiscal years 2011, 2010 and 2009, respectively. A reconciliation of income taxes with the amounts computed at the statutory federal rate follows:
|
For the Fiscal Years Ended
|
||||||||||||
|
|
October 2,
2011 |
September 26,
2010 |
September 27,
2009 |
|||||||||
|
|
|
|
|
|||||||||
|
Computed tax provision at federal statutory rate (35%)
|
$ | 793,294 | $ | 4,290,004 | $ | 4,654,897 | ||||||
|
State income tax provision, net of federal benefit
|
131,475 | 712,347 | 766,936 | |||||||||
|
Permanent items
|
(77,412 | ) | (220,193 | ) | (232,879 | ) | ||||||
|
Other
|
(22,311 | ) | (99,537 | ) | (190,459 | ) | ||||||
|
|
$ | 825,046 | $ | 4,682,621 | $ | 4,998,495 | ||||||
The deferred tax assets and deferred tax liabilities recorded on the balance sheet are as follows:
|
|
October 2,
2011 |
September 26,
2010 |
||||||||||||||
|
|
Deferred
Tax |
Deferred
Tax |
Deferred
Tax |
Deferred
Tax |
||||||||||||
|
Current:
|
|
|
|
|
||||||||||||
|
Inventory and accounts receivable
|
$ | 367,189 | $ | - | $ | 258,411 | $ | - | ||||||||
|
Accrued liabilities
|
831,229 | - | 1,045,996 | - | ||||||||||||
|
Prepaid expenses
|
- | (242,072 | ) | - | (230,510 | ) | ||||||||||
| 1,198,418 | (242,072 | ) | 1,304,407 | (230,510 | ) | |||||||||||
|
Noncurrent:
|
||||||||||||||||
|
Deposits and deferrals
|
$ | 227,243 | $ | - | $ | 220,680 | $ | - | ||||||||
|
Depreciation
|
891,699 | - | 627,200 | - | ||||||||||||
|
Amortization
|
387,037 | - | 113,638 | - | ||||||||||||
|
Goodwill
|
- | (2,735,828 | ) | - | (2,676,969 | ) | ||||||||||
|
Accrued liabilities
|
251,356 | - | 218,696 | - | ||||||||||||
|
Valuation allowance
|
(20,964 | ) | - | (20,964 | ) | - | ||||||||||
|
Other
|
- | (1,742 | ) | - | (1,744 | ) | ||||||||||
| 1,736,371 | (2,737,570 | ) | 1,159,250 | (2,678,713 | ) | |||||||||||
|
Total deferred taxes net of valuation allowance
|
$ | 2,934,789 | $ | (2,979,642 | ) | $ | 2,463,657 | $ | (2,909,223 | ) | ||||||
As of October 2, 2011, the Company had no net operating losses or alternative minimum tax credits available for carryforward for federal tax purposes.
|
10.
|
COMMITMENTS AND CONTINGENCIES
|
Commitments
The Company enters into monthly and long-term leases. Future minimum lease payments for all long-term operating leases, including facilities and equipment, at October 2, 2011 were as follows:
|
2012
|
$ | 2,718,761 | ||
|
2013
|
2,495,174 | |||
|
2014
|
1,461,982 | |||
|
2015
|
1,143,867 | |||
|
2016 and thereafter
|
1,142,934 | |||
|
|
$ | 8,962,718 |
The Company leases its facilities, both Plant No. 1 and Plant No. 2, under operating leases expiring through September 30, 2016, and expiring December 2013, with an option for a 60-month extension, respectively. Both facilities operate in Vernon, California. Certain of the other leases provide for renewal options at substantially the same terms as the current leases.
The Company’s lease of its primary operating facility requires the premises to be restored to its original condition upon the termination of the lease. Accordingly, the Company has recorded a liability of $617,000 and $537,000 representing the present value of the estimated restoration costs at October 2, 2011 and September 26, 2010, respectively. The corresponding asset is being depreciated over 13 years, and the present value of the liability is being accreted over the term in order to establish a reserve at the end of the lease equal to the refurbishment costs.
Certain of the Company’s equipment leases provide for declining annual rental amounts. Rent expense is recorded on a straight-line basis over the term of the lease. Accordingly, deferred rent is recorded in the accompanying balance sheets in other assets as the difference between rent expense and amounts paid under the terms of the lease agreements.
Rent expense, including monthly equipment rentals, was approximately $2.6 million, $2.8 million and $2.7 million, for fiscal years 2011, 2010 and 2009, respectively.
The Company maintains an employment agreement with its Chief Executive Officer, James Rudis. Mr. Rudis’ employment agreement expires on December 31, 2011. After the initial term, the relationship will be at-will and may be terminated by us at any time or by Mr. Rudis upon at least 60 days’ written notice. The value of the remaining compensation obligations under Mr. Rudis’ existing employment agreement as of October 2, 2011 was $128,464.
The Company’s open purchase orders for raw materials and contractual obligations to purchase raw protein in the year subsequent to October 2, 2011 totals $20.7 million.
Contingencies
The Company is involved in certain legal actions and claims arising in the ordinary course of business. Management believes (based, in part, on advice of legal counsel) that such contingencies, including the matters described below, will be resolved without materially and adversely affecting the Company’s financial position, results of operations or cash flows. The Company intends to vigorously contest all claims and grievances described below.
Overhill Farms v. Larry (Nativo) Lopez, et al.
On June 30, 2009, the Company filed a lawsuit against Nativo Lopez and six other leaders of what the Company believes to be an unlawful campaign to force the Company to continue the employment of workers who had used invalid social security numbers to hide their illegal work status. Among other things, the Company alleges that the defendants defamed the Company by calling its actions “racist” and unlawful. The Company has asserted claims for defamation, extortion, intentional interference with prospective economic advantage, and intentional interference with contractual relations. The Company filed the lawsuit in Orange County, California, and seek damages and an injunction barring the defendants from continuing their conduct.
All of the named defendants tried unsuccessfully to dismiss the action. In refusing to dismiss the case, the court ruled on November 13, 2009, that the Company had established a probability of prevailing on the merits, and that the Company had submitted substantial evidence that the defendants’ accusations of racism were not true. The defendants thereafter filed an appeal, which was denied by the California court of appeals. The defendants petitioned for review by the California Supreme Court, which denied review on March 2, 2011. The action has returned to the trial court for further proceedings.
Five of the six defendants have now agreed to withdraw their defamatory statements. They also agreed to a permanent injunction prohibiting them from publishing the defamatory statements they made against the Company. They further agreed to withdraw from and opt-out of any claims asserted on their behalf in the Agustiana case described below. Based on these agreements, the Company has dismissed its claims against these five defendants. The Company continues to press its claims against the defendant Nativo Lopez, and the case is scheduled for trial in early 2012.
Agustiana, et al. v. Overhill Farms.
On July 1, 2009, Bohemia Agustiana, Isela Hernandez, and Ana Munoz filed a purported “class action” against the Company in which they asserted claims for failure to pay minimum wage, failure to furnish wage and hour statements, waiting time penalties, conversion and unfair business practices. The plaintiffs are former employees who had been terminated one month earlier because they had used invalid social security numbers in connection with their employment with the Company. They filed the case in Los Angeles County on behalf of themselves and a class which they say includes all non-exempt production and quality control workers who were employed in California during the four-year period prior to filing their complaint. The plaintiffs seek unspecified damages, restitution, injunctive relief, attorneys’ fees and costs.
The Company filed a motion to dismiss the conversion claim, and the motion was granted by the court on February 2, 2010.
On May 12, 2010, Alma Salinas filed a separate purported “class action” in Los Angeles County Superior Court against the Company in which she asserted claims on behalf of herself and all other similarly situated current and former production workers for failure to provide meal periods, failure to provide rest periods, failure to pay minimum wage, failure to make payments within the required time, unfair business practice in violation of Section 17200 of the California Business and Professions Code and Labor Code Section 2698 (known as the Private Attorney General Act (“PAGA”)). Salinas is a former employee who had been terminated because she had used an invalid social security number in connection with her employment with the Company. Salinas sought allegedly unpaid wages, waiting time penalties, PAGA penalties, interest and attorneys’ fees, the amounts of which are unspecified. The Salinas action has been consolidated with the Agustiana action.
In about September 2011, plaintiffs Agustiana and Salinas agreed to voluntarily dismiss and waive all of their claims against the Company. They also agreed to abandon their allegations that they could represent any other employees in the alleged class. The Company did not pay them any additional wages or money.
One former employee remains as a plaintiff, Isela Hernandez. She has not requested the court to certify her as a class representative, and no class has been certified. The Company has asked the court to disqualify this remaining plaintiff as a class representative, and her attorneys have asked the court to add four former employees as plaintiffs and potential class representatives. These pending motions are scheduled for hearing on December 21, 2011. Three of the four proposed new plaintiffs are former employees that the Company terminated one month before this case was filed because they had used invalid social security numbers in connection with their employment with the Company. The fourth proposed plaintiff has not worked for the Company since February 2007.
The parties are engaged in the discovery phase of the case, and the court has scheduled a class certification hearing date for April 2012. The Company believes it has valid defenses to the plaintiff’s remaining claims and that it paid all wages due to these employees.
Concentrations of Credit Risk
The Company’s financial instruments that are exposed to concentrations of credit risk consist primarily of trade receivables. The Company performs on-going credit evaluations of each customer’s financial condition and generally requires no collateral from its customers. The Company charges off uncollectible accounts at the point in time when no recovery is expected.
Receivables related to Panda Restaurant Group, Inc. (through its distributors), Jenny Craig, Inc., Safeway Inc. and Bellisio Foods, Inc. accounted for approximately 28%, 22%, 17% and 17% respectively of the Company’s total accounts receivable balance at October 2, 2011 and approximately 29%, 24%, 17% and zero respectively, of the Company’s total accounts receivable balance at September 26, 2010.
Significant Customers
Significant customers accounted for the following percentages of the Company’s revenues:
|
Net Revenues
|
||||||||||||
|
|
|
|
|
|||||||||
|
|
October 2,
|
September 26,
|
September 27,
|
|||||||||
|
Customer
|
2011
|
2010
|
2009
|
|||||||||
|
Jenny Craig, Inc.
|
29 | % | 28 | % | 27 | % | ||||||
|
Panda Restaurant Group, Inc.
|
26 | % | 27 | % | 22 | % | ||||||
|
Safeway Inc.
|
16 | % | 18 | % | 17 | % | ||||||
Concentration of Sources of Labor
The Company’s total hourly and salaried workforce consisted of approximately 736 employees at October 2, 2011. Approximately 78% of the Company’s workforce is covered by a two-year collective bargaining agreement that was ratified by the union on August 7, 2011.
|
11.
|
EMPLOYEE BENEFIT PLANS
|
In April 1997, Overhill Farms introduced a retirement savings plan under Section 401(k) of the Internal Revenue Code. The plan covers substantially all non-union employees meeting minimum service requirements.
Effective March 1, 2005, Overhill Farms executed a new three-year contract with the UFCW Union, Local 770, that eliminated the need for a previous provision in its 401(k) plan established in January 2002 for its union employees that required an annual contribution to be made by the Company in the event that revenues exceeded specific thresholds. On January 1, 2009, the Company merged the union and non-union 401(k) plans into a single plan.
Employees voluntarily make contributions into the new plan. The Company does not provide for a match to the employees’ contributions, and expenses related to the plans have not been significant. The Company’s 2010 bonus program permitted a discretionary bonus equal to 3% of non-union employees’ gross W-2 earnings in the form of a 401(k) contribution. The total contribution under the 2010 bonus program of $324,000 was made during calendar year 2011. The Company’s 2011 bonus program permits a discretionary bonus equal to 3% of non-union employees’ gross W-2 earnings in the form of a 401(k) contribution to be made during fiscal year 2012.
|
12.
|
FINANCIAL INSTRUMENTS
|
Authoritative guidance defines fair value as the price that would be received to sell an asset or paid to transfer a liability in an orderly transaction between market participants at the measurement date. The guidance establishes a fair value hierarchy, which prioritizes the inputs used in measuring fair value into three broad levels as follows:
Level 1 - Inputs are unadjusted quoted prices in active markets for identical assets or liabilities that can be accessed at the measurement date.
Level 2 - Inputs include quoted prices for similar assets and liabilities in active markets, quoted prices for identical or similar assets or liabilities in markets that are not active, inputs other than quoted prices that are observable for the asset or liability (i.e., interest rates, yield curves, etc.), and inputs that are derived principally from or corroborated by observable market data by correlation or other means (market corroborated inputs).
Level 3 - Unobservable inputs that reflect assumptions about what market participants would use in pricing the asset or liability. These inputs would be based on the best information available, including the Company’s own data.
The carrying amount of the Company’s financial instruments, which are not marked to fair value at each reportable date and principally include trade receivables and accounts payable, approximate fair value due to the relatively short maturity of such instruments. The Company believes the carrying value of the debt approximates the fair value at both October 2, 2011 and September 26, 2010, as the debt bears interest at variable rates based on prevailing market conditions. As of October 2, 2011, the carrying value of all financial instruments was not materially different from fair value, as the interest rates on variable rate debt approximated rates currently available to the Company.
Long-lived assets, such as property, plant, and equipment, and purchased intangibles that are subject to amortization, are reviewed for impairment whenever events or changes in circumstances indicate that the carrying amount of an asset may not be recoverable. The recoverability of assets that are to be held and used is measured by a comparison of the carrying amount of an asset to the estimated undiscounted future cash flows expected to be generated by such asset. If the carrying amount of an asset exceeds its estimated future cash flows, an impairment charge is recognized in the amount by which the carrying amount of such asset exceeds its fair value. The fair value calculation requires management to apply judgment in estimating future cash flows and the discount rates that reflect the risk inherent in the future cash flows. The estimated cash flows used for this nonrecurring fair value measurement is considered a Level 3 input as defined above.
|
13.
|
COLLABORATIVE ARRANGEMENT
|
On November 4, 2010, the Company entered into a license agreement with Boston Market Corporation, whereby the Company has the right to manufacture, sell and distribute Boston Market frozen food products. The license agreement was effective July 1, 2011. However, due to the fact that a majority of the Boston Market sales were geographically located east of the Mississippi River, the Company determined that it needed to have a distribution facility near the east coast in order to minimize freight expenses. The Company also needed access to a national sales force and broker network for retail sales. Therefore, on August 4, 2011, the Company entered into a Co-Manufacturing, Sales and Distribution Agreement (the “Agreement”) with Bellisio Foods, Inc. (“Bellisio”). Bellisio operates a manufacturing and storage facility in Jackson, OH and has a sales force in place to manage a consumer brand and sell into 25,000 retail supermarkets.
The Agreement covers a collaborative arrangement between the Company and Bellisio regarding the co-manufacture, sale and distribution of Boston Market products. The Agreement provides that the Company and Bellisio will each manufacture approximately 50% of the total production volume of current and future Boston Market products during the term of the Agreement. The Company began its manufacturing in June, 2011 and Bellisio began its manufacturing in August, 2011 at its Jackson, Ohio facility.
In addition to its co-manufacturing responsibilities during the term of the Agreement, Bellisio will be responsible for all sales and distribution responsibilities for all Boston Market products produced by both the Company and Bellisio. These responsibilities include marketing, sales, warehousing and handling, product distribution and all billing and collection activities. The Company has final approval rights for all sales and marketing promotion plans and expenses. Pursuant to the Agreement, the Company will be responsible for development of all new items for the Boston Market line as well as maintaining the quality and consistency of all products produced.
The Company and Bellisio will share equally in the first $2 million of aggregate profits from the co-manufactured products, with the percentage shifting to 60% to the Company and 40% to Bellisio for any profits in excess of $2 million. Profits will be calculated after deducting from gross revenues: pre-established labor, material overhead costs relating to manufacturing of the products, all pre-approved sales and promotion expenses including a fixed sales and administrative fee charged by Bellisio as a percentage of sales; pre-negotiated warehouse charges; actual freight costs; interest expense on working capital; and any legitimate invoice deduction from retailers for spoilage, cash discounts, if any, or defective products. The Company has elected to recognize any settlements of profit or loss from this arrangement as net revenue in the statement of income.
The Agreement is for an initial term of two years commencing effective July 1, 2011 and automatically renews for additional one-year periods unless either party provides notice of termination at least six months prior to the next one-year renewal date.
The Company recognizes revenue and expenses related the collaborative arrangement in accordance with authoritative guidance, which directs participants in collaborative arrangements to report costs incurred and revenue generated from transactions with third parties (that is, parties that do not participate in the arrangement) in each entity’s respective income statement line items for revenues and expenses. Revenues from the collaborative arrangement consist of sales to third party supermarkets.
The following table illustrates the income statement classification and activities attributable to transactions arising from the Arrangement for each period presented:
| For the Fiscal Year Ended | ||||
|
|
October 2, 2011
|
|||
|
Net Revenues
|
$ | 7,684,202 | ||
|
Cost of Sales
|
$ | (7,234,292 | ) | |
|
Gross Profit
|
$ | 449,910 | ||
|
Selling, general and administrative expenses
|
$ | (773,467 | ) | |
|
Net loss
|
$ | (323,557 | ) | |
In addition to the expenses noted above, during fiscal year 2011, the Company also incurred one-time start up management fees of $175,000, marketing expenses of $190,000 and start-up costs of $179,000 related to the test runs and initial product launch of the Boston Market brand.
|
14.
|
SUBSEQUENT EVENTS
|
On December 13, 2011, the Board of Directors authorized a share repurchase plan for an initial repurchase of up to $5 million of common shares. The authorized repurchases will be made from time to time in the open market. The timing, volume and nature of share repurchases will be at the sole discretion of management, and will be dependent on market conditions, blackout periods, the price and availability of the Company’s shares, and applicable securities laws.
|
15.
|
QUARTERLY FINANCIAL DATA (unaudited)
|
|
For the Fiscal Year Ended October 2, 2011
|
||||||||||||||||
|
January 2,
|
April 3,
|
July 3,
|
October 2,
|
|||||||||||||
|
2011
|
2011
|
2011
|
2011
|
|||||||||||||
|
(14 weeks)
|
(13 weeks)
|
(13 weeks)
|
(13 weeks)
|
|||||||||||||
|
|
|
|
|
|||||||||||||
|
Net revenues
|
$ | 44,761,458 | $ | 40,539,552 | $ | 39,666,756 | $ | 44,250,708 | ||||||||
|
Gross profit
|
4,970,423 | 4,530,830 | 1,973,813 | 1,478,644 | ||||||||||||
|
Operating income (loss)
|
2,695,533 | 2,491,798 | (546,332 | ) | (2,039,875 | ) | ||||||||||
|
Net income (loss)
|
1,609,101 | 1,521,829 | (331,971 | ) | (1,357,452 | ) | ||||||||||
|
Net income (loss) per share – basic
|
$ | 0.10 | $ | 0.10 | $ | (0.02 | ) | $ | (0.09 | ) | ||||||
|
Net income (loss) per share – diluted(1)
|
$ | 0.10 | $ | 0.09 | $ | (0.02 | ) | $ | (0.09 | ) | ||||||
(1) EPS totals may not add due to rounding.
|
For the Fiscal Year Ended September 26, 2010
|
||||||||||||||||
|
December 27,
|
March 28,
|
June 27,
|
September 26,
|
|||||||||||||
| 2009 | 2010 | 2010 | 2010 | |||||||||||||
|
(13 weeks)
|
(13 weeks)
|
(13 weeks)
|
(13 weeks)
|
|||||||||||||
|
Net revenues
|
$ | 56,232,538 | $ | 50,459,303 | $ | 43,360,677 | $ | 44,429,117 | ||||||||
|
Gross profit
|
7,886,130 | 6,819,068 | 4,312,784 | 4,637,695 | ||||||||||||
|
Operating income
|
5,324,349 | 4,127,556 | 1,807,233 | 2,665,865 | ||||||||||||
|
Net income
|
3,052,795 | 2,360,626 | 930,333 | 1,230,780 | ||||||||||||
|
Net income per share – basic
|
$ | 0.19 | $ | 0.15 | $ | 0.06 | $ | 0.08 | ||||||||
|
Net income per share – diluted(1)
|
$ | 0.19 | $ | 0.15 | $ | 0.06 | $ | 0.08 | ||||||||
(1) EPS totals may not add due to rounding.
Schedule II
OVERHILL FARMS, INC.
VALUATION AND QUALIFYING ACCOUNTS AND RESERVES
|
Description
|
Balance at
Beginning |
Additions
|
Deductions(1)
|
Balance at
End of year |
||||||||||||
|
|
|
|
|
|||||||||||||
|
Allowance for Doubtful Accounts
|
|
|
|
|||||||||||||
|
2011
|
$ | - | $ | (42,000 | ) | $ | (1,000 | ) | $ | (43,000 | ) | |||||
|
2010
|
(15,000 | ) | (8,000 | ) | 23,000 | - | ||||||||||
|
2009
|
- | (17,000 | ) | 2,000 | (15,000 | ) | ||||||||||
|
|
||||||||||||||||
|
|
||||||||||||||||
|
Income Tax Valuation Allowance
|
||||||||||||||||
|
2011
|
$ | (21,000 | ) | $ | - | $ | - | $ | (21,000 | ) | ||||||
|
2010
|
(21,000 | ) | - | - | (21,000 | ) | ||||||||||
|
2009
|
(21,000 | ) | - | - | (21,000 | ) | ||||||||||
(1) Deductions to the allowance for doubtful accounts consist of write-offs, net of recoveries.
|
Exhibit Number
|
Index of Exhibits Attached to this Report
|
|
|
Description of Employment Arrangement with Robert A. Olivarez
|
||
|
First Amendment to Lease, dated June 12, 2006, between Vernon Associates, LLC and Overhill Farms, Inc.
|
||
|
Co-Manufacturing, Sales and Distribution Agreement, dated August 4, 2011, between Bellisio Foods, Inc. and Overhill Farms, Inc.
|
||
|
Consent of Independent Registered Public Accounting Firm
|
||
|
Certification of Principal Executive Officer Required by Rule 13a-14(a) of the Securities Exchange Act of 1934, as amended, as Adopted Pursuant to Section 302 of the Sarbanes-Oxley Act of 2002
|
||
|
Certification of Principal Financial Officer Required by Rule 13a-14(a) of the Securities Exchange Act of 1934, as amended, as Adopted Pursuant to Section 302 of the Sarbanes-Oxley Act of 2002
|
||
|
Certification of Chief Executive Officer and Chief Financial Officer Pursuant to 18 U.S.C. Section 1350, as Adopted Pursuant to Section 906 of the Sarbanes-Oxley Act of 2002
|