Attached files
| file | filename |
|---|---|
| 8-K - FORM 8-K - Covidien plc | d271723d8k.htm |
| EX-99.2 - PRESS RELEASE - Covidien plc | d271723dex992.htm |
  Spin-off of Pharmaceuticals
December 15, 2011
Exhibit 99.1 |
 Forward-Looking Statements
December 15, 2011
2 |
This presentation contains certain “forward-looking statements” that are not historical
facts. These statements are based on management’s current expectations and are subject
to risks, uncertainty and changes in circumstances, which may cause actual results to differ
materially from anticipated results. All statements contained herein that are not clearly
historical in nature are forward-looking and the words “anticipate,”
“believe,” “expect,” “estimate,” “plan,” and similar
expressions are generally intended to identify forward-looking statements.
The forward-looking statements in this presentation may include statements addressing the
following subjects: the expected timing of the completion of the transaction, the effect of the
transaction on Covidien’s business and competitive position, future innovation and market
growth, Covidien’s future financial performance, financial condition and operating results,
and economic, business, competitive and/or regulatory factors affecting our business. Any of the
following factors may affect our future results: –
Uncertainties as to the timing of the transaction –
The possibility that various closing conditions for the transaction may not be satisfied
or waived, including that a governmental entity may prohibit, delay or refuse to grant
approval for the consummation of the transaction
–
The effects of disruption from the transaction making it more difficult to maintain
relationships with employees, customers, vendors and other business partners –
The risk that stockholder litigation in connection with the transaction may result in
significant costs of defense, indemnification and liability |
 Forward-Looking Statements (con’t)
December 15, 2011
3 |
–
Other business effects, including the effects of industry, economic or political conditions
outside of Covidien’s control
–
Transaction costs and other risks and uncertainties discussed in Covidien’s filings with the U.S. Securities and
Exchange Commission, including the “Risk Factors” sections of Covidien’s most
recent annual report on Form 10-K and subsequent quarterly reports on Form 10-Q. In
addition, our historical combined financial information prior to June 29, 2007, is not
necessarily representative of the results we would have achieved as an independent,
publicly-traded company and may not be a reliable indicator of our future results.
Covidien does not undertake any obligation to update any forward-looking statements as a
result of new information, future developments or otherwise, except as expressly required by
law. All forward-looking statements in this announcement are qualified in their
entirety by this cautionary statement.
|
 Non-GAAP Financial Measures
December 15, 2011
4 |
This presentation discusses measures which may be considered “non-GAAP” financial
measures under applicable Securities and Exchange Commission rules and regulations. These
non-GAAP financial measures should be considered supplemental to and not a substitute for
financial information prepared in accordance with generally accepted accounting
principles. The definition of these non-GAAP measures may differ from similarly
titled measures used by others.
The Company generally uses non-GAAP financial measures to facilitate management’s internal
comparisons to Covidien’s historical operating results, to competitors’ operating
results, and to provide greater transparency to investors of supplemental information used by
management in its financial and operational decision-making, including to evaluate
Covidien’s operating performance and to determine management incentive compensation. The Company presents
its operating margin forecast before special items to give investors a perspective on the
expected underlying business results. Because the Company cannot predict the timing and
amount of such items and the associated charges or gains that will be recorded in the Company’s
financial statements, it is difficult to include the impact of those items in the forecast. The following is a
list of the non-GAAP financial measures which may be discussed in this presentation:
Adjusted Gross Margin: Gross profit excluding inventory charges, restructuring related charges, net /
Net Sales (expressed as a percentage). Adjusted Operating
Income: Operating income excluding charges or income for class action and shareholder
settlements, net of insurance recoveries, restructuring charges, legal settlements, licensing
fees, loss on divestiture, environmental charges, transaction costs and in-process R&D. Adjusted Operating
Income Margin: Adjusted Operating Income / Net Sales (expressed as a percentage
Additional information is available in the Investor Relations section of our website www.covidien.com |
 December 15, 2011
5 |
References to “New Covidien”
in this presentation
reflect the Covidien plc historical reported GAAP
results less the historical reported GAAP results of
the Pharmaceuticals segment.
These results are not necessarily representative of
the results that will be reported by “New Covidien”
or the Pharmaceuticals segment as stand-alone
companies. In addition, they are not necessarily
indicative of the future results of these companies.
|
 December 15, 2011
6 |
Medical
Supplies
2011 Net Sales
Medical Devices
Pharma-
ceuticals
68%
$7.8B
15%
$1.8B
17%
$2.0B
81%
$7.8B
19%
$1.8B
Active
Pharmaceutical
Ingredients
Contrast
Products
Specialty
Pharmaceuticals
Radiopharmaceuticals
Covidien $11.6B
“New Covidien”
$9.6B
Pharmaceuticals $2.0B
$598MM
$494MM
$416MM
$459MM |
 December 15, 2011
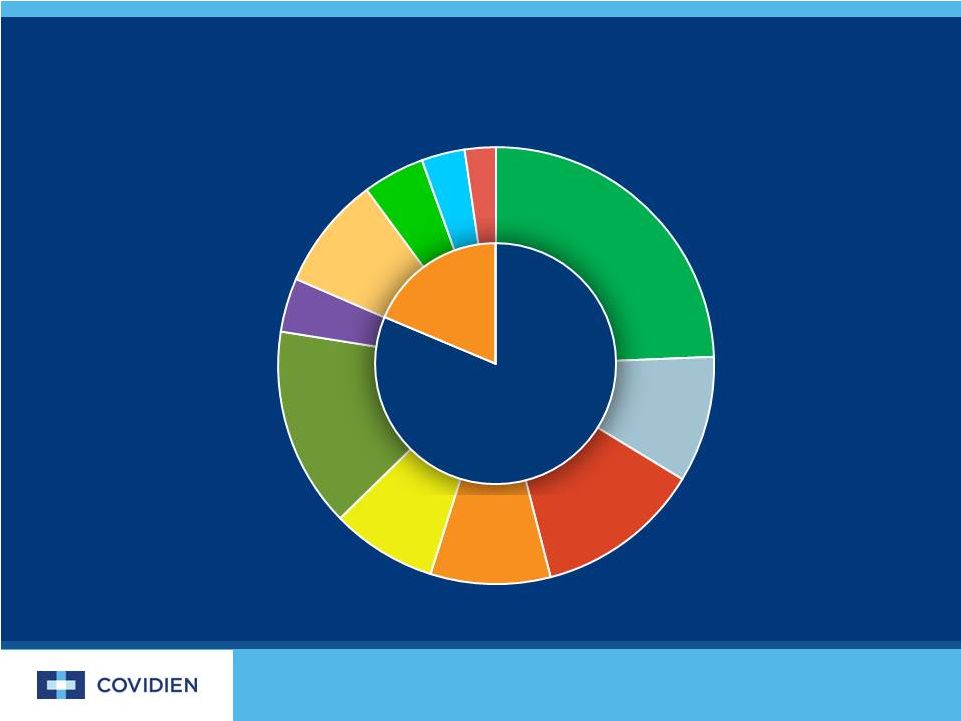
7 |
Endomechanical
Endomechanical
20.2%
20.2%
Soft Tissue Repair
Soft Tissue Repair
7.8%
7.8%
Energy
Energy
10.1%
10.1%
Oximetry & Monitoring
Oximetry & Monitoring
7.4%
7.4%
Airway & Ventilation
Airway & Ventilation
6.5%
6.5%
Vascular
Vascular
12.3%
12.3%
Other Medical Devices
Other Medical Devices
3.3%
3.3%
Specialty Pharmaceuticals
Specialty Pharmaceuticals
4.3%
4.3%
Active Pharmaceutical
Active Pharmaceutical
Ingredients
Ingredients
3.5%
3.5%
Contrast Products
Contrast Products
5.2%
5.2%
Radiopharmaceuticals
Radiopharmaceuticals
4.0%
4.0%
Nursing Care
Nursing Care
7.0%
7.0%
Medical Surgical
Medical Surgical
3.8%
3.8%
SharpSafety
SharpSafety
2.7%
2.7%
OEM
OEM
1.9%
1.9%
Product Portfolio –
Covidien
* Based on 2011 sales
Medical
Medical
Supplies
Supplies
15.4%
15.4%
Medical
Medical
Devices
Devices
67.6%
67.6%
Pharma
Pharma
ceuticals
ceuticals
17.0%
17.0%
-
- |
 December 15, 2011
8 |
Endomechanical
24.4%
Soft Tissue Repair
9.4%
Energy
12.2%
Oximetry & Monitoring
8.9%
Airway & Ventilation
7.8%
Vascular
14.8%
Other Medical Devices
4.0%
Nursing Care
8.4%
Medical Surgical
4.6%
SharpSafety
3.2%
OEM
2.3%
Medical
Devices
81.5%
Medical
Supplies
18.5%
* Based on 2011 sales
Product Portfolio –
“New Covidien” |
 December 15, 2011
9 |
United
States
Europe*
Other
Americas
2011 Net Sales by Geography
($ billions)
Asia-
Pacific
6%
$0.7
55%
$6.3
15%
$1.8
24%
$2.8
Covidien
$11.6
6%
$0.6
53%
$5.0
17%
$1.6
24%
$2.3
“New Covidien”
$9.6
Pharmaceuticals
$2.0
7%
$0.2
66%
$1.3
6%
$0.1
21%
$0.4
* Includes Europe, Middle East and Africa |
 December 15, 2011
10 |
Historical Sales Growth
($ billions)
2011
2007-2011
Medical Devices
Pharmaceuticals
Medical Supplies
Total Covidien
“New Covidien”
Pharmaceuticals
* As reported
10.7%
0.0%
6.8%
8.5%
0.0%
$7.8
2.0
1.8
$11.6
$9.6
2.0
CAGR
Net Sales*
0.9% |
 December 15, 2011
11 |
2011 Adjusted Gross Margin, R&D,
Depreciation & Amortization
($ millions)
Covidien*
“New Covidien”*
Pharmaceuticals
Covidien
“New Covidien”
Pharmaceuticals
$6,614
57.1%
60.0%
$854
43.4%
4.8%
$599
* Adjusted gross profit is a non-GAAP measure. See page 15 for
reconciliation. Adjusted
Gross Margin
Gross Profit
Adjusted
Net Sales
$5,760
$9,607
$1,967
$11,574
Depreciation &
Amortization
R&D % of
Net Sales
$479
4.3%
$120
7.2% |
 December 15, 2011
12 |
2011 Segment Operating Income*
($ millions)
Medical Devices
$2,422
30.9%
Pharmaceuticals
318
16.2%
Medical Supplies
Reportable Segments
$2,987
25.8%
Less Pharmaceuticals
(318)
“New Covidien”
*
Excludes Corporate and other unallocated expenses.
13.9%
247
Net Sales
Operating Income
27.8%
$2,669
% of |
 December 15, 2011
13 |
2011 Segment Operating Income and Margin*
($ millions)
“New
Covidien”
Medical Devices
$2,422 30.9%
Pharma-
ceuticals
$318 16.2%
Medical Supplies
$247 13.9%
81.1%
10.6%
8.3%
90.7%
9.3%
* Excludes Corporate and other unallocated expenses.
Covidien |
 Manufacturing Footprint
December 15, 2011
14 |
Covidien
48 Manufacturing facilities in 17 countries
Pharmaceuticals
11 Manufacturing facilities in 5 countries
“New Covidien”
37 Manufacturing facilities in 16 countries |
 Reconciliations
($ millions)
December 15, 2011
15 |
Covidien plc
GAAP Gross
profit
Inventory
charges
Restructuring related charges, net
Adjusted gross
profit
4
56.8%
57.1%
Gross margin
$6,578
32
$6,614
percent
2011 |
 Spin-off of Pharmaceuticals
December 15, 2011 |