Attached files
UNITED STATES
SECURITIES AND EXCHANGE COMMISSION
Washington, D.C. 20549
FORM 10-K
(Mark One)
| x | ANNUAL REPORT PURSUANT TO SECTION 13 OR 15(d) OF THE SECURITIES EXCHANGE ACT OF 1934 |
For the fiscal year ended September 30, 2011
or
| ¨ | TRANSITION REPORT PURSUANT TO SECTION 13 OR 15(d) OF THE SECURITIES EXCHANGE ACT OF 1934 |
For the transition period from to
Commission file number 0-21196
Destination Maternity Corporation
(Exact name of Registrant as specified in its charter)
| Delaware | 13-3045573 | |
| (State or other jurisdiction of incorporation or organization) |
(IRS Employer Identification No.) | |
| 456 North Fifth Street, Philadelphia, PA |
19123 | |
| (Address of principal executive offices) | (Zip Code) | |
(215) 873-2200
(Registrant’s telephone number, including area code)
Securities registered pursuant to Section 12(b) of the Act:
| Title of each class |
Name of each exchange on which registered | |
| Common Stock, par value $.01 per share | The NASDAQ Stock Market LLC |
Securities registered pursuant to Section 12(g) of the Act:
Series B Junior Participating Preferred Stock Purchase Rights
(Title of class)
Indicate by check mark if the Registrant is a well-known seasoned issuer, as defined in Rule 405 of the Securities Act. Yes ¨ No x
Indicate by check mark if the Registrant is not required to file reports pursuant to Section 13 or Section 15(d) of the Act. Yes ¨ No x
Indicate by check mark whether the Registrant (1) has filed all reports required to be filed by Section 13 or 15(d) of the Securities Exchange Act of 1934 during the preceding 12 months (or for such shorter period that the Registrant was required to file such reports), and (2) has been subject to such filing requirements for the past 90 days. Yes x No ¨
Indicate by check mark whether the registrant has submitted electronically and posted on its corporate Web site, if any, every Interactive Data File required to be submitted and posted pursuant to Rule 405 of Regulation S-T during the preceding 12 months (or for such shorter period that the registrant was required to submit and post such files). Yes x No ¨
Indicate by check mark if disclosure of delinquent filers pursuant to Item 405 of Regulation S-K is not contained herein and will not be contained, to the best of Registrant’s knowledge, in definitive proxy or information statements incorporated by reference in Part III of this Form 10-K or any amendment to this Form 10-K. x
Indicate by check mark whether the Registrant is a large accelerated filer, an accelerated filer, a non-accelerated filer, or a smaller reporting company. See the definitions of “large accelerated filer,” “accelerated filer” and “smaller reporting company” in Rule 12b-2 of the Exchange Act.
| Large accelerated filer ¨ |
Accelerated filer x | Non-accelerated filer ¨ | Smaller reporting company ¨ | |||
| (Do not check if a smaller |
Indicate by check mark whether the Registrant is a shell company (as defined in Rule 12b-2 of the Act). Yes ¨ No x
The aggregate market value of the voting and non-voting common equity held by non-affiliates computed using $23.07, the price at which the common equity was last sold as of March 31, 2011 (the last business day of the Registrant’s most recently completed second fiscal quarter), was approximately $290,000,000.
On December 5, 2011, there were 13,275,477 shares of the Registrant’s common stock, $.01 par value, outstanding.
DOCUMENTS INCORPORATED BY REFERENCE
Portions of the Registrant’s Proxy Statement to be filed with the Securities and Exchange Commission in connection with the Annual Meeting of Stockholders, expected to be held in the second quarter of fiscal 2012, are incorporated by reference into Part III of this Form 10-K.
PART I.
Our fiscal year ends on September 30. All references in this report to our fiscal years refer to the fiscal year ended on September 30 in the year mentioned. For example, our “fiscal 2011” ended on September 30, 2011. Unless otherwise indicated, operating data referred to in this report is as of September 30, 2011. As used in this report, the term “retail locations” includes our stores and leased departments and excludes locations where Kohl’s® sells our products under an exclusive product and license agreement, and international franchise locations. As used in this report, “stores” means our stand-alone stores in the United States, Puerto Rico, Guam and Canada which we operate.
| Item 1. | Business |
Overview
Destination Maternity Corporation (the “Company”, “we”, “us”, “our”) is the leading designer and retailer of maternity apparel in the United States and is the only nationwide chain of maternity specialty stores. As of September 30, 2011, we operate 2,352 retail locations, including 658 stores in all 50 states, Puerto Rico, Guam and Canada, and 1,694 leased departments located within department stores and baby specialty stores throughout the United States and Puerto Rico. We are also the exclusive provider of maternity apparel to Kohl’s, which operates approximately 1,127 stores throughout the United States. We operate our 658 stores under three retail nameplates: Motherhood Maternity®, A Pea in the Pod® and Destination Maternity®. In addition to our 658 stores, we operate 1,694 maternity apparel departments, which we refer to as leased departments, within leading retailers such as Macy’s®, Sears®, Babies“R”Us®, Bloomingdale’s®, Boscov’s® and Gordmans®. We are the exclusive maternity apparel provider in each of our leased department relationships. As previously announced, during the second quarter of fiscal 2011 we significantly expanded our leased department relationship with Macy’s from 115 Macy’s locations to 632 Macy’s locations throughout the United States, offering a mix of Motherhood Maternity and A Pea in the Pod branded merchandise. In fiscal 2011 we also operated leased departments in Kmart® stores. However, as we previously announced, we discontinued offering maternity apparel in Kmart locations in October 2011 and closed our remaining 291 Kmart leased department locations. Kmart represented only a small portion of the overall sales generated by our leased department relationship with Sears and Kmart through our agreement with Sears Holdings Corporation. We will continue to operate leased departments in Sears stores throughout the United States. As of October 31, 2011, we operate 530 leased department locations in Sears stores.
We also are expanding internationally and have entered into exclusive store franchise and product supply relationships in the Middle East, India and South Korea. As of September 30, 2011, we have 66 international franchised locations, comprised of 15 stand-alone stores in the Middle East and South Korea operated under the Destination Maternity retail nameplate, and 51 shop-in-shop locations in India and South Korea, in which we have a Company branded department operated under retail nameplates owned by our franchise partners. Finally, we also sell merchandise on the Internet, primarily through DestinationMaternity.com and our various brand-specific websites.
We believe we have maintained our leading position across all major price points of maternity apparel through our four distinct merchandise brands, which enable us to reach a broad range of maternity customers. Through our 658 stores and certain of our leased departments, we offer maternity apparel under our two primary merchandise brands, Motherhood Maternity (“Motherhood” or “Motherhood Maternity”) at value prices and A Pea in the Pod (“Pea” or “A Pea in the Pod”) at both contemporary and luxury prices. Our A Pea in the Pod Collection® (“Pea Collection”) is the distinctive premier maternity line within the A Pea in the Pod brand, featuring exclusive designer label product at luxury prices. We also have two additional value-priced maternity apparel brands: our Oh Baby by Motherhood® collection, which we sell exclusively through Kohl’s, and our Two Hearts® Maternity by Destination Maternity® collection, available exclusively at Sears stores. Our brands are the exclusive maternity apparel offering in each of these chains.
We believe that one of our key competitive advantages is our ability to fulfill, in a high-service store environment, all of an expectant and nursing mother’s clothing needs, including casual and career wear, formal attire, lingerie, sportswear and outerwear, in sizes that cover all trimesters of the maternity cycle. We believe that
2
our vertically-integrated business model enables us to offer the broadest assortment of in-stock, fashionable maternity apparel. We design and contract for the production of approximately 90% of the merchandise we sell using sewing factories located throughout the world, predominantly outside of the United States.
In recent years, we have developed and introduced new multi-brand store concepts to offer merchandise from our various brands in a single location, in order to provide a broader product assortment at multiple price ranges to our customers and to increase average store sales and profitability. We believe the continued rollout of our multi-brand store initiative provides the opportunity for us to improve store operating profit margins over time by reducing store operating expense percentages through economies of scale, and may increase overall sales in the geographical markets they serve. Our multi-brand stores are operated under our Destination Maternity nameplate, which includes Destination Maternity combo stores (carrying Motherhood Maternity and A Pea in the Pod merchandise) and Destination Maternity superstores, which also carry both our Motherhood and Pea merchandise brands, as well as a significant array of maternity-related products and customer service features. These Destination Maternity stores are larger and have historically had higher average sales than our average store. Opening these Destination Maternity stores will typically involve closing two or more smaller stores and may frequently result in one-time store closing costs resulting primarily from early lease terminations. In fiscal 2011 we closed 11 stores in connection with the opening of Destination Maternity nameplate stores and, from fiscal 2005 through fiscal 2011, we have closed 117 stores in connection with the opening of Destination Maternity nameplate stores.
In recent years, in addition to having closed some stores in connection with the opening of Destination Maternity nameplate stores, we have also evaluated our retail store base to identify and, in many cases, close underperforming stores (referred to as “prunings”) where we can do so without disproportionate exit cost. These prunings typically add to our profitability by eliminating the operating expense of an underperforming store while also typically transferring some of the sales from the closed store to other stores and/or leased departments we operate in that geographical area. In fiscal 2011 we closed 41 underperforming stores and, from fiscal 2005 through fiscal 2011, we have closed 234 underperforming stores.
We plan to open approximately 7 – 11 new retail stores during fiscal 2012, of which we expect approximately 6 – 9 will be new Destination Maternity combo or superstores. We estimate that we will close approximately 28 – 37 stores in fiscal 2012, with approximately 11 – 15 of these store closings related to the opening of new Destination Maternity stores, and the remainder of these store closings related to prunings.
Currently, we operate 35 Motherhood stores in Canada and a Motherhood website under a Canadian URL (MotherhoodCanada.ca). In addition, we believe there is a significant opportunity to develop international sales beyond Canada. We currently have franchise agreements in place in the Middle East, India and South Korea to expand our business internationally. The initial franchise stores through our arrangement in the Middle East opened during 2009 and, as of September 30, 2011, there are 13 of our franchise stores operating in the Middle East. Beginning during fiscal 2009, we began offering our Motherhood Maternity branded merchandise in maternity shop-in-shops located in our India franchisee’s Mom & Me® stores. As of September 30, 2011, our merchandise is offered in 49 Mom & Me stores in India. Beginning during fiscal 2011, we began offering our Motherhood Maternity branded merchandise in franchise stores and maternity shop-in-shops located in our South Korea franchisee’s Nextmom® stores. As of September 30, 2011, our merchandise is offered in two franchise stores and two Nextmom stores in South Korea.
We believe that our customers, particularly first-time mothers, are entering a new life stage that drives widespread changes in purchasing needs and behavior, thus making our maternity customer and her family a highly-valued demographic for a range of consumer products and services companies. As a result, we have been able to expand and leverage the relationship we have with our customers and generate incremental revenues and earnings by offering other value-added baby and parent-related products and services through a variety of marketing partnership programs utilizing our extensive opt-in customer database and various in-store marketing initiatives.
The Company was founded in 1982 as a mail-order maternity apparel catalog. We began operating retail stores in 1985 and completed our initial public offering in 1993. To address multiple price points in maternity apparel and improve operating productivity, we acquired Motherhood and A Pea in the Pod in 1995 and eSpecialty Brands, LLC, or iMaternity™, in October 2001. Since the acquisitions of Motherhood and A Pea in the Pod, we
3
have developed and grown these brands along with growing our Destination Maternity brand. Also, since the 1990s we have partnered with other retailers to sell our products through maternity apparel departments within their stores. On December 8, 2008, we changed our corporate name from “Mothers Work, Inc.” to “Destination Maternity Corporation” and our Nasdaq® symbol from “MWRK” to “DEST” coincident with the name change.
Industry Overview
We are unaware of any reliable external data on the size of the maternity apparel business. We believe that there is an opportunity to grow our business by selling maternity clothes to those pregnant women who currently purchase loose-fitting or larger-sized non-maternity clothing as a substitute or partial substitute for maternity wear. We also believe that our business can grow by reducing the amount of “hand-me-down” and “borrowing” associated with maternity apparel, particularly in the value-priced segment. Additionally, although we are not wholly unaffected by external factors (such as fluctuations in the birth rate), we believe that the demand for maternity apparel is relatively stable when compared to non-maternity apparel. Expectant mothers continue to need to replace most of their wardrobe and the current rate of approximately four million United States births per year has remained relatively stable over the last decade, although the number of births has declined by approximately 7.2% in the United States from 2007 to 2010, the period of latest available information. Also, although we are affected by fashion trends, we believe that maternity apparel is less fashion sensitive than women’s specialty apparel in general, as demand is driven primarily by the need to replace wardrobe basics as opposed to a desire to add to one’s wardrobe in order to meet current fashion trends.
Our Competitive Strengths
We are the leader in maternity apparel. We are the leading designer and retailer of maternity apparel in the United States and are the only nationwide chain of maternity specialty stores. We believe that our brands are the most recognized in maternity apparel. We have established a broad distribution network, with stores in a wide range of geographic areas and retailing venues. In addition, we have a leading position across all major price points of maternity apparel through our retail store nameplates and our merchandise brands. Our exclusive focus on maternity apparel and our leadership position enable us to gain a comprehensive understanding of the needs of our maternity customers and keep abreast of fashion and product developments. We further enhance our leadership position, increase market penetration and build our brands by distributing our products under exclusive leased department and licensed relationships. We are also using the strength of our products, brands and store nameplates in the United States to expand internationally. As of September 30, 2011, we operate 35 stores in Canada and we have 66 international franchised locations, comprised of 15 stand-alone stores in the Middle East and South Korea operated under our Destination Maternity retail nameplate, and 51 shop-in-shop locations in India and South Korea, in which we have a Company branded department operated under retail nameplates owned by our franchise partners.
We offer a comprehensive assortment of maternity apparel and accessories. A primary consideration for expectant mothers shopping for maternity clothes is product assortment, as pregnant women typically need to replace almost their entire wardrobe. We believe that we offer the widest selection of merchandise in the maternity apparel business. We also offer product for multiple seasons, as pregnant women’s clothing needs vary depending on their due date. Our ability to offer a broad assortment of product is due, in large part, to our vertically-integrated business model, which includes our extensive in-house design and contract manufacturing capabilities, as well as our rapid inventory replenishment system.
We are vertically integrated. We design and contract manufacture approximately 90% of the merchandise we sell. We believe that vertical integration enables us to offer the broadest assortment of maternity apparel, to respond quickly to fashion trends and to optimize in-stock levels. We combine our in-house design expertise, domestic and international sourcing capabilities, a rapid inventory replenishment process and extensive proprietary systems to enhance operational and financial results.
We utilize a rapid inventory replenishment system. We are able to offer a wide selection of merchandise in our retail locations due, in large part, to our rapid inventory replenishment system. Our proprietary inventory replenishment system enables us to offer our customers a much broader selection than any of our competitors, without dedicating retail space to “back-stock” storage. We coordinate the rapid replenishment of inventory for all
4
of our retail locations through our Philadelphia, Pennsylvania distribution centers to meet the individualized needs of our retail locations. Our stores receive shipments from our distribution centers between two and seven times per week. This enables us to maintain a high percentage in-stock merchandise position in each of our stores.
We have proprietary systems that support our business. In order to support our vertically-integrated business model and inventory replenishment system, we have developed a fully integrated, proprietary enterprise resource planning (“ERP”) system. This system includes our point-of-sale systems, our proprietary merchandise analysis and planning system, our materials requirement planning system, and our web-based, global sourcing and logistics systems. These systems also support our automated picking and sorting systems and other aspects of our logistics infrastructure. We believe that our proprietary systems enable us to offer a broad product assortment, rapidly replenish inventory in our retail locations, and respond quickly to fashion trends.
We are able to obtain prime real estate locations. We believe our ability to lease attractive real estate locations is enhanced due to the brand awareness of our concepts, our multiple price point approach, our highly sought after maternity customer and our real estate management and procurement capabilities. We are the only maternity apparel retailer to provide mall operators with differently priced retail concepts, depending on the mall’s target demographics. We are also able to provide a Destination Maternity multi-brand store for malls whose maternity customers seek a wide range of price alternatives. In addition, in the case of multi-mall operators, we have the flexibility to provide several stores across multiple malls. As a result, we have been able to locate stores in many of what we believe are the most desirable shopping malls in the country and are able to obtain attractive locations within these malls.
We are able to enhance our leadership position by distributing our products under exclusive leased department and licensed relationships. As of September 30, 2011, we operate 1,694 leased departments within leading retailers such as Macy’s, Sears, Babies“R”Us, Bloomingdale’s, Boscov’s and Gordmans. We are also the exclusive provider of maternity apparel to Kohl’s pursuant to an exclusive licensed relationship. We believe that we have an opportunity to continue to increase the sales we generate from these ongoing relationships through expanding our relationships with our current partners as well as developing relationships with new partners.
We have a highly experienced management team. We have a management team with significant experience in all aspects of the retail and apparel business, including our Chief Executive Officer (“CEO”), Ed Krell, who has served as a senior executive of the Company for nearly ten years and has over 25 years of business experience encompassing apparel, retail, finance and overall management, and our newly hired President, Chris Daniel, who has over 20 years of women’s apparel merchandising experience.
Merchandise Brands
We believe that our brands are the most recognized brands in the maternity apparel business. We sell our merchandise under the following four distinct brands:
| Brand |
Brand Positioning |
Typical |
||||
| Motherhood Maternity |
Broad assortment of the latest fashions, offering great quality merchandise at everyday low prices | $10 – $ 45 | ||||
| A Pea in the Pod |
Contemporary, fashion–forward and luxury, offering sophisticated career, as well as fun casual merchandise, including exclusive designer labels | $18 – $395 | ||||
| Two Hearts Maternity by Destination Maternity |
Select assortment of the latest fashions, offering great quality merchandise at value price points | $ 8 – $ 40 | ||||
| Oh Baby by Motherhood |
Select assortment of the latest fashions, offering great quality merchandise at value price points | $ 8 – $ 39 | (1) | |||
| (1) | Kohl’s, which sells our Oh Baby by Motherhood brand under an exclusive product and license agreement, sets the prices for this merchandise. |
5
Motherhood Maternity. Our Motherhood Maternity brand serves the value-priced portion of the maternity apparel business, which has the greatest number of customers. The Motherhood brand is positioned with a broad assortment of quality fashion at everyday low prices. We believe that the Motherhood customer shops at moderate-priced department stores and discount stores when she is not expecting.
A Pea in the Pod. Our A Pea in the Pod brand serves both the medium-priced (or “better”) portion and, through our A Pea in the Pod Collection line, the luxury portion of the maternity apparel business. The Pea brand is generally positioned as contemporary, fashion-forward and luxury, with prices ranging from affordable mid-priced to true luxury prices, offering the mom-to-be exceptional contemporary maternity pieces that reflect her uncompromising sense of style in both casual and career apparel. The Pea Collection is the distinctive premier maternity luxury line within the Pea brand, featuring a selection of extraordinary styles along with exclusive designer labels. In our stores which carry A Pea in the Pod brand merchandise, we also offer exclusive maternity versions of select styles from well-known designer and contemporary brands, where we have assisted in developing these maternity versions. We believe that the typical Pea customer shops at department stores and specialty apparel chains when she is not expecting, with the Pea Collection customer typically shopping at higher-end department stores and luxury designer boutiques when she is not expecting. We believe the Pea brand is the leading luxury maternity brand in the United States. Publicity, including celebrities wearing our clothes, is an important part of the marketing and positioning of the Pea brand.
Two Hearts Maternity by Destination Maternity. Our Two Hearts Maternity by Destination Maternity collection was re-launched in October 2009 at over 600 Sears and Kmart locations throughout the United States through an exclusive leased department relationship, and in September and October 2010 we completed the planned expansion into 217 additional Sears and Kmart locations. This collection delivers the latest in career and casual sportswear as well as dresses, swimwear, lingerie and nursing-friendly sleepwear, all specially designed to complement the pregnant silhouette, with most items selling for under $25. As we previously announced, we discontinued offering maternity apparel in Kmart locations in October 2011. Kmart represented only a small portion of the overall sales generated by our leased department relationship with Sears and Kmart through our agreement with Sears Holdings Corporation. We will continue to operate leased departments in Sears stores throughout the United States. The Two Hearts Maternity collection was previously offered in Sears stores from April 2004 through June 2008.
Oh Baby by Motherhood. Our Oh Baby by Motherhood collection was launched in February 2005 at Kohl’s stores throughout the United States and on Kohls.com. The Oh Baby by Motherhood collection is available at all Kohl’s stores under an exclusive product and license agreement. The collection features a modern assortment of quality fashions, with most items having initial prices (before price promotions) under $40.
Retail Nameplates
We sell maternity apparel through the stores, leased departments and licensed relationships identified in the table below.
| Store Nameplate |
Description of |
Brand(s) Carried |
Typical |
Average | ||||
| Stores: |
||||||||
| Motherhood Maternity |
Mid-priced and moderate regional malls, strip and power centers, and central business districts | Motherhood | $10 – $ 45 | 1,800 | ||||
| A Pea in the Pod |
Mid-priced and high-end regional malls, lifestyle centers, central business districts and some stand-alone stores in affluent street locations | Pea (including, in some cases, Pea Collection) | $18 – $395 | 2,100 | ||||
6
| Store Nameplate |
Description of |
Brand(s) Carried |
Typical |
Average Size | ||||||
| Destination Maternity |
Combo stores located in mid-priced regional malls and lifestyle centers | Motherhood; Pea (including, in some cases, Pea Collection) |
$10 – $395 | Combo stores 2,900 | ||||||
| Superstores located primarily in outdoor and power centers and central business districts | Superstores 6,300 | |||||||||
| Leased Departments: |
||||||||||
| Macy’s |
Mid-priced regional malls | Motherhood; Pea | $10 – $250 | — | ||||||
| Sears |
Mid-priced and moderate regional malls | Two Hearts Maternity by Destination Maternity | $ 8 – $ 40 | — | ||||||
| Babies“R”Us |
Big box power centers | Motherhood | $10 – $ 45 | — | ||||||
| Bloomingdale’s |
Mall of America | Motherhood; Pea | $10 – $189 | — | ||||||
| Boscov’s |
Mid-priced and moderate regional malls | Motherhood | $10 – $ 45 | — | ||||||
| Gordmans |
Big box power centers | Motherhood | $10 – $ 45 | — | ||||||
| Exclusive Licensed Relationship: |
||||||||||
| Kohl’s |
Big box power centers | Oh Baby by Motherhood | $ 8 – $ 39 | (1) | — | |||||
| (1) | Kohl’s, which sells our Oh Baby by Motherhood brand under an exclusive product and license agreement, sets the apparel price range for this merchandise. |
The following table sets forth our store count by nameplate as of September 30, 2011.
| Store Count as of September 30, 2011 |
||||
| Motherhood Maternity |
535 | |||
| A Pea in the Pod |
43 | |||
| Destination Maternity: |
||||
| Combo stores |
52 | |||
| Superstores |
28 | |||
|
|
|
|||
| Total Destination Maternity stores |
80 | |||
|
|
|
|||
| Total stores (1) |
658 | |||
|
|
|
|||
| (1) | Excludes (i) lease departments, (ii) locations where Kohl’s sells our products under an exclusive product and license agreement and (iii) international franchised locations. |
Major regional malls with several department stores and a wide range of price points may be able to accommodate a Destination Maternity store, or more than one maternity store. Our retail nameplates provide us with the ability to address multiple price alternatives at a given mall. As of September 30, 2011, we had two of our store concepts in 11 major regional malls. Our preference is, over time and assuming we can obtain a suitable location under acceptable financial terms, to operate one larger-sized multi-brand store under the Destination Maternity nameplate in or near these malls, rather than two smaller single-brand stores.
7
Motherhood Maternity Stores. Motherhood Maternity is our largest chain with 535 stores as of September 30, 2011. Motherhood is positioned with a broad assortment of quality fashion at everyday low prices. Motherhood stores average approximately 1,800 square feet and are located primarily in mid-priced and moderate regional malls, strip and power centers, and central business districts. Motherhood stores include 85 outlet locations that carry Motherhood-branded merchandise as well as some closeout merchandise. In fiscal 2011, we opened five new Motherhood stores and outlets and closed 37 Motherhood stores and outlets, with six of these store closings related to Destination Maternity store openings. As of September 30, 2011, we operated 35 Motherhood stores in Canada and believe that market opportunities may permit us to open additional stores in Canada in the future.
A Pea in the Pod Stores. As of September 30, 2011, we had 43 A Pea in the Pod stores, averaging approximately 2,100 square feet. Certain of the A Pea in the Pod stores are located in mid-priced regional malls, lifestyle centers and central business districts while others are located in upscale venues, including Beverly Hills, Oak Street, South Coast Plaza and Newbury Street. In fiscal 2011, we closed thirteen Pea stores, with five of these store closings related to Destination Maternity store openings.
Destination Maternity Stores. As of September 30, 2011, we had 80 Destination Maternity stores averaging approximately 4,100 square feet, including 52 Destination Maternity combo stores and 28 Destination Maternity superstores.
Destination Maternity Combo Stores. As of September 30, 2011, we had 52 Destination Maternity combo stores. Our combo stores are larger (average of approximately 2,900 square feet) than our single-brand stores, generally have higher average sales volume than our average store and provide the opportunity to improve store operating profit margins over time. A new combo store often involves closing two stores (often one Motherhood store and one Pea store), although we sometimes close only one store in a given geographical market in situations where we believe we can expand sales through replacing a single-brand store with a Destination Maternity combo store. Store closings will often involve one-time store closing costs resulting primarily from early lease terminations. Based on our internal research, we believe that over the next several years we have the potential to expand the Destination Maternity combo store chain to 70 or more total Destination Maternity combo stores in the United States. In fiscal 2011, we opened five Destination Maternity combo stores and closed two Destination Maternity combo stores.
Destination Maternity Superstores. As of September 30, 2011, we had 28 Destination Maternity superstores. Destination Maternity superstores currently carry both of our primary merchandise brands (Motherhood and Pea), plus a greatly expanded line of maternity-related accessories, nursing products, health and fitness products, books, and body and nutritional products. Certain Destination Maternity superstores also carry our luxury A Pea in the Pod Collection portion of the Pea brand. Our Destination Maternity superstores also typically feature a dedicated “learning center” area for maternity-related classes, a “relax area” for husbands and shoppers alike, and an inside play area for the pregnant mom’s toddlers and young children, with seven of our superstores also having our Edamame® The Maternity Spa®. These elements combine to give our Destination Maternity superstore not only the largest assortment of maternity apparel and accessories available, but also a unique and engaging atmosphere and experience for the maternity customer. A new Destination Maternity superstore typically involves closing at least two, and sometimes more, single-brand stores, is expected to decrease store operating expense percentages through economies of scale, and may increase overall sales in the geographical areas it serves. Destination Maternity superstores range from nearly 3,600 square feet to approximately 11,400 square feet, with an average of approximately 6,300 square feet for the 28 stores open as of September 30, 2011. In February 2006, we opened our flagship Destination Maternity superstore on the corner of 57th Street and Madison Avenue in New York City’s Manhattan borough. This is the largest maternity store in the world, spanning three floors and including our Edamame The Maternity Spa, all of our primary apparel brands, prenatal education and yoga classes, a juice bar with Internet access, relax area and children’s play area. As the only national retailer that is solely focused on maternity, we are further differentiating ourselves as the ultimate maternity destination with these large, well-assorted, “must visit” superstores. We opened two Destination Maternity superstores during fiscal 2011. Based on our internal research, we believe that over the next several years
8
we have the potential to expand the Destination Maternity superstore chain to 50 or more total Destination Maternity superstores in the United States.
Leased Departments. In addition to the stores we operate, we have arrangements with department stores and baby specialty stores, including Macy’s, Sears, Babies“R”Us, Bloomingdale’s, Boscov’s and Gordmans, to operate maternity apparel departments in their stores. We are the exclusive maternity apparel provider in each of our leased department locations. We staff these leased departments at varying levels and maintain control of the pricing terms and the timing and degree of the markdowns of our merchandise that is sold in the leased departments. We operate our leased departments during the same hours and days as the host store and are responsible for replenishment of the merchandise in the leased departments. These leased departments typically involve the lease partner collecting all of the revenue from the leased department. The revenue is remitted to us, less a fixed percentage of the net sales earned by the lease partner as stipulated in each agreement.
The following table sets forth our leased department count by lease partner as of September 30, 2011.
| Leased Department Count as of September 30, 2011 |
||||
| Macy’s |
632 | |||
| Sears |
530 | |||
| Kmart |
291 | (1) | ||
| Babies“R”Us |
128 | |||
| Gordmans |
73 | |||
| Boscov’s |
39 | |||
| Bloomingdale’s |
1 | |||
|
|
|
|||
| Total leased departments (2) |
1,694 | |||
|
|
|
|||
| (1) | During October 2011 we closed all remaining 291 Kmart leased department locations. |
| (2) | Excludes (i) locations where Kohl’s sells our products under an exclusive product and license agreement and (ii) international franchised locations. |
Exclusive Licensed Relationship. Our Oh Baby by Motherhood collection is available at all Kohl’s stores under an exclusive product and license agreement. The collection was launched in February 2005 at Kohl’s stores throughout the United States and on Kohls.com. As of September 30, 2011, Kohl’s operated approximately 1,127 stores throughout the United States.
International. Currently, we operate 35 Motherhood stores in Canada and a Motherhood website under a Canadian URL (MotherhoodCanada.ca).
In October 2008, we announced our planned expansion into six key markets in the Middle East through an international franchise agreement with Multi Trend, a member of the Al-Homaizi Group, to introduce our brands into the Middle East. The initial franchise stores through our arrangement in the Middle East opened during 2009 and, as of September 30, 2011, there are 13 of our franchise stores operating in the Middle East.
In April 2009, we announced our planned expansion into India through an international franchise agreement with Mahindra Retail, part of the Mahindra Group, to introduce our brands into India. We have initially made our Motherhood Maternity product available for sale in maternity shop-in-shops located in Mahindra Retail’s Mom & Me stores (which carry infant and children’s apparel and non-apparel merchandise, as well as maternity apparel) in India. As of September 30, 2011, our Motherhood Maternity merchandise is offered in 49 Mom & Me stores in India.
In June 2011, we announced our expansion into South Korea through an international franchise agreement with Agabang & Company, to introduce our brands into South Korea. We have initially made our Motherhood Maternity and A Pea in the Pod product available for sale in franchise stores and maternity shop-in-shops located in Agabang & Company’s Nextmom stores (which carry infant and children’s apparel and non-apparel
9
merchandise, as well as maternity apparel) in South Korea. As of September 30, 2011, our Motherhood Maternity and A Pea in the Pod merchandise is offered in two franchise stores and two Nextmom stores in South Korea.
We continue to evaluate other international sales opportunities. As our Middle East, India and South Korea franchise relationships demonstrate, we anticipate that our initial international strategy will consist primarily of franchising, licensing or similar arrangements with foreign partners, although we anticipate that our strategy, particularly over the longer term, may include both licensing arrangements with foreign partners, as well as potentially entering into wholesale business arrangements, entering into joint ventures or developing our own operations in certain countries.
Internet Operations
We sell our merchandise on the Internet primarily at our DestinationMaternity.com website and our brand-specific websites such as Motherhood.com and APeaInThePod.com. We also sell our merchandise through our Canadian website, MotherhoodCanada.ca. We believe that many pregnant women use the Internet to find maternity-related information and to purchase maternity clothes. Our websites are therefore important tools for educating existing and potential customers about our brands and driving traffic to our stores. Our DestinationMaternity.com website contains maternity advice and information, related baby product information and editorial content. Our marketing and technology capabilities and the replenishment capabilities of our distribution centers and stores enable us to incorporate Internet design, operations and fulfillment into our existing operations. We believe that our Internet operations represent a growth opportunity for the Company both by increasing Internet sales and by using the Internet to drive store sales. During fiscal 2011, Internet sales increased 22.0%, on top of an increase of 32.3% in fiscal 2010, and we look to continue to increase sales driven by our Internet operations in the future.
Marketing Partnerships
We believe our customers, particularly first-time mothers, are entering a new life stage that drives widespread changes in purchasing needs and behavior, thus making our maternity customer and her family a highly-valued demographic for a range of consumer products and services companies. We have been able to leverage the relationship we have with our customers to earn incremental revenues and expect to expand these revenues through additional marketing partnerships.
We expect to continue to expand and leverage the relationship we have with our customers and earn incremental revenues through a variety of marketing partnership programs utilizing our extensive opt-in customer database and various in-store marketing initiatives, which help introduce our customers to various baby and parent-related products and services offered by leading third-party consumer products companies. Our current revenues in this area have predominantly been derived from the prenatal portion of our customer database. We also believe there is an opportunity to more actively market our full customer database to a much broader range of consumer products and services companies that market to families with children.
Operations
Brand-Specific Operations Teams. To obtain maximum efficiencies, we are organized primarily along functional lines, such as store operations, merchandising, design and production. Our business consists of four merchandise brands, which each require decisions on a brand-specific basis. As such, we have built business teams by brand where the functional leaders within each brand work together. Each brand team is led by the head merchant and includes a brand-specific head designer, head planner and distributor, key production manager, and, where applicable, a director of stores. These teams also include visual, fabric purchasing and other necessary professionals.
Store Operations. The typical maternity customer, especially the first-time mother, seeks more advice and assistance than the typical non-maternity customer. Therefore, we aim to employ skilled and motivated store team members who are trained to provide the high level of service and reassurance needed by our customers. We
10
attempt to provide a boutique level of attentive service that differentiates us from our competitors. Our centralized merchandising and store operations also enable our store team members to focus primarily on selling and maintaining the appearance of the stores. In addition, visual merchants coordinate with the merchandising department to develop floor-sets, design store display windows and define and enhance the product presentation.
The field/store management reporting structure for each chain consists of a director, regional managers, district managers and store managers. These members of field/store management are each eligible to receive incentive-based compensation related to store, district, regional and chain-level performance.
Merchandising, Design and Inventory Planning and Allocation
Merchandising. We strive to maintain an appropriate balance between new merchandise and proven styles, as well as between basic and fashion items. Our merchandising decisions are based on current fashion trends, as well as input from our designers and outside vendors. This information is used in conjunction with the item-specific sales data provided by our proprietary merchandising and replenishment system. Each brand has its own team of merchants, designers and planners. These teams are led by the head merchant of the brand, each of whom reports to our President.
Design. Our design department creates and produces samples and patterns for our contract-manufactured products under the guidance of the merchandising department. The design of our products begins with a review of European and New York runway trends, current non-maternity retail trends, fashion reporting service information and fabric samples. The designers review our best selling items from prior seasons and integrate current fashion ideas from the non-maternity apparel business.
Inventory Planning and Allocation. Our inventory planning and allocation department is responsible for planning future inventory purchases and markdowns, as well as targeting overall inventory levels and turnover. We establish target inventories for each store using our inventory planning system with the goals of optimizing our merchandise assortment and turnover, maintaining adequate depth of merchandise by style and managing closeout and end-of-season merchandise consolidation. Our proprietary capabilities enable us to continually monitor and respond quickly to consumer demand and are integral to our inventory management program. These capabilities are facilitated by our customized merchandise analysis and planning system, which provides daily product sell-through data and merchandising information.
Production and Distribution
We design and contract for the production of approximately 90% of the merchandise we sell using sewing factories located throughout the world, predominantly outside of the United States, and we continue to seek additional contractors for our sourcing needs. No individual contractor represents a material portion of our sewing. A majority of our merchandise is purchased “full package” as finished product made to our specifications, typically utilizing our designs. Fabric, trim and other supplies are obtained from a variety of sources. Substantially all of the merchandise produced outside of the United States is paid for in United States dollars.
Our production personnel monitor production at contractor facilities in the United States and work with our buying representatives abroad to ensure quality control, compliance with our design specifications and timely delivery of finished goods. This quality control effort is enhanced by our worldwide Internet-based contracting and logistics systems, which include advanced features such as measurement specifications and digital photography. We also use a third-party consulting firm to help monitor working conditions at our contractors’ facilities on a worldwide basis.
We operate our distribution centers in Philadelphia, Pennsylvania. We own our primary distribution center in Philadelphia, Pennsylvania and lease a facility located in the Philadelphia Naval Business Center in Philadelphia, Pennsylvania, which we use for warehousing, distribution and raw material cutting.
Finished garments from contractors and other manufacturers are received at our primary distribution center in Philadelphia, Pennsylvania. Garments are inspected using statistical sampling methods and stored for picking.
11
Our primary distribution center utilizes sophisticated fulfillment technology to serve as a replenishment center, as opposed to solely a distribution center. This distribution center sends selections from our overall inventory that meet the specific needs of each individual store, with shipments sent to each store between two and seven times per week. Retail location replenishment decisions are made automatically based upon target inventories established by the planning and allocation department and individual retail location sales data. Our primary distribution center uses several automated systems, including our pick-to-light system for flat-packed goods and our hanging garment sortation system, which speed up deliveries to our retail locations and reduce costs. Freight is routed through zone-skipping, over-the-road carriers and delivered locally by a variety of carriers, and is supplemented by a small percentage of second-day air, providing one to three day delivery to our retail locations.
Since 2003 we have been certified to participate in Customs-Trade Partnership Against Terrorism (“C-TPAT”), a United States Department of Homeland Security sponsored program, with United States Customs and Border Protection (“U.S. Customs”), through which we implement and monitor our procedures to manage the security of our supply chain as part of the effort to protect the United States and our imported products against potential acts of terrorism. Since 2005 we have been certified to participate in the Importer Self Assessment Program (“ISA”), a U.S. Customs program available only to C-TPAT participants with strong internal controls. Through our participation in the ISA program, we assume responsibility for monitoring our own compliance activities with applicable U.S. Customs regulations in exchange for certain benefits, which may help increase efficiency in importing. These benefits include exemption from certain government audits, increased speed of cargo release from U.S. Customs, front of the line access to U.S. Customs cargo exams, enhanced prior disclosure rights from U.S. Customs in the event of alleged trade violations, availability of voluntary additional compliance guidance from U.S. Customs, and less intrusive government oversight of trade compliance. In 2010, we were granted Tier 3 Status within the C-TPAT program, the highest level of recognition currently available.
In 2007 we were accepted to participate in the U.S. Customs and Border Protection’s Drawback Compliance Program. The benefits of this program include (i) waiver of prior notice where we do not have to notify U.S. Customs at the time of export of product to Canada and (ii) accelerated payment privileges, with respect to goods we export from the United States, which we previously imported into the United States, to receive drawback refunds of United States import duties previously paid within 30 days of filing the claim for refund.
Management Information and Control Systems
We believe that our proprietary systems are instrumental to our ability to offer the broadest assortment of maternity apparel merchandise and accomplish rapid replenishment of inventory. We continuously develop, maintain and upgrade our systems and we employ an in-house team of programmers. Our stores have point-of-sale terminals that provide information used in our customized merchandise analysis and planning system. This system provides daily financial and merchandising information that is integral to monitoring trends and making merchandising decisions. Our systems have numerous features designed to integrate our retail operations with our design, manufacturing and financial functions. These features include custom merchandise profiles for each store, rapid inventory replenishment, item-tracking providing daily updated selling information for every style, classification open-to-buy and inventory control, as well as the daily collection of customer payment data, including cash, check, credit card, debit card and gift card sales data.
As part of our proprietary ERP system, we employ a comprehensive materials requirement planning (“MRP”) system to manage our production inventories, documentation, work orders and scheduling. This system provides a perpetual inventory of raw materials, actual job costing, scheduling and bill of materials capabilities. The foundation of our proprietary ERP system is a perpetual inventory of finished goods by stock keeping unit (“SKU”) and location across all of our retail locations, which interfaces directly with our distribution facility.
Our proprietary, Internet-based point-of-sale system provides real-time access to financial and merchandising information in addition to rapid credit authorization. This point-of-sale system significantly reduces the amount of training required for new sales associates and store managers. In addition, we regularly add new features and functionality to the system, and the system improves our customer relationship management capabilities by enhancing our ability to create customized promotional and marketing strategies.
12
Given the importance of our management information systems, we have taken extensive measures to ensure their responsiveness and security. Our hardware and communications systems are based on a redundant and multiprocessing architecture, which allows their continued operation on a parallel system in the event that there is a disruption within the primary system. Our main computer system, located at our headquarters in Philadelphia, Pennsylvania, is duplicated by a fully mirrored system in a separate part of the building with a separate power source that is designed to assume full operations should disruption in the primary system occur. In addition, our software programs and data are backed up and securely stored off-site. Our communications links come from two telephone frame rooms and are delivered through underground and aboveground feeds.
Advertising and Marketing
We believe that we drive traffic into our stores through the power of our brands, referrals to friends and family from current and prior customers, our various websites and, perhaps most importantly, our convenient, high-traffic locations in various types of shopping malls and, to a much lesser extent, street locations. Therefore, we have modest advertising and marketing expenditures. Our marketing efforts include publicity, e-mail marketing, web-based advertising, in-store marketing and prenatal consumer-targeted advertising. For our Destination Maternity superstores, we advertise locally prior to each grand opening and continue to advertise both nationally and, at times, locally after the store opens. We advertise one or more of our brands in pregnancy-targeted publications, such as Fit Pregnancy, Pregnancy & Newborn, BabyTalk-Pregnancy Planner, and Parenting Early Years as well as in other broad-reach publications, such as Cosmopolitan, Marie Clare and Latina. For our luxury A Pea in the Pod brand, we advertise in high-fashion publications, such as InStyle. In addition, we utilize our publicity efforts to generate free editorial coverage for all of our brands on broadcast television, radio, the Internet and in magazines and newspapers.
Competition
Our business is highly competitive and characterized by low barriers to entry. The following are several factors important to competing successfully in the retail apparel industry: breadth of selection in sizes, colors and styles of merchandise; product procurement and pricing; ability to anticipate fashion trends and customer preferences; inventory control; reputation; quality of merchandise; store design and location; visual presentation and advertising; and customer service. We face competition in our maternity apparel lines from various sources, including department stores, specialty retail chains, discount stores, independent retail stores and catalog and Internet-based retailers, from both new and existing competitors. Many of our competitors are larger and have substantially greater financial and other resources than us. Our mid- and luxury-priced merchandise faces a highly fragmented competitive landscape that includes locally based, single unit retailers, as well as a handful of multi-unit maternity operations, none of which we believe has more than 10 stores nationwide. In the value-priced maternity apparel business, we currently face competition on a nationwide basis from retailers such as Forever 21®, Gap®, H&M®, jcpenney®, Old Navy®, Target® and Wal-Mart®. Substantially all of these competitors also sell maternity apparel on their websites.
Employees
As of September 30, 2011, we had approximately 1,900 full-time and 2,600 part-time employees. None of our employees are covered by a collective bargaining agreement. We consider our employee relations to be good.
Executive Officers of the Company
The following table sets forth the name, age and position of each of our executive officers:
| Name |
Age | Position | ||||
| Edward M. Krell |
49 | Chief Executive Officer | ||||
| Christopher F. Daniel |
54 | President | ||||
| Judd P. Tirnauer |
43 | Executive Vice President & Chief Financial Officer | ||||
| Ronald J. Masciantonio |
34 | Executive Vice President & General Counsel | ||||
13
Edward M. Krell has served as our Chief Executive Officer and a director since October 2008. From August 2010 to May 2011, Mr. Krell also served as the Company’s President. From July 2008 until October 2008, Mr. Krell served as our Chief Operating Officer and from May 2007 to July 2008, Mr. Krell served as our Chief Operating Officer & Chief Financial Officer. From November 2003 to May 2007, Mr. Krell served as our Executive Vice President—Chief Financial Officer, having served as Senior Vice President—Chief Financial Officer from the time he joined us in January 2002 until November 2003. Prior to joining us, Mr. Krell served in various senior financial management positions, including having served as Chief Financial Officer of London Fog Industries, Inc., a wholesale and retail distributor of rainwear and outerwear. Mr. Krell began his career as an investment banker with Kidder, Peabody & Co. Incorporated and earned a Masters of Business Administration degree from Stanford University and a Bachelor of Arts degree from Harvard University. In 2010, Mr. Krell was named Citizen of the Year by the March of Dimes, Southeast Pennsylvania Division.
Christopher F. Daniel has served as our President since June 2011. Prior to joining us, Mr. Daniel served as President of Torrid, a division of Hot Topic, from November 2006. Mr. Daniel has also served in executive and management positions in merchandising and product development at Mervyn’s and Dayton-Hudson (divisions of Target Corporation), Structure (a division of Limited Brands), and Charming Shoppes. Mr. Daniel holds a Bachelor of Arts degree in English Literature from the University of Richmond.
Judd P. Tirnauer has served as our Executive Vice President & Chief Financial Officer since November 2011. From July 2008 to November 2011, Mr. Tirnauer served as our Senior Vice President & Chief Financial Officer, having previously served as our Vice President—Finance from June 2005 to July 2008, Vice President—Financial Planning & Analysis from October 2003 to June 2005, and Director of Financial Planning & Analysis from the time he joined us in November 2001 until October 2003. Mr. Tirnauer has earned both a Masters of Business Administration degree and a Juris Doctorate legal degree, and has earned a Certified Public Accountant designation.
Ronald J. Masciantonio has served as our Executive Vice President & General Counsel since November 2011. From April 2010 to November 2011, Mr. Masciantonio served as our Senior Vice President & General Counsel, having previously served as our Vice President & General Counsel since August 2006. In August 2006, Mr. Masciantonio rejoined us, after having previously served as our Assistant General Counsel from February 2004 to May 2005. From May 2005 to August 2006, Mr. Masciantonio was Assistant General Counsel, North America for Taylor Nelson Sofres, N.A., a market research company with global headquarters in London, England. Prior to joining us originally in February 2004, Mr. Masciantonio was an Associate in the Corporate and Securities department of Pepper Hamilton, LLP in Philadelphia, Pennsylvania from September 2001 to February 2004. Mr. Masciantonio received his Juris Doctorate legal degree from Temple University School of Law in Philadelphia, Pennsylvania.
Our executive officers are appointed annually by our Board of Directors and serve at the discretion of the Board. There are no family relationships among any of our executive officers.
Intellectual Property
We own trademark and service mark rights that we believe are sufficient to conduct our business as currently operated. We own several trademarks, including Destination Maternity Corporation™, A Pea in the Pod®, A Pea in the Pod Collection®, Motherhood®, Motherhood Maternity®, Destination Maternity®, Edamame® The Maternity Spa®, Two Hearts® Maternity, Oh Baby by Motherhood®, Motherhood Maternity Outlet®, MaternityMall.com® and iMaternity.com™. Additionally, we own the marks Secret Fit Belly®, Mimi Maternity®, Maternity Redefined®, The Art of Maternity™, Made With the Earth in Mind™, Motherhood Fits You™, and Expect Low Prices Every Day®.
In addition, from time to time, we may pursue patent protection for certain maternity apparel related technologies that we develop. For example, in October 2010 and March 2011 we were granted patents for our Secret Fit Belly. The Secret Fit Belly is made of seamless super stretch fabric that can form part of nearly any type of bottom (such as jeans, pants, shorts and skirts) to provide a better, more comfortable fit and a seamless look.
14
Seasonality
Our business, like that of many other retailers, is seasonal. Our quarterly net sales have historically been highest in our third fiscal quarter, corresponding to the Spring selling season, followed by our first fiscal quarter, corresponding to the Fall/holiday selling season. Given the historically higher sales level in our third fiscal quarter and the relatively fixed nature of most of our operating expenses and interest expense, we have typically generated a very significant percentage of our full year operating income and net income during our third fiscal quarter. Results for any quarter are not necessarily indicative of the results that may be achieved for a full fiscal year. Quarterly results may fluctuate materially depending upon, among other things, increases or decreases in comparable sales, the timing of new store openings and new leased department openings, net sales and profitability contributed by new stores and leased departments, the timing of the fulfillment of purchase orders under our product and license arrangements, adverse weather conditions, shifts in the timing of certain holidays and promotions, changes in inventory and production levels and the timing of deliveries of inventory, and changes in our merchandise mix.
Securities and Exchange Commission Filings
Our Securities and Exchange Commission (“SEC”) filings are available free of charge on our website, investor.destinationmaternity.com. Our annual reports on Form 10-K, quarterly reports on Form 10-Q, current reports on Form 8-K and amendments to those reports are posted on our website as soon as practicable after we furnish such materials to the SEC.
| Item 1A. | Risk Factors |
You should consider carefully all of the information set forth or incorporated by reference in this document and, in particular, the following risk factors associated with our business and forward-looking information in this document (see also “Forward-Looking Statements” included in Item 7. Management’s Discussion and Analysis of Financial Condition and Results of Operations). The risks described below are not the only ones we face. Additional risks not presently known to us or that we do not currently consider significant may also have an adverse effect on us. If any of the risks below actually occur, our business, results of operations, cash flows or financial condition could suffer.
Our performance may be affected by general economic conditions and the continued global financial difficulties.
Our performance is subject to worldwide economic conditions and their impact on levels of consumer spending, which have deteriorated significantly over the past approximately three years and may remain depressed, or be subject to further deterioration. Some of the factors that are having an impact on discretionary consumer spending include general economic conditions, employment, consumer debt, reductions in net worth based on securities market declines, residential real estate and mortgage markets, taxation, healthcare costs, fuel and energy prices, interest rates, credit availability, consumer confidence and other macroeconomic factors.
The worldwide apparel industry is heavily influenced by general economic cycles. Apparel retailing is a cyclical industry that is heavily dependent upon the overall level of consumer spending. Purchases of specialty apparel and related goods tend to be highly correlated with the cycles of the levels of disposable income of consumers. As a result, any substantial deterioration in general economic conditions could adversely affect our net sales and results of operations. Downturns, or the expectation of a downturn, in general economic conditions could adversely affect consumer spending patterns, our sales and our results of operations.
Consumer purchases of discretionary items generally decline during recessionary periods and other periods where disposable income is adversely affected. The downturn in the economy may continue to affect consumer purchases of our merchandise and have an adverse impact on our sales, results of operations and cash flow. Because apparel generally is a discretionary purchase, declines in consumer spending may have a more negative effect on apparel retailers than on other retailers. We may not be profitable if there is a decline in consumer spending.
15
The turmoil in the financial markets has resulted in extreme volatility in security prices and diminished liquidity and credit availability, and there can be no assurance that our liquidity will not be affected by changes in the financial markets and the global economy. Tightening of the credit markets and recent or future turmoil in the financial markets could also make it more difficult for us to access funds, to refinance our existing indebtedness (if necessary), to enter into agreements for new indebtedness, or to obtain funding through the issuance of our securities.
In addition, the effect from the 2008-2009 credit crisis continues to have a significant negative impact on businesses around the world, and the impact of this crisis on our suppliers cannot be predicted. The inability of suppliers to access liquidity, or the insolvency of suppliers, could lead to their failure to deliver our merchandise. Worsening economic conditions could also result in difficulties for financial institutions (including bank failures) and other parties that we may do business with, which could potentially impair our ability to access financing under existing arrangements or to otherwise recover amounts as they become due under our other contractual arrangements. Additionally, either as a result of or independent of the current financial difficulties and economic weakness in the United States, material fluctuations in currency exchange rates could have a negative impact on our business.
Our comparable sales and quarterly operating results have fluctuated in the past and can be expected to continue to fluctuate in the future and, as a result, the market price of our common stock may fluctuate or decline substantially.
Our comparable sales and quarterly results of operations have fluctuated in the past and can be expected to continue to fluctuate in the future and are affected by a variety of factors, including:
| • | the opening of new stores and the success of our leased department and licensed relationships; |
| • | the timing of new store openings and leased department and licensed brand business openings; |
| • | the timing of the fulfillment of purchase orders under our product and license arrangements; |
| • | the extent of cannibalization of sales volume of some of our existing retail locations by our new retail locations opened in the same geographic markets or by our Internet sales; |
| • | changes in our merchandise mix; |
| • | any repositioning of our brands; |
| • | general economic conditions and, in particular, the retail sales environment; |
| • | calendar shifts, including shifts of holiday or seasonal periods, or shifts in the number of weekend days occurring in a given month; |
| • | changes in pregnancy rates and birth rates; |
| • | actions of competitors; |
| • | the level of success and/or actions of anchor tenants where we have stores or leased department and licensed relationships; |
| • | fashion trends; and |
| • | weather conditions and seasonality. |
If, at any time, our comparable sales or quarterly results of operations decline or do not meet the expectations of investors, the price of our common stock could decline substantially.
Our share price may be volatile and could decline substantially.
The market price of our common stock has been, and is expected to continue to be, volatile, both because of actual and perceived changes in our financial results and prospects and because of general volatility in the stock
16
market. The factors that could cause fluctuations in our share price may include, among other factors discussed in this section, the following:
| • | actual or anticipated variations in the financial results and prospects of our business or other companies in the retail business; |
| • | changes in financial estimates by Wall Street research analysts; |
| • | actual or anticipated changes in the United States economy or the retailing environment; |
| • | changes in the market valuations of other specialty apparel or retail companies; |
| • | announcements by our competitors or us; |
| • | additions and departures of key personnel; |
| • | changes in accounting principles; |
| • | the passage of legislation or other developments affecting us or our industry; |
| • | the trading volume of our common stock in the public market; |
| • | changes in economic conditions; |
| • | financial market conditions; |
| • | natural disasters, terrorist acts, acts of war or periods of civil unrest; and |
| • | the realization of some or all of the risks described in this section entitled “Risk Factors.” |
In addition, the stock markets have experienced significant price and trading volume fluctuations from time to time, and the market prices of the equity securities of retailers have been extremely volatile and are sometimes subject to sharp price and trading volume changes. These broad market fluctuations may adversely affect the market price of our common stock.
We may not be successful in maintaining and expanding our business and opening new retail locations.
Any future growth depends significantly on:
| • | our ability to successfully establish and operate new stores (including Destination Maternity combo stores and superstores) on a profitable basis; |
| • | our ability to successfully establish new, and to maintain our current, leased department and licensed relationships, and to operate such leased department and licensed relationships on a profitable basis; and |
| • | the success and profitability of our international business, including our ability to successfully establish new, and to maintain our current, international franchising relationships. |
This growth, if it occurs, will place increased demands on our management, operational and administrative resources. These increased demands and operating complexities could cause us to operate our business less effectively, which, in turn, could cause a deterioration in our financial performance and negatively impact our growth. Any planned growth will also require that we continually monitor and upgrade our management information and other systems, as well as our distribution infrastructure.
Our ability to establish and operate new stores and our leased department and licensed relationships successfully depends on many factors, including, among others, our ability to:
| • | identify and obtain suitable store locations, including mall locations, the availability of which is outside of our control; |
| • | retain existing, expand existing and establish new leased department and licensed relationships; |
| • | negotiate favorable lease terms for stores, including desired tenant improvement allowances; |
17
| • | negotiate favorable lease terminations for existing store locations in markets where we intend to open new Destination Maternity combo stores or superstores; |
| • | source sufficient levels of inventory to meet the needs of new stores and our leased department and licensed relationships; |
| • | successfully address competition, merchandising and distribution challenges; and |
| • | hire, train and retain a sufficient number of qualified store personnel. |
The success and profitability of our international business depends on many factors, including, among others:
| • | our ability to retain our current international franchisees and our ability to identify and reach agreement with new international franchisees; |
| • | the ability of our franchisees to identify and obtain suitable store locations, including mall locations, the availability of which is outside of their control; |
| • | the ability of our franchisees to negotiate favorable lease terms for stores, including desired tenant improvement allowances; |
| • | our ability to source sufficient levels of inventory to meet the needs of our franchisees’ international operations; |
| • | our ability and the ability of our franchisees to successfully address competition, merchandising and distribution challenges; and |
| • | the ability of our franchisees to hire, train and retain a sufficient number of qualified store personnel. |
There can be no assurance that we will be able to grow our business and achieve our goals. Even if we succeed in establishing new stores, further developing our leased department and licensed relationships and further expanding our international relationships, we cannot assure that these initiatives will achieve planned revenue or profitability levels in the time periods estimated by us, or at all. If any of these initiatives fails to achieve or is unable to sustain acceptable revenue and profitability levels, we may incur significant costs.
Our business, financial condition and results of operations may be materially and adversely impacted at any time by a significant number of competitors.
We operate in a highly competitive environment characterized by few barriers to entry. We compete against department stores, specialty retail chains, discount stores, independent retail stores and catalog and Internet-based retailers. Many of our competitors are larger and have substantially greater financial and other resources than us. Further, we do not typically advertise using television and radio media and thus do not reach customers through means our competitors may use. Our mid- and luxury-priced merchandise faces a highly fragmented competitive landscape that includes locally based, single unit retailers, as well as a handful of multi-unit maternity operations, none of which we believe have more than 10 stores nationwide. In the value-priced maternity apparel business, we face competition on a nationwide basis from retailers such as Forever 21, Gap, H&M, jcpenney, Old Navy, Target and Wal-Mart. Substantially all of these competitors also sell maternity apparel on their websites. Our business, financial condition and results of operations may be materially and adversely affected by this competition, including the potential for increased competition in the future. For example, the maternity apparel business has previously experienced oversupply conditions due to increased competition in the maternity apparel business, which resulted in a greater level of industry-wide markdowns and markdowns recognized by us on sales from our retail locations. There can be no assurance that these conditions will not occur again or worsen.
Our relationships with third-party retailers may not be successful.
We cannot guarantee successful results from or the continuation of our leased department and licensed relationships with third-party retailers such as Macy’s, Sears, Babies“R”Us, Bloomingdale’s, Boscov’s, Gordmans and Kohl’s. Under our agreement with Kohl’s, subject to certain notice obligations, Kohl’s is not
18
obligated to purchase any maternity apparel from us and we are not obligated to sell any maternity apparel to them. Under our agreement with our leased department partners, those partners do not make any promises or representations as to the potential amount of business we can expect from the sale of our product in their stores. For example, as we previously announced, we discontinued offering maternity apparel in Kmart locations in October 2011, although we continue to operate leased departments in Sears stores throughout the United States. We do not control the pricing terms or the timing or degree of the markdowns at Kohl’s. The success of our leased department and licensed brand businesses is highly dependent on the actions and decisions of the third-party retailers, which are outside of our control. The retailers could limit the merchandise carried, close stores, go out of business or terminate their agreements with us. Our failure to properly manage our leased department and licensed brand businesses (including any failure by us in timely delivering goods to any third-party retailer or any failure to respond to the actions of, or changes in, business conditions at third-party retailers) would have a direct impact on the profitability and continuation of these relationships.
Our business depends on sustained demand for maternity clothing and is sensitive to birth rates, women’s fashion trends, economic conditions and consumer spending.
Our business depends upon sustained demand for maternity clothing. Our future performance will be subject to a number of factors beyond our control, including demographic changes, fashion trends, economic conditions and consumer spending. If demand for maternity clothing were to decline for any reason, such as a decrease in the number of pregnancies, our operating results could be adversely affected. For example, according to the United States Census Bureau and United States Centers for Disease Control and Prevention, births declined 3.1% in calendar 2010 compared to calendar 2009, and declined a total of 7.2% from calendar 2007 to calendar 2010. If this trend were to continue it could negatively affect our business and results of operations. Additionally, our operating results could be adversely affected if certain non-maternity women’s apparel fashions have a more pregnancy-friendly fit. For example, in fiscal 2007, we were negatively impacted by the popularity of certain styles in the non-maternity women’s apparel market, such as trapeze and baby-doll dresses and tops, which can more readily fit a pregnant woman early in her pregnancy than typical non-maternity fashions. Downturns, or the expectation of a downturn, in general economic conditions could adversely affect consumer spending patterns, our business, financial condition and results of operations. In addition, the specialty apparel retail business historically has been subject to cyclical variations. Consumer purchases of specialty apparel products, including maternity wear, may decline during recessionary periods and at other times when disposable income is lower. Declines in consumer spending patterns may have a more negative effect on apparel retailers than some other retailers. Therefore, we may not be able to maintain our historical sales and earnings, or remain as profitable, if there is a decline in consumer spending patterns. A prolonged economic downturn could have a material adverse impact on our business and results of operations.
We may not be successful in maintaining and expanding our marketing partnership programs.
We cannot guarantee successful results from the continuation of, or the expansion of, our marketing partnership programs which utilize our opt-in customer database and various in-store marketing initiatives. The success of our marketing partnership programs is highly dependent on the actions and decisions of the third-party consumer products companies to whom we provide these services. Should these third-party consumer products companies decide to limit the services provided by us, go out of business or terminate their agreements with us, our business, financial condition and results of operations could be materially and adversely affected. Further, there is no guaranty that we will be able to expand this part of our business through agreements with new third parties. In addition, our ability to provide the services is dependent on applicable law relating to the collection and transfer of the personally identifiable information of our customers. Any change in state, local or federal law which further restricts our ability to collect this information could cause us to terminate or limit the services we can provide to the third-party consumer products companies and would ultimately adversely affect our revenue from these relationships. Further, although we believe there is an opportunity to more actively market our full customer database to a much broader range of consumer products and services companies that market to families with children, we cannot guarantee that these efforts will be successful.
19
We require a significant amount of cash to service our indebtedness and to pay quarterly dividends, which reduces the cash available to finance any growth and could adversely affect our financial health.
We have a significant amount of indebtedness and we have the ability to incur substantial additional indebtedness in the future. Our ability to make required payments on our indebtedness, as well as to fund our operations and future growth, depends upon our ability to generate cash. Our success in generating cash depends upon the results of our operations, as well as upon general economic, financial, competitive and other factors beyond our control.
Additionally, our substantial indebtedness could have important consequences. For example, it could:
| • | increase our vulnerability to general adverse economic and industry conditions; |
| • | require us to dedicate a portion of our cash flow from operations to making payments on our indebtedness, thereby reducing the availability of our cash flow to implement our growth strategy, or to fund working capital, capital expenditures and other general corporate needs; |
| • | limit our flexibility in planning for, or reacting to, changes in our business and the industry in which we operate; |
| • | result in higher interest expense in the event of increases in interest rates as some of our debt is, and will continue to be, at variable rates of interest, and our available borrowings under our credit facility, to the extent borrowed in the future, would be at variable rates of interest; |
| • | place us at a competitive disadvantage compared to our competitors that have less debt, or debt at lower interest rates; |
| • | limit our ability to borrow additional funds; |
| • | make it more difficult for us to open new stores or improve or expand existing stores; |
| • | restrict our ability to pay dividends or make distributions to our stockholders; |
| • | require us to pledge all or substantially all of our assets as collateral to secure indebtedness; and |
| • | make it more difficult for us to pursue strategic acquisitions, alliances and partnerships. |
If we are unable to meet our expenses and debt obligations, we may need to refinance all or a portion of our indebtedness before the scheduled maturity dates of such debt, sell assets or raise equity. On such maturity dates, we may need to refinance our indebtedness if our operations do not generate enough cash to pay such indebtedness in full and if we do not raise additional capital. Our ability to refinance our indebtedness will depend on the capital markets and our financial condition at such time. We cannot assure you that we would be able to refinance any of our indebtedness, sell assets or raise equity on commercially reasonable terms or at all, which could cause us to default on our obligations and impair our liquidity.
Our variable rate indebtedness subjects us to interest rate risk, which could cause our debt service obligations to increase significantly.
Any borrowings under our revolving credit facility, which could significantly increase in the future, would bear interest at a variable rate. In addition, our term loan, with an outstanding balance of $29.3 million as of September 30, 2011, bears interest at a variable rate equal to, at our election, either (i) the prime rate plus 1.00%, or (ii) a LIBOR rate plus the applicable margin. The applicable margin under our term loan was initially fixed at 2.50% through and including the fiscal quarter ended September 30, 2007. Thereafter, the applicable margin for LIBOR rate borrowings is either 2.25% or 2.50%, depending on our Consolidated Leverage Ratio (as defined in the related term loan agreement). Based upon our applicable quarterly Consolidated Leverage Ratios, the applicable margin for LIBOR rate borrowings was 2.50% prior to December 30, 2009 and has been reduced to 2.25% effective from December 30, 2009. In order to mitigate our floating rate interest risk on the variable rate term loan, we entered into an interest rate swap agreement that commenced on April 18, 2007 and expires on April 18, 2012. The interest rate swap agreement enables us to effectively convert an amount of the term loan
20
(equal to the notional amount of the interest rate swap) from a floating interest rate (LIBOR plus 2.50% prior to December 30, 2009, reduced to LIBOR plus 2.25% effective from December 30, 2009, based on our specified leverage ratios), to a fixed interest rate (7.50% prior to December 30, 2009, reduced to 7.25% effective from December 30, 2009, based on our specified leverage ratios). The notional amount of the interest rate swap was $75.0 million at the inception of the swap agreement and decreases over time to a notional amount of $5.0 million at the expiration date. The notional amount of the swap was $12.5 million as of September 30, 2011 and decreased to $5.0 million starting October 18, 2011. The notional amount of the interest rate swap will remain at $5.0 million until the expiration of the interest rate swap agreement on April 18, 2012. Regardless of our attempts to mitigate our exposure to interest rate fluctuations through the interest rate swap, we still have exposure for the unswapped amounts of the term loan borrowings, which remain subject to a variable interest rate, as well as any borrowings under our revolving credit facility, which would be subject to a variable interest rate. As a result, an increase in interest rates could result in a substantial increase in interest expense, especially as the swapped amount of the term loan decreases over time and/or if our borrowings under our revolving credit facility increase.
We are heavily dependent on our management information systems and our ability to maintain and upgrade these systems from time to time.
The efficient operation of our business is heavily dependent on our internally developed management information systems (“MIS”). In particular, we rely on point-of-sale terminals, which provide information to our customized merchandise analysis and planning system used to track sales and inventory, and we rely on our Internet websites through which we sell merchandise to our customers. The merchandise analysis and planning system helps integrate our design, manufacturing, distribution and financial functions, and also provides daily financial and merchandising information. Although our software programs and data are backed up and securely stored off-site, our servers and computer systems are located at our headquarters in Philadelphia, Pennsylvania. These systems and our operations are vulnerable to damage or interruption from:
| • | fire, flood and other natural disasters; |
| • | power loss, computer systems failures, Internet and telecommunications or data network failure, operator negligence, improper operation by or supervision of employees, physical and electronic loss of data or security breaches, misappropriation and similar events; and |
| • | computer viruses. |
Any disruption in the operation of our MIS, the loss of employees knowledgeable about such systems or our failure to continue to effectively modify such systems could interrupt our operations or interfere with our ability to monitor inventory, which could result in reduced net sales and affect our operations and financial performance. In addition, any interruption in the operation of our Internet websites could cause us to lose sales due to the inability of customers to purchase merchandise from us through our websites during such interruption.
We also need to ensure that our systems are consistently adequate to handle our anticipated business growth and are upgraded as necessary to meet our needs. The cost of any such system upgrades or enhancements could be significant. As a result, our business, financial condition and results of operations could be materially and adversely affected if our servers and systems were inoperable or inaccessible.
From time to time, we improve and upgrade our MIS and the functionality of our Internet websites. If we are unable to maintain and upgrade our systems or Internet websites, or to integrate new and updated systems or changes to our Internet websites in an efficient and timely manner, our business, financial condition and results of operations could be materially and adversely affected.
A cybersecurity incident could have a negative impact.
A cyber-attack may bypass the security for our MIS causing an MIS security breach and leading to a material disruption of our MIS and/or the loss of business information and/or Internet sales. Such a cyber-attack could result in any of the following:
| • | theft, destruction, loss, misappropriation or release of confidential data or intellectual property; |
21
| • | operational or business delays resulting from the disruption of MIS and subsequent clean-up and mitigation activities; |
| • | negative publicity resulting in reputation or brand damage with our customers, partners or industry peers; and |
| • | loss of sales generated through our Internet websites through which we sell merchandise to customers to the extent these websites are affected by a cyber-attack. |
As a result, our business, financial condition and results of operations could be materially and adversely affected.
As an apparel retailer, we rely on numerous third parties in the supply chain to produce and deliver the products that we sell, and our business may be negatively impacted by disruptions in the supply chain.
If we lose the services of one or more of our significant suppliers or one or more of them fail to meet our product needs, we may be unable to obtain replacement merchandise in a timely manner. If our existing suppliers cannot meet our increased needs and we cannot locate alternative supply sources, we may be unable to obtain sufficient quantities of the most popular items at attractive prices, which could negatively impact our sales and results of operations. We obtain apparel and other merchandise from foreign sources, both purchased directly in foreign markets and indirectly through domestic vendors with foreign sources. To the extent that any of our vendors are located overseas or rely on overseas sources for a large portion of their products, any event causing a disruption of imports, including the imposition of import restrictions, could harm our ability to source product. This disruption could materially limit the merchandise that we would have available for sale and reduce our sales and earnings. The flow of merchandise from our vendors could also be adversely affected by financial or political instability, or war, in or affecting any of the countries in which the goods we purchase are manufactured or through which they flow. Trade restrictions in the form of tariffs or quotas, embargos and customs restrictions that are applicable to the products that we sell also could affect the import of those products and could increase the cost and reduce the supply of products available to us. Any material increase in tariff levels, or any material decrease in quota levels or available quota allocation, could negatively impact our business. Further, changes in tariffs or quotas for merchandise imported from individual foreign countries could lead us to shift our sources of supply among various countries. Any such shift we undertake in the future could result in a disruption of our sources of supply and/or an increase in product costs, and lead to a reduction in our sales and earnings. Supply chain security initiatives undertaken by the United States government that impede the normal flow of product could also negatively impact our business. In addition, decreases in the value of the United States dollar against foreign currencies could increase the cost of products that we purchase from overseas vendors.
We also face a variety of other risks generally associated with relying on vendors that do business in foreign markets and import merchandise from abroad, such as:
| • | political instability or the threat of terrorism, particularly in countries where our vendors source merchandise; |
| • | enhanced security measures at United States and foreign ports, which could delay delivery of imports; |
| • | imposition of new or supplemental duties, taxes and other charges on imports; |
| • | delayed receipt or non-delivery of goods due to the failure of foreign-source suppliers to comply with applicable import regulations; |
| • | delayed receipt or non-delivery of goods due to organized labor strikes or unexpected or significant port congestion at United States ports; and |
| • | local business practice and political issues, including issues relating to compliance with domestic or international labor standards, which may result in adverse publicity. |
The United States may impose new initiatives that adversely affect the trading status of countries where apparel is manufactured. These initiatives may include retaliatory duties or other trade sanctions that, if enacted,
22
would increase the cost of products imported from countries where our vendors acquire merchandise. Any of these factors could have a material adverse effect on our business, financial condition and results of operations.
We could be materially and adversely affected if our distribution operations were disrupted.
To support our distribution of product throughout the world, we operate our main distribution facility and one significantly smaller distribution facility, both in Philadelphia, Pennsylvania. Finished garments from contractors and other manufacturers are inspected and stored for distribution. We do not have other distribution facilities to support our distribution needs. If our main Philadelphia distribution facility were to shut down or otherwise become inoperable or inaccessible for any reason, we could incur significantly higher costs and longer lead times associated with the distribution of our products to our stores and to our third-party retailers during the time it takes to reopen or replace this facility. In light of our strategic emphasis on rapid replenishment as a competitive strength, a distribution disruption might have a disproportionately adverse effect on our operations and profitability relative to other retailers. In addition, the loss or material disruption of service from any of our shippers for any reason, whether due to freight difficulties, strikes, natural disaster or other difficulties at our principal transport providers or otherwise, could have a material adverse impact on our business, financial condition and results of operations.
We could be materially and adversely affected if we are unable to obtain sufficient raw materials or maintain satisfactory manufacturing arrangements.
We do not own any manufacturing facilities and therefore depend on third parties to manufacture our products. We place our orders for production of merchandise and raw materials by purchase order and do not have any long-term contracts with any manufacturer or supplier. We compete with many other companies for production facilities and raw materials. Furthermore, we have received in the past, and may receive in the future, shipments of products from manufacturers that fail to conform to our quality control standards or environmental standards. We have no ability to control the environmental compliance (including compliance with climate change requirements) of these third-party manufacturers. In such event, unless we are able to obtain replacement products in a timely manner, we may lose sales. If we fail to maintain favorable relationships with these third parties, or if we cannot obtain an adequate supply of quality raw materials on commercially reasonable terms, it could have a material adverse impact on our business, financial condition and results of operations.
Fluctuations in commodity prices could result in an increase in component costs, delivery costs, and overall product costs.
The results of our business operations could suffer due to significant increases or volatility in the prices of certain commodities, including but not limited to cotton, wool and other ingredients used in the production of fabric and accessories, as well as fuel, oil and natural gas. In addition, increases in the price of food and food commodities may result in increased labor rates related to textile and apparel production. Increases in prices of these commodities or other inflationary pressures may result in significant cost increases for our raw materials, product components and finished products, as well as increases in the cost of distributing merchandise to our retail locations and shipping products to our customers. For example, in the second half of fiscal 2011, we experienced product cost increases due, in part, to the increased cost of cotton as well as, to a lesser extent, increased labor rates in certain production countries. To the extent we are unable to offset any such increased costs through value engineering and similar initiatives, or through price increases, our profitability, cash flows and financial condition may be adversely impacted. If we choose to increase prices to offset the increased costs, our unit sales volumes could be adversely impacted.
Our stores are heavily dependent on the customer traffic generated by shopping malls.
We depend heavily on locating our stores in successful shopping malls in order to generate customer traffic. We cannot control the development of new shopping malls, the availability or cost of appropriate locations within existing or new shopping malls or the success of existing or new mall stores.
23
The success of all of our mall stores will depend, in part, on the ability of each mall’s anchor tenants, such as large department stores, other tenants and area attractions to generate consumer traffic in the vicinity of our stores, and the continuing popularity of malls as shopping destinations. Many traditional enclosed malls are experiencing significantly lower levels of customer traffic than in the past, driven by overall poor economic conditions as well as the closure of certain mall anchor tenants. Sales volume and mall traffic may be adversely affected by economic downturns in a particular area, the closing of anchor tenants or competition from non-mall retailers and other malls where we do not have stores.
Our success depends on our ability to identify and rapidly respond to fashion trends.
The apparel industry is subject to rapidly changing fashion trends and shifting consumer demands. Accordingly, our success depends on the priority that our target customers place on fashion and our ability to anticipate, identify and capitalize upon emerging fashion trends. Our ability or our failure to anticipate, identify or react appropriately to changes in styles or trends could lead to, among other things, excess inventories and higher markdowns, as well as the decreased appeal of our brands. Particular fashion trends, or an inaccuracy of our forecasts regarding fashion trends, could have a material adverse effect on our business, financial condition and results of operations. For example, in fiscal 2007 we were negatively impacted from the popularity of certain styles in the non-maternity women’s apparel market, such as trapeze and baby-doll dresses and tops, which can more readily fit a pregnant woman early in her pregnancy than typical non-maternity fashions.
The failure to attract and retain highly skilled and qualified senior management personnel could have a material adverse impact on our business, financial condition and results of operations.
Our business requires disciplined execution at all levels of our organization in order to timely deliver and display fashionable merchandise in appropriate quantities in our stores. This execution requires experienced and talented management. We currently have a management team with a great deal of experience with us and in apparel retailing. If we were to lose the benefit of this experience, our business, financial condition and results of operations could be materially and adversely affected.
In addition, as our business expands, we believe that our success will depend greatly on our continued ability to attract and retain highly skilled and qualified personnel. There is a high level of competition for personnel in the retail industry. Like most retailers, we experience significant employee turnover rates, particularly among store sales associates and managers, and our continued growth will require us to hire and train even more new personnel. We therefore must continually attract, hire and train new personnel to meet our staffing needs. We constantly compete for qualified personnel with companies in our industry and in other industries. A significant increase in the turnover rate among our sales associates and managers would increase our recruiting and training costs and could decrease our operating efficiency and productivity. If we are unable to retain our employees or attract, train, assimilate or retain other skilled personnel in the future, we may not be able to service our customers as effectively, which could impair our ability to increase sales and could otherwise harm our business.
Our quarterly operating results and inventory levels may fluctuate significantly as a result of seasonality in our business.
Our business, like that of other retailers, is seasonal. Results for any quarter are not necessarily indicative of the results that may be achieved for a full fiscal year. Quarterly results may fluctuate materially depending upon, among other things, increases or decreases in comparable sales, the timing of new store openings and new leased department openings, net sales and profitability contributed by new stores and leased departments, the timing of the fulfillment of purchase orders under our product and license arrangements, adverse weather conditions, shifts in the timing of certain holidays and promotions, changes in inventory and production levels and the timing of deliveries of inventory, and changes in our merchandise mix. Our quarterly net sales have historically been highest in our third fiscal quarter, corresponding to the Spring selling season, followed by our first fiscal quarter, corresponding to the Fall/holiday selling season. Given the historically higher sales level in our third fiscal quarter and the relatively fixed nature of most of our operating expenses and interest expense, we have typically
24
generated a very significant percentage of our full year operating income and net income during our third fiscal quarter. Thus, any factors which result in a material reduction of our sales for the third quarter could have a material adverse effect on our results of operations for our fiscal year as a whole. Seasonal fluctuations in sales also affect our inventory levels, as we usually order merchandise in advance of peak selling periods and sometimes before new fashion trends are confirmed by customer purchases. We must carry a significant amount of inventory, especially before the Fall/holiday and Spring selling seasons. If we are not successful in selling our inventory during this period, we may be forced to rely on markdowns or promotional sales to sell the excess inventory or we may not be able to sell the inventory at all, which could have a material adverse effect on our business, financial condition and results of operations.
If an independent manufacturer violates labor or other laws, or is accused of violating any such laws, or if their labor practices diverge from those generally accepted as ethical, it could harm our business and brand image.
While we maintain policies and guidelines with respect to labor practices that independent manufacturers that produce goods for us are contractually required to follow, and while we have an independent firm and Company employees inspect certain manufacturing sites to monitor compliance, we cannot control the actions of such manufacturers or the public’s perceptions of them, nor can we assure that these manufacturers will conduct their businesses using ethical or legal labor practices. Apparel companies can be held jointly liable for the wrongdoings of the manufacturers of their products. While many of our independent manufacturers are routinely monitored by buying representatives, who assist us in the areas of compliance, garment quality and delivery, we do not control the manufacturers’ business practices or their employees’ employment conditions, and manufacturers act in their own interest which may be in a manner that results in negative public perceptions of us, and/or employee allegations against us, or court determinations that we are jointly liable. Violations of law by our importers, buying agents, manufacturers or distributors could result in delays in shipments and receipt of goods and could subject us to fines or other penalties, any of which could restrict our business activities, increase our operating expenses or cause our sales to decline.
We may be unable to protect our trademarks and other intellectual property and may be subject to liability if we are alleged to have infringed on another party’s intellectual property.
We believe that our trademarks, service marks and other intellectual property are important to our continued success and our competitive position due to their recognition with our customers. We devote substantial resources to the establishment and protection of our trademarks, service marks and other intellectual property. Although we actively protect our intellectual property, there can be no assurance that the actions that we have taken to establish and protect our trademarks, service marks and other intellectual property, including our rights in our management information systems and our proprietary rights in products for which we have applied for or received patent protection (for example, our Secret Fit Belly® innovation), will be adequate to prevent imitation of our marks, products or services by others or to prevent others from seeking to block sales of our products as a violation of their trademarks, service marks or other proprietary rights. Also, others may assert rights in, or ownership of, our trademarks and other proprietary rights or may allege that we have or are infringing on their intellectual property rights and we may not be able to successfully resolve these types of conflicts. In addition, the laws of certain foreign countries may not protect our trademarks and proprietary rights to the same extent as do the laws of the United States. We cannot assure you that these registrations will prevent imitation of our name, merchandising concept, store design or private label merchandise, or the infringement of our other intellectual property rights by others. Imitation of our name, concept, store design or merchandise in a manner that projects lesser quality or carries a negative connotation of our brand image could have a material adverse effect on our business, financial condition and results of operations. Additionally, the high expense in both prosecuting and defending against, and potential liability related to, alleged infringements of intellectual property rights could be substantial and could have a material adverse effect on our business, financial condition and results of operations.
25
If climate change laws or regulations were to become applicable to our business, or if any third party with whom we have a leased or licensed relationship imposed reporting or other obligations on us due to their own compliance programs, we could incur additional expense to meet the requirements and our failure to comply could have a material adverse effect on our business.
With respect to manufacturing within the United States, United States Environmental Protection Agency (“EPA”) greenhouse gas (“GHG”) emission reporting rules require certain United States manufacturers to report GHG emissions. These rules are unlikely to require reporting of our third-party contract apparel manufacturers because the amount of emissions from retail stores and apparel manufacturing facilities are currently estimated to be below the EPA reporting threshold. With respect to manufacturing outside of the United States, international treaties, such as the Kyoto Protocol and the Copenhagen Protocol, do not currently require the countries in which our non-United States contract apparel manufacturers are located to control GHG emissions and it is unlikely that climate change requirements in the foreseeable future will require significant GHG emission reductions on our non-United States contract apparel manufacturers. Our manufacturers are required to follow all applicable laws, including climate change laws. If domestic or international laws or regulations were expanded to require GHG emission reporting or reduction by us or our third-party contract apparel manufacturers, or if we engage third-party contract manufacturers in countries that have existing GHG emission reporting or reduction laws or regulations, we would need to expend financial and other resources to comply with such regulations and/or monitor our third-party contract apparel manufacturers’ compliance with such regulations. In addition, we cannot control the actions of our third-party manufacturers or the public’s perceptions of them, nor can we assure that these manufacturers will conduct their businesses using climate change proactive or sustainable practices. Violations of climate change laws or regulations by third parties with whom we do business could result in negative public perception of us and/or delays in shipments and receipt of goods, and could subject us to fines or other penalties, any of which could restrict our business activities, increase our operating expenses or cause our sales to decline.
Some retailers have adopted “sustainability” or other policies that encourage or require suppliers to report and/or reduce GHG emissions. No third party with whom we have a leased or licensed relationship currently requires us to report GHG emissions to them. However, we expect that certain of these third parties may do so in the future, which would require us to expend financial and other resources to comply with such requirements. In addition, if such requirements are imposed on us, our relationship with such third parties could be damaged if we were unable to comply.
Changes in the health care regulatory environment could cause us to incur additional expense and our failure to comply with related legal requirements could have a material adverse effect on our business.
In 2010, the Patient Protection and Affordable Care Act and the Health Care and Education Reconciliation Act of 2010 were signed into law in the United States. This legislation expands health care coverage to many uninsured individuals and expands coverage to those already insured. The changes required by this legislation could cause us to incur additional health care and other costs, but we do not expect any material short-term impact on our financial results as a result of the legislation.
The costs and other effects of other new legal requirements cannot be determined with certainty. For example, new legislation or regulations may result in increased costs directly for our compliance or indirectly to the extent such requirements increase prices of goods and services because of increased compliance costs or reduced availability of raw materials.
War or acts of terrorism or the threat of either may negatively impact availability of merchandise and otherwise adversely impact our business.
In the event of war or acts of terrorism, or if either is threatened, our ability to obtain merchandise available for sale and consumer demand for our merchandise may be negatively affected. A substantial portion of our merchandise is imported from other countries. In addition, we not only generate sales in the United States and
26
Canada through our own retail locations but also in foreign countries through our international franchise relationships. If goods become difficult or impossible to import into the United States, and if we cannot obtain such merchandise from other sources at similar costs, our sales and profit margins may be adversely affected. Further, if consumer demand in any country where we do business is negatively affected, our sales in such country would suffer. In the event that commercial transportation is curtailed or substantially delayed, our business may be adversely impacted, as we may have difficulty shipping merchandise to our main distribution facility and retail locations, as well as fulfilling Internet orders.
The terms of our debt instruments impose financial and operating restrictions.
Our credit facility and term loan agreements each contain restrictive covenants that limit our ability to engage in activities that may be in our long term best interests. These covenants limit or restrict, among other things, our ability to:
| • | incur additional indebtedness; |
| • | pay dividends or make other distributions in respect of our equity securities, or purchase or redeem capital stock, or make certain investments; |
| • | have our subsidiaries pay dividends, make loans or transfer assets to us; |
| • | sell assets, including the capital stock of our subsidiaries; |
| • | enter into any transactions with our affiliates; |
| • | transfer any capital stock of any subsidiary or permit any subsidiary to issue capital stock; |
| • | create liens; |
| • | enter into certain sale/leaseback transactions; |
| • | effect a consolidation or merger or transfer of all or substantially all of our assets; and |
| • | engage in other lines of business unless reasonably related to our existing business. |
These limitations and restrictions may adversely affect our ability to finance our future operations or capital needs or engage in other business activities that may be in our best interests. In addition, our ability to borrow under the credit facility is subject to borrowing base requirements. If we breach any of the covenants in our credit facility or term loan agreements, we may be in default under our credit facility and/or our term loan. If we default, the lenders under our term loan or the lender under our credit facility could declare all borrowings owed to them, including accrued interest and other fees, to be due and payable.
Our charter documents contain certain anti-takeover provisions, and we are entitled to certain other protective provisions under Delaware law.
We are a Delaware corporation and the anti-takeover provisions of Delaware law impose various impediments to the ability of a third party to acquire control of the Company, even if a change of control would be beneficial to our existing stockholders. We also have adopted a stockholder rights plan, commonly known as a “poison pill,” that entitles our stockholders to acquire additional shares of us, or a potential acquirer of us, at a substantial discount to their market value in the event of an attempted takeover. In addition, our amended and restated certificate of incorporation and bylaws contain provisions that may discourage, delay or prevent a merger or acquisition involving us that our stockholders may consider favorable by, among other things:
| • | authorizing the issuance of preferred stock, the terms of which may be determined at the discretion of our Board of Directors; |
| • | restricting the ability of stockholders to call special meetings of stockholders; and |
| • | establishing advance notice requirements for nominations for election to our Board of Directors or for proposing matters that can be acted on by stockholders at meetings. |
These provisions may also reduce the market value of our common stock.
27
If we are unable to pay quarterly dividends at intended levels, our reputation and stock price may be harmed.
Our quarterly cash dividend is currently $0.175 per common share. The dividends declared and paid by us to date meet all requirements under the terms of our debt agreements and applicable law; however, any future payment of dividends will be at the discretion of our Board of Directors and the ability to pay any such future dividends will be based upon certain restrictive financial covenants, earnings, capital requirements and our financial condition, among other factors, at the time any such dividend is considered. In addition, our ability to pay dividends may be subject to certain economic, financial, competitive and other factors that are beyond our control. Our Board of Directors may, at its discretion, decrease the intended level of dividends or entirely discontinue the payment of dividends at any time. Any failure to pay dividends after we have announced our intention to do so may negatively impact our reputation and investor confidence in us, and may also negatively impact our stock price.
Any increase in our sales and marketing efforts that target markets outside the United States and Canada would expose us to additional risks associated with international operations.
Although an immaterial amount of our sales are currently derived from international sales outside of Canada, we are actively seeking to expand our international presence, and we have begun to do so through franchise arrangements in the Middle East, India and South Korea. We may not be successful in these efforts. International operations and sales subject us to risks and challenges that we would otherwise not face if we conducted our business only in the United States. For example, we may depend on third parties to market our products through foreign sales channels, and we may be challenged by laws and business practices favoring local competitors. In addition, our ability to succeed in foreign markets will depend on our ability to protect our intellectual property. We must also adapt our pricing structure to address different pricing environments and may face difficulty in enforcing revenue collection internationally. Emerging markets are a significant focus of our international growth strategy. The developing nature of these markets presents a number of risks. Deterioration of social, political, labor or economic conditions in a specific country or region and difficulties in staffing and managing foreign operations may also adversely affect our operations or financial results or those of our franchisees. Operations outside the United States may be affected by changes in trade protection laws, policies and measures, and other regulatory requirements affecting trade and investment, including the Foreign Corrupt Practices Act and local laws prohibiting corrupt payments. To the extent we achieve significant sales outside of the United States in the future, we may have significant exposure to fluctuating foreign currency exchange rates.
We could have failures in our system of internal controls causing us to inaccurately report our financial results or to fail to prevent fraud.
We maintain a documented system of internal controls which is reviewed and monitored by management, who meet regularly with our Audit Committee of the Board of Directors. We believe we have a well-designed system to maintain adequate internal controls on the business. We cannot assure you that there will not be any control deficiencies in the future. Should we become aware of any control deficiencies, we would report them to the Audit Committee and, if significant, recommend prompt remediation. We devote significant resources to document, test, monitor and improve our internal controls and will continue to do so; however, we cannot be certain that these measures will ensure that our controls are adequate in the future or that adequate controls will be effective in preventing fraud. If we fail to maintain an effective system of internal controls, we may not be able to accurately report our financial results or prevent fraud. Any failures in the effectiveness of our internal controls could have a material adverse effect on our financial condition or operating results or cause us to fail to meet reporting obligations.
| Item 1B. | Unresolved Staff Comments |
Not applicable.
28
| Item 2. | Properties |
We own our principal executive offices and distribution facility, which is located at 456 North Fifth Street, Philadelphia, Pennsylvania, subject to a mortgage under the terms of which we owe approximately $2.0 million as of September 30, 2011. This facility consists of approximately 318,000 square feet, of which approximately 45,000 square feet is dedicated to office space and the remaining square footage is used for finished goods warehousing and distribution. In August 2002, we entered into a ten-year lease, with a renewal option for two successive five year terms, for a facility located at 2001 Kitty Hawk Avenue, Philadelphia, Pennsylvania in the Philadelphia Naval Business Center. The area leased at this facility, which we use for some finished goods warehousing and distribution, raw material cutting and warehousing, and office space consists of approximately 69,000 square feet of space, of which 8,000 square feet is dedicated to office space. From time to time we may also utilize third-party warehousing services in the Philadelphia, Pennsylvania area when we have increased storage requirements. These services essentially operate on a month-to-month basis. We believe that these facilities will be adequate to support our anticipated distribution needs for the near term and, potentially, longer. In the event we need additional space to meet our future distribution needs, we believe that such space would be readily available. Our facilities are subject to state and local regulations that range from building codes to health and safety regulations.
We lease our store premises for initial terms averaging from five to ten years. Certain leases allow us to terminate or reduce our obligations at specified points in time in the event that the applicable store does not achieve a specified sales volume. Some of our store leases also provide for contingent payments based on sales volume, escalations of the base rent, as well as increases in operating costs, marketing costs and real estate taxes.
As of September 30, 2011, the following numbers of store leases are set to expire as listed in the table below. We do not expect the expiration of any leases to have a material adverse impact on our business or operations.
| Fiscal Year Leases Expire |
Number of Stores |
|||
| 2012 |
101 | |||
| 2013 |
135 | |||
| 2014 |
149 | |||
| 2015 |
77 | |||
| 2016 |
53 | |||
| 2017 and later |
143 | |||
|
|
|
|||
| Total |
658 | |||
|
|
|
|||
In addition to the stores we operate, we have arrangements with department and specialty stores, including Macy’s, Sears, Babies“R”Us, Bloomingdale’s, Boscov’s and Gordmans to operate maternity apparel departments in their stores. These leased departments typically involve the lease partner collecting all of the revenue from the leased department. The revenue is remitted to us, less a fixed percentage of the net sales earned by the lease partner as stipulated in the agreement. We provide at least some amount of staffing for each of the leased departments, with the amount varying depending on the specific arrangement. Generally, under each of our leased department agreements, our lease partner has the right to terminate any or all of our rights to operate our leased departments in their stores subject to varying notice requirements.
| Item 3. | Legal Proceedings |
From time to time, we are named as a defendant in legal actions arising from our normal business activities. Litigation is inherently unpredictable and although the amount of any liability that could arise with respect to currently pending actions cannot be accurately predicted, we do not believe that the resolution of any pending action will have a material adverse effect on our financial position or liquidity.
| Item 4. | (Removed and Reserved) |
29
PART II.
| Item 5. | Market for Registrant’s Common Equity, Related Stockholder Matters and Issuer Purchases of Equity Securities |
Our common stock is traded on the Nasdaq Global Market under the symbol “DEST.” On January 26, 2011, we announced that our Board of Directors approved a two-for-one split of our common stock in the form of a stock dividend, pursuant to which on March 1, 2011, stockholders of record at the close of business on February 16, 2011 received one additional common share for every share held. In accordance with the provisions of our equity award plans and as determined by our Board of Directors, the number of shares available for issuance, the number of shares subject to outstanding equity awards and the exercise prices of outstanding stock option awards were also adjusted to equitably reflect the effect of the two-for-one stock split. All share and per share amounts give effect to the stock split and have been adjusted retroactively for all periods presented.
The following table sets forth for the periods indicated below the reported high and low sales prices of our common stock, as reported on the Nasdaq Global Market, and the per share amount of cash dividends paid on our common stock:
| Market Prices | Dividends Declared and Paid |
|||||||||||
| High | Low | |||||||||||
| Fiscal Year Ended September 30, 2011: |
||||||||||||
| Quarter ended December 31, 2010 |
$ | 19.50 | $ | 15.93 | $ | — | ||||||
| Quarter ended March 31, 2011 |
23.33 | 18.92 | 0.175 | |||||||||
| Quarter ended June 30, 2011 |
25.28 | 15.66 | 0.175 | |||||||||
| Quarter ended September 30, 2011 |
21.14 | 12.58 | 0.175 | |||||||||
| Fiscal Year Ended September 30, 2010: |
||||||||||||
| Quarter ended December 31, 2009 |
$ | 11.41 | $ | 8.40 | $ | — | ||||||
| Quarter ended March 31, 2010 |
12.93 | 8.78 | — | |||||||||
| Quarter ended June 30, 2010 |
16.27 | 11.88 | — | |||||||||
| Quarter ended September 30, 2010 |
16.63 | 12.10 | — | |||||||||
As of December 5, 2011, there were 1,256 holders of record and 2,218 estimated beneficial holders of our common stock.
On January 26, 2011, we announced the initiation of a regular quarterly cash dividend. During fiscal 2011 we paid cash dividends of approximately $6.9 million (reflecting three quarterly dividend payments or a total of $0.525 per share after giving effect to our March 1, 2011 stock split). On November 9, 2011 we declared a quarterly cash dividend of $0.175 per share payable on December 28, 2011, which will require approximately $2.3 million of available cash. Based on our current quarterly dividend rate of $0.175 per share, we project we will pay approximately $9.3 million of cash dividends for fiscal 2012. The terms of our senior secured Term Loan B due March 13, 2013 (the “Term Loan”) and our credit facility provide certain restrictions on our ability to declare dividends and limit the amount of dividends we may pay on our common stock. The dividends declared and paid by us meet all requirements under the terms of our Term Loan and our credit facility; however, any future payment of dividends will be at the discretion of our Board of Directors and will be based upon certain restrictive financial covenants, earnings, capital requirements and our financial condition, among other factors, at the time any such dividend is considered.
Under our Amended and Restated 2005 Equity Incentive Plan (the “2005 Plan”), awards may be granted in the form of options, stock appreciation rights, restricted stock or restricted stock units. Up to 2,000,000 shares of our common stock may be issued in respect of awards under our 2005 Plan, with no more than 1,000,000 of those shares permitted to be issued in respect of restricted stock or restricted stock units granted under the 2005 Plan.
In July 2008, our Board of Directors approved a program to repurchase up to $7.0 million of our outstanding common stock. Under the program, we may repurchase shares from time to time through solicited or unsolicited
30
transactions in the open market or in negotiated or other transactions. The program will expire on July 31, 2012. There have been no repurchases of common stock under the program to date.
Stock Price Performance Graph
The graph below compares the cumulative total stockholder return on our common stock for the period from September 30, 2006 to September 30, 2011, with the cumulative total return of the Standard & Poor’s 500 Index and the Standard & Poor’s 500 Apparel Retail Index. The comparison assumes $100 was invested on September 30, 2006 in our common stock and in each of the foregoing indices and assumes reinvestment of dividends.
COMPARISON OF 5 YEAR CUMULATIVE TOTAL RETURN*
Among Destination Maternity Corporation, the S&P 500 Index
and the S&P 500 Apparel Retail Index
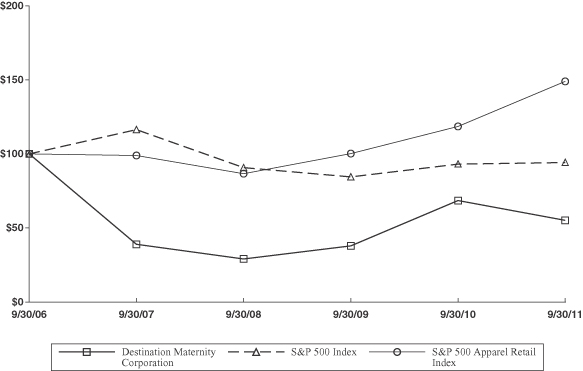
| * | $100 invested on September 30, 2006 in stock or index—including reinvestment of dividends. |
Fiscal year ending September 30:
| 2006 | 2007 | 2008 | 2009 | 2010 | 2011 | |||||||||||||||||||
| Destination Maternity Corporation |
$ | 100.00 | $ | 38.80 | $ | 28.84 | $ | 37.68 | $ | 68.41 | $ | 55.12 | ||||||||||||
| S&P 500 |
$ | 100.00 | $ | 116.44 | $ | 90.85 | $ | 84.58 | $ | 93.17 | $ | 94.24 | ||||||||||||
| S&P 500 Apparel Retail Index |
$ | 100.00 | $ | 99.06 | $ | 86.58 | $ | 100.18 | $ | 118.57 | $ | 149.12 | ||||||||||||
31
| Item 6. | Selected Consolidated Financial and Operating Data |
The following tables set forth selected consolidated statement of operations data, operating data, other consolidated financial data, and consolidated balance sheet data as of and for the periods indicated. The selected consolidated statement of operations and balance sheet data for each of the five fiscal years presented below are derived from our consolidated financial statements. You should read this information in conjunction with “Management’s Discussion and Analysis of Financial Condition and Results of Operations” and our consolidated financial statements and the related notes included elsewhere in this report.
| Year Ended September 30, | ||||||||||||||||||||
| 2011 | 2010 | 2009 | 2008 | 2007 | ||||||||||||||||
| (in thousands, except per share amounts) | ||||||||||||||||||||
| Consolidated Statement of Operations Data: |
||||||||||||||||||||
| Net sales |
$ | 545,394 | $ | 531,192 | $ | 531,251 | $ | 564,602 | $ | 581,371 | ||||||||||
| Cost of goods sold |
248,497 | 240,166 | 248,476 | 281,561 | 281,155 | |||||||||||||||
|
|
|
|
|
|
|
|
|
|
|
|||||||||||
| Gross profit |
296,897 | 291,026 | 282,775 | 283,041 | 300,216 | |||||||||||||||
| Selling, general and administrative expenses |
257,421 | 251,653 | 259,552 | 271,592 | 279,719 | |||||||||||||||
| Store closing, asset impairment and asset disposal expenses |
1,039 | 2,282 | 536 | 2,916 | 1,788 | |||||||||||||||
| Restructuring and other charges |
193 | 5,658 | 1,557 | 3,461 | — | |||||||||||||||
| Goodwill impairment expense |
— | — | 50,389 | — | — | |||||||||||||||
|
|
|
|
|
|
|
|
|
|
|
|||||||||||
| Operating income (loss) |
38,244 | 31,433 | (29,259 | ) | 5,072 | 18,709 | ||||||||||||||
| Interest expense, net |
2,233 | 3,300 | 4,720 | 6,974 | 9,848 | |||||||||||||||
| Loss on extinguishment of debt |
37 | 51 | 123 | 97 | 9,423 | |||||||||||||||
|
|
|
|
|
|
|
|
|
|
|
|||||||||||
| Income (loss) before income taxes |
35,974 | 28,082 | (34,102 | ) | (1,999 | ) | (562 | ) | ||||||||||||
| Income tax provision (benefit) |
12,986 | 11,253 | 6,580 | (610 | ) | (169 | ) | |||||||||||||
|
|
|
|
|
|
|
|
|
|
|
|||||||||||
| Net income (loss) |
$ | 22,988 | $ | 16,829 | $ | (40,682 | ) | $ | (1,389 | ) | $ | (393 | ) | |||||||
|
|
|
|
|
|
|
|
|
|
|
|||||||||||
| Net income (loss) per share—Basic |
$ | 1.79 | $ | 1.37 | $ | (3.39 | ) | $ | (0.12 | ) | $ | (0.03 | ) | |||||||
|
|
|
|
|
|
|
|
|
|
|
|||||||||||
| Average shares outstanding—Basic |
12,820 | 12,304 | 11,985 | 11,849 | 11,605 | |||||||||||||||
|
|
|
|
|
|
|
|
|
|
|
|||||||||||
| Net income (loss) per share—Diluted |
$ | 1.75 | $ | 1.33 | $ | (3.39 | ) | $ | (0.12 | ) | $ | (0.03 | ) | |||||||
|
|
|
|
|
|
|
|
|
|
|
|||||||||||
| Average shares outstanding—Diluted |
13,120 | 12,691 | 11,985 | 11,849 | 11,605 | |||||||||||||||
|
|
|
|
|
|
|
|
|
|
|
|||||||||||
32
| Year Ended September 30, | ||||||||||||||||||||
| 2011 | 2010 | 2009 | 2008 | 2007 | ||||||||||||||||
|
(unaudited; in thousands, except operating data, ratios and per share amounts) |
||||||||||||||||||||
| Operating Data: |
||||||||||||||||||||
| Comparable retail sales increase (decrease) (1) |
0.1 | % | (3.4 | )% | (4.6 | )% | 0.9 | % | (4.9 | )% | ||||||||||
| Comparable store sales increase (decrease) (2) |
(1.4 | )% | (5.1 | )% | (4.3 | )% | 0.2 | % | (4.8 | )% | ||||||||||
| Internet sales increase (decrease) |
22.0 | % | 32.3 | % | (8.7 | )% | 15.9 | % | (6.2 | )% | ||||||||||
| Average net sales per gross square foot (3) |
$ | 275 | $ | 273 | $ | 290 | $ | 302 | $ | 299 | ||||||||||
| Average net sales per store (3) |
$ | 566,000 | $ | 551,000 | $ | 573,000 | $ | 588,000 | $ | 568,000 | ||||||||||
| Gross store square footage at period end (4) |
1,376,000 | 1,445,000 | 1,462,000 | 1,492,000 | 1,498,000 | |||||||||||||||
| Gross retail location square footage at period end (5) |
2,078,000 | 1,750,000 | 1,619,000 | 1,623,000 | 1,811,000 | |||||||||||||||
| Number of retail locations at period end: |
||||||||||||||||||||
| Motherhood Maternity stores |
535 | 567 | 591 | 616 | 635 | |||||||||||||||
| Mimi Maternity stores (6) |
— | — | — | 89 | 100 | |||||||||||||||
| A Pea in the Pod stores (6) |
43 | 56 | 67 | 30 | 32 | |||||||||||||||
| Destination Maternity stores (6) |
80 | 75 | 66 | 19 | 14 | |||||||||||||||
|
|
|
|
|
|
|
|
|
|
|
|||||||||||
| Total stores |
658 | 698 | 724 | 754 | 781 | |||||||||||||||
| Leased departments |
1,694 | 1,027 | 360 | 278 | 795 | |||||||||||||||
|
|
|
|
|
|
|
|
|
|
|
|||||||||||
| Total retail locations |
2,352 | 1,725 | 1,084 | 1,032 | 1,576 | |||||||||||||||
|
|
|
|
|
|
|
|
|
|
|
|||||||||||
| Other Consolidated Financial Data: |
||||||||||||||||||||
| Adjusted EBITDA (7)(8) |
$ | 54,395 | $ | 48,347 | $ | 38,762 | $ | 25,501 | $ | 38,579 | ||||||||||
| Adjusted EBITDA margin (adjusted EBITDA as a percentage of net sales) (8) |
10.0 | % | 9.1 | % | 7.3 | % | 4.5 | % | 6.6 | % | ||||||||||
| Ratio of total debt to Adjusted EBITDA (8) |
0.6 | x | 0.9 | x | 1.5 | x | 3.1 | x | 2.4 | x | ||||||||||
| Ratio of Adjusted EBITDA to interest expense, net (8) |
24.4 | x | 14.7 | x | 8.2 | x | 3.7 | x | 3.9 | x | ||||||||||
| Adjusted EBITDA before restructuring and other charges (7)(8) |
54,588 | 54,005 | 40,191 | 28,717 | 38,579 | |||||||||||||||
| Adjusted EBITDA margin before restructuring and other charges (8) |
10.0 | % | 10.2 | % | 7.6 | % | 5.1 | % | 6.6 | % | ||||||||||
| Adjusted net income (loss), before goodwill impairment expense (8) |
22,988 | 16,829 | 9,707 | (1,389 | ) | (393 | ) | |||||||||||||
| Adjusted net income (loss) per share—Diluted, before goodwill impairment expense (8) |
1.75 | 1.33 | 0.80 | (0.12 | ) | (0.03 | ) | |||||||||||||
| Adjusted net income, before goodwill impairment expense, restructuring and other charges, stock-based compensation expense and loss on extinguishment of debt (8) |
24,598 | 21,585 | 12,004 | 2,273 | 6,637 | |||||||||||||||
| Adjusted net income per share—Diluted, before goodwill impairment expense, restructuring and other charges, stock-based compensation expense and loss on extinguishment of debt (8) |
1.87 | 1.70 | 0.99 | 0.19 | 0.54 | |||||||||||||||
| Cash flows provided by operating activities |
21,443 | 25,974 | 42,525 | 27,822 | 27,398 | |||||||||||||||
| Cash flows used in investing activities |
(11,079 | ) | (12,241 | ) | (12,455 | ) | (13,347 | ) | (8,112 | ) | ||||||||||
| Cash flows used in financing activities |
(19,699 | ) | (9,726 | ) | (21,592 | ) | (12,457 | ) | (28,060 | ) | ||||||||||
| Capital expenditures |
(12,270 | ) | (10,448 | ) | (12,639 | ) | (15,688 | ) | (15,444 | ) | ||||||||||
| Consolidated Balance Sheet Data (at end of period): |
||||||||||||||||||||
| Cash and cash equivalents |
$ | 15,285 | $ | 24,633 | $ | 20,626 | $ | 12,148 | $ | 10,130 | ||||||||||
| Working capital |
75,984 | 63,650 | 50,580 | 61,611 | 64,923 | |||||||||||||||
| Total assets |
198,772 | 205,154 | 196,007 | 256,248 | 275,925 | |||||||||||||||
| Total debt |
31,342 | 45,161 | 57,409 | 78,646 | 93,180 | |||||||||||||||
| Net debt (8)(9) |
16,057 | 20,528 | 36,783 | 66,498 | 83,050 | |||||||||||||||
| Stockholders’ equity |
92,695 | 71,598 | 49,800 | 89,468 | 88,523 | |||||||||||||||
| (1) | Comparable retail sales figures represent comparable store sales and Internet sales. |
33
| (2) | Comparable store sales figures represent sales at retail locations that have been in operation by us for at least twelve full months at the beginning of the period for which such data is presented. Comparable store sales figures do not include retail locations opened during a period even if such location was opened in connection with the closure of other retail locations in the same geographic area (including, for example, the opening of a new Destination Maternity combo store or superstore). Also, our comparable store sales figures generally do not include: (i) retail locations which change format; (ii) retail locations which are expanded or relocated if the square footage of the retail location has changed by 20% or more; or (iii) in the case of relocations only, if the retail location is not in the same immediate geographical vicinity (such as the same mall or same street) after the relocation. As used in this Form 10-K, the term “retail locations” includes stores and leased departments, and excludes locations where Kohl’s sells our products under an exclusive product and license agreement and international franchise locations. |
| (3) | Based on stores in operation by us during the entire twelve-month period (which does not include leased department or licensed relationships). |
| (4) | Based on stores in operation by us at the end of the period. |
| (5) | Based on all retail locations in operation at the end of the period. |
| (6) | In fiscal 2009, as part of our merchandise brand and store nameplate restructuring, we renamed our single-brand Mimi Maternity stores as A Pea in the Pod, and we renamed our multi-brand Mimi Maternity stores as Destination Maternity. |
| (7) | Adjusted EBITDA represents operating income (loss) before deduction for the following non-cash charges: (i) depreciation and amortization expense; (ii) loss on impairment of tangible and intangible assets; (iii) loss (gain) on disposal of assets; and (iv) stock-based compensation expense. We have presented Adjusted EBITDA to enhance your understanding of our operating results. |
| (8) | Other Consolidated Financial Data and Consolidated Balance Sheet Data contain non-GAAP financial measures and ratios within the meaning of the SEC’s Regulation G, including: (i) Adjusted EBITDA; (ii) Adjusted EBITDA margin; (iii) Ratio of total debt to Adjusted EBITDA; (iv) Ratio of Adjusted EBITDA to interest expense, net; (v) Adjusted EBITDA before restructuring and other charges; (vi) Adjusted EBITDA margin before restructuring and other charges; (vii) Adjusted net income (loss), before goodwill impairment expense; (viii) Adjusted net income (loss) per share—Diluted, before goodwill impairment expense; (ix) Adjusted net income, before goodwill impairment expense, restructuring and other charges, stock-based compensation expense and loss on extinguishment of debt; (x) Adjusted net income per share—Diluted, before goodwill impairment expense, restructuring and other charges, stock-based compensation expense and loss on extinguishment of debt; and (xi) Net debt. We believe that each of these non-GAAP financial measures and ratios provides useful information about our results of operations and/or financial position to both investors and management. Each non-GAAP financial measure and ratio is provided because we believe it is an important measure of financial performance used in the retail industry to measure operating results, to determine the value of companies within the industry and to define standards for borrowing from institutional lenders. We use each of these non-GAAP financial measures and ratios as a measure of the performance of the Company. We provide these non-GAAP financial measures and ratios to investors to assist them in performing their analysis of our historical operating results. The non-GAAP financial measures and ratios included in Other Consolidated Financial Data reflect a measure of our operating results before consideration of certain charges and consequently, none of these measures and ratios should be construed as an alternative to net income (loss) or operating income (loss) as an indicator of our operating performance, or as an alternative to cash flows from operating activities as a measure of our liquidity, as determined in accordance with generally accepted accounting principles. We may calculate each of these non-GAAP financial measures and ratios differently than other companies. With respect to the non-GAAP financial measures included in Other Consolidated Financial Data, we have presented below a reconciliation of the non-GAAP financial measures to the most directly comparable GAAP financial measures. |
| (9) | Net debt represents total debt minus cash and cash equivalents and short-term investments. |
34
Reconciliation of Net Income (Loss) to Adjusted EBITDA
and Adjusted EBITDA Before Restructuring and Other Charges
(in thousands)
(unaudited)
| Year Ended September 30, | ||||||||||||||||||||
| 2011 | 2010 | 2009 | 2008 | 2007 | ||||||||||||||||
| Net income (loss) |
$ | 22,988 | $ | 16,829 | $ | (40,682 | ) | $ | (1,389 | ) | $ | (393 | ) | |||||||
| Add: income tax provision (benefit) |
12,986 | 11,253 | 6,580 | (610 | ) | (169 | ) | |||||||||||||
| Add: interest expense, net |
2,233 | 3,300 | 4,720 | 6,974 | 9,848 | |||||||||||||||
| Add: loss on extinguishment of debt |
37 | 51 | 123 | 97 | 9,423 | |||||||||||||||
|
|
|
|
|
|
|
|
|
|
|
|||||||||||
| Operating income (loss) |
38,244 | 31,433 | (29,259 | ) | 5,072 | 18,709 | ||||||||||||||
| Add: depreciation and amortization expense |
12,769 | 12,917 | 14,982 | 15,974 | 16,410 | |||||||||||||||
| Add: loss on impairment of long-lived assets |
768 | 1,865 | 667 | 1,628 | 1,781 | |||||||||||||||
| Add: goodwill impairment expense |
— | — | 50,389 | — | — | |||||||||||||||
| Add: loss (gain) on disposal of assets |
270 | 196 | (48 | ) | 546 | (422 | ) | |||||||||||||
| Add: stock-based compensation expense |
2,344 | 1,936 | 2,031 | 2,281 | 2,101 | |||||||||||||||
|
|
|
|
|
|
|
|
|
|
|
|||||||||||
| Adjusted EBITDA |
54,395 | 48,347 | 38,762 | 25,501 | 38,579 | |||||||||||||||
| Add: restructuring and other charges (1) |
193 | 5,658 | 1,429 | 3,216 | — | |||||||||||||||
|
|
|
|
|
|
|
|
|
|
|
|||||||||||
| Adjusted EBITDA before restructuring and other charges |
$ | 54,588 | $ | 54,005 | $ | 40,191 | $ | 28,717 | $ | 38,579 | ||||||||||
|
|
|
|
|
|
|
|
|
|
|
|||||||||||
| Adjusted EBITDA margin |
10.0 | % | 9.1 | % | 7.3 | % | 4.5 | % | 6.6 | % | ||||||||||
| Adjusted EBITDA margin before restructuring and other charges |
10.0 | % | 10.2 | % | 7.6 | % | 5.1 | % | 6.6 | % | ||||||||||
| (1) | Excludes accelerated depreciation expense of $128 and $245 for the years ended September 30, 2009 and 2008, respectively, included in depreciation and amortization expense above. |
35
Reconciliation of Net Income (Loss) to Adjusted Net Income (Loss), Before Goodwill
Impairment Expense and Adjusted Net Income, Before Goodwill Impairment Expense,
Restructuring and Other Charges, Stock-Based Compensation Expense and Loss on
Extinguishment of Debt, and Net Income (Loss) Per Share—Diluted to Adjusted Net Income
(Loss) Per Share—Diluted, Before Goodwill Impairment Expense and Adjusted Net Income
Per Share—Diluted, Before Goodwill Impairment Expense, Restructuring and Other
Charges, Stock-Based Compensation Expense and Loss on Extinguishment of Debt
(in thousands, except per share amounts)
(unaudited)
| Year Ended September 30, | ||||||||||||||||||||
| 2011 | 2010 | 2009 | 2008 | 2007 | ||||||||||||||||
| Net income (loss), as reported |
$ | 22,988 | $ | 16,829 | $ | (40,682 | ) | $ | (1,389 | ) | $ | (393 | ) | |||||||
| Add: goodwill impairment expense, net of tax |
— | — | 50,389 | — | — | |||||||||||||||
|
|
|
|
|
|
|
|
|
|
|
|||||||||||
| Adjusted net income (loss), before goodwill impairment expense |
22,988 | 16,829 | 9,707 | (1,389 | ) | (393 | ) | |||||||||||||
| Add: restructuring and other charges, net of tax |
120 | 3,514 | 968 | 2,171 | — | |||||||||||||||
| Add: stock-based compensation expense, net of tax |
1,467 | 1,210 | 1,253 | 1,430 | 1,282 | |||||||||||||||
| Add: loss on extinguishment of debt, net of tax |
23 | 32 | 76 | 61 | 5,748 | |||||||||||||||
|
|
|
|
|
|
|
|
|
|
|
|||||||||||
| Adjusted net income, before goodwill impairment expense, restructuring and other charges, stock-based compensation expense and loss on extinguishment of debt |
$ | 24,598 | $ | 21,585 | $ | 12,004 | $ | 2,273 | $ | 6,637 | ||||||||||
|
|
|
|
|
|
|
|
|
|
|
|||||||||||
| Net income (loss) per share—Diluted, as reported |
$ | 1.75 | $ | 1.33 | $ | (3.39 | ) | $ | (0.12 | ) | $ | (0.03 | ) | |||||||
|
|
|
|
|
|
|
|
|
|
|
|||||||||||
| Average shares outstanding—Diluted, as reported (1) |
13,120 | 12,691 | 11,985 | 11,849 | 11,605 | |||||||||||||||
|
|
|
|
|
|
|
|
|
|
|
|||||||||||
| Adjusted net income (loss) per share—Diluted, before goodwill impairment expense |
$ | 1.75 | $ | 1.33 | $ | 0.80 | $ | (0.12 | ) | $ | (0.03 | ) | ||||||||
|
|
|
|
|
|
|
|
|
|
|
|||||||||||
| Average shares outstanding—Diluted (1) |
13,120 | 12,691 | 12,135 | 11,849 | 11,605 | |||||||||||||||
|
|
|
|
|
|
|
|
|
|
|
|||||||||||
| Adjusted net income per share—Diluted, before goodwill impairment expense, restructuring and other charges, stock-based compensation expense and loss on extinguishment of debt |
$ | 1.87 | $ | 1.70 | $ | 0.99 | $ | 0.19 | $ | 0.54 | ||||||||||
|
|
|
|
|
|
|
|
|
|
|
|||||||||||
| Average shares outstanding—Diluted (1) |
13,120 | 12,691 | 12,135 | 12,096 | 12,270 | |||||||||||||||
|
|
|
|
|
|
|
|
|
|
|
|||||||||||
| (1) | For fiscal years with net loss or adjusted net loss, diluted shares reflect the elimination of the dilutive impact of outstanding stock options and restricted stock. |
36
| Item 7. | Management’s Discussion and Analysis of Financial Condition and Results of Operations |
Overview
The following discussion should be read in conjunction with the consolidated financial statements and their related notes included elsewhere in this report.
We are the leading designer and retailer of maternity apparel in the United States with 2,352 retail locations, including 658 stores in all 50 states, Puerto Rico, Guam and Canada, and 1,694 leased departments located within department stores and baby specialty stores throughout the United States and Puerto Rico. We are also the exclusive provider of maternity apparel to Kohl’s, which operates approximately 1,127 stores throughout the United States. During fiscal 2011, we operated our stores under the Motherhood Maternity, A Pea in the Pod and Destination Maternity retail nameplates. We are the exclusive maternity apparel provider in each of our leased department relationships. During the second quarter of fiscal 2011 we significantly expanded our leased department relationship with Macy’s from 115 Macy’s locations to 632 Macy’s locations throughout the United States, offering a mix of Motherhood Maternity and A Pea in the Pod branded merchandise. We also are expanding internationally and have entered into exclusive store franchise and product supply relationships in the Middle East, India and South Korea. As of September 30, 2011, we have 66 international franchised locations, comprised of 15 stand-alone stores in the Middle East and South Korea operated under one of our retail nameplates, and 51 shop-in-shop locations in India and South Korea in which we have a Company branded department operated under retail nameplates owned by our franchise partners. Finally, we also sell merchandise on the Internet, primarily through DestinationMaternity.com and our various brand-specific websites. We design and contract manufacture approximately 90% of the merchandise we sell using sewing factories located throughout the world, predominantly outside of the United States. Substantially all of the merchandise produced outside of the United States is paid for in United States dollars.
In assessing the performance of our business, we consider a variety of operational and financial measures. The key measures for determining how our business is performing are net income determined in accordance with generally accepted accounting principles (“GAAP net income”) and the corresponding net income (loss) (or earnings) per share (diluted), net income before restructuring and other charges, stock-based compensation expense and loss on extinguishment of debt (“Non-GAAP adjusted net income”) and the corresponding earnings per share (diluted), Adjusted EBITDA, Adjusted EBITDA before restructuring and other charges, Net sales, and Comparable retail sales (which consists of comparable store sales and Internet sales). Adjusted EBITDA represents operating income before deduction for the following non-cash charges: (i) depreciation and amortization expense; (ii) loss on impairment of tangible and intangible assets; (iii) loss (gain) on disposal of assets; and (iv) stock-based compensation expense. Beginning in fiscal 2012, we will no longer report a “comparable store sales” statistic that excludes Internet sales. Since we have numerous cross-channel marketing initiatives and since we aim to serve our customer in whichever channel she chooses to shop, we believe the inclusion of sales from our Internet “stores” or websites is a more meaningful way of reporting our comparable sales results.
Following is a summary of our fiscal 2011 results with regard to each of the key measures noted above:
Fiscal 2011 Financial Results
| • | GAAP net income for fiscal 2011 was $23.0 million, a 37% increase compared to $16.8 million for fiscal 2010. GAAP diluted earnings per share for fiscal 2011 was $1.75, a 32% increase compared to $1.33 for fiscal 2010. |
| • | Non-GAAP adjusted net income for fiscal 2011 was $24.6 million, a 14% increase over the comparably adjusted non-GAAP net income of $21.6 million for fiscal 2010. Non-GAAP adjusted diluted earnings per share for fiscal 2011 was $1.87, a 10% increase compared to $1.70 for fiscal 2010. |
| • | GAAP net income and Non-GAAP adjusted net income for fiscal 2011 include a reduction of state income tax expense, net of federal expense, of $0.9 million, or approximately $0.06 per share (diluted), related to settlements of uncertain income tax positions. |
37
| • | Adjusted EBITDA was $54.4 million for fiscal 2011, an increase of 13% over the $48.3 million of Adjusted EBITDA for fiscal 2010. |
| • | Adjusted EBITDA before restructuring and other charges was $54.6 million for fiscal 2011, an increase of 1% over the $54.0 million of Adjusted EBITDA before restructuring and other charges for fiscal 2010. |
| • | Net sales for fiscal 2011 increased 2.7% to $545.4 million from $531.2 million for fiscal 2010. |
| • | Comparable retail sales for fiscal 2011 increased 0.1% versus a comparable retail sales decrease of 3.4% for fiscal 2010. During fiscal 2011, comparable store sales decreased 1.4%, and Internet sales increased 22%. |
Stock Split
On January 26, 2011, we announced that our Board of Directors approved a two-for-one split of our common stock in the form of a stock dividend, pursuant to which on March 1, 2011, stockholders of record at the close of business on February 16, 2011 received one additional common share for every share held. In accordance with the provisions of our equity award plans and as determined by our Board of Directors, the number of shares available for issuance, the number of shares subject to outstanding equity awards and the exercise prices of outstanding stock option awards were also adjusted to equitably reflect the effect of the two-for-one stock split. All share and per share amounts give effect to the stock split and have been adjusted retroactively for all periods presented.
Results of Operations
The following table sets forth certain operating data from our consolidated statements of operations as a percentage of net sales and as a percentage change for the periods indicated:
| % of Net Sales (1) | % Period to Period Favorable (Unfavorable) |
|||||||||||||||||||
| Year Ended September 30, | Year Ended September 30, | |||||||||||||||||||
| 2011 | 2010 | 2009 | 2011 vs. 2010 | 2010 vs. 2009 | ||||||||||||||||
| Net sales |
100.0 | % | 100.0 | % | 100.0 | % | 2.7 | % | (0.0 | )% | ||||||||||
| Cost of goods sold (2) |
45.6 | 45.2 | 46.8 | (3.5 | ) | 3.3 | ||||||||||||||
|
|
|
|
|
|
|
|||||||||||||||
| Gross profit |
54.4 | 54.8 | 53.2 | 2.0 | 2.9 | |||||||||||||||
| Selling, general and administrative expenses (3) |
47.2 | 47.4 | 48.9 | (2.3 | ) | 3.0 | ||||||||||||||
| Store closing, asset impairment and asset disposal expenses |
0.2 | 0.4 | 0.1 | 54.5 | (325.7 | ) | ||||||||||||||
| Restructuring and other charges |
0.0 | 1.1 | 0.3 | 96.6 | (263.4 | ) | ||||||||||||||
| Goodwill impairment expense |
— | — | 9.5 | — | 100.0 | |||||||||||||||
|
|
|
|
|
|
|
|||||||||||||||
| Operating income (loss) |
7.0 | 5.9 | (5.5 | ) | 21.7 | 207.4 | ||||||||||||||
| Interest expense, net |
0.4 | 0.6 | 0.9 | 32.3 | 30.1 | |||||||||||||||
| Loss on extinguishment of debt |
0.0 | 0.0 | 0.0 | 27.5 | 58.5 | |||||||||||||||
|
|
|
|
|
|
|
|||||||||||||||
| Income (loss) before income taxes |
6.6 | 5.3 | (6.4 | ) | 28.1 | 182.3 | ||||||||||||||
| Income tax provision |
2.4 | 2.1 | 1.2 | (15.4 | ) | (71.0 | ) | |||||||||||||
|
|
|
|
|
|
|
|||||||||||||||
| Net income (loss) |
4.2 | % | 3.2 | % | (7.7 | )% | 36.6 | % | 141.4 | % | ||||||||||
|
|
|
|
|
|
|
|||||||||||||||
| (1) | Components may not add to total due to rounding. |
| (2) | The “cost of goods sold” line item includes: merchandise costs (including customs duty expenses), expenses related to inventory shrinkage, product-related corporate expenses (including expenses related to our payroll, benefit costs and operating expenses of our buying departments), inventory reserves (including lower of cost or market reserves), inbound freight charges, purchasing and receiving costs, inspection costs, warehousing costs, internal transfer costs, and the other costs of our distribution network. |
38
| (3) | The “selling, general and administrative expenses” line item includes: advertising and marketing expenses, corporate administrative expenses, store expenses (including store payroll and store occupancy expenses), and store opening expenses. |
The following tables set forth certain information regarding the number of our retail locations and international franchised locations, for the fiscal years indicated. Retail locations include stores and leased maternity apparel departments and exclude locations where Kohl’s sells our products under an exclusive product and license agreement and international franchised locations.
| Year Ended September 30, | ||||||||||||||||||||||||||||||||||||
| 2011 | 2010 | 2009 | ||||||||||||||||||||||||||||||||||
| Retail Locations (1) |
Stores | Leased Departments |
Total Retail Locations |
Stores | Leased Departments |
Total Retail Locations |
Stores | Leased Departments |
Total Retail Locations |
|||||||||||||||||||||||||||
| Beginning of period |
698 | 1,027 | 1,725 | 724 | 360 | 1,084 | 754 | 278 | 1,032 | |||||||||||||||||||||||||||
| Opened |
12 | 694 | 706 | 11 | 680 | 691 | 13 | 85 | 98 | |||||||||||||||||||||||||||
| Closed |
(52 | ) | (27 | ) | (79 | ) | (37 | ) | (13 | ) | (50 | ) | (43 | ) | (3 | ) | (46 | ) | ||||||||||||||||||
|
|
|
|
|
|
|
|
|
|
|
|
|
|
|
|
|
|
|
|||||||||||||||||||
| End of period |
658 | 1,694 | 2,352 | 698 | 1,027 | 1,725 | 724 | 360 | 1,084 | |||||||||||||||||||||||||||
|
|
|
|
|
|
|
|
|
|
|
|
|
|
|
|
|
|
|
|||||||||||||||||||
| (1) | Excludes locations were Kohl’s sells our products under an exclusive product and license agreement and international franchised locations. |
| Year Ended September 30, | ||||||||||||||||||||||||||||||||||||
| 2011 | 2010 | 2009 | ||||||||||||||||||||||||||||||||||
| International |
Stores | Shop-in-Shop Locations |
Total International Franchised Locations |
Stores | Shop-in-Shop Locations |
Total International Franchised Locations |
Stores | Shop-in-Shop Locations |
Total International Franchised Locations |
|||||||||||||||||||||||||||
| Beginning of period |
8 | 23 | 31 | 1 | 7 | 8 | — | — | — | |||||||||||||||||||||||||||
| Opened |
7 | 29 | 36 | 7 | 16 | 23 | 1 | 7 | 8 | |||||||||||||||||||||||||||
| Closed |
— | (1 | ) | (1 | ) | — | — | — | — | — | — | |||||||||||||||||||||||||
|
|
|
|
|
|
|
|
|
|
|
|
|
|
|
|
|
|
|
|||||||||||||||||||
| End of period |
15 | 51 | 66 | 8 | 23 | 31 | 1 | 7 | 8 | |||||||||||||||||||||||||||
|
|
|
|
|
|
|
|
|
|
|
|
|
|
|
|
|
|
|
|||||||||||||||||||
We previously announced we would discontinue offering maternity apparel in leased departments in Kmart locations and that we anticipated this discontinuation to occur by the end of October 2011. During October 2011 we closed all remaining 291 Kmart leased department locations. Kmart represented only a small portion of the overall sales generated by our leased department relationship with Sears and Kmart through our agreement with Sears Holdings Corporation. We will continue to operate leased departments in Sears stores throughout the United States. As of October 31, 2011, we operated 530 leased department locations in Sears stores.
Year Ended September 30, 2011 Compared to Year Ended September 30, 2010
Net Sales. Our net sales for fiscal 2011 increased by 2.7% or $14.2 million, to $545.4 million from $531.2 million for fiscal 2010. Comparable retail sales increased 0.1% during fiscal 2011 versus a comparable retail sales decrease of 3.4% during fiscal 2010. During fiscal 2011, comparable store sales decreased 1.4%, based on 917 retail locations, and Internet sales increased 22.0%. During fiscal 2010, comparable store sales decreased 5.1%, based on 915 retail locations, and Internet sales increased 32.3%. The increase in total reported sales for fiscal 2011 compared to fiscal 2010 resulted primarily from: (1) increased sales due to the expansion of our maternity apparel leased department relationship with Macy’s, and (2) increased Internet sales; partially offset by (3) decreased sales related to our continued efforts to close underperforming stores, and (4) the decrease in comparable store sales.
As of September 30, 2011, we operated a total of 658 stores and 2,352 total retail locations: 535 Motherhood Maternity stores (including 85 Motherhood Maternity Outlet stores), 43 A Pea in the Pod stores,
39
80 Destination Maternity stores, and 1,694 leased maternity apparel departments, of which 821 were in Sears and Kmart stores under the Two Hearts Maternity brand and the balance were in other department stores and baby specialty stores, primarily under the Motherhood brand. In addition, our Oh Baby by Motherhood collection is available at Kohl’s stores throughout the United States. In comparison, as of September 30, 2010, we operated a total of 698 stores and 1,027 total retail locations: 567 Motherhood Maternity stores (including 84 Motherhood Maternity Outlet stores), 56 A Pea in the Pod stores, 75 Destination Maternity stores, and 1,027 leased maternity apparel departments. The increase in leased department locations at September 30, 2011 versus September 30, 2010 predominantly reflects the opening of 516 leased department locations in January and February 2011 for our Macy’s expansion, and an additional 168 Sears and Kmart leased department locations in October 2010. As of September 30, 2011, our store total included 80 Destination Maternity multi-brand stores, including 52 Destination Maternity combo stores and 28 Destination Maternity superstores. In comparison, as of September 30, 2010, we operated 75 Destination Maternity multi-brand stores, including 49 Destination Maternity combo stores and 26 Destination Maternity superstores. During fiscal 2011, we opened 12 stores, including 7 Destination Maternity stores, and closed 52 stores, with 11 of these store closings related to Destination Maternity store openings. In addition, during fiscal 2011, we opened 694 leased department locations and closed 27 leased department locations.
Gross Profit. Our gross profit for fiscal 2011 increased by 2.0%, or $5.9 million, to $296.9 million compared to $291.0 million for fiscal 2010, and our gross profit as a percentage of net sales (gross margin) for fiscal 2011 was 54.4% compared to 54.8% for fiscal 2010. The increase in gross profit for fiscal 2011 compared to fiscal 2010 was primarily due to our increased sales, partially offset by the slightly lower gross margin, which resulted primarily from higher promotional activity and markdowns, and to a much lesser extent, from higher product costs for Fall 2011 merchandise.
Selling, General and Administrative Expenses. Our selling, general and administrative expenses for fiscal 2011 increased by 2.3%, or approximately $5.7 million, to $257.4 million from $251.7 million for fiscal 2010. As a percentage of net sales, selling, general and administrative expenses for fiscal 2011 decreased to 47.2% compared to 47.4% for fiscal 2010. The increase in expense for fiscal 2011 compared to fiscal 2010 resulted primarily from higher expenses related to the launch and operation of our additional Macy’s leased department locations (primarily payroll and employee benefit costs, and percentage of net sales occupancy payments to Macy’s) and increased legal expenses, partially offset by lower variable incentive compensation expense and our continued expense control initiatives. The decrease in expense percentage for fiscal 2011 reflects the favorable leverage from our increased sales and our continued expense control initiatives.
Store Closing, Asset Impairment and Asset Disposal Expenses. Our store closing, asset impairment and asset disposal expenses for fiscal 2011 decreased by approximately $1.3 million, to $1.0 million from $2.3 million for fiscal 2010. We incurred impairment charges for write-downs of long-lived assets of $0.8 million for fiscal 2011, as compared to $1.9 million for fiscal 2010. We incurred charges relating to store closings and other asset disposals of approximately $0.2 million for fiscal 2011, as compared to $0.4 million for fiscal 2010.
Restructuring and Other Charges. In fiscal 2011, we incurred pretax expense of $0.2 million from our management transition. In fiscal 2010, we incurred pretax expense of $5.7 million from our strategic restructuring, cost reduction and other initiatives, and our management transition. See “Restructuring and Other Charges” in this Item 7 below for a detailed description of these charges.
Operating Income. Our operating income for fiscal 2011 increased by 21.7%, or $6.8 million, to $38.2 million from $31.4 million for fiscal 2010. Operating income as a percentage of net sales for fiscal 2011 increased to 7.0% from 5.9% for fiscal 2010. The increase in operating income was primarily due to our higher gross profit and significantly lower restructuring and other charges, partially offset by higher selling, general and administrative expenses. The increase in operating income percentage was primarily due to our significantly lower restructuring and other charges.
Interest Expense, Net. Our net interest expense for fiscal 2011 decreased by 32.3%, or $1.1 million, to $2.2 million from $3.3 million in fiscal 2010. This decrease was due to our lower debt level, primarily as a result of the $12.6 million of Term Loan prepayments we made in fiscal 2011 and the $11.0 million of Term Loan
40
prepayments we made in fiscal 2010, and to a much lesser extent, lower interest rates. During fiscal 2011, we did not have any direct borrowings under our credit facility and we did not have any direct borrowings outstanding as of September 30, 2011. During fiscal 2010, our average daily level of direct borrowings under our credit facility was $0.4 million.
Loss on Extinguishment of Debt. During fiscal 2011, we prepaid $12.6 million principal amount of our outstanding Term Loan, which resulted in pretax charges of $37,000, representing the write-off of unamortized deferred financing costs. During fiscal 2010, we prepaid $11.0 million principal amount of our outstanding Term Loan, which resulted in pretax charges totaling $51,000.
Income Taxes. For fiscal 2011, our effective tax rate was 36.1% compared to 40.1% for fiscal 2010. Our effective tax rate for fiscal 2011 was slightly higher than the statutory federal tax rate of 35% primarily due to the effect of state income taxes, net of federal benefit, on our pretax income for fiscal 2011, partially offset by reductions of state income tax expense, net of federal expense, of $0.9 million recorded in the second quarter of fiscal 2011, which were related to settlements of uncertain income tax positions. Our effective tax rate for fiscal 2010 was higher than the statutory federal tax rate of 35% primarily due to the effect of state income taxes, net of federal benefit, and additional income tax expense (including interest and penalties) recognized as required by the accounting standard for uncertain income tax positions. See Note 16 of the Notes to Consolidated Financial Statements, included elsewhere in this report, for the reconciliation of the statutory federal income tax rate to our effective tax rate.
Net Income. Net income for fiscal 2011 increased by 36.6%, to $23.0 million, from $16.8 million for fiscal 2010. Net income per share (diluted) for fiscal 2011 increased by 31.6%, to $1.75 per share from $1.33 per share in fiscal 2010. Net income for fiscal 2011 includes (net of tax) stock-based compensation expense of $1.5 million, restructuring and other charges of $0.1 million, and loss on extinguishment of debt of $23,000. Net income for fiscal 2010 includes (net of tax) restructuring and other charges of $3.5 million, stock-based compensation expense of $1.2 million and loss on extinguishment of debt of $32,000. Before restructuring and other charges, stock-based compensation expense and loss on extinguishment of debt, our fiscal 2011 net income was $24.6 million or $1.87 per share (diluted) compared to $21.6 million or $1.70 per share (diluted) for fiscal 2010.
Our average diluted shares outstanding of 13.1 million for fiscal 2011 was 3.4% higher than the 12.7 million average diluted shares outstanding for fiscal 2010. The increase in average shares outstanding reflects the higher shares outstanding in fiscal 2011 compared to fiscal 2010, primarily as a result of the exercise of stock options and vesting of restricted stock, slightly offset by lower dilutive impact of outstanding stock options and restricted stock for fiscal 2011 compared to fiscal 2010.
Following is a reconciliation of net income and net income per share (“EPS”) (basic) to net income and net income per share (diluted) before restructuring and other charges, stock-based compensation expense and loss on extinguishment of debt for the years ended September 30, 2011 and 2010 (in thousands, except per share amounts):
| Year Ended September 30, 2011 |
Year Ended September 30, 2010 |
|||||||||||||||||||||||
| Net Income |
Shares | EPS | Net Income |
Shares | EPS | |||||||||||||||||||
| As reported |
$ | 22,988 | 12,820 | $ | 1.79 | $ | 16,829 | 12,304 | $ | 1.37 | ||||||||||||||
| Restructuring and other charges, net of tax |
120 | — | 3,514 | — | ||||||||||||||||||||
| Stock-based compensation expense, net of tax |
1,467 | — | 1,210 | — | ||||||||||||||||||||
| Loss on extinguishment of debt, net of tax |
23 | — | 32 | — | ||||||||||||||||||||
| Incremental shares from the assumed exercise of outstanding stock options |
— | 239 | — | 316 | ||||||||||||||||||||
| Incremental shares from the assumed lapse of restrictions on restricted stock awards |
— | 61 | — | 71 | ||||||||||||||||||||
|
|
|
|
|
|
|
|
|
|||||||||||||||||
| As adjusted before restructuring and other charges, stock-based compensation expense and loss on extinguishment of debt |
$ | 24,598 | 13,120 | $ | 1.87 | $ | 21,585 | 12,691 | $ | 1.70 | ||||||||||||||
|
|
|
|
|
|
|
|
|
|||||||||||||||||
41
Year Ended September 30, 2010 Compared to Year Ended September 30, 2009
Net Sales. Our net sales for fiscal 2010 decreased by approximately $0.1 million, to $531.2 million from $531.3 million for fiscal 2009. Comparable retail sales (which consists of comparable store sales and Internet sales) decreased 3.4% during fiscal 2010 versus a comparable retail sales decrease of 4.6% during fiscal 2009. During fiscal 2010, comparable store sales decreased 5.1%, based on 915 retail locations, and Internet sales increased 32.3%. During fiscal 2009, comparable store sales decreased 4.3%, based on 915 retail locations, and Internet sales decreased 8.7%. The slight decrease in total reported sales for fiscal 2010 compared to fiscal 2009 resulted primarily from the decrease in comparable store sales, offset by increased sales due to the re-launch of the exclusive Two Hearts Maternity collection in Sears and Kmart stores in October 2009, and increased Internet and international sales.
As of September 30, 2010, we operated a total of 698 stores and 1,027 total retail locations: 567 Motherhood Maternity stores (including 84 Motherhood Maternity Outlet stores), 56 A Pea in the Pod stores, 75 Destination Maternity stores, and 1,027 leased maternity apparel departments, of which 670 were in Sears and Kmart stores under the Two Hearts Maternity brand and the balance were in other department stores and baby specialty stores, primarily under the Motherhood brand. In addition, our Oh Baby by Motherhood collection is available at Kohl’s stores throughout the United States. In comparison, as of September 30, 2009, we operated a total of 724 stores and 1,084 total retail locations: 591 Motherhood Maternity stores (including 86 Motherhood Maternity Outlet stores), 67 A Pea in the Pod stores, 66 Destination Maternity stores, and 360 leased maternity apparel departments. The increase in leased department locations at the end of September 2010 versus the end of September 2009 predominantly reflects the opening of 623 Sears and Kmart leased department locations in connection with the October 2009 re-launch of the Two Hearts Maternity collection and the opening of an additional 49 Kmart leased department locations in September 2010. As of September 30, 2010, our store total included 75 Destination Maternity multi-brand stores, including 49 Destination Maternity combo stores and 26 Destination Maternity superstores. In comparison, as of September 30, 2009, we operated 66 Destination Maternity multi-brand stores, including 44 Destination Maternity combo stores and 22 Destination Maternity superstores. During fiscal 2010, we opened 11 stores, including 9 Destination Maternity stores, and closed 37 stores, with 22 of these store closings related to Destination Maternity store openings. In addition, during fiscal 2010, we opened 680 leased department locations and closed 13 leased department locations.
Gross Profit. Our gross profit for fiscal 2010 increased by 2.9%, or approximately $8.2 million, to $291.0 million compared to $282.8 million for fiscal 2009, and our gross profit as a percentage of net sales (gross margin) for fiscal 2010 was 54.8% compared to 53.2% for fiscal 2009. The increase in gross profit and gross margin for fiscal 2010 compared to fiscal 2009 was primarily due to higher merchandise gross margin from reduced product costs and lower product overhead costs, partially offset by increased markdown levels.
Selling, General and Administrative Expenses. Our selling, general and administrative expenses for fiscal 2010 decreased by 3.0%, or $7.9 million, to $251.7 million from $259.6 million for fiscal 2009. As a percentage of net sales, selling, general and administrative expenses for fiscal 2010 decreased to 47.4% compared to 48.9% for fiscal 2009. This decrease in expense resulted primarily from lower payroll and employee benefits costs, lower depreciation expense and lower variable incentive compensation expense, partially offset by increased marketing and advertising expense.
Store Closing, Asset Impairment and Asset Disposal Expenses. Our store closing, asset impairment and asset disposal expenses for fiscal 2010 increased by approximately $1.8 million, to $2.3 million from $0.5 million for fiscal 2009. We incurred impairment charges for write-downs of long-lived assets of $1.9 million for fiscal 2010, as compared to $0.7 million for fiscal 2009. We incurred charges relating to store closings and other asset disposals of approximately $0.4 million for fiscal 2010, as compared to $0.1 million for fiscal 2009. Fiscal 2009 also included a gain of $0.3 million from the sale of the remaining Costa Rica facility acquired in a fiscal 2002 business purchase.
42
Restructuring and Other Charges. In fiscal 2010, we incurred pretax expense of $5.7 million compared to $1.6 million for fiscal 2009, primarily from our strategic restructuring and cost reduction initiatives, and our management transition. See “Restructuring and Other Charges” in this Item 7 below for a detailed description of these charges.
Goodwill Impairment Expense. We recorded non-cash goodwill impairment charges of $50.4 million in fiscal 2009 to reflect the full impairment of our goodwill based on the results of the impairment analysis performed in fiscal 2009. See Note 6 of the Notes to Consolidated Financial Statements, included elsewhere in this report, for additional discussion.
Operating Income (Loss). We had operating income of $31.4 million for fiscal 2010 compared to a loss of $29.3 million for fiscal 2009, which included the goodwill impairment expense. Our operating income for fiscal 2010 of $31.4 million was $10.3 million higher than the operating income of $21.1 million for fiscal 2009, before goodwill impairment expense. Operating income, before goodwill impairment expense, as a percentage of net sales for fiscal 2010 increased to 5.9% from 4.0% for fiscal 2009. The increase in operating income and operating income percentage, before goodwill impairment expense, was primarily due to our higher gross profit and lower selling, general and administrative expenses, partially offset by higher restructuring and other charges, and higher store closing, asset impairment, and asset disposal expenses.
Interest Expense, Net. Our net interest expense for fiscal 2010 decreased by 30.1%, or $1.4 million, to $3.3 million from $4.7 million in fiscal 2009. This decrease was due to our lower debt level, primarily as a result of the $11.0 million of Term Loan prepayments we made in fiscal 2010 and the $20.0 million of Term Loan prepayments we made in fiscal 2009, and to a much lesser extent, lower interest rates. During fiscal 2010 and 2009, our average daily level of direct borrowings under our credit facility was $0.4 million and $0.2 million, respectively. We did not have any direct borrowings outstanding under our credit facility as of September 30, 2010.
Loss on Extinguishment of Debt. During fiscal 2010, we prepaid $11.0 million principal amount of our outstanding Term Loan, which resulted in pretax charges of $51,000, representing the write-off of unamortized deferred financing costs. During fiscal 2009, we prepaid $20.0 million principal amount of our outstanding Term Loan, which resulted in pretax charges totaling $123,000.
Income Taxes. For fiscal 2010 our effective income tax rate was 40.1%. For fiscal 2009 our income before taxes, before goodwill impairment expense, was $16.3 million and our effective income tax rate was a provision of 40.4%. There was no tax benefit associated with our $50.4 million of goodwill impairment expense in fiscal 2009. Our income tax rates for fiscal 2010 and fiscal 2009 reflect the effect of additional income tax expense (including interest and penalties) recognized as required by the accounting standard for uncertain income tax positions. Additionally, our income tax rates for both fiscal 2010 and fiscal 2009 reflect the effects of certain minimum state tax requirements, partially offset by allowable federal tax credits. See Note 16 of the Notes to Consolidated Financial Statements, included elsewhere in this report, for the reconciliation of the statutory federal income tax rate to our effective tax rate.
Net Income (Loss). Net income for fiscal 2010 was $16.8 million, or $1.33 per share (diluted), compared to net loss of $(40.7) million for fiscal 2009, or $(3.39) per share (diluted). Net income for fiscal 2010 includes (net of tax) restructuring and other charges of $3.5 million, stock-based compensation expense of $1.2 million and loss on extinguishment of debt of approximately $0.1 million. Net loss for fiscal 2009 includes (net of tax) goodwill impairment expense of $50.4 million, restructuring and other charges of $1.0 million, stock-based compensation expense of approximately $1.2 million and loss on extinguishment of debt of $0.1 million. Before goodwill impairment expense, restructuring and other charges, stock-based compensation expense and loss on extinguishment of debt, our fiscal 2010 net income was $21.6 million or $1.70 per share (diluted) compared to $12.0 million or $0.99 per share (diluted) for fiscal 2009.
Our average diluted shares outstanding of 12.7 million for fiscal 2010 was 5.9% higher than the 12.0 million average shares outstanding (basic and diluted) for fiscal 2009. The increase in average shares outstanding reflects the dilutive impact of outstanding stock options and restricted stock for fiscal 2010 and, to a lesser extent, the higher shares outstanding in fiscal 2010 compared to fiscal 2009, primarily as a result of the exercise of stock
43
options and vesting of restricted stock. There is no dilutive impact of outstanding stock options and restricted stock in fiscal 2009 due to the reported net loss. Had we reported a profit for fiscal 2009, the weighted average number of dilutive shares outstanding for computation of diluted earnings per share would have been approximately 12.1 million.
Following is a reconciliation of net income (loss) and net income (loss) per share (basic) to net income and net income per share (diluted) before goodwill impairment expense, restructuring and other charges, stock-based compensation expense and loss on extinguishment of debt for the years ended September 30, 2010 and 2009 (in thousands, except per share amounts):
| Year Ended September 30, 2010 |
Year Ended September 30, 2009 |
|||||||||||||||||||||||
| Net Income |
Shares | EPS | Net Income (Loss) |
Shares | EPS | |||||||||||||||||||
| As reported |
$ | 16,829 | 12,304 | $ | 1.37 | $ | (40,682 | ) | 11,985 | $ | (3.39 | ) | ||||||||||||
| Goodwill impairment expense, net of tax |
— | — | 50,389 | — | ||||||||||||||||||||
| Restructuring and other charges, net of tax |
3,514 | — | 968 | — | ||||||||||||||||||||
| Stock-based compensation expense, net of tax |
1,210 | — | 1,253 | — | ||||||||||||||||||||
| Loss on extinguishment of debt, net of tax |
32 | — | 76 | — | ||||||||||||||||||||
| Incremental shares from the assumed exercise of outstanding stock options |
— | 316 | — | 118 | ||||||||||||||||||||
| Incremental shares from the assumed lapse of restrictions on restricted stock awards |
— | 71 | — | 32 | ||||||||||||||||||||
|
|
|
|
|
|
|
|
|
|||||||||||||||||
| As adjusted before goodwill impairment expense, restructuring and other charges, stock-based compensation expense and loss on extinguishment of debt |
$ | 21,585 | 12,691 | $ | 1.70 | $ | 12,004 | 12,135 | $ | 0.99 | ||||||||||||||
|
|
|
|
|
|
|
|
|
|||||||||||||||||
Restructuring and Other Charges
In July 2008, we announced that we were streamlining our merchandise brands and store nameplates and implementing cost reductions in order to simplify our business model, reduce overhead costs and improve and tighten our merchandise assortments, and during fiscal 2009 we began to implement actions to achieve further cost reductions. The objectives of our restructuring and cost reduction program were to improve and simplify critical processes, consolidate activities and infrastructure, and reduce our expense structure. As of September 30, 2010, we had completed the planned activities of these initiatives and we incurred $3.9 million of pretax expense substantially related to these initiatives in fiscal 2010, primarily for consulting services. We incurred pretax expense of approximately $1.6 million from our restructuring and cost reduction initiatives in fiscal 2009, consisting of approximately $1.1 million for consulting services, $0.4 million for cash severance expense and severance-related benefits, and approximately $0.1 million of non-cash expense for accelerated depreciation of existing store signs resulting from planned store signage changes. These initiatives resulted in approximate pretax savings of $12 million in fiscal 2009, with incremental pretax savings of approximately $11 million in fiscal 2010 and an additional approximately $6 million in fiscal 2011. Thus we estimate that we realized total pretax savings of approximately $29 million in fiscal 2011 as a result of our cost reduction initiatives, which includes the savings realized in fiscal 2009 and fiscal 2010.
After his retirement on September 30, 2008, Dan Matthias, our former Chief Executive Officer (“Former CEO”), agreed to continue to serve us as a director and as non-executive Chairman of the Board and agreed to remain available to us in an advisory capacity through September 2012. For these services, we agreed to pay the Former CEO an annual retainer of $200,000 through September 2012. In November 2009, the Former CEO entered into a letter agreement with us, which confirmed that he would not seek reelection to the Board of Directors (and, therefore, would no longer serve as our non-executive Chairman of the Board) after the expiration of his term in January 2010. The letter agreement did not change the terms of payment under the annual retainer for advisory services, however we incurred a pretax charge of $0.6 million in fiscal 2010, representing the amount due for the remaining term of the arrangement.
44
In connection with the retirement of Rebecca Matthias, our former President and Chief Creative Officer, at the end of fiscal 2010, we incurred a pretax charge of $0.9 million in fiscal 2010. The charge reflects benefit costs related to an amendment to the executive’s supplemental retirement agreement with us.
In April 2011, we announced the hiring of Chris Daniel as our President effective June 1, 2011. In connection with our efforts to hire a new President, we incurred pretax charges of $0.2 million in fiscal 2011 for relocation costs and $0.3 million in fiscal 2010, primarily for executive recruiting costs.
Liquidity and Capital Resources
Our cash needs have primarily been for: (i) debt service, including prepayments, (ii) capital expenditures, including leasehold improvements, fixtures and equipment for new stores, store relocations and expansions of our existing stores, as well as improvements and new equipment for our distribution and corporate facilities and information systems, and (iii) working capital, including inventory to support our business. In addition, during the second quarter of fiscal 2011, we initiated a regular quarterly cash dividend. We have historically financed our capital requirements from cash flows from operations, borrowings under our credit facilities or available cash balances.
Cash and cash equivalents decreased by $9.3 million during fiscal 2011 compared to an increase of $4.0 million during fiscal 2010.
Cash provided by operations of $21.4 million for fiscal 2011 decreased by approximately $4.6 million from $26.0 million for fiscal 2010. This decrease in cash provided by operations versus the prior year was primarily the result of net working capital changes that used a greater amount of cash in fiscal 2011 than in fiscal 2010, partially offset by higher pretax income in fiscal 2011 compared to fiscal 2010. The net working capital changes were primarily (i) a decrease in accounts payable, accrued expenses and other liabilities in fiscal 2011, primarily due to a $4.2 million supplemental executive retirement plan (“SERP”) benefit payment made in December 2010 and lower accrued variable incentive compensation expense, compared to a small increase in fiscal 2010, and (ii) a larger increase in inventories in fiscal 2011 compared to fiscal 2010, which reflects our increased number of leased department locations during fiscal 2011 and somewhat weaker than planned sales during fiscal 2011, partially offset by (iii) a smaller increase in trade receivables in fiscal 2011 than in fiscal 2010.
In addition to our cash provided by operations in fiscal 2011, we withdrew $1.5 million from our grantor trust, which was used to partially fund the $4.2 million December 2010 SERP benefit payment, and we generated $2.3 million of cash from the proceeds of option exercises. During fiscal 2011 we used cash provided by operations, cash provided by option exercises, and the withdrawal from the Grantor Trust to fund repayments of long-term debt, to pay for capital expenditures, and to pay our quarterly cash dividends. Our $13.8 million of repayments of long-term debt in fiscal 2011 consisted predominantly of $12.6 million of prepayments of our Term Loan, including a $2.6 million prepayment required under the annual excess cash flow provision of the Term Loan. For fiscal 2011 we spent $12.3 million on capital expenditures, including $8.2 million for leasehold improvements, fixtures and equipment principally for new store facilities, as well as improvements to existing stores, and $4.1 million for our information systems and distribution and corporate facilities.
Cash provided by operations of $26.0 million for fiscal 2010 decreased by approximately $16.5 million from $42.5 million for fiscal 2009. This decrease in cash provided by operations versus the prior year was primarily the result of working capital changes that used cash in fiscal 2010 compared to providing a significant amount of cash in fiscal 2009, partially offset by higher net income in fiscal 2010 compared to net income before non-cash goodwill impairment expense in fiscal 2009. The working capital changes were primarily (i) a modest increase in inventories in fiscal 2010, primarily related to the expansion into additional Sears and Kmart leased department locations, versus a significant decrease in inventories in fiscal 2009, which reflected our efforts to reduce our inventory levels in fiscal 2009, (ii) an increase in trade receivables in fiscal 2010 compared to the slight fiscal 2009 decrease, which primarily reflects timing of collections for licensed relationship sales and (iii) an increase in prepaid expenses and other current assets in fiscal 2010, compared to a decrease in fiscal 2009, which primarily reflects higher tenant improvement allowances due from landlords in fiscal 2010 and the receipt in fiscal 2009 of a $1.5 million federal income tax refund.
45
During fiscal 2010 we used cash provided by operations primarily to fund repayments of long-term debt and to pay for capital expenditures. Our repayments of long-term debt in fiscal 2010 consisted predominantly of $11.0 million of prepayments of our Term Loan, including a $5.8 million prepayment required under the annual excess cash flow provision of the Term Loan. For fiscal 2010 we spent $10.4 million on capital expenditures, including $6.3 million for leasehold improvements, fixtures and equipment principally for new store facilities, as well as improvements to existing stores, and $4.1 million for our information systems and distribution and corporate facilities.
We have in place an agreement (the “Term Loan Agreement”) for our Term Loan. The interest rate on the Term Loan is equal to, at our election, either (i) the prime rate plus 1.00%, or (ii) a LIBOR rate plus an applicable margin. The applicable margin was initially fixed at 2.50% through and including the fiscal quarter ended September 30, 2007. Thereafter, the applicable margin for LIBOR rate borrowings is either 2.25% or 2.50%, depending on our Consolidated Leverage Ratio (as defined in the Term Loan Agreement). Based upon our applicable quarterly Consolidated Leverage Ratios, the applicable margin for LIBOR rate borrowings was 2.50% prior to December 30, 2009 and has been reduced to 2.25% effective from December 30, 2009. We are required to make minimum repayments of the principal amount of the Term Loan in quarterly installments of $225,000 each. We are also required to make an annual principal repayment equal to 25% or 50% of Excess Cash Flow (as defined in the Term Loan Agreement) in excess of $5.0 million for each fiscal year, with the 25% or 50% factor depending on our Consolidated Leverage Ratio. The required principal repayment related to fiscal 2010 results, which was calculated based on the 25% factor, was $2.6 million and was paid in December 2010. There is no required principal repayment related to fiscal 2011 results. Additionally, the Term Loan can be prepaid at our option, in part or in whole, at any time without any prepayment premium or penalty. For fiscal 2011 we made the following prepayments: $2.6 million in the first quarter, representing the prepayment required under the annual excess cash flow provision of the Term Loan, and $10.0 million in the third quarter. For fiscal 2010 we made the following prepayments: $6.0 million in the first quarter, including a $5.8 million prepayment required under the annual excess cash flow provision of the Term Loan, and $5.0 million in the third quarter. At September 30, 2011, our indebtedness under the Term Loan Agreement was $29.3 million.
The Term Loan is secured by a security interest in our trade receivables, inventory, real estate interests, letter of credit rights, cash, intangibles and certain other assets. The security interest granted to the Term Loan lenders is, in certain respects, subordinate to the security interest granted to our credit facility lender (see below). The Term Loan Agreement imposes certain restrictions on our ability to, among other things, incur additional indebtedness, pay dividends, repurchase stock, and enter into other various types of transactions. The Term Loan Agreement also contains quarterly financial covenants that require us to maintain a specified maximum permitted Consolidated Leverage Ratio and a specified minimum permitted Consolidated Interest Coverage Ratio (as defined in the Term Loan Agreement). Since the inception of the Term Loan Agreement we have been in compliance with all covenants of our Term Loan Agreement.
In order to mitigate our floating rate interest risk on the variable rate Term Loan, we entered into an interest rate swap agreement with the agent bank for the Term Loan that commenced on April 18, 2007, the date the Term Loan proceeds were received, and expires on April 18, 2012. The interest rate swap agreement enables us to effectively convert an amount of the Term Loan (equal to the notional amount of the interest rate swap) from a floating interest rate (LIBOR plus 2.50% prior to December 30, 2009, reduced to LIBOR plus 2.25% effective from December 30, 2009, based on our specified leverage ratios), to a fixed interest rate (7.50% prior to December 30, 2009, reduced to 7.25% effective from December 30, 2009, based on our specified leverage ratios). The notional amount of the interest rate swap was $75.0 million at the inception of the swap agreement and decreases over time to a notional amount of $5.0 million at the expiration date. The notional amount of the swap was $12.5 million as of September 30, 2011 and decreased to $5.0 million starting October 18, 2011. The notional amount of the swap agreement will remain at $5.0 million until the expiration of the interest rate swap agreement on April 18, 2012.
We also have in place a senior secured revolving credit facility (the “Credit Facility”), which was amended on July 25, 2011 to decrease the maximum available for borrowings from $65,000,000 to $55,000,000 and to extend its maturity date from March 13, 2012 to January 13, 2013. The amendment also increased our effective
46
interest rate on borrowings, if any, by approximately 0.75% per annum. There are no financial covenant requirements under the Credit Facility provided that Excess Availability (as defined in the related Credit Facility agreement) does not fall below 10% of the Borrowing Base (as defined in the related Credit Facility agreement). If Excess Availability were to fall below 10% of the Borrowing Base, we would be required to meet a specified minimum Fixed Charge Coverage Ratio (as defined in the related Credit Facility agreement). During all of fiscal 2011 and fiscal 2010, we exceeded the minimum requirements for Excess Availability under the Credit Facility.
As of September 30, 2011, we had no outstanding borrowings under the Credit Facility and $7.5 million in letters of credit, with $47.5 million of availability under our Credit Facility compared to no outstanding borrowings and $11.1 million in letters of credit, with $42.9 million of availability under our Credit Facility, based on our Borrowing Base formula, as of September 30, 2010. Borrowings under the Credit Facility as of September 30, 2011 would have borne interest at a rate of between approximately 1.98% and 4.00% per annum. During fiscal 2011, we did not have any direct borrowings under the Credit Facility. During fiscal 2010, our average level of direct borrowings under the Credit Facility was $0.4 million and our maximum borrowings at any time were $6.2 million. We may have borrowings under our Credit Facility during certain periods of fiscal 2012, reflecting seasonal and other timing variations in cash flow.
We have $2.0 million outstanding under an Industrial Revenue Bond (“IRB”) at September 30, 2011. The IRB has a variable interest rate that may be converted to a fixed interest rate at our option. At any time prior to conversion to a fixed interest rate structure, bondholders may put all or part of the IRB back to us upon notice to the bond trustee, after which the remarketing agent would attempt to resell the put portion of the IRB. If the remarketing agent is unsuccessful in reselling the put portion of the IRB, the bond trustee may then draw on a letter of credit issued under the Credit Facility to repay the bondholders. During fiscal 2011 a bondholder put $0.1 million of the IRB, which was successfully resold by the remarketing agent. The letter of credit issued to secure the bonds has never been drawn upon. In the event that the bondholders put the bonds back to us and the remarketing agent fails to resell the bonds, which we believe is unlikely, we expect the acceleration of the payment of the bonds would not have a material adverse effect on our financial position or liquidity.
In March 2007, we entered into Supplemental Executive Retirement Agreements, which have been periodically amended (the “SERP Agreements”), with Dan and Rebecca Matthias (the “SERP Executives”). We also have a grantor trust, which was established for the purpose of accumulating assets in anticipation of our payment obligations under the SERP Agreements (the “Grantor Trust”). Our agreements with the SERP Executives and the trustee for the Grantor Trust (the “Trustee”) allow us to make cash deposits to the Grantor Trust, or provide an irrevocable standby letter of credit (the “ SERP Letter of Credit”) to the Trustee, in lieu of any deposits otherwise required, for funding obligations under the SERP Agreements. In December 2009, in connection with the additional vesting and scheduled payment of SERP Executives’ benefits in 2010, we made a partial cash contribution to the Grantor Trust of $1.5 million, and reduced the SERP Letter of Credit by $1.5 million to a total of $4.4 million as of December 31, 2009. In December 2010, we received a distribution of the remaining assets in the Grantor Trust totaling $1.5 million. The amount withdrawn was used to partially fund the $4.2 million December 2010 lump sum payment of SERP benefits to Ms. Matthias. As of September 30, 2011, the SERP Letter of Credit was $0.8 million. In October 2011, we reduced the SERP Letter of Credit by $0.2 million in connection with an October 2011 SERP benefit payment to Mr. Matthias, to $0.6 million, which was equal to the amount of SERP benefits remaining to be paid to Mr. Matthias.
On January 26, 2011, we announced the initiation of a regular quarterly cash dividend. During fiscal 2011 we paid cash dividends of approximately $6.9 million (reflecting three quarterly dividend payments or a total of $0.525 per share after giving effect to our March 1, 2011 stock split). On November 9, 2011 we declared a quarterly cash dividend of $0.175 per share payable on December 28, 2011, which will require approximately $2.3 million of available cash. Based on our current quarterly dividend rate of $0.175 per share, we project that we will pay approximately $9.3 million of cash dividends during fiscal 2012.
Our management believes that our current cash and working capital positions, expected operating cash flows and available borrowing capacity will be sufficient to fund our cash requirements for working capital, capital expenditures, debt repayments and dividend payments, as well as to fund stock repurchases and debt prepayments, if any, for at least the next twelve months.
47
Contractual Obligations and Commercial Commitments
We have entered into agreements that create contractual obligations and commercial commitments. These obligations and commitments will have an impact on future liquidity and the availability of capital resources. The tables below set forth a summary of these obligations and commitments as of September 30, 2011 (in thousands):
Contractual Obligations:
| Description |
Total Obligations (1) |
Payments Due by Period | ||||||||||||||||||
| Less Than One Year |
One to Three Years |
Three to Five Years |
After Five Years |
|||||||||||||||||
| Long-term debt |
$ | 31,342 | $ | 2,915 | $ | 28,427 | $ | — | $ | — | ||||||||||
| Interest related to long-term debt (2) |
1,196 | 900 | 296 | — | — | |||||||||||||||
| Operating leases (3) |
181,030 | 46,892 | 68,646 | 35,976 | 29,516 | |||||||||||||||
| Purchase obligations (4) |
86,856 | 86,856 | — | — | — | |||||||||||||||
|
|
|
|
|
|
|
|
|
|
|
|||||||||||
| Total contractual cash obligations |
$ | 300,424 | $ | 137,563 | $ | 97,369 | $ | 35,976 | $ | 29,516 | ||||||||||
|
|
|
|
|
|
|
|
|
|
|
|||||||||||
| (1) | The amounts in this table exclude obligations under employment and retirement agreements. For a discussion of the compensation of our executive officers, see the information contained under the caption “Executive Compensation” in our Proxy Statement, which will be filed with the SEC in connection with the Annual Meeting of Stockholders expected to be held in the second quarter of fiscal 2012. |
| (2) | Interest costs on our floating rate long-term debt were estimated using the interest rates in effect as of September 30, 2011. This presentation of interest costs on our floating rate long-term debt includes the effect of our interest rate swap agreement further described above in “Liquidity and Capital Resources.” |
| (3) | Includes store operating leases, which generally provide for payment of direct operating costs in addition to rent. The amounts reflected include future minimum lease payments and exclude such direct operating costs. |
| (4) | Our purchase orders with contract manufacturers are cancelable by us at any time prior to our acceptance of the merchandise. The amount in this table excludes purchase orders for supplies in the normal course of business. |
Commercial Commitments:
| Description |
Total Obligations |
Amount of Commitment Per Period | ||||||||||||||||||
| Less Than One Year |
One to Three Years |
Three to Five Years |
After Five Years |
|||||||||||||||||
| Credit facility (1) |
$ | 7,459 | $ | 7,459 | $ | — | $ | — | $ | — | ||||||||||
| Other standby letters of credit |
— | — | — | — | — | |||||||||||||||
|
|
|
|
|
|
|
|
|
|
|
|||||||||||
| Total commercial commitments |
$ | 7,459 | $ | 7,459 | $ | — | $ | — | $ | — | ||||||||||
|
|
|
|
|
|
|
|
|
|
|
|||||||||||
| (1) | Consists of outstanding letter of credit commitments under our Credit Facility. |
Critical Accounting Policies and Estimates
Our consolidated financial statements have been prepared in accordance with accounting principles generally accepted in the United States. These generally accepted accounting principles require management to make estimates and assumptions that affect the reported amounts of assets and liabilities and disclosure of contingent assets and liabilities at the date of our consolidated financial statements and the reported amounts of net sales and expenses during the reporting period.
48
Our significant accounting policies are described in Note 2 of “Notes to Consolidated Financial Statements” included elsewhere in this report. We believe that the following discussion addresses our critical accounting policies, which are those that are most important to the portrayal of our financial condition and results of operations and require management’s most difficult, subjective and complex judgments, often as a result of the need to make estimates about the effect of matters that are inherently uncertain. If actual results were to differ significantly from estimates made, future reported results could be materially affected. However, we are not currently aware of any reasonably likely events or circumstances that would result in materially different results.
Our senior management has reviewed these critical accounting policies and estimates and the related Management’s Discussion and Analysis of Financial Condition and Results of Operations with the Audit Committee of our Board of Directors.
Inventories. We value our inventories, which consist primarily of maternity apparel, at the lower of cost or market. Cost is determined on the first-in, first-out method (FIFO) and includes the cost of merchandise, freight, duty and broker fees, as well as applied product-related overhead. A periodic review of inventory quantities on hand is performed in order to determine if inventory is properly valued at the lower of cost or market. Factors related to current inventories such as future consumer demand and fashion trends, current aging, current analysis of merchandise based on receipt date, current and anticipated retail markdowns or wholesale discounts, and class or type of inventory are analyzed to determine estimated net realizable values. Criteria utilized by us to determine the net realizable value of our inventories and the related level of required inventory reserves include factors such as the amount of merchandise received within the past twelve months, merchandise received more than one year before with quantities on-hand in excess of twelve months of sales, and merchandise currently selling below cost. A provision is recorded to reduce the cost of inventories to its estimated net realizable value, if required. Inventories as of September 30, 2011 and 2010 totaled $90.4 million and $80.7 million, respectively, representing 45.5% and 39.4% of total assets, respectively. Given the significance of inventories to our consolidated financial statements, the determination of net realizable values is considered to be a critical accounting estimate. Any significant unanticipated changes in the factors noted above could have a significant impact on the value of our inventories and our reported operating results.
Long-Lived Assets. Our long-lived assets consist principally of store leasehold improvements and furniture and equipment (included in the “property, plant and equipment, net” line item in our consolidated balance sheets) and, to a much lesser extent, patent and lease acquisition costs (included in the “other intangible assets, net” line item in our consolidated balance sheets). These long-lived assets are recorded at cost and are amortized using the straight-line method over the shorter of the lease term or their useful life. Net long-lived assets as of September 30, 2011 and 2010 totaled $57.1 million and $59.8 million, respectively, representing 28.7% and 29.1% of total assets, respectively.
In assessing potential impairment of these assets, we periodically evaluate the historical and forecasted operating results and cash flows on a store-by-store basis. Newly opened stores may take time to generate positive operating and cash flow results. Factors such as (i) store type, that is, Company store or leased department, (ii) store concept, that is, Motherhood, Pea or Destination Maternity, (iii) store location, for example, urban area versus suburb, (iv) current marketplace awareness of our brands, (v) local customer demographic data, (vi) anchor stores within the mall in which our store is located and (vii) current fashion trends are all considered in determining the time frame required for a store to achieve positive financial results, which is assumed to be within two years from the date a store location is opened. If economic conditions are substantially different from our expectations, the carrying value of certain of our long-lived assets may become impaired. As a result of our impairment assessment, we recorded write-downs of long-lived assets of $0.8 million and $1.9 million during fiscal 2011 and fiscal 2010, respectively.
Self-Insurance Reserves. We are primarily self-insured for most workers’ compensation claims, general liability and automotive liability losses, and for healthcare claims. We have purchased insurance coverage in order to establish certain limits to our exposure on a per claim basis and on an aggregate basis. Our accrued insurance expense, which was primarily for self-insurance reserves, as of September 30, 2011 and 2010 totaled $4.6 million and $4.1 million, respectively, representing 2.3% and 2.0% of total assets, respectively. The estimated reserves for
49
our self-insured liabilities and our reported operating results could be significantly affected if future occurrences and claims differ from the factors noted below.
We determine the estimated reserve required for workers’ compensation claims, general liability and automotive liability losses in each accounting period. This requires that we determine estimates of the costs of claims incurred (including claims incurred but not yet reported) and accrue for such expenses in the period in which the claims are incurred (including claims incurred but not yet reported). Actual workers’ compensation claims, and general liability and automotive liability losses, are reported to us by third party administrators. The third party administrators also report initial estimates of related loss reserves. The open claims and initial loss reserves and estimates of claims incurred but not yet reported are subjected to examination by us utilizing a consistent methodology which involves various assumptions, judgment and other factors. Such factors include, but are not limited to, the probability of settlement, the amount at which settlement can be achieved, the probable duration of the claim, the cost development pattern of the claim and the applicable cost development factor. In addition, we utilize a cooperative arrangement with a number of other companies to assist in managing these insurance risks for certain occurrences prior to March 1, 2010. Based on this arrangement, our expenses could be impacted by the loss history associated with the cooperative as a whole for the years for which we remain a participant. The liabilities associated with claims for workers’ compensation, general liability and automotive liability are measured through the use of actuarial methods to project an estimate of ultimate cost for claims incurred.
We record an accrual for the estimated amount of self-insured healthcare claims incurred but not yet reported using a method based on our historical claims experience. The most significant factors in addition to our historical claims experience that impact the determination of the required accrual are the historical timing of claims processing, medical cost trends and inflation, employer-employee cost sharing factors and changes in plan benefits. We continually monitor historical experience and cost trends, and accruals are adjusted when warranted by changes in facts and circumstances.
Accounting for Income Taxes. As part of the process of preparing our consolidated financial statements, we are required to estimate our income taxes in each of the jurisdictions in which we operate. This process requires us to estimate our actual current tax exposure (including interest and penalties) together with assessing temporary differences resulting from differing treatment of items, such as depreciation of property and equipment and valuation of inventories, for tax and accounting purposes. We establish reserves for certain tax positions that we believe are supportable, but are potentially subject to successful challenge by the applicable taxing authority. We determine our provision for income taxes based on federal, state and foreign tax laws and regulations currently in effect, some of which have been recently revised. Legislation changes in jurisdictions in which we operate, if enacted, could increase our transactions or activities subject to tax. Any such legislation that becomes law could result in an increase in our income tax expense and our income taxes paid, which could have a material and adverse effect on our net income or cash flow.
The temporary differences between the book and tax treatment of income and expenses result in deferred tax assets and liabilities, which are included within our consolidated balance sheets. We must then assess the likelihood that our deferred tax assets will be recovered from future taxable income. Actual results could differ from our assessments if adequate taxable income is not generated in future periods. Net deferred tax assets as of September 30, 2011 and 2010 totaled $17.7 million and $22.3 million, respectively, representing 8.9% and 10.9% of total assets at September 30, 2011 and 2010, respectively. To the extent we believe that recovery is not more likely than not, we must establish a valuation allowance. To the extent we establish a valuation allowance or change the allowance in a future period, income tax expense will be impacted.
Accounting for Contingencies. From time to time, we are named as a defendant in legal actions arising from our normal business activities. We account for contingencies such as these in accordance with applicable accounting standards, which require us to record an estimated loss contingency when information available prior to issuance of our financial statements indicates that it is probable that an asset has been impaired or a liability has been incurred at the date of the financial statements and the amount of the loss can be reasonably estimated. Accounting for contingencies arising from contractual or legal proceedings requires management, after
50
consultation with outside legal counsel, to use its best judgment when estimating an accrual related to such contingencies. As additional information becomes known, our accrual for a loss contingency could fluctuate, thereby creating variability in our results of operations from period to period. Likewise, an actual loss arising from a loss contingency which significantly exceeds the amount accrued for in our financial statements could have a material adverse impact on our operating results for the period in which such actual loss becomes known.
Recent Accounting Pronouncements
In June 2011, the Financial Accounting Standards Board (“FASB”) issued Accounting Standards Update (“ASU”) No. 2011-05, Comprehensive Income (Topic 220): Presentation of Comprehensive Income. ASU No. 2011-05 requires companies to present the components of net income and other comprehensive income either as one continuous statement or as two consecutive statements. It eliminates the option to present components of other comprehensive income as part of the statement of stockholders’ equity. The standard does not change the items which must be reported in other comprehensive income. ASU No. 2011-05 is effective for financial statements issued for annual reporting periods beginning after December 15, 2011 and interim periods within those years. Because this guidance impacts presentation only, the adoption of the new requirements of ASU No. 2011-05 will not have any impact on our consolidated financial position or results of operations.
In May 2011, the FASB issued ASU No. 2011-04, Fair Value Measurement (Topic 820): Amendments to Achieve Common Fair Value Measurement and Disclosure Requirements in U.S. GAAP and IFRSs. The amendments in ASU No. 2011-04 result in common fair value measurement and disclosure requirements in U.S. GAAP and IFRSs and change the wording used to describe many of the requirements in U.S. GAAP for measuring fair value and for disclosing information about fair value measurements. The amendments do not require additional fair value measurements and are not intended to establish valuation standards or affect valuation practices outside of financial reporting. ASU No. 2011-04 is effective during interim and annual periods beginning after December 15, 2011. The adoption of the new requirements of ASU No. 2011-04 will not have a material impact on our consolidated financial position or results of operations.
In July 2010, the FASB issued ASU No. 2010-20, Receivables (Topic 310): Disclosures about the Credit Quality of Financing Receivables and the Allowance for Credit Losses. ASU No. 2010-20 requires enhanced disclosures about the credit quality of financing receivables and the allowance for credit losses, including uncollectible trade accounts receivable. ASU No. 2010-20 is effective for financial statements issued for interim and annual reporting periods ending on or after December 15, 2010. The adoption of the new disclosure requirements of ASU No. 2010-20 did not have any impact on our consolidated financial position or results of operations.
Off Balance Sheet Arrangements
None.
Inflation
We do not believe that inflation has had a material effect on our net sales or profitability in the periods presented. However, there can be no assurance that our business will not be affected by inflation in the future.
Forward-Looking Statements
Some of the information in this report, including the information incorporated by reference (as well as information included in oral statements or other written statements made or to be made by us), contains forward-looking statements within the meaning of Section 27A of the Securities Act of 1933, as amended, and Section 21E of the Securities Exchange Act of 1934, as amended (the “Exchange Act”). The forward-looking statements involve a number of risks and uncertainties. A number of factors could cause our actual results, performance, achievements or industry results to be materially different from any future results, performance or
51
achievements expressed or implied by these forward-looking statements. These factors include, but are not limited to: the continuation of economic recovery of the retail industry in general and of apparel purchases in particular, our ability to successfully manage various business initiatives, the success of our international business and its expansion, our ability to successfully manage and retain our leased department and licensed relationships and marketing partnerships, future sales trends in our various sales channels, unusual weather patterns, changes in consumer spending patterns, raw material price increases, overall economic conditions and other factors affecting consumer confidence, demographics and other macroeconomic factors that may impact the level of spending for maternity apparel (such as fluctuations in pregnancy rates and birth rates), expense savings initiatives, our ability to anticipate and respond to fashion trends and consumer preferences, unanticipated fluctuations in our operating results, the impact of competition and fluctuations in the price, availability and quality of raw materials and contracted products, availability of suitable store locations, continued availability of capital and financing, our ability to hire and develop senior management and sales associates, our ability to develop and source merchandise, our ability to receive production from foreign sources on a timely basis, potential stock repurchases, potential debt prepayments, the continuation of the regular quarterly cash dividend, the trading liquidity of our common stock, changes in market interest rates, war or acts of terrorism and other factors referenced in this report, including those set forth under the caption “Item 1A. Risk Factors.”
In addition, these forward-looking statements necessarily depend upon assumptions, estimates and dates that may be incorrect or imprecise and involve known and unknown risks, uncertainties and other factors. Accordingly, any forward-looking statements included in this report do not purport to be predictions of future events or circumstances and may not be realized. Forward-looking statements can be identified by, among other things, the use of forward-looking terms such as “believes,” “expects,” “may,” “will,” “should,” “seeks,” “pro forma,” “anticipates,” “intends,” “continues,” “could,” “estimates,” “plans,” “potential,” “predicts,” “goal,” “objective,” or the negative of any of these terms, or comparable terminology, or by discussions of our outlook, plans, goals, strategy or intentions. Forward-looking statements speak only as of the date made. Except as required by applicable law, including the securities laws of the United States and the rules and regulations of the SEC, we assume no obligation to update any of these forward-looking statements to reflect actual results, changes in assumptions or changes in other factors affecting these forward-looking statements.
| Item 7A. | Quantitative and Qualitative Disclosures About Market Risk |
The Company is exposed to market risk from changes in interest rates. We have not entered into any market sensitive instruments for trading purposes. The analysis below presents the sensitivity of the market value of our financial instruments to selected changes in market interest rates. The range of changes presented reflects our view of changes that are reasonably possible over a one-year period.
As of September 30, 2011, we had cash equivalents of $12.0 million. Our cash equivalents consist of investments in fixed income mutual funds that bear interest at variable rates. A change in market interest rates earned on our investments impacts the interest income and cash flows, but does not materially impact the fair market value of the financial instruments. Due to the average maturity and conservative nature of our investment portfolio, we believe a sudden change in interest rates would not have a material effect on the value of our investment portfolio. The impact on our future interest income resulting from changes in investment yields will depend largely on the gross amount of our investment portfolio at that time. However, based upon the conservative nature of our investment portfolio and current experience, we do not believe a decrease in investment yields would have a material negative effect on our interest income.
As of September 30, 2011, the principal components of our debt portfolio were the $29.3 million Term Loan and the $55.0 million Credit Facility, both of which are denominated in United States dollars.
Our Credit Facility carries a variable interest rate that is tied to market indices. As of September 30, 2011, we had no direct borrowings and $7.5 million of letters of credit outstanding under our Credit Facility. Borrowings under the Credit Facility would have resulted in interest at a rate between approximately 1.98% and 4.00% per annum as of September 30, 2011. Interest on any future borrowings under the Credit Facility would, to the extent of outstanding borrowings, be affected by changes in market interest rates. A change in market interest rates on the variable rate portion of our debt portfolio would impact the interest expense incurred and cash flows.
52
The Term Loan carries a variable interest rate that is tied to market indices. The sensitivity analysis as it relates to this portion of our debt portfolio assumes an instantaneous 100 basis point move in interest rates from their levels as of September 30, 2011, with all other variables held constant. The principal amount of the Term Loan was $29.3 million as of September 30, 2011. A 100 basis point increase in market interest rates would result in additional annual interest expense on the Term Loan of approximately $0.3 million. A 100 basis point decline in market interest rates would correspondingly lower our annual interest expense on the Term Loan by approximately $0.3 million.
In order to mitigate our floating rate interest risk on the variable rate Term Loan, we entered into an interest rate swap agreement with the agent bank for the Term Loan that commenced on April 18, 2007. The interest rate swap agreement enables us to effectively convert an amount of the Term Loan (equal to the notional amount of the interest rate swap) from a floating interest rate (LIBOR plus 2.50% prior to December 30, 2009, reduced to LIBOR plus 2.25% effective from December 30, 2009, based on our specified leverage ratios), to a fixed interest rate (7.50% prior to December 30, 2009, reduced to 7.25% effective from December 30, 2009, based on our specified leverage ratios). The notional amount of the interest rate swap was $75.0 million at inception of the swap agreement and decreases over time to a notional amount of $5.0 million at the expiration date (April 18, 2012). The notional amount of the swap was $12.5 million as of September 30, 2011 and decreased to $5.0 million starting October 18, 2011. The notional amount of the swap will remain at $5.0 million until the expiration of the interest rate swap agreement on April 18, 2012. Based on the remaining scheduled swap notional amount, a 100 basis point increase in market interest rates would result in interest expense savings for the year of less than $0.1 million. A 100 basis point decline in market interest rates would correspondingly increase our interest expense for the year by less than $0.1 million. Thus, a 100 basis point increase in market interest rates during the remainder of the swap agreement would result in additional interest expense for the year of approximately $0.3 million on the Term Loan and swap agreement combined. A 100 basis point decline in market interest rates during the remainder of the swap agreement would correspondingly lower our interest expense for the year by approximately $0.3 million on the Term Loan and swap agreement combined.
Based on the limited other variable rate debt included in our debt portfolio as of September 30, 2011, a 100 basis point increase in interest rates would result in additional interest incurred for the year of less than $0.1 million. A 100 basis point decrease in interest rates would correspondingly lower our interest expense for the year by less than $0.1 million.
Other than as described above, we do not believe that the market risk exposure on other financial instruments is material.
| Item 8. | Financial Statements and Supplementary Data |
Our Consolidated Financial Statements appear on pages F-1 through F-34, as set forth in Item 15.
| Item 9. | Changes in and Disagreements with Accountants on Accounting and Financial Disclosure |
None.
| Item 9A. | Controls and Procedures |
Disclosure Controls and Procedures
Our disclosure controls and procedures are designed to ensure that information required to be disclosed by us in the reports that are filed or submitted under the Exchange Act is recorded, processed, summarized and reported within the time periods specified in the SEC’s rules and forms. These disclosure controls and procedures include controls and procedures designed to ensure that information required to be disclosed under the Exchange Act is accumulated and communicated to our management on a timely basis to allow decisions regarding required disclosure. We evaluated the effectiveness of the design and operation of our disclosure controls and procedures as of September 30, 2011. Based on this evaluation, the Company’s Chief Executive Officer and Chief Financial Officer have concluded that as of September 30, 2011, these controls and procedures were effective.
53
Internal Control over Financial Reporting
(a) Management’s Annual Report on Internal Control over Financial Reporting
The Company’s management is responsible for establishing and maintaining adequate internal control over financial reporting to provide reasonable assurance regarding the reliability of the Company’s financial reporting and the preparation of financial statements for external purposes in accordance with generally accepted accounting principles. Internal control over financial reporting includes those policies and procedures that (i) pertain to the maintenance of records that in reasonable detail accurately and fairly reflect the transactions and dispositions of the assets of the Company, (ii) provide reasonable assurance that transactions are recorded as necessary to permit preparation of financial statements in accordance with generally accepted accounting principles, and that receipts and expenditures of the Company are being made only in accordance with authorizations of management and directors of the Company, and (iii) provide reasonable assurance regarding prevention or timely detection of unauthorized acquisition, use or disposition of the Company’s assets that could have a material effect on the financial statements.
Management assessed the Company’s internal control over financial reporting as of September 30, 2011, the end of the Company’s fiscal year. Management based its assessment on criteria established in Internal Control—Integrated Framework issued by the Committee of Sponsoring Organizations of the Treadway Commission. Management’s assessment included evaluation of such elements as the design and operating effectiveness of key financial reporting controls, process documentation, accounting policies, and the Company’s overall control environment.
Based on its assessment, management has concluded that the Company’s internal control over financial reporting was effective as of the end of the fiscal year to provide reasonable assurance regarding the reliability of financial reporting and the preparation of financial statements for external reporting purposes in accordance with generally accepted accounting principles. The results of management’s assessment were reviewed with the Audit Committee of the Company’s Board of Directors.
KPMG LLP independently assessed the effectiveness of the Company’s internal control over financial reporting. KPMG LLP has issued an attestation report, which is included below.
(b) Report of Independent Registered Public Accounting Firm
The Board of Directors and Stockholders
Destination Maternity Corporation:
We have audited Destination Maternity Corporation’s internal control over financial reporting as of September 30, 2011, based on criteria established in Internal Control—Integrated Framework issued by the Committee of Sponsoring Organizations of the Treadway Commission (COSO). Destination Maternity Corporation’s management is responsible for maintaining effective internal control over financial reporting and for its assessment of the effectiveness of internal control over financial reporting, included in Management’s Annual Report on Internal Control over Financial Reporting presented above. Our responsibility is to express an opinion on the Company’s internal control over financial reporting based on our audit.
We conducted our audit in accordance with the standards of the Public Company Accounting Oversight Board (United States). Those standards require that we plan and perform the audit to obtain reasonable assurance about whether effective internal control over financial reporting was maintained in all material respects. Our audit included obtaining an understanding of internal control over financial reporting, assessing the risk that a material weakness exists, and testing and evaluating the design and operating effectiveness of internal control based on the assessed risk. Our audit also included performing such other procedures as we considered necessary in the circumstances. We believe that our audit provides a reasonable basis for our opinion.
A company’s internal control over financial reporting is a process designed to provide reasonable assurance regarding the reliability of financial reporting and the preparation of financial statements for external purposes in accordance with generally accepted accounting principles. A company’s internal control over financial reporting
54
includes those policies and procedures that (1) pertain to the maintenance of records that, in reasonable detail, accurately and fairly reflect the transactions and dispositions of the assets of the company; (2) provide reasonable assurance that transactions are recorded as necessary to permit preparation of financial statements in accordance with generally accepted accounting principles, and that receipts and expenditures of the company are being made only in accordance with authorizations of management and directors of the company; and (3) provide reasonable assurance regarding prevention or timely detection of unauthorized acquisition, use, or disposition of the company’s assets that could have a material effect on the financial statements.
Because of its inherent limitations, internal control over financial reporting may not prevent or detect misstatements. Also, projections of any evaluation of effectiveness to future periods are subject to the risk that controls may become inadequate because of changes in conditions, or that the degree of compliance with the policies or procedures may deteriorate.
In our opinion, Destination Maternity Corporation maintained, in all material respects, effective internal control over financial reporting as of September 30, 2011, based on criteria established in Internal Control—Integrated Framework issued by the Committee of Sponsoring Organizations of the Treadway Commission (COSO).
We also have audited, in accordance with the standards of the Public Company Accounting Oversight Board (United States), the consolidated balance sheets of Destination Maternity Corporation and subsidiaries as of September 30, 2011 and 2010, and the related consolidated statements of operations, stockholders’ equity and comprehensive income (loss) and cash flows for each of the years in the three-year period ended September 30, 2011 and the related financial statement schedule, and our report dated December 14, 2011 expressed an unqualified opinion on those consolidated financial statements and the related financial statement schedule.
/s/ KPMG LLP
Philadelphia, Pennsylvania
December 14, 2011
(c) Change in Internal Control over Financial Reporting
There have been no changes in internal control over financial reporting identified in connection with management’s evaluation that occurred during the last fiscal quarter ended September 30, 2011 that have materially affected, or are reasonably likely to materially affect, our internal control over financial reporting.
| Item 9B. | Other Information |
None
55
PART III.
| Item 10. | Directors, Executive Officers and Corporate Governance |
Information concerning directors and corporate governance, appearing under the captions “Corporate Governance,” “Election of Directors (Proposal 1)” and “Section 16(a) Beneficial Ownership Reporting Compliance” in our Proxy Statement, is incorporated herein by reference in response to this Item 10. Information concerning executive officers, appearing under the caption “Item 1. Business—Executive Officers of the Company” in Part I of this Form 10-K, is incorporated herein by reference in response to this Item 10.
The Board of Directors has adopted a Code of Business Conduct and Ethics, which can be found on the Company’s corporate website at investor.destinationmaternity.com. We intend to satisfy the amendment and waiver disclosure requirements under applicable securities regulations by posting any amendments of, or waivers to, the Code of Business Conduct and Ethics on our website.
| Item 11. | Executive Compensation |
The information contained in the Proxy Statement from the sections titled “Compensation Discussion and Analysis,” “Reports of Committees of the Board of Directors” and “Executive Compensation” with respect to executive compensation, and in the section titled “Compensation of Directors” with respect to director compensation, is incorporated herein by reference in response to this Item 11.
| Item 12. | Security Ownership of Certain Beneficial Owners and Management and Related Stockholder Matters |
Securities Authorized for Issuance Under Equity Compensation Plans
The following table provides information as of September 30, 2011, regarding the number of shares of common stock that may be issued under our equity compensation plans.
| Plan Category |
Number of securities to be issued upon exercise of outstanding options, warrants and rights |
Weighted-average exercise price of outstanding options, warrants and rights |
Number of securities remaining available for future issuance under equity compensation plans (excluding securities reflected in the first column) |
|||||||||
| Equity compensation plans approved by security holders |
647,924 | (1) | $ | 11.60 | 877,906 | (2) | ||||||
| Equity compensation plans not approved by security holders (3) |
— | — | — | |||||||||
|
|
|
|
|
|||||||||
| Total |
647,924 | $ | 11.60 | 877,906 | ||||||||
|
|
|
|
|
|||||||||
| (1) | Reflects shares subject to options outstanding under the Company’s Amended and Restated 1987 Stock Option Plan, the 1994 Director Stock Option Plan and the 2005 Plan. |
| (2) | Reflects shares available under the 2005 Plan (437,122 of which may be issued as shares of restricted stock). |
| (3) | The Company does not maintain any equity compensation plans that have not been approved by the stockholders. |
The information contained in the section titled “Security Ownership of Certain Beneficial Owners and Management” in the Proxy Statement, with respect to security ownership of certain beneficial owners and management, is incorporated herein by reference in response to this Item 12.
56
| Item 13. | Certain Relationships and Related Transactions, and Director Independence |
The information contained in the sections titled “Corporate Governance” and “Election of Directors” in the Proxy Statement with respect to certain relationships and director independence, is incorporated herein by reference in response to this Item 13.
| Item 14. | Principal Accounting Fees and Services |
The information contained in the Proxy Statement in the section titled “Auditor Fees and Services” is incorporated herein by reference in response to this Item 14.
57
PART IV.
| Item 15. | Exhibits and Financial Statement Schedules |
| (a) (1) | Financial Statements |
| The financial statements listed in the accompanying Index to Consolidated Financial Statements are filed as part of this Form 10-K, commencing on page F-1. |
| (2) | Financial Statement Schedules |
| Schedule II—Valuation and Qualifying Accounts. |
| All other schedules are omitted because they are not applicable or not required, or because the required information is included in the consolidated financial statements or notes thereto. |
| (3) | Exhibits |
| See following Index of Exhibits. |
58
INDEX OF EXHIBITS
| Exhibit No. |
Description | |
| *3.1 |
Restated Certificate of Incorporation of the Company (Exhibit 3.1 to the Company’s Annual Report on Form 10-K for the year ended September 30, 2008). | |
| *3.2 |
Bylaws of the Company (Exhibit 3.2 to the Company’s Current Report on Form 8-K dated November 9, 2011). | |
| *4.1 |
Specimen certificate representing shares of the Company’s common stock with legend regarding Preferred Stock Purchase Rights (Exhibit 4.2 to the Company’s Current Report on Form 8-K dated October 12, 1995). | |
| *4.2 |
Amended and Restated Rights Agreement, dated as of October 9, 2005, between the Company and StockTrans, Inc., which includes the Form of Series B Rights Certificate, the Certificate of Designation of the voting powers, designations, preferences, and relative, participating, optional or other special rights and qualifications, limitations and restrictions of the Series B Junior Participating Preferred Stock, and a Summary of Rights to Purchase Preferred Stock attached thereto as Exhibits A, B and C respectively (Exhibit 4.1 to the Company’s Current Report on Form 8-K dated October 9, 2005). | |
| †*10.1 |
1994 Director Stock Option Plan (Exhibit 10.12 to the Company’s Annual Report on Form 10-K for the year ended September 30, 1994). | |
| *10.2 |
Loan Agreement, dated September 1, 1995, between Philadelphia Authority For Industrial Development (“PAID”) and the Company (Exhibit 10.26 to the Company’s Registration Statement on Form S-1, Registration No. 33-97318, dated October 26, 1995 (the “1995 Registration Statement”)). | |
| *10.3 |
Indenture of Trust between PAID and Society National Bank dated September 1, 1995 (Exhibit 10.29 to the Company’s 1995 Registration Statement). | |
| *10.4 |
Variable/Fixed Rate Federally Taxable Economic Development Bond (Mothers Work, Inc.), Series of 1995, in the aggregate principal amount of $4,000,000 (Exhibit 10.30 to the Company’s 1995 Registration Statement). | |
| *10.5 |
Note dated as of February 14, 1996 from the Company to PIDC Local Development Corporation (Exhibit 10.29 to the Company’s Annual Report on Form 10-K for the year ended September 30, 1996). | |
| †*10.6 |
1987 Stock Option Plan (as amended and restated) (Exhibit 4.1 to the Company’s Registration Statement on Form S-8, Registration No. 333-59529, dated July 21, 1998). | |
| †*10.7 |
Amendment to the Company’s 1987 Stock Option Plan, as amended and restated, effective as of November 13, 2002 (Exhibit 10.25 to the Company’s Form 10-Q for the quarter ended March 31, 2003). | |
| †*10.8 |
Form of Non-Qualified Stock Option Agreement under the Company’s 1987 Stock Option Plan (Exhibit 10.18 to the Company’s Annual Report on Form 10-K for the year ended September 30, 2004 (the “2004 Form 10-K”)). | |
| †*10.9 |
Form of Non-Qualified Stock Option Agreement under the Company’s 1994 Director Stock Option Plan (Exhibit 10.19 to the 2004 Form 10-K). | |
| †*10.10 |
Form of Waiver of Rights Under Company’s 1987 Stock Option Plan and 1994 Director Stock Option Plan executed by each of the Company’s Non-Management Directors (Exhibit 10.21 to the Company’s Current Report on Form 8-K dated December 29, 2005 (the “December 29, 2005 Form 8-K”)). | |
59
| Exhibit No. |
Description | |
| †*10.11 |
Form of Waiver of Rights Under Company’s 1987 Stock Option Plan executed by certain of the Company’s executive officers (Exhibit 10.22 to the December 29, 2005 Form 8-K). | |
| †*10.12 |
Form of Restricted Stock Award Agreement under the Company’s 2005 Equity Incentive Plan (Exhibit 10.28 to the Company’s Annual Report on Form 10-K for the year ended September 30, 2006 (the “2006 Form 10-K”)). | |
| †*10.13 |
Form of Non-Qualified Stock Option Agreement under the Company’s 2005 Equity Incentive Plan (Exhibit 10.29 to the 2006 Form 10-K). | |
| †*10.14 |
Management Incentive Program (Exhibit 10.1 to the Company’s Current Report on Form 8-K dated December 13, 2006). | |
| †*10.15 |
Second Amended and Restated Employment Agreement, dated March 2, 2007, between Dan W. Matthias and the Company (Exhibit 10.2 to the Company’s Current Report on Form 8-K dated March 2, 2007 (the “March 2, 2007 Form 8-K”). | |
| †*10.16 |
Supplemental Retirement Agreement dated as of March 2, 2007, between the Company and Rebecca C. Matthias (Exhibit 10.3 to the March 2, 2007 Form 8-K). | |
| †*10.17 |
Supplemental Retirement Agreement dated as of March 2, 2007, between the Company and Dan W. Matthias (Exhibit 10.4 to the March 2, 2007 Form 8-K). | |
| *10.18 |
Term Loan and Security Agreement, dated March 13, 2007, among the Company and Cave Springs, Inc., each as a Borrower, and Mothers Work Canada, Inc., as a Guarantor, and Bank of America, N.A, as Term Administrative Agent and Term Collateral Agent, and Banc of America Securities LLC, as Sole Lead Arranger and Sole Book Runner (Exhibit 10.1 to the Company’s Current Report on Form 8-K dated March 13, 2007 (the “March 13, 2007 Form 8-K”)). | |
| *10.19 |
Second Amended and Restated Loan and Security Agreement, dated March 13, 2007, among the Company and Cave Springs, Inc., each as a Borrower, and Mothers Work Canada, Inc., as a Guarantor, and Bank of America, N.A, as the Lender (Exhibit 10.2 to the March 13, 2007 Form 8-K). | |
| †*10.20 |
Second Amended and Restated Employment Agreement, dated May 15, 2007, between Edward M. Krell and the Company (Exhibit 10.1 to the Company’s Current Report on Form 8-K dated May 15, 2007). | |
| *10.21 |
Confidentiality Agreement, dated March 10, 2008, by and among the Company, Crescendo Partners II, L.P., Series K, Crescendo Investments II, LLC, Crescendo Partners III, L.P., and Crescendo Investments III, LLC. (Exhibit 10.1 to the Company’s Current Report on Form 8-K dated March 10, 2008). | |
| †*10.22 |
Letter Agreement, dated March 28, 2008, between the Company and Dan W. Matthias and Rebecca C. Matthias (Exhibit 10.1 to the Company’s Current Report on Form 8-K dated March 28, 2008). | |
| †*10.23 |
Letter Agreement, dated May 20, 2008, between the Company and Dan W. Matthias and Rebecca C. Matthias (Exhibit 10.1 to the Company’s Current Report on Form 8-K dated May 20, 2008). | |
| †*10.24 |
Employment Agreement, dated July 23, 2008, between the Company and Judd P. Tirnauer (Exhibit 10.1 to the Company’s Current Report on Form 8-K dated July 21, 2008 (the “July 21, 2008 Form 8-K”)). | |
| †*10.25 |
Restrictive Covenant Agreement with Judd P. Tirnauer dated July 23, 2008 (Exhibit 10.2 to the July 21, 2008 Form 8-K). | |
| †*10.26 |
Restricted Stock Award Agreement with Judd P. Tirnauer dated July 23, 2008 (Exhibit 10.3 to the July 21, 2008 Form 8-K). | |
60
| Exhibit No. |
Description | |
| †*10.27 |
Amendment to Second Amended and Restated Employment Agreement, dated September 26, 2008, between Edward M. Krell and the Company (Exhibit 10.1 to the Company’s Current Report on Form 8-K dated September 26, 2008 (the “September 26, 2008 Form 8-K”)). | |
| †*10.28 |
Transition Agreement, dated September 26, 2008, between Dan W. Matthias and the Company (Exhibit 10.2 to the September 26, 2008 Form 8-K). | |
| †*10.29 |
Letter Agreement, dated November 6, 2009, between Dan W. Matthias and the Company (Exhibit 10.1 to the Company’s Current Report on Form 8-K dated November 4, 2009 (the “November 4, 2009 Form 8-K”). | |
| *10.30 |
Letter Agreement, dated November 6, 2009, by and among the Company, Crescendo Partners II, L.P., Series K, Crescendo Investments II, LLC, Crescendo Partners III, L.P., and Crescendo Investments III, LLC. (Exhibit 10.2 to the November 4, 2009 Form 8-K). | |
| †*10.31 |
Transition Agreement, dated November 6, 2009, between Rebecca C. Matthias and the Company (Exhibit 10.3 to the November 4, 2009 Form 8-K). | |
| †*10.32 |
2005 Equity Incentive Plan (as amended and restated) (Exhibit 10.1 to the Company’s Current Report on Form 8-K dated February 25, 2011 (the “February 25, 2011 Form 8-K”)). | |
| †*10.33 |
Non-Employee Director Compensation Policy (Exhibit 10.2 to the February 25, 2011 Form 8-K). | |
| †*10.34 |
Employment Agreement, dated April 11, 2011, between Christopher F. Daniel and the Company (Exhibit 10.1 to the Company’s Current Report on Form 8-K dated April 11, 2011 (the “April 11, 2011 Form 8-K”)). | |
| †*10.35 |
Non-Qualified Stock Option Award Agreement between Christopher F. Daniel and the Company (Exhibit 10.44 to the Company’s Quarterly Report on Form 10-Q for the quarter ended June 30, 2011 (the “June 30, 2011 Form 10-Q”)). | |
| †*10.36 |
Form of Restricted Stock Award Agreement between Christopher F. Daniel and the Company (Exhibit 10.45 to the June 30, 2011 Form 10-Q). | |
| †*10.37 |
Executive Employment Agreement, dated July 16, 2009, between Ronald J. Masciantonio and the Company (Exhibit 10.4 to the April 11, 2011 Form 8-K). | |
| †*10.38 |
Amendment to Executive Employment Agreement, dated April 27, 2010, between Ronald J. Masciantonio and the Company (Exhibit 10.5 to the April 11, 2011 Form 8-K). | |
| †*10.39 |
Restrictive Covenant Agreement, dated July 16, 2009, between Ronald J. Masciantonio and the Company (Exhibit 10.6 to the April 11, 2011 Form 8-K). | |
| *10.40 |
First Amendment to Second Amended and Restated Loan and Security Agreement, dated July 25, 2011, among the Company and Cave Springs, Inc., each as a Borrower, and Mothers Work Canada, Inc., as a Guarantor, and Bank of America N.A. as a lender, Administrative Agent and Collateral Agent (Exhibit 10.1 to the Company’s Current Report on Form 8-K dated July 21, 2011). | |
| *10.41 |
Second Amended and Restated Loan and Security Agreement, dated March 13, 2007, among the Company and Cave Springs, Inc., each as a Borrower, and Mothers Work Canada, Inc., as a Guarantor, and Bank of America, N.A, as the Lender (Exhibit 10.21 to Amendment No. 2 to the Company’s Annual Report on Form 10-K/A for the year ended September 30, 2010). | |
| †*10.42 |
Amendment, dated August 10, 2011, to the Second Amended and Restated Employment Agreement dated as of May 15, 2007 (as amended) between Edward M. Krell and the Company.
(Exhibit 10.1 to the Company’s Current Report on Form 8-K dated August 10, 2011 (the “August 10, 2011 Form 8-K”)). | |
61
| Exhibit No. |
Description | |
| †*10.43 |
Amendment, dated August 10, 2011, to the Employment Agreement dated as of July 23, 2008 between Judd P. Tirnauer and the Company (Exhibit 10.2 to the August 10, 2011 Form 8-K). | |
| †*10.44 |
Amendment, dated August 10, 2011, to the Employment Agreement dated as of July 16, 2009 (as amended) between Ronald J. Masciantonio and the Company (Exhibit 10.3 to the August 10, 2011 Form 8-K). | |
| †10.45 |
Amendment, dated November 22, 2011, to the Employment Agreement dated as of July 23, 2008 (as amended) between Judd P. Tirnauer and the Company. | |
| †10.46 |
Amendment, dated November 22, 2011, to the Employment Agreement dated as of July 16, 2009 (as amended) between Ronald J. Masciantonio and the Company. | |
| *21 |
Subsidiaries of the Company (Exhibit 21 to the Company’s Annual Report on Form 10-K for the year ended September 30, 2010). | |
| 23 |
Consent of KPMG LLP. | |
| 31.1 |
Certification of the Chief Executive Officer Pursuant to Section 302 of the Sarbanes-Oxley Act of 2002. | |
| 31.2 |
Certification of the Executive Vice President & Chief Financial Officer Pursuant to Section 302 of the Sarbanes-Oxley Act of 2002. | |
| 32.1 |
Certification of the Chief Executive Officer Pursuant to 18 U.S.C. Section 1350, as Adopted Pursuant to Section 906 of the Sarbanes-Oxley Act of 2002. | |
| 32.2 |
Certification of the Executive Vice President & Chief Financial Officer Pursuant to 18 U.S.C. Section 1350, as Adopted Pursuant to Section 906 of the Sarbanes-Oxley Act of 2002. | |
| **101.INS |
XBRL Instance Document | |
| **101.SCH |
XBRL Taxonomy Extension Schema Document | |
| **101.CAL |
XBRL Taxonomy Extension Calculation Linkbase Document | |
| **101.DEF |
XBRL Taxonomy Extension Definition Linkbase Document | |
| **101.LAB |
XBRL Taxonomy Extension Label Linkbase Document | |
| **101.PRE |
XBRL Taxonomy Extension Presentation Linkbase Document | |
| * | Incorporated by reference. |
| ** | XBRL (Extensible Business Reporting Language) information is furnished and not filed or a part of a registration statement or prospectus for purposes of Sections 11 or 12 of the Securities Act of 1933, is deemed not filed for purposes of Section 18 of the Securities Exchange Act of 1934, and otherwise is not subject to liability under these sections. |
| † | Management contract or compensatory plan or arrangement. |
62
SIGNATURES
Pursuant to the requirements of Section 13 or 15(d) of the Securities Exchange Act of 1934, the Registrant has duly caused this report to be signed on its behalf by the undersigned, thereunto duly authorized, in the City of Philadelphia, Commonwealth of Pennsylvania, on December 14, 2011.
| DESTINATION MATERNITY CORPORATION | ||
| By: |
/s/ EDWARD M. KRELL | |
| Edward M. Krell | ||
| Chief Executive Officer (Principal Executive Officer) | ||
| By: |
/s/ JUDD P. TIRNAUER | |
| Judd P. Tirnauer | ||
| Executive Vice President & Chief Financial Officer (Principal Financial and Accounting Officer) | ||
Pursuant to the requirements of the Securities Exchange Act of 1934, this Report has been signed by the following persons on December 14, 2011, in the capacities indicated:
| /s/ EDWARD M. KRELL Edward M. Krell |
Chief Executive Officer and Director (Principal Executive Officer) | |
| /s/ JUDD P. TIRNAUER Judd P. Tirnauer |
Executive Vice President & Chief Financial Officer (Principal Financial and Accounting Officer) | |
| /s/ ARNAUD AJDLER Arnaud Ajdler |
Director (Non-Executive Chairman of the Board) | |
| /s/ BARRY ERDOS Barry Erdos |
Director | |
| /s/ JOSEPH A. GOLDBLUM Joseph A. Goldblum |
Director | |
| /s/ MELISSA PAYNER-GREGOR Melissa Payner-Gregor |
Director | |
| /s/ WILLIAM A. SCHWARTZ, JR. William A. Schwartz, Jr. |
Director | |
| /s/ B. ALLEN WEINSTEIN B. Allen Weinstein |
Director | |
63
DESTINATION MATERNITY CORPORATION AND SUBSIDIARIES
INDEX TO CONSOLIDATED FINANCIAL STATEMENTS
AND FINANCIAL STATEMENT SCHEDULE
| F-2 | ||
| F-3 | ||
| F-4 | ||
| Consolidated Statements of Stockholders’ Equity and Comprehensive Income (Loss) |
F-5 to F-6 | |
| F-7 | ||
| F-8 to F-35 | ||
| Schedule Supporting the Consolidated Financial Statements: |
||
| F-36 | ||
F-1
REPORT OF INDEPENDENT REGISTERED PUBLIC ACCOUNTING FIRM
The Board of Directors and Stockholders
Destination Maternity Corporation:
We have audited the accompanying consolidated balance sheets of Destination Maternity Corporation and subsidiaries as of September 30, 2011 and 2010, and the related consolidated statements of operations, stockholders’ equity and comprehensive income (loss) and cash flows for each of the years in the three-year period ended September 30, 2011. In connection with our audits of the consolidated financial statements, we also have audited the related financial statement schedule, Valuation and Qualifying Accounts. These consolidated financial statements and financial statement schedule are the responsibility of the Company’s management. Our responsibility is to express an opinion on these consolidated financial statements and financial statement schedule based on our audits.
We conducted our audits in accordance with the standards of the Public Company Accounting Oversight Board (United States). Those standards require that we plan and perform the audit to obtain reasonable assurance about whether the financial statements are free of material misstatement. An audit includes examining, on a test basis, evidence supporting the amounts and disclosures in the financial statements. An audit also includes assessing the accounting principles used and significant estimates made by management, as well as evaluating the overall financial statement presentation. We believe that our audits provide a reasonable basis for our opinion.
In our opinion, the consolidated financial statements referred to above present fairly, in all material respects, the financial position of Destination Maternity Corporation and subsidiaries as of September 30, 2011 and 2010, and the results of their operations and their cash flows for each of the years in the three-year period ended September 30, 2011, in conformity with U.S. generally accepted accounting principles. Also in our opinion, the related financial statement schedule, when considered in relation to the basic consolidated financial statements taken as a whole, presents fairly, in all material respects, the information set forth therein.
We also have audited, in accordance with the standards of the Public Company Accounting Oversight Board (United States), Destination Maternity Corporation’s internal control over financial reporting as of September 30, 2011, based on criteria established in Internal Control—Integrated Framework issued by the Committee of Sponsoring Organizations of the Treadway Commission (COSO), and our report dated December 14, 2011 expressed an unqualified opinion on the effectiveness of the Company’s internal control over financial reporting.
| /s/ KPMG LLP |
| Philadelphia, Pennsylvania |
| December 14, 2011 |
F-2
DESTINATION MATERNITY CORPORATION AND SUBSIDIARIES
CONSOLIDATED BALANCE SHEETS
(in thousands, except share and per share amounts)
| September 30, | ||||||||
| 2011 | 2010 | |||||||
| ASSETS | ||||||||
| Current assets: |
||||||||
| Cash and cash equivalents |
$ | 15,285 | $ | 24,633 | ||||
| Trade receivables, net |
11,015 | 10,343 | ||||||
| Inventories |
90,366 | 80,735 | ||||||
| Deferred income taxes |
7,572 | 8,669 | ||||||
| Prepaid expenses and other current assets |
6,797 | 6,667 | ||||||
|
|
|
|
|
|||||
| Total current assets |
131,035 | 131,047 | ||||||
|
|
|
|
|
|||||
| Property, plant and equipment, net |
55,854 | 58,702 | ||||||
|
|
|
|
|
|||||
| Other assets: |
||||||||
| Deferred financing costs, net of accumulated amortization of $760 and $668 |
158 | 338 | ||||||
| Other intangible assets, net of accumulated amortization of $2,082 and $2,062 |
1,248 | 1,095 | ||||||
| Deferred income taxes |
10,133 | 13,654 | ||||||
| Other non-current assets |
344 | 318 | ||||||
|
|
|
|
|
|||||
| Total other assets |
11,883 | 15,405 | ||||||
|
|
|
|
|
|||||
| Total assets |
$ | 198,772 | $ | 205,154 | ||||
|
|
|
|
|
|||||
| LIABILITIES AND STOCKHOLDERS’ EQUITY | ||||||||
| Current liabilities: |
||||||||
| Line of credit borrowings |
$ | — | $ | — | ||||
| Current portion of long-term debt |
2,915 | 5,834 | ||||||
| Accounts payable |
18,456 | 19,475 | ||||||
| Accrued expenses and other current liabilities |
33,680 | 42,088 | ||||||
|
|
|
|
|
|||||
| Total current liabilities |
55,051 | 67,397 | ||||||
| Long-term debt |
28,427 | 39,327 | ||||||
| Deferred rent and other non-current liabilities |
22,599 | 26,832 | ||||||
|
|
|
|
|
|||||
| Total liabilities |
106,077 | 133,556 | ||||||
|
|
|
|
|
|||||
| Commitments and contingencies (Note 17) |
||||||||
| Stockholders’ equity: |
||||||||
| Preferred stock, 1,656,381 shares authorized |
||||||||
| Series B junior participating preferred stock, $.01 par value; 300,000 shares authorized, none outstanding |
— | — | ||||||
| Common stock, $.01 par value; 20,000,000 shares authorized, 13,225,928 and 12,691,170 shares issued and outstanding, respectively |
132 | 127 | ||||||
| Additional paid-in capital |
92,932 | 88,399 | ||||||
| Accumulated deficit |
(261 | ) | (16,348 | ) | ||||
| Accumulated other comprehensive loss |
(108 | ) | (580 | ) | ||||
|
|
|
|
|
|||||
| Total stockholders’ equity |
92,695 | 71,598 | ||||||
|
|
|
|
|
|||||
| Total liabilities and stockholders’ equity |
$ | 198,772 | $ | 205,154 | ||||
|
|
|
|
|
|||||
The accompanying notes are an integral part of these Consolidated Financial Statements.
F-3
DESTINATION MATERNITY CORPORATION AND SUBSIDIARIES
CONSOLIDATED STATEMENTS OF OPERATIONS
(in thousands, except per share amounts)
| Year Ended September 30, | ||||||||||||
| 2011 | 2010 | 2009 | ||||||||||
| Net sales |
$ | 545,394 | $ | 531,192 | $ | 531,251 | ||||||
| Cost of goods sold |
248,497 | 240,166 | 248,476 | |||||||||
|
|
|
|
|
|
|
|||||||
| Gross profit |
296,897 | 291,026 | 282,775 | |||||||||
| Selling, general and administrative expenses |
257,421 | 251,653 | 259,552 | |||||||||
| Store closing, asset impairment and asset disposal expenses |
1,039 | 2,282 | 536 | |||||||||
| Restructuring and other charges |
193 | 5,658 | 1,557 | |||||||||
| Goodwill impairment expense |
— | — | 50,389 | |||||||||
|
|
|
|
|
|
|
|||||||
| Operating income (loss) |
38,244 | 31,433 | (29,259 | ) | ||||||||
| Interest expense, net |
2,233 | 3,300 | 4,720 | |||||||||
| Loss on extinguishment of debt |
37 | 51 | 123 | |||||||||
|
|
|
|
|
|
|
|||||||
| Income (loss) before income taxes |
35,974 | 28,082 | (34,102 | ) | ||||||||
| Income tax provision |
12,986 | 11,253 | 6,580 | |||||||||
|
|
|
|
|
|
|
|||||||
| Net income (loss) |
$ | 22,988 | $ | 16,829 | $ | (40,682 | ) | |||||
|
|
|
|
|
|
|
|||||||
| Net income (loss) per share—Basic |
$ | 1.79 | $ | 1.37 | $ | (3.39 | ) | |||||
|
|
|
|
|
|
|
|||||||
| Average shares outstanding—Basic |
12,820 | 12,304 | 11,985 | |||||||||
|
|
|
|
|
|
|
|||||||
| Net income (loss) per share—Diluted |
$ | 1.75 | $ | 1.33 | $ | (3.39 | ) | |||||
|
|
|
|
|
|
|
|||||||
| Average shares outstanding—Diluted |
13,120 | 12,691 | 11,985 | |||||||||
|
|
|
|
|
|
|
|||||||
The accompanying notes are an integral part of these Consolidated Financial Statements.
F-4
DESTINATION MATERNITY CORPORATION AND SUBSIDIARIES
CONSOLIDATED STATEMENTS OF STOCKHOLDERS’ EQUITY
AND COMPREHENSIVE INCOME (LOSS)
(in thousands)
| Common Stock | Additional Paid-in Capital |
Retained Earnings (Accumulated Deficit) |
Accumulated Other Comprehensive Loss |
Total | Comprehensive Income (Loss) |
|||||||||||||||||||||||
| Number of Shares |
Amount | |||||||||||||||||||||||||||
| Balance as of September 30, 2008 |
12,142 | $ | 122 | $ | 83,213 | $ | 7,505 | $ | (1,372 | ) | $ | 89,468 | ||||||||||||||||
| Net loss |
— | — | — | (40,682 | ) | — | (40,682 | ) | $ | (40,682 | ) | |||||||||||||||||
| Amortization of prior service cost for retirement plans, net of tax |
— | — | — | — | 123 | 123 | 123 | |||||||||||||||||||||
| Change in fair value of interest rate swap, net of tax |
— | — | — | — | (392 | ) | (392 | ) | (392 | ) | ||||||||||||||||||
|
|
|
|||||||||||||||||||||||||||
| Comprehensive loss |
$ | (40,951 | ) | |||||||||||||||||||||||||
|
|
|
|||||||||||||||||||||||||||
| Stock-based compensation |
76 | — | 2,031 | — | — | 2,031 | ||||||||||||||||||||||
| Exercise of stock options |
9 | — | 55 | — | — | 55 | ||||||||||||||||||||||
| Tax benefit shortfall from stock option exercises and restricted stock vesting |
— | — | (789 | ) | — | — | (789 | ) | ||||||||||||||||||||
| Repurchase and retirement of common shares |
(4 | ) | — | (14 | ) | — | — | (14 | ) | |||||||||||||||||||
|
|
|
|
|
|
|
|
|
|
|
|
|
|||||||||||||||||
| Balance as of September 30, 2009 |
12,223 | 122 | 84,496 | (33,177 | ) | (1,641 | ) | 49,800 | ||||||||||||||||||||
| Net income |
— | — | — | 16,829 | — | 16,829 | $ | 16,829 | ||||||||||||||||||||
| Amortization of prior service cost for retirement plans, net of tax |
— | — | — | — | 88 | 88 | 88 | |||||||||||||||||||||
| Retirement plan amendment, net of tax |
— | — | — | — | 281 | 281 | 281 | |||||||||||||||||||||
| Change in fair value of interest rate swap, net of tax |
— | — | — | — | 692 | 692 | 692 | |||||||||||||||||||||
|
|
|
|||||||||||||||||||||||||||
| Comprehensive income |
$ | 17,890 | ||||||||||||||||||||||||||
|
|
|
|||||||||||||||||||||||||||
| Stock-based compensation |
89 | 1 | 1,935 | — | — | 1,936 | ||||||||||||||||||||||
| Exercise of stock options, net |
466 | 5 | 1,364 | — | — | 1,369 | ||||||||||||||||||||||
| Excess tax benefit from stock option exercises and restricted stock vesting |
— | — | 1,563 | — | — | 1,563 | ||||||||||||||||||||||
| Repurchase and retirement of common shares |
(87 | ) | (1 | ) | (959 | ) | — | — | (960 | ) | ||||||||||||||||||
|
|
|
|
|
|
|
|
|
|
|
|
|
|||||||||||||||||
| Balance as of September 30, 2010 |
12,691 | $ | 127 | $ | 88,399 | $ | (16,348 | ) | $ | (580 | ) | $ | 71,598 | |||||||||||||||
|
|
|
|
|
|
|
|
|
|
|
|
|
|||||||||||||||||
The accompanying notes are an integral part of these Consolidated Financial Statements.
F-5
DESTINATION MATERNITY CORPORATION AND SUBSIDIARIES
CONSOLIDATED STATEMENTS OF STOCKHOLDERS’ EQUITY
AND COMPREHENSIVE INCOME (LOSS) (Continued)
(in thousands)
| Common Stock | Additional Paid-in Capital |
Accumulated Deficit |
Accumulated Other Comprehensive Loss |
Total | Comprehensive Income |
|||||||||||||||||||||||
| Number of Shares |
Amount | |||||||||||||||||||||||||||
| Balance as of September 30, 2010 |
12,691 | $ | 127 | $ | 88,399 | $ | (16,348 | ) | $ | (580 | ) | $ | 71,598 | |||||||||||||||
| Net income |
— | — | — | 22,988 | — | 22,988 | $ | 22,988 | ||||||||||||||||||||
| Change in fair value of interest rate swap, net of tax |
— | — | — | — | 490 | 490 | 490 | |||||||||||||||||||||
| Foreign currency translation adjustments |
— | — | — | — | (18 | ) | (18 | ) | (18 | ) | ||||||||||||||||||
|
|
|
|||||||||||||||||||||||||||
| Comprehensive income |
$ | 23,460 | ||||||||||||||||||||||||||
|
|
|
|||||||||||||||||||||||||||
| Cash dividends |
— | — | — | (6,901 | ) | — | (6,901 | ) | ||||||||||||||||||||
| Stock-based compensation |
117 | 1 | 2,343 | — | — | 2,344 | ||||||||||||||||||||||
| Exercise of stock options, net |
547 | 5 | 2,280 | — | — | 2,285 | ||||||||||||||||||||||
| Excess tax benefit from stock option exercises and restricted stock vesting |
— | — | 2,695 | — | — | 2,695 | ||||||||||||||||||||||
| Repurchase and retirement of common shares |
(129 | ) | (1 | ) | (2,785 | ) | — | — | (2,786 | ) | ||||||||||||||||||
|
|
|
|
|
|
|
|
|
|
|
|
|
|||||||||||||||||
| Balance as of September 30, 2011 |
13,226 | $ | 132 | $ | 92,932 | $ | (261 | ) | $ | (108 | ) | $ | 92,695 | |||||||||||||||
|
|
|
|
|
|
|
|
|
|
|
|
|
|||||||||||||||||
The accompanying notes are an integral part of these Consolidated Financial Statements.
F-6
DESTINATION MATERNITY CORPORATION AND SUBSIDIARIES
CONSOLIDATED STATEMENTS OF CASH FLOWS
(in thousands)
| Year Ended September 30, | ||||||||||||
| 2011 | 2010 | 2009 | ||||||||||
| Operating Activities |
||||||||||||
| Net income (loss) |
$ | 22,988 | $ | 16,829 | $ | (40,682 | ) | |||||
| Adjustments to reconcile net income (loss) to net cash provided by operating activities: |
||||||||||||
| Depreciation and amortization |
12,769 | 12,917 | 14,982 | |||||||||
| Stock-based compensation expense |
2,344 | 1,936 | 2,031 | |||||||||
| Loss on impairment of long-lived assets |
768 | 1,865 | 667 | |||||||||
| Loss on impairment of goodwill |
— | — | 50,389 | |||||||||
| Loss (gain) on disposal of assets |
270 | 196 | (48 | ) | ||||||||
| Loss on extinguishment of debt |
37 | 51 | 123 | |||||||||
| Deferred income tax provision (benefit) |
2,679 | (2,062 | ) | 1,318 | ||||||||
| Amortization of deferred financing costs |
170 | 196 | 221 | |||||||||
| Changes in assets and liabilities: |
||||||||||||
| (Increase) decrease in: |
||||||||||||
| Trade receivables |
(680 | ) | (3,814 | ) | 556 | |||||||
| Inventories |
(9,632 | ) | (1,863 | ) | 9,184 | |||||||
| Prepaid expenses and other current assets |
(1,634 | ) | (1,310 | ) | 2,920 | |||||||
| Other non-current assets |
(26 | ) | (4 | ) | (15 | ) | ||||||
| (Decrease) increase in: |
||||||||||||
| Accounts payable, accrued expenses and other current liabilities |
(5,525 | ) | (1,028 | ) | 769 | |||||||
| Deferred rent and other non-current liabilities |
(3,085 | ) | 2,065 | 110 | ||||||||
|
|
|
|
|
|
|
|||||||
| Net cash provided by operating activities |
21,443 | 25,974 | 42,525 | |||||||||
|
|
|
|
|
|
|
|||||||
| Investing Activities |
||||||||||||
| Withdrawal from (contribution to) grantor trust |
1,504 | (1,500 | ) | — | ||||||||
| Capital expenditures |
(12,270 | ) | (10,448 | ) | (12,639 | ) | ||||||
| Proceeds from sale of assets held for sale |
— | — | 526 | |||||||||
| Purchase of intangible assets |
(313 | ) | (293 | ) | (342 | ) | ||||||
|
|
|
|
|
|
|
|||||||
| Net cash used in investing activities |
(11,079 | ) | (12,241 | ) | (12,455 | ) | ||||||
|
|
|
|
|
|
|
|||||||
| Financing Activities |
||||||||||||
| (Decrease) increase in cash overdrafts |
(1,147 | ) | 550 | (380 | ) | |||||||
| Repayment of long-term debt |
(13,819 | ) | (12,248 | ) | (21,237 | ) | ||||||
| Deferred financing costs paid |
(26 | ) | — | — | ||||||||
| Withholding taxes on stock-based compensation paid in connection with repurchase of common stock |
(2,786 | ) | (960 | ) | (14 | ) | ||||||
| Cash dividends paid |
(6,901 | ) | — | — | ||||||||
| Payout of redeemed Series A preferred stock |
— | — | (16 | ) | ||||||||
| Proceeds from exercise of stock options |
2,285 | 1,369 | 55 | |||||||||
| Excess tax benefit from exercise of stock options and restricted stock vesting |
2,695 | 1,563 | — | |||||||||
|
|
|
|
|
|
|
|||||||
| Net cash used in financing activities |
(19,699 | ) | (9,726 | ) | (21,592 | ) | ||||||
|
|
|
|
|
|
|
|||||||
| Effect of exchange rate changes on cash and cash equivalents |
(13 | ) | — | — | ||||||||
|
|
|
|
|
|
|
|||||||
| Net (Decrease) Increase in Cash and Cash Equivalents |
(9,348 | ) | 4,007 | 8,478 | ||||||||
| Cash and Cash Equivalents, Beginning of Year |
24,633 | 20,626 | 12,148 | |||||||||
|
|
|
|
|
|
|
|||||||
| Cash and Cash Equivalents, End of Year |
$ | 15,285 | $ | 24,633 | $ | 20,626 | ||||||
|
|
|
|
|
|
|
|||||||
The accompanying notes are an integral part of these Consolidated Financial Statements.
F-7
DESTINATION MATERNITY CORPORATION AND SUBSIDIARIES
NOTES TO CONSOLIDATED FINANCIAL STATEMENTS
1. NATURE OF BUSINESS
Destination Maternity Corporation and subsidiaries (the “Company”) is a specialty designer and retailer of maternity clothing. The Company operated 2,352 retail locations as of September 30, 2011, including 658 stores and 1,694 leased departments, throughout the United States, Puerto Rico, Guam and Canada, and markets its maternity apparel on the Internet through its DestinationMaternity.com and brand-specific websites. In addition, the Company markets maternity apparel at Kohl’s® stores throughout the United States under an exclusive product and license agreement. The Company is expanding internationally and has entered into exclusive store franchise and product supply relationships in the Middle East, India and South Korea. The Company was incorporated in Delaware in 1982.
2. SUMMARY OF SIGNIFICANT ACCOUNTING POLICIES
a. Principles of Consolidation and Basis of Financial Statement Presentation
The accompanying consolidated financial statements include the accounts of the Company and its direct and indirect wholly-owned subsidiaries: Cave Springs, Inc., Mothers Work Canada, Inc., Destination Maternity Apparel Private Limited, Maternity Factory Warehouse Centre, Inc. (a wholly-owned subsidiary of Mothers Work Canada, Inc.), Mothers Work Services, Inc. and Confecciones Acona S.A. All significant intercompany transactions and accounts have been eliminated in consolidation.
b. Fiscal Year-End
The Company operates on a fiscal year ending September 30 of each year. All references to fiscal years of the Company refer to the fiscal years ended on September 30 in those years. For example, the Company’s “fiscal 2011” ended on September 30, 2011.
c. Use of Estimates
The preparation of financial statements in conformity with accounting principles generally accepted in the United States requires management to make certain estimates and assumptions that may affect the reported amounts of assets and liabilities and disclosure of contingent assets and liabilities at the date of the financial statements and the reported amounts of revenues and expenses during the reporting period. Actual results could differ from those estimates.
d. Cash and Cash Equivalents
Cash and cash equivalents include cash on hand, cash in the bank and short-term investments with an original maturity of three months or less when purchased. Cash overdrafts of $3,853,000 and $5,000,000 were included in accounts payable as of September 30, 2011 and 2010, respectively.
The Company maintains cash accounts that, at times, may exceed federally insured limits. The Company has not experienced any losses from maintaining cash accounts in excess of such limits. Management believes that it is not exposed to any significant credit risks on its cash accounts.
e. Inventories
Inventories are valued at the lower of cost or market. Cost is determined by the “first-in, first-out” (FIFO) method. Inventories of goods manufactured by the Company include the cost of materials, freight, direct labor, and manufacturing and distribution overhead.
F-8
DESTINATION MATERNITY CORPORATION AND SUBSIDIARIES
NOTES TO CONSOLIDATED FINANCIAL STATEMENTS (Continued)
2. SUMMARY OF SIGNIFICANT ACCOUNTING POLICIES (Continued)
f. Property, Plant and Equipment
Property, plant and equipment are stated at cost. Depreciation and amortization are computed for financial reporting purposes on a straight-line basis, using service lives ranging principally from five to ten years for furniture and equipment and forty years for the building. Leasehold improvements are amortized using the straight-line method over the shorter of the lease term or their useful life. The cost of assets sold or retired and the related accumulated depreciation or amortization are removed from the accounts with any resulting gain or loss included in net income (loss). Maintenance and repairs are expensed as incurred, except for the capitalization of major renewals and betterments that extend the life of the asset. Long-lived assets are reviewed for impairment whenever adverse events, or changes in circumstances or business climate, indicate that the carrying value may not be recoverable. Factors used in the evaluation include, but are not limited to, management’s plans for future operations, brand initiatives, recent operating results and projected cash flows. If the associated undiscounted cash flows are insufficient to support the recorded asset, an impairment loss is recognized to reduce the carrying value of the asset. The amount of the impairment loss is determined by comparing the fair value of the asset with the carrying value.
During fiscal 2011, 2010 and 2009, the Company recorded impairment write-downs of property, plant and equipment totaling $759,000, $1,863,000 and $665,000, respectively, on a pretax basis.
g. Intangible Assets
Intangible assets with definite useful lives, which primarily consist of lease acquisition costs and patents, are amortized over the shorter of their useful life or, if applicable, the lease term. Management reviews the carrying amount of these intangible assets as impairment indicators arise, to assess the continued recoverability based on future undiscounted cash flows and operating results from the related asset, future asset utilization and changes in market conditions. During fiscal 2011, 2010 and 2009, the Company recorded write-downs of intangible assets totaling $9,000, $2,000 and $2,000, respectively, on a pretax basis. The Company has not identified any indefinite-lived intangible assets. Aggregate amortization expense of intangible assets in fiscal 2011, 2010 and 2009 was $135,000, $119,000 and $109,000, respectively.
Estimated amortization expense for the next five fiscal years is as follows (in thousands):
| Fiscal Year |
||||
| 2012 |
$ | 134 | ||
| 2013 |
127 | |||
| 2014 |
114 | |||
| 2015 |
97 | |||
| 2016 |
92 | |||
h. Interest Rate Derivatives
The Company mitigates a portion of its floating rate interest risk on variable rate long-term debt through an interest rate swap agreement. In accordance with applicable accounting standards for derivative instruments, the Company recognizes the derivative on the balance sheet at fair value. On the date the derivative instrument was entered into, the Company designated it as a hedge of the variability of cash flows to be received or paid related to a recognized asset or liability (“cash flow hedge”). Changes in the fair value of a derivative that is designated as, and meets all the criteria for, a cash flow hedge are recorded in accumulated other comprehensive loss and reclassified into earnings as the underlying hedged item affects earnings. The Company formally documents the relationship between hedging instruments and hedged items. The Company also formally assesses at the
F-9
DESTINATION MATERNITY CORPORATION AND SUBSIDIARIES
NOTES TO CONSOLIDATED FINANCIAL STATEMENTS (Continued)
2. SUMMARY OF SIGNIFICANT ACCOUNTING POLICIES (Continued)
inception of the hedge and on a quarterly basis, whether the derivative is highly effective in offsetting changes in cash flows of the hedged item. Any portion of the change in fair value of the derivative associated with hedge ineffectiveness is included in current earnings. As of September 30, 2011 and for the year then ended, the Company’s interest rate swap was determined to have no ineffectiveness.
i. Deferred Financing Costs
Deferred financing costs are amortized to interest expense over the term of the related debt agreement. Amortization expense of deferred financing costs in fiscal 2011, 2010 and 2009 was $170,000, $196,000 and $221,000, respectively. In connection with debt extinguishments, in fiscal 2011, 2010 and 2009 the Company wrote off $37,000, $51,000 and $123,000, respectively, of unamortized deferred financing costs (see Note 11).
Estimated amortization expense of deferred financing costs for future fiscal years is as follows (in thousands):
| Fiscal Year |
||||
| 2012 |
$ | 115 | ||
| 2013 |
43 | |||
j. Deferred Rent
Rent expense on operating leases, including rent holidays and scheduled rent increases, is recorded on a straight-line basis over the term of the lease commencing on the date the Company takes possession of the leased property, which is generally four to six weeks prior to a store’s opening date. The net excess of rent expense over the actual cash paid has been recorded as a deferred rent liability in the accompanying Consolidated Balance Sheets. Tenant improvement allowances received from landlords are also included in the accompanying Consolidated Balance Sheets as deferred rent liabilities and are amortized as a reduction of rent expense over the term of the lease from the possession date.
k. Treasury (Reacquired) Shares
Shares repurchased are retired and treated as authorized but unissued shares, with the cost in excess of par value of the reacquired shares charged to additional paid-in capital and the par value charged to common stock.
l. Fair Value of Financial Instruments
The carrying values of cash and cash equivalents, trade receivables and accounts payable approximate fair value due to the short-term nature of those instruments. The majority of the Company’s long-term debt bears interest at variable rates, which adjust based on market conditions, and the carrying value of the long-term debt approximates fair value. The fair value of the Company’s debt was determined using a discounted cash flow analysis based on interest rates currently available to the Company or for similar instruments available to companies with comparable credit quality. The difference between the carrying value and fair value of long-term debt held by the Company with fixed rates of interest is not significant. A portion of the Company’s floating rate interest risk on variable rate long-term debt is mitigated through an interest rate swap agreement. As of September 30, 2011 and 2010, the estimated fair value of the interest rate swap was an unrealized loss of $(145,000) and $(925,000), respectively.
m. Revenue Recognition, Sales Returns and Allowances
Revenue is recognized at the point of sale for retail store sales, including leased department sales, or when merchandise is delivered to customers for licensed product and Internet sales, and when merchandise is shipped
F-10
DESTINATION MATERNITY CORPORATION AND SUBSIDIARIES
NOTES TO CONSOLIDATED FINANCIAL STATEMENTS (Continued)
2. SUMMARY OF SIGNIFICANT ACCOUNTING POLICIES (Continued)
to international franchisees. A liability is established for the retail value of gift cards sold and merchandise credits issued. The liability is relieved and revenue is recognized when gift cards or merchandise credits are redeemed by customers as tender for merchandise purchased. Allowances for returns are recorded as a reduction of revenue, based on the Company’s historical experience. Revenues are recorded net of applicable sales taxes.
n. Other Revenues
Included in net sales are revenues earned by the Company through a variety of marketing partnership programs utilizing the Company’s opt-in customer database and various in-store marketing initiatives, focused on baby and parent-related products and services. Revenue from marketing partnership programs is recognized when goods or services are provided. Also included in net sales are fees and royalties related to international franchise agreements. Franchise fees are earned by the Company when all material services or conditions related to the franchise agreement have been substantially performed or satisfied and royalties are earned based on net sales of the Company’s international franchisees and may include minimum guaranteed royalties.
o. Cost of Goods Sold
Cost of goods sold in the accompanying Consolidated Statements of Operations includes: merchandise costs (including customs duty expenses), expenses related to inventory shrinkage, product-related corporate expenses (including expenses related to payroll, benefit costs and operating expenses of the Company’s buying departments), inventory reserves (including lower of cost or market reserves), inbound freight charges, purchasing and receiving costs, inspection costs, warehousing costs, internal transfer costs, and the other costs of the Company’s distribution network.
p. Shipping and Handling Fees and Costs
The Company includes shipping and handling revenue earned from its Internet activities in net sales. Shipping and handling costs, which are included in cost of goods sold in the accompanying Consolidated Statements of Operations, include shipping supplies, related labor costs and third-party shipping costs.
q. Selling, General and Administrative Expenses
Selling, general and administrative expenses in the accompanying Consolidated Statements of Operations include advertising and marketing expenses, corporate administrative expenses, store expenses (including store payroll and store occupancy expenses), and store opening expenses.
r. Advertising Costs
The Company expenses the costs of advertising when the advertising first occurs. Advertising expenses, including Internet advertising expenses, were $11,712,000, $12,147,000 and $11,213,000 in fiscal 2011, 2010 and 2009, respectively.
s. Store Closing, Asset Impairment and Asset Disposal Expenses
Store closing expenses include lease termination fees, gains or losses on disposal of closed store assets and recognition of unamortized deferred rent. Asset impairment expenses represent losses recognized to reduce the carrying value of impaired long-lived assets. Asset disposal expenses represent gains or losses on disposal of assets other than in connection with store closings, including assets disposed from remodeling or relocation of stores.
F-11
DESTINATION MATERNITY CORPORATION AND SUBSIDIARIES
NOTES TO CONSOLIDATED FINANCIAL STATEMENTS (Continued)
2. SUMMARY OF SIGNIFICANT ACCOUNTING POLICIES (Continued)
t. Income Taxes
The Company utilizes the asset and liability method of accounting for income taxes. Under this method, deferred tax assets and liabilities are recognized for the expected future tax consequences of temporary differences between the carrying amounts and the tax bases of assets and liabilities as well as from net operating loss carryforwards. The effect on deferred tax assets and liabilities of a change in tax rates is recognized in operations in the period that includes the enactment date.
Under the accounting standard for uncertain income tax positions, recognition of a tax benefit occurs when a tax position is estimated by management to be more likely than not to be sustained upon examination, based solely on its technical merits. Derecognition of a previously recognized tax position would occur if it is subsequently determined that the tax position no longer meets the more-likely-than-not threshold of being sustained. Recognized tax positions are measured at the largest amount that management believes has a greater than 50% likelihood of being finalized. The Company records interest and penalties related to unrecognized tax benefits in income tax provision.
u. Stock Split, Net Income (Loss) per Share and Cash Dividends
On January 26, 2011, the Company announced that its Board of Directors (the “Board”) approved a two-for-one split of the Company’s common stock in the form of a stock dividend, pursuant to which on March 1, 2011, stockholders of record at the close of business on February 16, 2011 received one additional common share for every share held. In accordance with the provisions of the Company’s equity award plans and as determined by the Company’s Board, the number of shares available for issuance, the number of shares subject to outstanding equity awards and the exercise prices of outstanding stock option awards were also adjusted to equitably reflect the effect of the two-for-one stock split. All share and per share amounts give effect to the stock split and have been adjusted retroactively for all periods presented.
Basic net income (loss) (or earnings) per share (“Basic EPS”) is computed by dividing net income (loss) by the weighted average number of common shares outstanding, excluding restricted stock awards for which the restrictions have not lapsed. Diluted net income (loss) per share (“Diluted EPS”) is computed by dividing net income (loss) by the weighted average number of common shares outstanding, after giving effect to the potential dilution, if applicable, from the assumed lapse of restrictions on restricted stock awards and exercise of stock options into shares of common stock as if those stock options were exercised (see Note 15).
The following table summarizes those effects for the diluted net income (loss) per share calculation (in thousands, except per share amounts):
| Year Ended September 30, | ||||||||||||
| 2011 | 2010 | 2009 | ||||||||||
| Net income (loss) |
$ | 22,988 | $ | 16,829 | $ | (40,682 | ) | |||||
|
|
|
|
|
|
|
|||||||
| Net income (loss) per share—Basic |
$ | 1.79 | $ | 1.37 | $ | (3.39 | ) | |||||
|
|
|
|
|
|
|
|||||||
| Net income (loss) per share—Diluted |
$ | 1.75 | $ | 1.33 | $ | (3.39 | ) | |||||
|
|
|
|
|
|
|
|||||||
| Average number of shares outstanding—Basic |
12,820 | 12,304 | 11,985 | |||||||||
| Incremental shares from the assumed exercise of outstanding stock options |
239 | 316 | — | |||||||||
| Incremental shares from the assumed lapse of restrictions on restricted stock awards |
61 | 71 | — | |||||||||
|
|
|
|
|
|
|
|||||||
| Average number of shares outstanding—Diluted |
13,120 | 12,691 | 11,985 | |||||||||
|
|
|
|
|
|
|
|||||||
F-12
DESTINATION MATERNITY CORPORATION AND SUBSIDIARIES
NOTES TO CONSOLIDATED FINANCIAL STATEMENTS (Continued)
2. SUMMARY OF SIGNIFICANT ACCOUNTING POLICIES (Continued)
For fiscal 2011 and 2010, options and unvested restricted stock totaling approximately 164,000 and 292,000 shares, respectively, were excluded from the calculation of Diluted EPS as their effect would have been antidilutive. Options and restricted stock totaling approximately 1,895,000 shares of the Company’s common stock were outstanding as of September 30, 2009, but were not included in the computation of Diluted EPS for fiscal 2009 due to the Company’s net loss position. Had the Company reported a profit for fiscal 2009 the average number of dilutive shares outstanding for computation of Diluted EPS would have been approximately 12,135,000.
On January 26, 2011, the Company announced the initiation of a regular quarterly cash dividend. During fiscal 2011 the Company paid cash dividends totaling $6,901,000 (reflecting three quarterly dividend payments or a total of $0.525 per share after giving effect to the March 1, 2011 stock split). On November 9, 2011 the Company declared a quarterly cash dividend of $0.175 per share payable on December 28, 2011, which will require approximately $2,315,000 of available cash.
v. Statements of Cash Flows
In fiscal 2011, 2010 and 2009, the Company paid interest, including payments made on its interest rate swap agreement (see Note 11), of $2,266,000, $3,414,000 and $4,809,000, respectively, and made income tax payments, net of refunds, of $10,381,000, $9,804,000 and $2,357,000, respectively.
w. Business and Credit Risk
Financial instruments, primarily cash and cash equivalents and trade receivables, potentially subject the Company to concentrations of credit risk. The Company limits its credit risk associated with cash and cash equivalents by placing such investments in highly liquid funds and instruments. Trade receivables associated with third-party credit cards are processed by financial institutions, which are monitored for financial stability. Trade receivables associated with licensed, leased department and other relationships are evaluated for collectibility based on a combination of factors, including aging of trade receivables, write-off experience and past payment trends. The Company is dependent on key suppliers to provide sufficient quantities of inventory at competitive prices. No single supplier represented 10% or more of net purchases in fiscal 2011, 2010 or 2009. A significant majority of the Company’s purchases during fiscal 2011, 2010 and 2009 were imported. Management believes that any event causing a disruption of imports from any specific country could be mitigated by moving production to readily available alternative sources.
x. Insurance
The Company is self-insured for workers’ compensation, general liability and automotive liability claims, and employee-related health care benefits, up to certain stop-loss limits. Such costs are accrued based on known claims and an estimate of incurred but not reported claims. Further, the Company utilizes a cooperative arrangement with a number of other companies to assist in managing certain workers’ compensation and general liability insurance risks for loss occurences prior to March 1, 2010. The Company’s expenses associated with this relationship could be impacted by the loss history associated with the cooperative as a whole. Liabilities associated with these risks are estimated by considering historical claims experience and other actuarial assumptions.
y. Store Preopening Costs
Non-capital expenditures, such as payroll costs incurred prior to the opening of a new store, are charged to expense in the period in which they were incurred.
F-13
DESTINATION MATERNITY CORPORATION AND SUBSIDIARIES
NOTES TO CONSOLIDATED FINANCIAL STATEMENTS (Continued)
2. SUMMARY OF SIGNIFICANT ACCOUNTING POLICIES (Continued)
z. Recent Accounting Pronouncements
In June 2011, the Financial Accounting Standards Board (“FASB”) issued Accounting Standards Update (“ASU”) No. 2011-05, Comprehensive Income (Topic 220): Presentation of Comprehensive Income. ASU No. 2011-05 requires companies to present the components of net income and other comprehensive income either as one continuous statement or as two consecutive statements. It eliminates the option to present components of other comprehensive income as part of the statement of stockholders’ equity. The standard does not change the items which must be reported in other comprehensive income. ASU No. 2011-05 is effective for financial statements issued for annual reporting periods beginning after December 15, 2011 and interim periods within those years. Because this guidance impacts presentation only, the adoption of the new requirements of ASU No. 2011-05 will not have any impact on the Company’s consolidated financial position or results of operations.
In May 2011, the FASB issued ASU No. 2011-04, Fair Value Measurement (Topic 820): Amendments to Achieve Common Fair Value Measurement and Disclosure Requirements in U.S. GAAP and IFRSs. The amendments in ASU No. 2011-04 result in common fair value measurement and disclosure requirements in U.S. GAAP and IFRSs and change the wording used to describe many of the requirements in U.S. GAAP for measuring fair value and for disclosing information about fair value measurements. The amendments do not require additional fair value measurements and are not intended to establish valuation standards or affect valuation practices outside of financial reporting. ASU No. 2011-04 is effective during interim and annual periods beginning after December 15, 2011. The adoption of the new requirements of ASU No. 2011-04 will not have a material impact on the Company’s consolidated financial position or results of operations.
In July 2010, the FASB issued ASU No. 2010-20, Receivables (Topic 310): Disclosures about the Credit Quality of Financing Receivables and the Allowance for Credit Losses. ASU No. 2010-20 requires enhanced disclosures about the credit quality of financing receivables and the allowance for credit losses, including uncollectible trade accounts receivable. ASU No. 2010-20 is effective for financial statements issued for interim and annual reporting periods ending on or after December 15, 2010. The adoption of the new disclosure requirements of ASU No. 2010-20 did not have any impact on the Company’s consolidated financial position or results of operations.
3. TRADE RECEIVABLES
Trade receivables are recorded based on revenue recognized for sales of the Company’s merchandise and for other revenue earned by the Company through its marketing partnership programs and international franchise agreements, and are non-interest bearing. The Company evaluates the collectability of trade receivables based on a combination of factors, including aging of trade receivables, write-off experience, analysis of historical trends and expectations of future performance. An allowance for doubtful accounts is recorded for the amount of trade receivables that are considered unlikely to be collected. When the Company’s collection efforts are unsuccessful, uncollectible trade receivables are charged against the allowance for doubtful accounts. As of September 30, 2011 and 2010, the Company’s trade receivables were net of allowance for doubtful accounts of $156,000 and $314,000, respectively.
F-14
DESTINATION MATERNITY CORPORATION AND SUBSIDIARIES
NOTES TO CONSOLIDATED FINANCIAL STATEMENTS (Continued)
4. INVENTORIES
Inventories as of September 30 were comprised of the following (in thousands):
| 2011 | 2010 | |||||||
| Finished goods |
$ | 83,726 | $ | 75,282 | ||||
| Work-in-progress |
2,381 | 1,837 | ||||||
| Raw materials |
4,259 | 3,616 | ||||||
|
|
|
|
|
|||||
| $ | 90,366 | $ | 80,735 | |||||
|
|
|
|
|
|||||
5. PROPERTY, PLANT AND EQUIPMENT, NET
Property, plant and equipment as of September 30 was comprised of the following (in thousands):
| 2011 | 2010 | |||||||
| Land |
$ | 1,400 | $ | 1,400 | ||||
| Building and improvements |
15,465 | 14,964 | ||||||
| Furniture and equipment |
69,919 | 67,522 | ||||||
| Leasehold improvements |
91,927 | 95,757 | ||||||
|
|
|
|
|
|||||
| 178,711 | 179,643 | |||||||
| Less: accumulated depreciation and amortization |
(122,857 | ) | (120,941 | ) | ||||
|
|
|
|
|
|||||
| $ | 55,854 | $ | 58,702 | |||||
|
|
|
|
|
|||||
Aggregate depreciation and amortization expense of property, plant and equipment in fiscal 2011, 2010 and 2009 was $12,634,000, $12,798,000 and $14,873,000, respectively. During fiscal 2011, 2010 and 2009, the Company recorded pretax charges of $759,000, $1,863,000 and $665,000, respectively, related to the impairment of leasehold improvements and furniture and equipment at certain of its retail locations.
During fiscal 2009, the Company completed the sale of manufacturing and warehouse facilities located in Costa Rica that were acquired and shut down in a fiscal 2002 business purchase. Two of these facilities were previously sold for an aggregate of $718,000. The remaining facility, with a carrying value of $207,000, was sold during the first quarter of fiscal 2009 for $526,000 and the Company recognized a $319,000 gain on disposal of assets.
6. GOODWILL IMPAIRMENT
As a result of a substantial decrease in the market price of the Company’s common stock subsequent to September 30, 2008, reflecting deteriorating overall economic conditions and the very difficult equity market conditions, the Company reassessed the carrying value of its goodwill as of December 31, 2008, in accordance with interim period accounting requirements, and concluded that its goodwill was impaired. Consequently, the Company recorded a preliminary non-cash goodwill impairment charge of $47,000,000, on both a pretax and after tax basis, in the first quarter of fiscal 2009. The final results of the Company’s evaluation completed during the second quarter of fiscal 2009 indicated the goodwill totaling $50,389,000 was fully impaired. Accordingly, the Company recorded a $3,389,000 non-cash goodwill impairment charge, on both a pretax and after tax basis, in the second quarter of fiscal 2009, representing the remaining carrying value of the goodwill as of December 31, 2008. The goodwill impairment analysis involved calculating the implied fair value of the Company’s goodwill by allocating the fair value of the Company’s single reporting unit to all assets and
F-15
DESTINATION MATERNITY CORPORATION AND SUBSIDIARIES
NOTES TO CONSOLIDATED FINANCIAL STATEMENTS (Continued)
6. GOODWILL IMPAIRMENT (Continued)
liabilities other than goodwill (including both recognized and unrecognized intangible assets) and comparing the residual amount to the carrying value of goodwill. The non-cash goodwill impairment charges did not have any adverse effect on the covenant calculations under the Company’s debt agreements or the Company’s overall compliance with the covenants of the Company’s debt agreements.
7. RESTRUCTURING AND OTHER CHARGES
The Company implemented a significant restructuring and cost reduction program, which commenced in July 2008, with the objectives of streamlining its merchandise brands and store nameplates, continuing to improve and simplify critical processes and continuing to reduce its expense structure. The Company completed the planned activities of these initiatives in fiscal 2010. The Company incurred $3,884,000 of pretax expense substantially related to these initiatives in fiscal 2010, primarily for consulting services, and incurred pretax expense of $1,557,000 from these initiatives in fiscal 2009, primarily for severance and related benefits, and consulting services.
A summary of the charges incurred and reserves recorded in connection with the restructuring, cost reduction and other initiatives during fiscal 2011, 2010 and 2009 is as follows (in thousands):
| Balance Accrued September 30, 2010 |
Year Ended September 30, 2011 |
Balance Accrued September 30, 2011 |
Cumulative Charges Incurred to September 30, 2011 |
|||||||||||||||||
| Charges Incurred |
Payments/ Adjustments |
|||||||||||||||||||
| Severance and related benefits |
$ | 159 | $ | — | $ | (159 | ) | $ | — | $ | 1,371 | |||||||||
| Accelerated depreciation of store signage |
— | — | — | — | 373 | |||||||||||||||
| Cost reduction and other initiatives |
106 | — | (106 | ) | — | 4,633 | ||||||||||||||
|
|
|
|
|
|
|
|
|
|
|
|||||||||||
| Total |
$ | 265 | $ | — | $ | (265 | ) | $ | — | $ | 6,377 | |||||||||
|
|
|
|
|
|
|
|
|
|
|
|||||||||||
| Balance Accrued September 30, 2009 |
Year Ended September 30, 2010 |
Balance Accrued September 30, 2010 |
||||||||||||||||||
| Charges Incurred |
Payments/ Adjustments |
|||||||||||||||||||
| Severance and related benefits |
$ | 37 | $ | 323 | $ | (201 | ) | $ | 159 | |||||||||||
| Cost reduction and other initiatives |
638 | 3,561 | (4,093 | ) | 106 | |||||||||||||||
|
|
|
|
|
|
|
|
|
|||||||||||||
| Total |
$ | 675 | $ | 3,884 | $ | (4,294 | ) | $ | 265 | |||||||||||
|
|
|
|
|
|
|
|
|
|||||||||||||
| Balance Accrued September 30, 2008 |
Year Ended September 30, 2009 |
Balance Accrued September 30, 2009 |
||||||||||||||||||
| Charges Incurred |
Payments/ Adjustments |
|||||||||||||||||||
| Severance and related benefits |
$ | 224 | $ | 357 | $ | (544 | ) | $ | 37 | |||||||||||
| Accelerated depreciation of store signage |
— | 128 | (128 | )(1) | — | |||||||||||||||
| Cost reduction and other initiatives |
— | 1,072 | (434 | ) | 638 | |||||||||||||||
|
|
|
|
|
|
|
|
|
|||||||||||||
| Total |
$ | 224 | $ | 1,557 | $ | (1,106 | ) | $ | 675 | |||||||||||
|
|
|
|
|
|
|
|
|
|||||||||||||
| (1) | Adjustment to reduce net book value of associated property, plant and equipment. |
F-16
DESTINATION MATERNITY CORPORATION AND SUBSIDIARIES
NOTES TO CONSOLIDATED FINANCIAL STATEMENTS (Continued)
7. RESTRUCTURING AND OTHER CHARGES (Continued)
After his retirement on September 30, 2008, Dan Matthias, the Company’s former Chief Executive Officer (“Former CEO”), agreed to continue to serve the Company as a director and as non-executive Chairman of the Board and agreed to remain available to the Company in an advisory capacity through September 2012. For these services, the Company agreed to pay the Former CEO an annual retainer of $200,000 through September 2012. In November 2009, the Former CEO entered into a letter agreement with the Company, which confirmed that he would not seek reelection to the Board (and, therefore, would no longer serve as the Company’s non-executive Chairman of the Board) after the expiration of his term in January 2010. The letter agreement did not change the terms of payment under the annual retainer for advisory services, however the Company incurred a pretax charge of $585,000, representing the amount due for the remaining term of the arrangement, in fiscal 2010.
In connection with the retirement of Rebecca Matthias, the Company’s President and Chief Creative Officer, at the end of fiscal 2010, the Company incurred a pretax charge of $888,000 in fiscal 2010. The charge reflects benefit costs related to an amendment to the executive’s supplemental retirement agreement with the Company (see Notes 18 and 19).
In April 2011, the Company announced the hiring of Chris Daniel as the Company’s President effective June 1, 2011. In connection with the search and hiring of a new President, the Company incurred pretax charges of $193,000 in fiscal 2011 for relocation costs, and $301,000 in fiscal 2010, primarily related to executive recruiting costs.
8. ACCRUED EXPENSES AND OTHER CURRENT LIABILITIES
As of September 30, accrued expenses and other current liabilities were comprised of the following (in thousands):
| 2011 | 2010 | |||||||
| Employee compensation and benefits |
$ | 6,526 | $ | 9,636 | ||||
| Income taxes payable |
— | 617 | ||||||
| Deferred rent |
3,567 | 3,803 | ||||||
| Sales taxes |
3,065 | 3,256 | ||||||
| Insurance, primarily self insurance reserves |
4,558 | 4,113 | ||||||
| Accounting and legal |
1,495 | 990 | ||||||
| Gift certificates and store credits |
4,423 | 4,880 | ||||||
| Supplemental executive retirement plan benefits |
600 | 4,874 | ||||||
| Other |
9,446 | 9,919 | ||||||
|
|
|
|
|
|||||
| $ | 33,680 | $ | 42,088 | |||||
|
|
|
|
|
|||||
F-17
DESTINATION MATERNITY CORPORATION AND SUBSIDIARIES
NOTES TO CONSOLIDATED FINANCIAL STATEMENTS (Continued)
9. DEFERRED RENT AND OTHER NON-CURRENT LIABILITIES
As of September 30, deferred rent and other non-current liabilities were comprised of the following (in thousands):
| 2011 | 2010 | |||||||
| Deferred rent |
$ | 23,132 | $ | 24,805 | ||||
| Less: current portion included in accrued expenses and other current liabilities |
(3,567 | ) | (3,803 | ) | ||||
|
|
|
|
|
|||||
| Non-current deferred rent |
19,565 | 21,002 | ||||||
| Supplemental executive retirement plan benefits |
132 | 686 | ||||||
| Accrued state income taxes |
2,591 | 3,830 | ||||||
| Interest rate swap |
145 | 925 | ||||||
| Other |
166 | 389 | ||||||
|
|
|
|
|
|||||
| $ | 22,599 | $ | 26,832 | |||||
|
|
|
|
|
|||||
10. LINE OF CREDIT
The Company has a senior secured revolving credit facility (the “Credit Facility”), which was amended on July 25, 2011 to decrease the maximum available for borrowings from $65,000,000 to $55,000,000 and to extend its maturity date from March 13, 2012 to January 13, 2013. The amendment also increased the Company’s effective interest rate on borrowings, if any, by approximately 0.75% per annum. Upon the Company’s request and with the consent of the lender, permitted borrowings under the Credit Facility may be increased up to an additional $20,000,000, in increments of $2,500,000, up to a maximum limit of $75,000,000. Proceeds from advances under the Credit Facility, with certain restrictions, may be used to provide financing for working capital, letters of credit, capital expenditures, debt prepayments, dividends, share repurchases and other general corporate purposes. The Company paid certain closing fees in connection with the negotiation and execution of the Credit Facility, as amended. The Company also pays an unused line fee under the Credit Facility.
The Credit Facility contains various affirmative and negative covenants and representations and warranties. There are no financial covenant requirements under the Credit Facility unless Excess Availability (as defined in the related Credit Facility agreement) falls below 10% of the Borrowing Base (as defined in the related Credit Facility agreement) in which case the Company would be required to meet a certain minimum fixed charge coverage ratio (which increases from 1.00x to 1.10x during the term of the Credit Facility). During all of fiscal 2011, 2010 and 2009, the Company exceeded the applicable excess availability requirements under the Credit Facility and was not subject to any financial covenants. The Credit Facility is secured by a security interest in the Company’s trade receivables, inventory, real estate interests, letter of credit rights, cash, intangibles and certain other assets. The security interest granted to the Credit Facility lender is, in certain respects, subordinate to the security interest granted to the Company’s Term Loan lenders (see Note 11). The interest rate on outstanding borrowings is equal to, at the Company’s election, either (i) the lender’s prime rate plus the applicable margin, or (ii) a LIBOR rate plus the applicable margin. From July 25, 2011, the applicable margin for prime rate borrowings is variable, ranging from 0.75% to 1.25%, based upon the availability calculation made in accordance with the Credit Facility. Prior to July 25, 2011 there was no applicable margin for prime rate borrowings. The applicable margin for LIBOR rate borrowings is variable, ranging from 1.75% to 2.25% (1.00% to 1.50% prior to July 25, 2011), based upon the availability calculation made in accordance with the Credit Facility. The applicable margin for both prime rate and LIBOR rate borrowings, based upon the availability calculation made in accordance with the agreement, has been the lowest available margin since the inception of the Credit Facility.
F-18
DESTINATION MATERNITY CORPORATION AND SUBSIDIARIES
NOTES TO CONSOLIDATED FINANCIAL STATEMENTS (Continued)
10. LINE OF CREDIT (Continued)
Any amounts outstanding under the Credit Facility may be accelerated and become due and payable immediately and all loan and letter of credit commitments thereunder may be terminated upon an event of default and expiration of any applicable cure period. Events of default include: (i) nonpayment of obligations due under the Credit Facility, (ii) failure to perform any covenant or agreement contained in the Credit Facility, (iii) material misrepresentations, (iv) failure to pay, or certain other defaults under, other material indebtedness of the Company, (v) certain bankruptcy or insolvency events, (vi) a change of control, (vii) material uninsured losses, (viii) indictments of the Company or senior management in a material forfeiture action, and (ix) customary ERISA defaults, among others.
As of September 30, 2011, the Company had no outstanding borrowings under the Credit Facility and $7,459,000 in letters of credit, with $47,541,000 of availability under the Credit Facility. As of September 30, 2010, the Company had no outstanding borrowings under the Credit Facility and $11,131,000 in letters of credit, with $42,918,000 of availability under the Credit Facility based on the Company’s Borrowing Base formula. Borrowings under the Credit Facility as of September 30, 2011 would have borne interest at a rate of between approximately 1.98% and 4.00% per annum. During fiscal 2011 the Company did not have any direct borrowings under the Credit Facility. During fiscal 2010, the Company’s average level of direct borrowings under the Credit Facility was $403,000, and the Company’s maximum borrowings at any time were $6,200,000.
11. LONG-TERM DEBT
The following table summarizes the Company’s long-term debt as of September 30 (in thousands):
| 2011 | 2010 | |||||||
| Senior secured Term Loan B, interest is variable (2.49% as of September 30, 2011; effective rate of 4.62% including effect of interest rate swap), principal of $225 due quarterly through December 31, 2012 with the remaining balance due March 13, 2013 |
$ | 29,327 | $ | 42,850 | ||||
| Industrial Revenue Bond, interest is variable (0.53% as of September 30, 2011), principal due annually until September 1, 2020 (collateralized in full by a standby letter of credit) |
2,015 | 2,191 | ||||||
| Government Mortgage Notes: |
||||||||
| Interest at 3.0%, principal due monthly until May 1, 2011 (collateralized by a second mortgage on certain property and equipment at the Company’s headquarters) |
— | 109 | ||||||
| Interest at 2.0%, principal due monthly until March 1, 2011 (collateralized by certain equipment at the Company’s headquarters) |
— | 11 | ||||||
|
|
|
|
|
|||||
| 31,342 | 45,161 | |||||||
| Less: current portion |
(2,915 | ) | (5,834 | ) | ||||
|
|
|
|
|
|||||
| $ | 28,427 | $ | 39,327 | |||||
|
|
|
|
|
|||||
Long-term debt maturities as of September 30, 2011 are as follows (in thousands):
| Fiscal Year |
||||
| 2012 |
$ | 2,915 | ||
| 2013 |
28,427 | |||
|
|
|
|||
| $ | 31,342 | |||
|
|
|
|||
F-19
DESTINATION MATERNITY CORPORATION AND SUBSIDIARIES
NOTES TO CONSOLIDATED FINANCIAL STATEMENTS (Continued)
11. LONG-TERM DEBT (Continued)
The Company has a Term Loan and Security Agreement (the “Term Loan Agreement”) for a senior secured Term Loan B due March 13, 2013 (the “Term Loan”), the $90,000,000 proceeds of which were received on April 18, 2007. The interest rate on the Term Loan is equal to, at the Company’s election, either (i) the prime rate plus 1.00%, or (ii) a LIBOR rate plus an applicable margin. The applicable margin was initially fixed at 2.50% through and including the fiscal quarter ended September 30, 2007. Thereafter, the applicable margin for LIBOR rate borrowings is either 2.25% or 2.50%, depending on the Company’s Consolidated Leverage Ratio (as defined in the Term Loan Agreement). Based upon the Company’s applicable quarterly Consolidated Leverage Ratios, the applicable margin for LIBOR rate borrowings was 2.50% prior to December 30, 2009 and has been reduced to 2.25% effective from December 30, 2009. The Company is required to make minimum repayments of the principal amount of the Term Loan in quarterly installments of $225,000 each. The Company is also required to make an annual principal repayment equal to 25% or 50% of Excess Cash Flow (as defined in the Term Loan Agreement) in excess of $5,000,000 for each fiscal year, with the 25% or 50% factor depending on the Company’s Consolidated Leverage Ratio. The required principal repayment related to fiscal 2010 results, which was calculated based on the 25% factor, was $2,623,000, and was paid in December 2010. There is no required principal repayment related to fiscal 2011 results. The Term Loan can be prepaid at the Company’s option, in part or in whole, at any time without any prepayment premium or penalty. During fiscal 2011, 2010 and 2009, the Company prepaid $12,623,000 (including the $2,623,000 prepayment required under the annual excess cash flow provision of the Term Loan), $11,000,000 (including a $5,765,000 prepayment required under the annual excess cash flow provision of the Term Loan), and $20,000,000 (including a $622,000 prepayment required under the annual excess cash flow provision of the Term Loan), respectively, of the outstanding Term Loan. At September 30, 2011, the Company’s indebtedness under the Term Loan Agreement was $29,327,000.
The Term Loan is secured by a security interest in the Company’s trade receivables, inventory, real estate interests, letter of credit rights, cash, intangibles and certain other assets. The security interest granted to the Term Loan lenders is, in certain respects, subordinate to the security interest granted to the Credit Facility lender. The Term Loan Agreement imposes certain restrictions on the Company’s ability to, among other things, incur additional indebtedness, pay dividends, repurchase stock, and enter into other various types of transactions. The Term Loan Agreement also contains quarterly financial covenants that require the Company to maintain a specified maximum permitted Consolidated Leverage Ratio and a specified minimum permitted Consolidated Interest Coverage Ratio (as defined in the Term Loan Agreement). Since the inception of the Term Loan, the Company has been in compliance with all covenants of its Term Loan Agreement. Any amounts outstanding under the Term Loan may be accelerated and become due and payable immediately upon an event of default and expiration of any applicable cure period. Events of default include: (i) nonpayment of obligations due under the Term Loan, (ii) failure to perform any covenant or agreement contained in the Term Loan, (iii) material misrepresentations, (iv) failure to pay, or certain other defaults under, other material indebtedness of the Company, (v) certain bankruptcy or insolvency events, (vi) a change of control, (vii) material uninsured losses, (viii) indictments of the Company or senior management in a material forfeiture action, and (ix) customary ERISA defaults, among others.
In order to mitigate the Company’s floating rate interest risk on the variable rate Term Loan, the Company entered into an interest rate swap agreement with the agent bank for the Term Loan that commenced on April 18, 2007, the date the $90,000,000 Term Loan proceeds were received, and expires on April 18, 2012. The interest rate swap agreement enables the Company to effectively convert an amount of the Term Loan (equal to the notional amount of the interest rate swap) from a floating interest rate (LIBOR plus 2.50% prior to December 30, 2009, reduced to LIBOR plus 2.25% effective from December 30, 2009, based on the Company’s specified leverage ratios), to a fixed interest rate (7.50% prior to December 30, 2009, reduced to 7.25% effective from December 30, 2009, based on the Company’s specified leverage ratios) for the majority of the Term Loan. The
F-20
DESTINATION MATERNITY CORPORATION AND SUBSIDIARIES
NOTES TO CONSOLIDATED FINANCIAL STATEMENTS (Continued)
11. LONG-TERM DEBT (Continued)
notional amount of the interest rate swap was $75,000,000 at the inception of the swap agreement and decreases over time to a notional amount of $5,000,000 at the expiration date. The notional amount of the swap was $12,500,000 as of September 30, 2011 and decreased to $5,000,000 starting October 18, 2011. The notional amount of the swap will remain at $5,000,000 until the expiration of the interest rate swap agreement on April 18, 2012. As of September 30, 2011 and 2010, the estimated fair value of the interest rate swap was an unrealized loss of $(145,000) and $(925,000), respectively, which were included in “deferred rent and other non-current liabilities” in the accompanying Consolidated Balance Sheets. During the years ended September 30, 2011, 2010 and 2009, pretax losses of $(808,000), $(1,514,000) and $(1,413,000), respectively, associated with the exchange of interest rate payments under the swap agreement were included as “interest expense” in the accompanying Consolidated Statements of Operations. The Company expects to reclassify the $(145,000) of pretax unrealized loss from accumulated other comprehensive loss into interest expense in fiscal 2012.
In connection with the issuance of the Term Loan and amendments of the Credit Facility (see Note 10), the Company incurred deferred financing costs of $1,112,000. These deferred financing costs are being amortized over the term of the related debt agreement and are included in “interest expense” in the accompanying Consolidated Statements of Operations.
The Company has $2,015,000 and $2,191,000 outstanding under an Industrial Revenue Bond (“IRB”) at September 30, 2011 and 2010, respectively. The IRB has a variable interest rate that may be converted to a fixed interest rate at the option of the Company. At any time prior to conversion to a fixed interest rate structure, bondholders may put all or part of the IRB back to the Company upon notice to the bond trustee, after which the remarketing agent would attempt to resell the put portion of the IRB. If the remarketing agent is unsuccessful in reselling the put portion of the IRB, the bond trustee may then draw on a letter of credit issued under the Credit Facility to repay the bondholders. Pursuant to this arrangement, the IRB is classified as a current liability in the accompanying Consolidated Balance Sheets at September 30, 2011 and 2010. During fiscal 2011 a bondholder put $100,000 of the IRB, which was successfully resold by the remarketing agent. The letter of credit issued to secure the bonds has never been drawn upon.
12. FAIR VALUE MEASUREMENTS
The accounting standard for fair value measurements defines fair value as the price that would be received to sell an asset or paid to transfer a liability in an orderly transaction between market participants at the measurement date. The standard establishes a framework for measuring fair value focused on exit price and creates a fair value hierarchy in order to increase the consistency and comparability of fair value measurements as follows:
| • | Level 1—Quoted market prices in active markets for identical assets or liabilities |
| • | Level 2—Observable market-based inputs or inputs that are corroborated by observable market data |
| • | Level 3—Unobservable inputs that are not corroborated by market data |
At September 30, 2011, the Company had cash equivalents of $11,976,000. At September 30, 2010, the Company had cash equivalents of $21,548,000 and $1,504,000 of investments in a grantor trust. The Company’s cash equivalents and grantor trust investments consist of investments in fixed income mutual funds for which the carrying value approximates fair value (based on Level 1 inputs) due to the short-term nature of those instruments.
The carrying values of trade receivables and accounts payable approximate fair value due to the short-term nature of those instruments. The majority of the Company’s long-term debt bears interest at variable rates, which adjust based on market conditions and the carrying value of the long-term debt approximates fair value. The fair
F-21
DESTINATION MATERNITY CORPORATION AND SUBSIDIARIES
NOTES TO CONSOLIDATED FINANCIAL STATEMENTS (Continued)
12. FAIR VALUE MEASUREMENTS (Continued)
value of the Company’s debt was determined using a discounted cash flow analysis based on interest rates currently available to the Company or for similar instruments available to companies with comparable credit quality, which the Company considers to be Level 2 inputs. The difference between the carrying value and fair value of long-term debt held by the Company with fixed rates of interest is not significant.
A portion of the Company’s floating rate interest risk on variable rate long-term debt is mitigated through an interest rate swap agreement. The Company’s interest rate swap is required to be measured at fair value on a recurring basis. At September 30, 2011 and 2010, the interest rate swap was a liability with a fair value of $145,000, and $925,000, respectively, included in “deferred rent and other non-current liabilities” in the accompanying Consolidated Balance Sheets. The fair value of the interest rate swap was derived from a discounted cash flow analysis utilizing an interest rate yield curve that is readily available to the public or can be derived from information available in publicly quoted markets, which the Company considers to be Level 2 inputs.
The fair value accounting standards provide a company with the option to report selected financial assets and liabilities on an instrument-by-instrument basis at fair value and requires such company to display the fair value of those assets and liabilities for which the company has chosen to use fair value on the face of the balance sheet. The Company has not elected the fair value option for its financial assets and liabilities that had not been previously measured at fair value.
13. COMMON AND PREFERRED STOCK
In July 2008, the Company’s Board approved a program to repurchase up to $7,000,000 of the Company’s outstanding common stock. Under the program, the Company may repurchase shares from time to time through solicited or unsolicited transactions in the open market or in negotiated or other transactions. The program will expire on July 31, 2012. There have been no repurchases of common stock under the program to date.
The Company has authorization to issue up to 1,656,381 shares of preferred stock, par value $0.01 with 300,000 shares authorized for Series B Junior Participating Preferred Stock (“Series B Preferred Stock”). There was no preferred stock issued or outstanding as of September 30, 2011 or 2010.
The Series B Preferred Stock can be purchased in units equal to one one-thousandth of a share (the “Series B Units”) under the terms of the Rights Agreement (see Note 14). The holders of the Series B Units are entitled to receive dividends when and if declared on common stock. Series B Units are junior to the common stock for both dividends and liquidations. Each Series B Unit votes as one share of common stock.
14. RIGHTS AGREEMENT
In October 2005, the Company entered into an Amended and Restated Rights Agreement to renew its then existing Rights Agreement (collectively referred to as the “Rights Agreement”) that would otherwise have expired in October 2005. Under the Rights Agreement, the Company provided and will provide one Right (the “Right”) for each share of Destination Maternity Corporation common stock now or hereafter outstanding. Under certain limited conditions, as defined in the Rights Agreement, each Right entitles the registered holder to purchase from the Company one Series B Unit at $85 per share, subject to adjustment. The Rights expire on October 9, 2015 (the “Final Expiration Date”).
The Rights Agreement provides the independent directors of the Company with some discretion in determining when the Distribution Date (as defined in the Rights Agreement) shall occur and the date until which
F-22
DESTINATION MATERNITY CORPORATION AND SUBSIDIARIES
NOTES TO CONSOLIDATED FINANCIAL STATEMENTS (Continued)
14. RIGHTS AGREEMENT (Continued)
the Rights may be redeemed. In addition, the Rights Agreement exempts from its operation any person that acquires, obtains the right to acquire, or otherwise obtains beneficial ownership of 15.0% or more of the then outstanding shares of the Company’s common stock (an “Acquiring Person”) without any intention of changing or influencing control of the Company provided that such person, as promptly as practicable, divests himself or itself of a sufficient number of shares of common stock so that such person would no longer be an Acquiring Person.
The Rights are not exercisable until the Distribution Date, which will occur upon (i) the earlier of ten business days following a public announcement that an Acquiring Person has acquired beneficial ownership of 15.0% or more of the Company’s outstanding common stock, and ten business days following the commencement of a tender offer or exchange offer that would result in a person or group owning 15.0% or more of the Company’s outstanding common stock, or (ii) such later date as may be determined by action of a majority of the independent directors. The Rights have certain anti-takeover effects. The Rights will cause substantial dilution to a person or group that attempts to acquire the Company without conditioning the offer on the redemption of the Rights.
The Rights can be mandatorily redeemed by action of a majority of the independent directors at any time prior to the earlier of the Final Expiration Date and the Distribution Date for $0.01 per Right. Upon exercise and the occurrence of certain events, as defined in the Rights Agreement, each holder of a Right, except the Acquiring Person, will have the right to receive Series B Units, or common stock of the acquiring company, in each case having a value equal to two times the exercise price of the Right.
15. EQUITY AWARD PLANS
The Company has three equity award plans: the 1994 Director Stock Option Plan (the “Director Plan”), the Amended and Restated 1987 Stock Option Plan (the “1987 Plan”) and the Amended and Restated 2005 Equity Incentive Plan (the “2005 Plan”). The Director Plan expired on December 31, 2004 and no further awards may be granted under the Director Plan. The 1987 Plan expired on December 9, 2007, and no further awards may be issued under the 1987 Plan. Options issued under the Director Plan and the 1987 Plan will remain outstanding until they have expired, been exercised or have otherwise terminated. Up to a total of 4,350,000 options were able to be issued under the 1987 Plan and the Director Plan (including up to a total of 400,000 options which were issuable under the Director Plan), but 521,354 of these options became unavailable for grant upon the expiration of the 1987 Plan on December 9, 2007 and the expiration of the Director Plan on December 31, 2004. In January 2006, the stockholders of the Company approved the adoption of the 2005 Plan and, in January 2009 and February 2011, approved amendments to increase the number of issuable shares. Under the 2005 Plan, employees, directors, consultants and other individuals who provide services to the Company, may be granted awards in the form of options, stock appreciation rights, restricted stock or restricted stock units. Up to 2,000,000 shares of the Company’s common stock may be issued in respect of awards under the 2005 Plan, as amended, with no more than 1,000,000 of those shares permitted to be issued in respect of restricted stock or restricted stock units granted under the 2005 Plan. Awards of options to purchase the Company’s common stock will have exercise prices as determined by the Compensation Committee of the Board (the “Compensation Committee”), but such exercise prices may not be lower than the fair market value of the stock on the date of grant.
No options have been granted by the Company with an exercise price less than the fair market value of the Company’s common stock on the date of grant for any of the periods presented. The majority of the options issued under the plans vest ratably over a five-year period, although some options have both market price and time vesting requirements, and options issued under the plans generally expire ten years from the date of grant. Restricted stock awards issued under the 2005 Plan have restrictions that lapse ratably over periods ranging from
F-23
DESTINATION MATERNITY CORPORATION AND SUBSIDIARIES
NOTES TO CONSOLIDATED FINANCIAL STATEMENTS (Continued)
15. EQUITY AWARD PLANS (Continued)
one to five years. Each non-employee director of the Company’s Board is granted 4,000 shares of restricted stock on an annual basis that will vest one year from the date of grant. The Company issues new shares of common stock upon exercise of vested options. As of September 30, 2011, there were 877,906 shares of the Company’s common stock available for grant under the 2005 Plan, with no more than 437,122 of those shares permitted to be issued in respect of restricted stock or restricted stock units granted under the 2005 Plan.
Stock option activity for all plans was as follows:
| Outstanding Options |
Weighted Average Exercise Price |
Weighted Average Remaining Life |
Aggregate Intrinsic Value |
|||||||||||||
| (in thousands) | (years) | (in thousands) | ||||||||||||||
| Balance—September 30, 2010 |
1,160 | $ | 7.79 | |||||||||||||
| Granted |
148 | 21.72 | ||||||||||||||
| Exercised |
(656 | ) | 7.18 | |||||||||||||
| Forfeited |
(2 | ) | 8.30 | |||||||||||||
| Expired |
(2 | ) | 5.93 | |||||||||||||
|
|
|
|||||||||||||||
| Balance—September 30, 2011 |
648 | $ | 11.60 | 7.3 | $ | 2,209 | ||||||||||
|
|
|
|
|
|||||||||||||
| Exercisable—September 30, 2011 |
192 | $ | 8.28 | 5.2 | $ | 958 | ||||||||||
|
|
|
|
|
|||||||||||||
As of September 30, 2011, $4,830,000 of total unrecognized compensation cost related to non-vested awards is expected to be recognized over a weighted-average period of 1.98 years. During the years ended September 30, 2011, 2010 and 2009, the total intrinsic value of options exercised was $9,659,000, $4,452,000 and $41,000, respectively. The total cash received from these option exercises was $2,285,000, $1,369,000 and $55,000, respectively, and the actual tax benefit realized for the tax deductions from these option exercises was $3,617,000, $1,671,000, and $15,000, respectively. During fiscal 2011, options to purchase 368,800 shares of common stock with an aggregate exercise price of $2,428,000 were exercised by the option holders and net-share settled by the Company, such that the Company withheld 109,926 shares of the Company’s common stock, which had a fair market value equal to the aggregate exercise price of the options. During fiscal 2010, options to purchase 443,900 shares of common stock with an aggregate exercise price of $2,552,000 were exercised by the option holders and net-share settled by the Company, such that the Company withheld 220,359 shares of the Company’s common stock, which had a fair market value equal to the aggregate exercise price of the options.
In September 2008, the Company granted two stock options to an executive officer, each to purchase 200,000 shares of common stock (on a post-split basis) at an exercise price of $13.74 per share pre-split (or $6.87 per share post-split), under the 2005 Plan (see Note 18). The first stock option vests ratably over a five-year period. The second stock option vests ratably over a five-year period and was subject to the further condition that, on or before the fifth anniversary of the grant date, the closing price for a share of the Company’s common stock shall have exceeded $30.00 pre-split (or $15.00 post-split) for a period of 30 consecutive trading days. In January 2010, the Company granted stock options to three executive officers, to purchase a combined total of 120,000 shares of common stock (on a post-split basis) at an exercise price of $23.78 per share pre-split (or $11.89 per share post-split), under the 2005 Plan. The stock options vest ratably over a five-year period and were subject to the further condition that, on or before the fifth anniversary of the grant date, the closing price for a share of the Company’s common stock shall have exceeded $30.00 pre-split (or $15.00 post-split) for a period of 30 consecutive trading days. On November 4, 2010, the condition that the Company’s common stock shall have exceeded $30.00 pre-split (or $15.00 post-split) for a period of 30 consecutive trading days was satisfied.
F-24
DESTINATION MATERNITY CORPORATION AND SUBSIDIARIES
NOTES TO CONSOLIDATED FINANCIAL STATEMENTS (Continued)
15. EQUITY AWARD PLANS (Continued)
The weighted average fair value of stock options granted during fiscal 2011, 2010 and 2009 was estimated to be $9.69, $7.61 and $1.83 per option share, respectively. The weighted average fair value of each option granted is calculated on the date of grant using the Black-Scholes option pricing model for most option grants and a Monte Carlo simulation option pricing model for the fiscal 2010 grants that included a market price condition. Weighted-average assumptions for option grants were as follows:
| Year Ended September 30, | ||||||||||||
| 2011 | 2010 | 2009 | ||||||||||
| Expected dividend yield |
3.2 | % | none | none | ||||||||
| Expected price volatility |
63 | % | 63 | % | 57 | % | ||||||
| Risk-free interest rates |
2.4 | % | 2.7 | % | 2.2 | % | ||||||
| Expected lives |
5.8 years | 6.5 years | 5.4 years | |||||||||
Expected dividend yield was determined using a weighted average of the Company’s annualized dividend rate compared to the market price of the Company’s common stock as of the grant date. Expected volatility was determined using a weighted average of the historic volatility of the Company’s common stock as of the option grant date measured over a period equal to the expected life of the grant. Risk-free interest rates were based on the United States Treasury yield curve in effect at the date of the grant. Expected lives were determined using a weighted average of the historic lives of previously issued grants of the Company’s options.
The following table summarizes information about stock options outstanding as of September 30, 2011:
| Options Outstanding | Options Exercisable | |||||||||||||||||||
| Range of Exercise Prices |
Number Outstanding |
Weighted Average Remaining Life |
Weighted Average Exercise Price |
Number Exercisable |
Weighted Average Exercise Price |
|||||||||||||||
| (in thousands) | (years) | (in thousands) | ||||||||||||||||||
| $ 3.52 to $ 5.00 |
21 | 6.8 | $ | 3.53 | 4 | $ | 3.60 | |||||||||||||
| 5.01 to 6.00 |
18 | 4.2 | 5.01 | 18 | 5.01 | |||||||||||||||
| 6.01 to 6.50 |
33 | 3.7 | 6.46 | 33 | 6.46 | |||||||||||||||
| 6.51 to 7.00 |
250 | 6.9 | 6.87 | 90 | 6.87 | |||||||||||||||
| 7.01 to 12.00 |
148 | 8.2 | 11.81 | 17 | 11.22 | |||||||||||||||
| 12.01 to 22.00 |
70 | 6.6 | 18.32 | 30 | 15.27 | |||||||||||||||
| 22.01 to 22.13 |
108 | 9.4 | 22.13 | — | — | |||||||||||||||
|
|
|
|
|
|||||||||||||||||
| $ 3.52 to $22.13 |
648 | 7.3 | $ | 11.60 | 192 | $ | 8.28 | |||||||||||||
|
|
|
|
|
|||||||||||||||||
Restricted stock activity for the 2005 Plan was as follows:
| Outstanding Shares |
Weighted Average Grant Date Fair Value |
|||||||
| (in thousands) | ||||||||
| Nonvested—September 30, 2010 |
193 | $ | 10.95 | |||||
| Granted |
127 | 22.36 | ||||||
| Vested |
(100 | ) | 13.13 | |||||
| Forfeited |
(10 | ) | 10.85 | |||||
|
|
|
|||||||
| Nonvested—September 30, 2011 |
210 | $ | 16.81 | |||||
|
|
|
|||||||
F-25
DESTINATION MATERNITY CORPORATION AND SUBSIDIARIES
NOTES TO CONSOLIDATED FINANCIAL STATEMENTS (Continued)
15. EQUITY AWARD PLANS (Continued)
During fiscal 2011, 2010 and 2009, certain stock option exercises and vesting restricted stock awards were net-share settled by the Company such that the Company withheld shares of the Company’s common stock, which had a fair market value equivalent to the minimum statutory obligation for the applicable income and employment taxes for the awards, and the Company remitted the cash value to the appropriate taxing authorities. The total shares withheld, which were 128,646, 87,326 and 3,580 during fiscal 2011, 2010 and 2009, respectively, are reflected as repurchase of common stock in the accompanying financial statements, and were based on the value of the Company’s common stock on the exercise or vesting date. The remaining shares, net of those withheld, were delivered to the award holders. Total payments for tax obligations to the tax authorities were $2,786,000, $960,000 and $14,000 for fiscal 2011, 2010 and 2009, respectively.
16. INCOME TAXES
For the years ended September 30, the income tax provision was comprised of the following (in thousands):
| 2011 | 2010 | 2009 | ||||||||||
| Current provision |
$ | 10,307 | $ | 13,315 | $ | 5,262 | ||||||
| Deferred provision (benefit) |
2,679 | (2,062 | ) | 1,318 | ||||||||
|
|
|
|
|
|
|
|||||||
| $ | 12,986 | $ | 11,253 | $ | 6,580 | |||||||
|
|
|
|
|
|
|
|||||||
| Federal provision |
$ | 12,047 | $ | 8,769 | $ | 5,416 | ||||||
| State provision |
924 | 2,484 | 1,164 | |||||||||
| Foreign provision |
15 | — | — | |||||||||
|
|
|
|
|
|
|
|||||||
| $ | 12,986 | $ | 11,253 | $ | 6,580 | |||||||
|
|
|
|
|
|
|
|||||||
The reconciliations of the statutory federal tax rate to the Company’s effective income tax rates for the years ended September 30 were as follows:
| 2011 | 2010 | 2009 | ||||||||||
| Statutory federal tax rate |
35.0 | % | 35.0 | % | (35.0 | )% | ||||||
| State tax rate, net of federal benefit |
3.3 | % | 2.4 | 1.7 | ||||||||
| Impact of goodwill impairment |
— | — | 51.7 | |||||||||
| (Benefit from) provision for uncertain income tax positions, net of federal effect |
(1.5 | ) | 3.1 | 0.7 | ||||||||
| Other |
(0.7 | ) | (0.4 | ) | 0.2 | |||||||
|
|
|
|
|
|
|
|||||||
| 36.1 | % | 40.1 | % | 19.3 | % | |||||||
|
|
|
|
|
|
|
|||||||
F-26
DESTINATION MATERNITY CORPORATION AND SUBSIDIARIES
NOTES TO CONSOLIDATED FINANCIAL STATEMENTS (Continued)
16. INCOME TAXES (Continued)
The deferred tax effects of temporary differences giving rise to the Company’s net deferred tax assets as of September 30 were as follows (in thousands):
| 2011 | 2010 | |||||||
| Deferred tax assets: |
||||||||
| Depreciation and amortization |
$ | 1,156 | $ | 2,529 | ||||
| Deferred rent |
8,656 | 9,309 | ||||||
| Inventory reserves |
685 | 594 | ||||||
| Employee benefit accruals |
2,509 | 2,456 | ||||||
| Pension benefits |
336 | 2,157 | ||||||
| Stock-based compensation |
652 | 1,420 | ||||||
| Other accruals |
2,897 | 2,738 | ||||||
| Other |
1,378 | 1,626 | ||||||
|
|
|
|
|
|||||
| 18,269 | 22,829 | |||||||
| Deferred tax liability: |
||||||||
| Prepaid expenses |
(564 | ) | (506 | ) | ||||
|
|
|
|
|
|||||
| $ | 17,705 | $ | 22,323 | |||||
|
|
|
|
|
|||||
No valuation allowance has been provided for the net deferred tax assets. Based on the Company’s historical and projected levels of taxable income, management believes it is more likely than not that the Company will realize the net deferred tax assets as of September 30, 2011. There can be no assurance that the Company will generate taxable earnings or any specific level of earnings in the future.
The Company does not record state tax benefits associated with temporary differences for certain states in which it is operating, given the continued historical uncertainty related to realizing such state tax benefits. Had the state tax benefits been reflected for these states, the deferred tax assets (excluding state net operating loss carryforwards) as of September 30, 2011 would be approximately $702,000 higher.
The accounting standard for uncertain income tax positions clarifies the accounting for income taxes by prescribing the minimum recognition threshold a tax position is required to meet before being recognized in the financial statements and also contains guidance on the measurement of uncertain tax positions.
A reconciliation of gross unrecognized tax benefits for uncertain tax positions follows (in thousands):
| 2011 | 2010 | 2009 | ||||||||||
| Balance at beginning of year |
$ | 3,830 | $ | 2,600 | $ | 2,279 | ||||||
| Additions for current year tax positions |
203 | 1,147 | 257 | |||||||||
| Additions for prior year tax positions |
154 | 485 | 143 | |||||||||
| Reductions of prior year tax positions |
(1,104 | ) | (402 | ) | (79 | ) | ||||||
| Settlements |
(492 | ) | — | — | ||||||||
|
|
|
|
|
|
|
|||||||
| Balance at end of year |
$ | 2,591 | $ | 3,830 | $ | 2,600 | ||||||
|
|
|
|
|
|
|
|||||||
As of September 30, 2011, gross unrecognized tax benefits included accrued interest and penalties of $1,244,000. During fiscal 2011, 2010 and 2009, interest and penalties of $(386,000), $605,000, and $188,000, respectively, related to unrecognized tax benefits, were included in income tax provision. If recognized, the portion of the liability for unrecognized tax benefits that would impact the Company’s effective tax rate was $1,827,000, net of federal tax benefit.
F-27
DESTINATION MATERNITY CORPORATION AND SUBSIDIARIES
NOTES TO CONSOLIDATED FINANCIAL STATEMENTS (Continued)
16. INCOME TAXES (Continued)
During the twelve months subsequent to September 30, 2011, it is reasonably possible that the gross unrecognized tax benefits could potentially increase by approximately $605,000 (of which approximately $419,000 would affect the effective tax rate, net of federal benefit) for uncertain tax positions, including the continued effect of interest on unrecognized tax benefits and limitations on certain potential tax credits, partially offset by the effect of expiring statutes of limitations and settlements.
The Company’s United States Federal income tax returns for the years ended September 30, 2008 and thereafter remain subject to examination by the United States Internal Revenue Service. The Company also files returns in Canada, India and numerous state jurisdictions, which have varying statutes of limitations. Generally, Canadian tax returns for tax years ended September 30, 2007 and thereafter, Indian tax returns for tax years ended March 31, 2009 and thereafter, and state tax returns for tax years ended September 30, 2007 and thereafter, depending upon the jurisdiction, remain subject to examination. However, the statutes of limitations on certain of the Company’s state returns remain open for tax years prior to fiscal 2007.
17. COMMITMENTS AND CONTINGENCIES
The Company leases its retail facilities and certain equipment under various non-cancelable operating leases. Certain of these leases have renewal options. Total rent expense (including related occupancy costs, such as insurance, maintenance and taxes, paid to landlords) under operating leases amounted to $67,496,000, $69,839,000 and $72,687,000 in fiscal 2011, 2010 and 2009, respectively. Such amounts include contingent rentals based upon a percentage of sales totaling $1,563,000, $1,465,000 and $1,146,000 in fiscal 2011, 2010 and 2009, respectively.
Store operating and warehouse leases generally provide for payment of direct operating costs in addition to rent. Future annual minimum operating lease payments, excluding such direct operating costs, as well as leases for equipment rental as of September 30, 2011 are as follows (in thousands):
| Fiscal Year |
||||
| 2012 |
$ | 46,892 | ||
| 2013 |
39,514 | |||
| 2014 |
29,132 | |||
| 2015 |
20,554 | |||
| 2016 |
15,422 | |||
| 2017 and thereafter |
29,516 | |||
|
|
|
|||
| $ | 181,030 | |||
|
|
|
|||
From time to time, the Company is named as a defendant in legal actions arising from normal business activities. Litigation is inherently unpredictable and although the amount of any liability that could arise with respect to currently pending actions cannot be accurately predicted, the Company does not believe that the resolution of any pending action will have a material adverse effect on its financial position, results of operations or liquidity.
18. EXECUTIVE OFFICER EMPLOYMENT AGREEMENTS
On September 26, 2008, the Board appointed Edward M. Krell, the Company’s Chief Operating Officer & Chief Financial Officer at that time, to serve as Chief Executive Officer (“CEO”) of the Company, effective as of October 1, 2008, replacing Dan Matthias. Mr. Krell also served as the Company’s President from August 3, 2010
F-28
DESTINATION MATERNITY CORPORATION AND SUBSIDIARIES
NOTES TO CONSOLIDATED FINANCIAL STATEMENTS (Continued)
18. EXECUTIVE OFFICER EMPLOYMENT AGREEMENTS (Continued)
to May 31, 2011. In connection with Mr. Krell’s promotion to CEO, the Company entered into an amendment to his May 15, 2007 employment agreement. The amendment provided for an increase in Mr. Krell’s annual base salary from $531,000 to $650,000. Mr. Krell’s agreement was further amended on August 10, 2011 to increase Mr. Krell’s annual base salary to $750,000, effective December 1, 2010. Base compensation for Mr. Krell was $733,000 for fiscal 2011 and $650,000 for both fiscal 2010 and 2009. The agreement also provides for salary continuation and severance payments should the employment of Mr. Krell be terminated under specified conditions, as defined therein. Additionally, Mr. Krell is eligible for an annual cash bonus based on performance. The agreement continues in effect until terminated by either the Company or Mr. Krell in accordance with the termination provisions of the agreement. In connection with Mr. Krell’s appointment as CEO, the Company granted to Mr. Krell two stock options, each to purchase 200,000 shares of common stock, under the Company’s 2005 Equity Incentive Plan (see Note 15).
Prior to September 30, 2008 the Company had an employment agreement with Dan W. Matthias, the Company’s former Chairman of the Board and Former CEO. Effective September 30, 2008, Mr. Matthias retired as CEO. In connection with Mr. Matthias’ retirement as CEO, the Company entered into a Transition Agreement (the “D. Matthias Transition Agreement”) with Mr. Matthias. The D. Matthias Transition Agreement, which has a term of four years expiring September 30, 2012, provides that Mr. Matthias will make himself available to the Company for strategic planning, corporate development and other matters as requested by the Board or the Company’s CEO. Subsequent to his retirement, Mr. Matthias continued to serve the Company as non-executive Chairman of the Board and is available to the Company as stipulated in the D. Matthias Transition Agreement. In consideration of Mr. Matthias’ advisory and board services (and in lieu of all other director compensation), the Company pays Mr. Matthias an annual retainer of $200,000 and continues certain insurance and fringe benefits during the term of the D. Matthias Transition Agreement. In November 2009, Mr. Matthias entered into a letter agreement with the Company, which confirmed that he would not seek reelection to the Board after the expiration of his term in January 2010. The letter agreement did not change the terms of payment under the annual retainer for advisory services, however the Company incurred a pretax charge of $585,000 in fiscal 2010, representing the amount due for the remaining term of the advisory arrangement. Payment of the retainer and continuation of the benefits is subject to certain specified conditions, as defined in the D. Matthias Transition Agreement. The D. Matthias Transition Agreement also provides for the restrictive covenants set forth in Mr. Matthias’ employment agreement to continue in effect until two years after Mr. Matthias ceases to serve the Company in any capacity (including service as a Board member or advisor).
During fiscal 2010 and 2009, the Company had an employment agreement with Rebecca C. Matthias, the Company’s former President and Chief Creative Officer. Base compensation on an annualized basis for Ms. Matthias was $572,000 for both fiscal 2010 and 2009. On November 6, 2009, the Company announced the retirement of Ms. Matthias at the end of fiscal 2010. In connection with Ms. Matthias’ retirement, the Company entered into a Transition Agreement (the “R. Matthias Transition Agreement”) with Ms. Matthias on November 6, 2009 (the “Effective Date”). The R. Matthias Transition Agreement, which expires on September 30, 2012, provided that Ms. Matthias would be a full-time employee of the Company until June 15, 2010 (the “Transition Date”). Following the Transition Date, Ms. Matthias agreed to serve the Company as a part-time employee until September 30, 2010 (the “Termination Date”), at which point Ms. Matthias’ employment with the Company was terminated. Following the Termination Date and through September 30, 2012, Ms. Matthias agrees to make herself available to the Company on a limited basis for strategic planning, merchandising, public relations, publicity and other matters as requested by the Company’s CEO. The R. Matthias Transition Agreement also provides for the restrictive covenants set forth in Ms. Matthias’ employment agreement to continue in effect until two years after Ms. Matthias ceases to serve the Company in any capacity
F-29
DESTINATION MATERNITY CORPORATION AND SUBSIDIARIES
NOTES TO CONSOLIDATED FINANCIAL STATEMENTS (Continued)
18. EXECUTIVE OFFICER EMPLOYMENT AGREEMENTS (Continued)
(including service as a Board member or advisor). In consideration of the services described above, the Company paid Ms. Matthias: (i) a base salary at an annualized rate of $572,000 from the Effective Date through the Transition Date; (ii) a base salary at an annualized rate of $114,000 from the Transition Date to the Termination Date, and (iii) certain fringe benefits, which continued through the Termination Date. The R. Matthias Transition Agreement also provided that Ms. Matthias was eligible for a pro-rata cash bonus based on performance, as specified by the Compensation Committee, for fiscal 2010.
Effective June 1, 2011, the Company entered into an employment agreement with Christopher F. Daniel, in connection with the hiring of Mr. Daniel as the Company’s President. The agreement provided that Mr. Daniel’s annual base salary would be $525,000. Base compensation for Mr. Daniel was $175,000 for fiscal 2011. The agreement also provides for salary continuation and severance payments should employment of the executive be terminated under specified conditions, as defined therein. Additionally, Mr. Daniel is eligible for an annual cash bonus based on performance. The agreement continues in effect until terminated by either the Company or the executive in accordance with the termination provisions of the agreement.
Effective January 24, 2008, the Company entered into a letter agreement and an employment agreement with Lisa H. Hendrickson in connection with Ms. Hendrickson’s promotion to Chief Merchandising Officer. The letter agreement provided that Ms. Hendrickson’s annual base salary would initially be $425,000. The Company also entered into an additional agreement with Ms. Hendrickson effective October 13, 2010, which provides for salary continuation and severance payments should employment of the executive be terminated under specified conditions, as defined therein. Additionally, Ms. Hendrickson is eligible for an annual cash bonus based on performance. All of the agreements continue in effect until terminated by either the Company or Ms. Hendrickson. In connection with the hiring of Mr. Daniel as President, effective June 1, 2011 Ms. Hendrickson reports directly to Mr. Daniel and ceased to be an executive officer of the Company. Base compensation for Ms. Hendrickson was $434,000 for each of fiscal year 2011, 2010 and 2009.
Effective July 23, 2008, the Company entered into an employment agreement with Judd P. Tirnauer, in connection with Mr. Tirnauer’s promotion to Senior Vice President & Chief Financial Officer. The agreement provided that Mr. Tirnauer’s annual base salary for the remainder of fiscal 2008 would be $325,000. Mr. Tirnauer’s agreement was amended on August 10, 2011 to increase Mr. Tirnauer’s annual base salary to $375,000, effective December 1, 2010. Base compensation for Mr. Tirnauer was $368,000, $332,000 and $325,000 for fiscal 2011, 2010 and 2009, respectively. The agreement also provides for salary continuation and severance payments should employment of the executive be terminated under specified conditions, as defined therein. Additionally, Mr. Tirnauer is eligible for an annual cash bonus based on performance. The agreement continues in effect until terminated by either the Company or the executive in accordance with the termination provisions of the agreement. Effective November 22, 2011, Mr. Tirnauer was promoted to Executive Vice President & Chief Financial Officer with no change in the terms of his employment agreement with the Company.
Effective July 16, 2009, the Company entered into an employment agreement with Ronald J. Masciantonio, then the Company’s Vice President & General Counsel. The agreement was amended on April 27, 2010, in connection with Mr. Masciantonio’s promotion to Senior Vice President & General Counsel. Effective April 21, 2011, Mr. Masciantonio was named by the Board as an executive officer of the Company. Mr. Masciantonio’s agreement was amended on August 10, 2011 to increase Mr. Masciantonio’s base salary from $275,000 to $320,000, effective December 1, 2010. Base compensation for Mr. Masciantonio was $312,000 for fiscal 2011. The agreement also provides for salary continuation and severance payments should employment of the executive be terminated under specified conditions, as defined therein. Additionally, Mr. Masciantonio is eligible for an annual cash bonus based on performance. The agreement continues in effect until terminated by either the Company or the
F-30
DESTINATION MATERNITY CORPORATION AND SUBSIDIARIES
NOTES TO CONSOLIDATED FINANCIAL STATEMENTS (Continued)
18. EXECUTIVE OFFICER EMPLOYMENT AGREEMENTS (Continued)
executive in accordance with the termination provisions of the agreement. Effective November 22, 2011, Mr. Masciantonio was promoted to Executive Vice President & General Counsel with no change in the terms of his employment agreement with the Company.
19. RETIREMENT PLANS
On March 2, 2007, the Company entered into Supplemental Executive Retirement Agreements (the “SERP Agreement(s)”) with Mr. and Ms. Matthias (the “SERP Executives”). The purpose of the SERP Agreements is to provide the executives with supplemental pension benefits following their cessation of employment.
The Company’s D. Matthias Transition Agreement, entered into in September 2008 in connection with Mr. Matthias’ retirement as CEO, amended his SERP Agreement to provide for full vesting of the benefits payable to Mr. Matthias and to increase the total of the amounts payable under the SERP Agreement to approximately 10% more than the amount that would have been payable on September 30, 2012 (the date the SERP Agreement had otherwise been expected to fully vest). The SERP Agreement benefits, totaling $3,960,000, are being paid to Mr. Matthias in installments, which commenced on April 1, 2009, with the final installment due on October 1, 2012. The Company paid SERP benefits to Mr. Matthias totaling $750,000, $900,000 and $1,560,000 in fiscal 2011, 2010 and 2009, respectively.
The amount of the benefit payable under Ms. Matthias’ SERP Agreement is the actuarial present value of a single life annuity equal to 60% of Ms. Matthias’ “deemed final pay,” commencing upon cessation of employment. For this purpose, “deemed final pay” means Ms. Matthias’ base salary on March 2, 2007, increased by 3% for each new fiscal year that began before Ms. Matthias’ cessation of employment. This benefit vested 33 1/3% on March 2, 2007. On each September 30 thereafter for fiscal 2007, 2008 and 2009 the benefit vested 15% annually based on Ms. Matthias’ continuous full-time service provided to the Company during each entire fiscal year. The Company’s R. Matthias Transition Agreement, entered into on November 6, 2009 in connection with Ms. Matthias’ scheduled retirement, amended her SERP Agreement to provide that she would be credited with having served on a full-time basis during the 2010 fiscal year and the SERP vested an additional 15% effective on the Transition Date, to a cumulative total vested percentage of 93 1/3%. Pursuant to the R. Matthias Transition Agreement, Ms. Matthias received a lump sum payment of the SERP Agreement benefits of $4,166,000 on December 16, 2010.
F-31
DESTINATION MATERNITY CORPORATION AND SUBSIDIARIES
NOTES TO CONSOLIDATED FINANCIAL STATEMENTS (Continued)
19. RETIREMENT PLANS (Continued)
The Company is accounting for the SERP Agreements in accordance with the accounting requirements for defined benefit pension and other post-retirement plans. Changes in the benefit obligation under the SERP Agreements as of September 30 were as follows (in thousands):
| 2011 | 2010 | |||||||
| Benefit obligation at beginning of year |
$ | 5,560 | $ | 5,326 | ||||
| Service cost |
— | 439 | ||||||
| Interest cost |
88 | 257 | ||||||
| Plan amendment |
— | 438 | ||||||
| Benefit payments |
(4,916 | ) | (900 | ) | ||||
|
|
|
|
|
|||||
| Benefit obligation at end of year |
732 | 5,560 | ||||||
| Less: current portion included in accrued expenses and other current liabilities |
(600 | ) | (4,874 | ) | ||||
|
|
|
|
|
|||||
| Non-current benefit obligation at end of year |
$ | 132 | $ | 686 | ||||
|
|
|
|
|
|||||
The non-current benefit obligation at end of year was included in “deferred rent and other non-current liabilities” in the accompanying Consolidated Balance Sheets. Estimated benefits expected to be paid during the next two fiscal years are as follows (in thousands):
| Fiscal Year |
||||
| 2012 |
$ | 600 | ||
| 2013 |
150 | |||
The components of net periodic pension cost on a pretax basis were as follows for the years ended September 30 (in thousands):
| 2011 | 2010 | 2009 | ||||||||||
| Service cost |
$ | — | $ | 439 | $ | 573 | ||||||
| Interest cost |
88 | 257 | 316 | |||||||||
| Amortization of prior service cost |
— | 139 | 196 | |||||||||
| Amortization of change in discount rate |
— | — | 114 | |||||||||
| Plan amendment and curtailment |
— | 888 | — | |||||||||
|
|
|
|
|
|
|
|||||||
| Total net periodic benefit cost |
$ | 88 | $ | 1,723 | $ | 1,199 | ||||||
|
|
|
|
|
|
|
|||||||
The following weighted-average assumptions were used to determine net periodic benefit cost for the years ended September 30, 2011, 2010 and 2009: discount rate – 5.0%; compensation increase rate – 3.0%.
F-32
DESTINATION MATERNITY CORPORATION AND SUBSIDIARIES
NOTES TO CONSOLIDATED FINANCIAL STATEMENTS (Continued)
19. RETIREMENT PLANS (Continued)
Amounts recorded in accumulated other comprehensive loss as of September 30 were as follows (in thousands):
| 2011 | 2010 | 2009 | ||||||||||
| Unrecognized prior service cost—beginning of year |
$ | — | $ | (589 | ) | $ | (785 | ) | ||||
| Amortization of prior service cost |
— | 139 | 196 | |||||||||
| Prior service cost recognized for plan amendment and curtailment |
— | 450 | — | |||||||||
|
|
|
|
|
|
|
|||||||
| Unrecognized prior service cost—end of year |
— | — | (589 | ) | ||||||||
| Deferred income tax benefit |
— | — | 220 | |||||||||
|
|
|
|
|
|
|
|||||||
| Unrecognized prior service cost, net of tax—end of year |
$ | — | $ | — | $ | (369 | ) | |||||
|
|
|
|
|
|
|
|||||||
The Company has a grantor trust, which was established for the purpose of accumulating assets in anticipation of the Company’s payment obligations under the SERP Agreements (the “Grantor Trust”). The Company’s agreements with the SERP Executives and the trustee for the Grantor Trust (the “Trustee”) allow the Company to make cash deposits to the Grantor Trust, or provide an irrevocable standby letter of credit (the “SERP Letter of Credit”) to the Trustee, in lieu of any deposits otherwise required, for funding obligations under the SERP Agreements. In December 2009, in connection with the additional vesting and scheduled payment of SERP Executives’ benefits in 2010, the Company made a partial cash contribution to the Grantor Trust of $1,500,000 and reduced the SERP Letter of Credit by $1,500,000, to $4,437,000 as of December 31, 2009. In December 2010, the Company received a distribution of the remaining assets in the Grantor Trust totaling $1,504,000. The amount withdrawn was used to partially fund the December 2010 lump sum payment of $4,166,000 of SERP benefits to Ms. Matthias. As of September 30, 2011, the SERP Letter of Credit was $750,000. In October 2011, the Company reduced the SERP Letter of Credit by $150,000 in connection with an October 2011 SERP benefit payment to Mr. Matthias, to $600,000, which was equal to the amount of SERP benefits remaining to be paid to Mr. Matthias.
20. EMPLOYEE BENEFIT PLANS
The Company has a 401(k) savings plan for all employees who have at least six months of service and are at least 18 years of age. Employees can contribute up to 20% of their annual salary. Employees who meet certain criteria are eligible for a matching contribution from the Company based on a sliding scale. Company matches are made in the first quarter of the succeeding calendar year and vest over a period of approximately six years from each employee’s commencement of employment with the Company. Company matching contributions totaling $146,000, $153,000 and $162,000, were made in fiscal 2011, 2010 and 2009, respectively. In addition, the Company may make discretionary contributions to the plan, which vest over a period of approximately six years from each employee’s commencement of employment with the Company. The Company has not made any discretionary contributions.
F-33
DESTINATION MATERNITY CORPORATION AND SUBSIDIARIES
NOTES TO CONSOLIDATED FINANCIAL STATEMENTS (Continued)
21. QUARTERLY FINANCIAL INFORMATION (UNAUDITED)
Quarterly financial results for the years ended September 30, 2011 and 2010 were as follows (in thousands, except per share amounts):
| Quarter Ended | ||||||||||||||||
| Fiscal 2011 |
9/30/11 | 6/30/11 | 3/31/11 | 12/31/10 | ||||||||||||
| Net sales |
$ | 129,442 | $ | 146,684 | $ | 133,833 | $ | 135,435 | ||||||||
| Gross profit |
68,840 | 80,935 | 74,189 | 72,933 | ||||||||||||
| Net income |
2,687 | 9,460 | 5,593 | 5,248 | ||||||||||||
| Net income per share—Basic |
0.21 | 0.73 | 0.44 | 0.42 | ||||||||||||
| Net income per share—Diluted |
0.20 | 0.72 | 0.43 | 0.40 | ||||||||||||
| Quarter Ended | ||||||||||||||||
| Fiscal 2010 |
9/30/10 | 6/30/10 | 3/31/10 | 12/31/09 | ||||||||||||
| Net sales |
$ | 124,257 | $ | 142,034 | $ | 131,130 | $ | 133,771 | ||||||||
| Gross profit |
68,293 | 79,651 | 71,388 | 71,694 | ||||||||||||
| Net income |
4,288 | 8,652 | 2,633 | 1,256 | ||||||||||||
| Net income per share—Basic |
0.34 | 0.70 | 0.22 | 0.10 | ||||||||||||
| Net income per share—Diluted |
0.33 | 0.67 | 0.21 | 0.10 | ||||||||||||
The Company’s business, like that of other retailers, is seasonal. The Company’s quarterly net sales have historically been highest in its third fiscal quarter, corresponding to the Spring selling season, followed by its first fiscal quarter, corresponding to the Fall/holiday selling season. Given the historically higher sales level in its third fiscal quarter and the relatively fixed nature of most of the Company’s operating expenses and interest expense, the Company has typically generated a very significant percentage of its full year operating income and net income during its third fiscal quarter.
22. SEGMENT AND ENTERPRISE WIDE DISCLOSURES
Operating Segment. For purposes of the disclosure requirements for segments of a business enterprise, the Company has determined that its business is comprised of one operating segment: the design, manufacture and sale of maternity apparel and related accessories. While the Company offers a wide range of products for sale, the substantial portion of its products are initially distributed through the same distribution facilities, many of the Company’s products are manufactured at common contract manufacturer production facilities, the Company’s products are marketed through a common marketing department, and these products are sold to a similar customer base, consisting of expectant mothers.
Geographic Information. Information concerning the Company’s operations by geographic area is as follows (in thousands):
| Year Ended September 30, | ||||||||||||
| 2011 | 2010 | 2009 | ||||||||||
| Net Sales to Unaffiliated Customers |
||||||||||||
| United States |
$ | 520,023 | $ | 505,621 | $ | 510,669 | ||||||
| Foreign |
25,371 | 25,571 | 20,582 | |||||||||
F-34
DESTINATION MATERNITY CORPORATION AND SUBSIDIARIES
NOTES TO CONSOLIDATED FINANCIAL STATEMENTS (Continued)
22. SEGMENT AND ENTERPRISE WIDE DISCLOSURES (Continued)
| September 30, 2011 |
September 30, 2010 |
|||||||
| Long-Lived Assets, Net |
||||||||
| United States |
$ | 55,497 | $ | 57,859 | ||||
| Foreign |
1,605 | 1,938 | ||||||
Major Customers. For the periods presented, the Company did not have any one customer who represented more than 10% of its net sales.
23. INTEREST EXPENSE, NET
Interest expense, net for the years ended September 30 is comprised of the following (in thousands):
| 2011 | 2010 | 2009 | ||||||||||
| Interest expense |
$ | 2,266 | $ | 3,330 | $ | 4,758 | ||||||
| Interest income |
(33 | ) | (30 | ) | (38 | ) | ||||||
|
|
|
|
|
|
|
|||||||
| Interest expense, net |
$ | 2,233 | $ | 3,300 | $ | 4,720 | ||||||
|
|
|
|
|
|
|
|||||||
24. RELATED PARTY TRANSACTIONS
There is a husband and wife relationship between Mr. Matthias and Ms. Matthias. There are no family relationships among any of the Company’s current executive officers or directors.
The former non-executive Chairman of the Company’s Board, who did not stand for reelection in February 2011, provided consulting services to Pepper Hamilton LLP, which provides legal services to the Company. The Company paid legal fees to this law firm of $754,000, $288,000 and $595,000 in fiscal 2011, 2010 and 2009, respectively. As of September 30, 2011 and 2010, the Company had accrued amounts outstanding to this law firm of $31,000 and $199,000, respectively.
F-35
DESTINATION MATERNITY CORPORATION AND SUBSIDIARIES
SCHEDULE II—VALUATION AND QUALIFYING ACCOUNTS
(in thousands)
| Balance at beginning of period (1) |
Additions charged to costs and expenses |
Deductions and reclassifications |
Balance at end of period (1) |
|||||||||||||
| Year Ended September 30, 2011 |
||||||||||||||||
| Product return reserve |
$ | 1,469 | $ | 614 | $ | — | $ | 2,083 | ||||||||
| Year Ended September 30, 2010 |
||||||||||||||||
| Product return reserve |
$ | 324 | $ | 896 | (2) | $ | 249 | (3) | $ | 1,469 | ||||||
| Year Ended September 30, 2009 |
||||||||||||||||
| Product return reserve, net |
$ | 202 | $ | 122 | $ | — | $ | 324 | ||||||||
| (1) | As of September 30, 2011 and 2010, the Company’s product return reserve reflects the estimated gross sales value of estimated product returns, which had an estimated cost value of $853 and $617, respectively. For the years ended September 30, 2009 and 2008, the Company’s product return reserve was presented in the above table net of the estimated cost value of estimated product returns of $249 and $196, respectively. |
| (2) | During fiscal 2010 the Company changed its store merchandise return policy to allow customers to return merchandise purchased in its retail stores for a full refund within 30 days of purchase. |
| (3) | Represents the reclassification of the September 30, 2009 estimated cost value of estimated product returns to present the product return reserve in the above table on a gross basis. |
F-36
INDEX OF EXHIBITS
| Exhibit No. |
Description | |
| †10.45 |
Amendment, dated November 22, 2011, to the Employment Agreement dated as of July 23, 2008 (as amended) between Judd P. Tirnauer and the Company. | |
| †10.46 |
Amendment, dated November 22, 2011, to the Employment Agreement dated as of July 16, 2009 (as amended) between Ronald J. Masciantonio and the Company. | |
| 23 |
Consent of KPMG LLP. | |
| 31.1 |
Certification of the Chief Executive Officer Pursuant to Section 302 of the Sarbanes-Oxley Act of 2002. | |
| 31.2 |
Certification of the Executive Vice President & Chief Financial Officer Pursuant to Section 302 of the Sarbanes-Oxley Act of 2002. | |
| 32.1 |
Certification of the Chief Executive Officer Pursuant to 18 U.S.C. Section 1350, as Adopted Pursuant to Section 906 of the Sarbanes-Oxley Act of 2002. | |
| 32.2 |
Certification of the Executive Vice President & Chief Financial Officer Pursuant to 18 U.S.C. Section 1350, as Adopted Pursuant to Section 906 of the Sarbanes-Oxley Act of 2002. | |
| **101.INS |
XBRL Instance Document | |
| **101.SCH |
XBRL Taxonomy Extension Schema Document | |
| **101.CAL |
XBRL Taxonomy Extension Calculation Linkbase Document | |
| **101.DEF |
XBRL Taxonomy Extension Definition Linkbase Document | |
| **101.LAB |
XBRL Taxonomy Extension Label Linkbase Document | |
| **101.PRE |
XBRL Taxonomy Extension Presentation Linkbase Document | |
| ** | XBRL (Extensible Business Reporting Language) information is furnished and not filed or a part of a registration statement or prospectus for purposes of Sections 11 or 12 of the Securities Act of 1933, is deemed not filed for purposes of Section 18 of the Securities Exchange Act of 1934, and otherwise is not subject to liability under these sections. |
| † | Management contract or compensatory plan or arrangement. |