Attached files
| file | filename |
|---|---|
| 8-K - FORM 8-K - Expedia Group, Inc. | d266730d8k.htm |
 INVESTOR
PRESENTATION
December 2011
Exhibit 99.1 |
 2
Safe Harbor
Forward-Looking
Statements.
This
presentation
contains
"forward-looking
statements"
within
the
meaning
of
the
Private
Securities
Litigation
Reform
Act
of
1995.
These
statements
are
not
guarantees
of
future
performance.
These
forward-looking
statements
are
based
on
management’s
expectations
as
of
December
9,
2011
and
assumptions
which
are
inherently
subject
to
uncertainties,
risks
and
changes
in
circumstances
that
are
difficult
to
predict.
The
use
of
words
such
as
intends
and
expects,
among
others,
generally
identify
forward-looking
statements.
However,
these
words
are
not
the
exclusive
means
of
identifying
such
statements.
In
addition,
any
statements
that
refer
to
expectations,
projections
or
other
characterizations
of
future
events
or
circumstances
are
forward-
looking
statements
and
may
include
statements
relating
to
future
revenues,
expenses,
margins,
profitability,
net
income
/
(loss),
earnings
per
share
and
other
measures
of
results
of
operations
and
the
prospects
for
future
growth
of
Expedia,
Inc.’s
business.
Actual
results
and
the
timing
and
outcome
of
events
may
differ
materially
from
those
expressed
or
implied
in
the
forward-looking
statements
for
a
variety
of
reasons,
including,
among
others:
declines
or
disruptions
in
the
travel
industry;
changes
in
our
relationships
and
contractual
agreements
with
travel
suppliers
or
supplier
intermediaries;
risks
relating
to
the
announced
spin-off
of
our
TripAdvisor
business;
increases
in
the
costs
of
maintaining
and
enhancing
our
brand
awareness;
changes
in
search
engine
algorithms
and
dynamics,
or
search
engine
disintermediation;
our
inability
to
adapt
to
technological
developments
or
to
maintain
our
existing
technologies;
our
ability
to
expand
successfully
in
international
markets;
changes
in
senior
management;
volatility
in
our
stock
price;
changing
laws,
rules
and
regulations
and
legal
uncertainties
relating
to
our
business;
unfavorable
new,
or
adverse
application
of
existing,
tax
laws,
rules
or
regulations;
adverse
outcomes
in
legal
proceedings
to
which
we
are
party;
provisions
in
certain
credit
card
processing
agreements
that
could
adversely
impact
our
liquidity
and
financial
positions;
fluctuations
in
our
effective
tax
rate;
our
inability
to
access
the
capital
markets
when
necessary;
risks
related
to
our
long
term
indebtedness;
fluctuations
in
foreign
exchange
rates;
risks
related
to
the
failure
of
counterparties
to
perform
on
financial
obligations;
potential
liabilities
resulting
from
our
processing,
storage,
use
and
disclosure
of
personal
data;
the
integration
of
current
and
acquired
businesses;
the
risk
that
our
intellectual
property
is
not
protected
from
copying
or
use
by
others,
including
competitors;
and
other
risks
detailed
in
our
public
filings
with
the
SEC,
including
our
annual
report
on
Form
10-K
for
the
year
ended
December
31,
2010
and
quarterly
report
on
Form
10-Q
for
the
quarter
ended
September
30,
2011.
Except
as
required
by
law,
we
undertake
no
obligation
to
update
any
forward-looking
or
other
statements
in
this
presentation,
whether
as
a
result
of
new
information,
future
events
or
otherwise.
Non-GAAP
Measures.
Reconciliations
to
GAAP
measures
of
non-GAAP
measures
included
in
this
presentation
are
included
in
the
Appendices.
These
measures
are
intended
to
supplement,
not
substitute
for,
GAAP
comparable
measures.
Investors
are
urged
to
consider
carefully
the
comparable
GAAP
measures
and
reconciliations.
Industry
/
Market
Data.
Industry
and
market
data
used
in
this
presentation
have
been
obtained
from
industry
publications
and
sources
as
well
as
from
research
reports
prepared
for
other
purposes.
We
have
not
independently
verified
the
data
obtained
from
these
sources
and
cannot
assure
you
of
the
data’s
accuracy
or
completeness.
Trademarks
&
Logos.
Trademarks
and
logos
are
the
property
of
their
respective
owners.
©
2011 Expedia, Inc. All rights reserved. CST: 2029030-50
|
 3
Basis of Presentation
The
operating
results
for
Expedia,
Inc.
within
this
presentation
exclude
segment
results
for
the
TripAdvisor
Media
Group
(“TripAdvisor”)
unless
otherwise
noted.
Expedia
allocates
certain
expenses,
such
as
stock-based
compensation
and
amortization
of
intangible
assets,
to
its
corporate
segment
while
depreciation
is
included
on
a
segment
basis.
The
adjusted
earnings
per
share
figures
presented
within
are
based
on
historical
results,
after
giving
effect
to
discontinued
operations
results
of
TripAdvisor
for
the
respective
periods
presented.
Subsequent
to
the
transaction
closing
on
or
about
December
20,
2011,
Expedia
expects
to
file
on
Form
8-K
pro
forma
results
for
new
Expedia,
Inc.
for
the
years
ended
2008,
2009,
2010
as
well
as
the
nine
months
ended
September
30,
2011
that
will
reflect
results
from
discontinued
operations
with
respect
to
TripAdvisor.
Our
management
believes
that
the
assumptions
underlying
the
financial
statements
are
reasonable.
However,
this
financial
information
does
not
necessarily
reflect
the
future
financial
position,
results
of
operations
and
cash
flows
of
Expedia
or
TripAdvisor,
nor
does
it
reflect
what
the
historical
financial
position,
results
of
operations
and
cash
flows
of
Expedia
or
TripAdvisor
would
have
been
had
we
been
a
stand-alone
company
during
the
periods
presented. |
 4
Transaction Summary
IS SPINNING OFF
the Portfolio of Travel Media and Content
Sites within the TripAdvisor
®
Media Group
0.6 Billion
$
324 Million
$
1
TTM = Trailing Twelve Months
2
See Appendix A for Non-GAAP to GAAP Reconciliation
3
Adjusted EBITDA is calculated as operating income plus: stock-based compensation
expense, including compensation expense related to certain subsidiary equity plans; acquisition-related
impacts
including
amortization
of
intangible
assets
and
goodwill
and
intangible
asset
impairment,
and
gains
(losses)
recognized
on
changes
in
the
value
of
contingent
consideration
arrangements; certain infrequently occurring items, including restructuring; charges
incurred, if any, for monies that may be required to be paid in advance of litigation in certain occupancy tax
proceedings; gains (losses) realized on revenue hedging activities that are included
in other, net; and depreciation TTM
1
3Q 2011 REVENUES
3.4 Billion
$
TTM 3Q 2011ADJUSTED EBITDA
2,3
683 Million
$ |
 5
Investment Highlights
Global Leader in ~$1 Trillion
Global Leader in ~$1 Trillion
Market with
Market with
Strong Offline-to-Online Trends
Strong Offline-to-Online Trends
Significant Growth Opportunities Across Geographies
Significant Growth Opportunities Across Geographies
Rapid Expansion in Highly Fragmented Hotel Industry
Rapid Expansion in Highly Fragmented Hotel Industry
Technology Platform Investment and
Technology Platform Investment and
Innovation Driving Higher Conversion
Innovation Driving Higher Conversion
Success in New Distribution Channels, e.g. Mobile
Success in New Distribution Channels, e.g. Mobile
A Growth
Company
Powerful Free Cash Flow Generation
Powerful Free Cash Flow Generation |
     6
The Largest Online Travel Company in
the World
Mutually
Beneficial
Supply
Agreements
Value to
Travelers
Scale Enables
Virtuous Circle
Diverse Demand:
Geography AND Travel Type
1
comScore Worldwide Average Monthly UV data, January 2011-October 2011
SUPPLY
SUPPLY
Massive
Depth and
Breadth of
~145,000 Hotels in
200+
Countries
300+
Airlines
2.6 Million
Packages
Unmatched
Volume and
Diversity of
Global Travel
DEMAND
DEMAND
60 Million
Unique Visitors
1
Travelers in
~70 Countries
Corporate and
Leisure Travel;
Online and Offline |
 15
Sites in 39 Countries
A Leader in Global
Corporate Travel
Established Brands with Global Reach
76 Sites in
67 Countries
A Leading Hotel
Specialist Globally
26 Sites in
26 Countries
#1
Online Travel Agency
10,000 Affiliates in
33 Countries
“Expedia Inside”
Private Label Solutions
Trusted Brands
Trusted Brands |
 8
Business Mix Transformation
Positions Us for Growth
Revenue
5 Years Ago
Revenue
Today
Note: 5 Years Ago = 2005 Revenues; Today = TTM ending September 30, 2011
Revenues |
 9
Expedia Well-Positioned to Capture
Significant Global Growth Opportunity
Sources: PhoCusWright estimates and Expedia data
Note: EXPE share of travel market defined by TTM gross bookings as of September 30,
2011. APAC data includes gross bookings from AirAsia joint venture |
 10
Asia –
Investing for Growth
Key Assets
Key Assets
14 Sites in
13 Asian Countries —
5 Launched
Since 2009
Powers Important
Asian Brands, e.g.
JALAN: One of Asia’s
Leading Travel Sites
64% Ownership in
#2 Chinese Online
Travel Agency
Partnership with Asia’s
Leading Low Cost
Carrier
+
1
Includes Gross Bookings for AirAsia joint venture that launched July 1, 2011 and were
not consolidated in Expedia’s 3Q 2011 results |
    11
Expedia
Expedia
®
Has Scale in Hotels …
Has Scale in Hotels …
Global Team
Working to Sign
Up New Hotels
Number of Hotels3
Rapidly Expanding in
Fragmented Hotel Market
1
Other includes Advertising, Destination Services, Insurance, Cruise, Agency Packages,
and Other 2
Smith Travel Research and Expedia data
3
Hotel
data
for
TripAdvisor,
Priceline,
Orbitz
and
Ctrip.com
from
Companywebsites
…
…
And Significant Room for
And Significant Room for
Additional Growth
Additional Growth
Hotels
Hotels
72%
72%
$3.4B
TTM 3Q 2011
Revenues
~145k Hotels in
200+ Countries
Single Largest
Booker of
Rooms in US
…
But Still Only
~5% Share2 |
         12
UNIFIED
Customer
Operations
Technology
UNIFIED
Transactional
Infrastructure:
Financials / Order Management / Inventory Management
Technology Investment
Positions Us for Growth
10,000
Affiliates
CUSTOMIZED
Front-End
Technology
for
Rapid
Innovation
and Powerful Analytics …
Improving Conversion |
 13
Technology Investment
Positions Us for Growth
1
Hotels.com Gross Bookings growth does not include Venere
|
  14
Fast Paced Innovation from
Fast Paced Innovation from
Technology Investment
Technology Investment
Simplifying the Customer
Simplifying the Customer
Experience to Drive Conversion:
Experience to Drive Conversion:
An Example
An Example
Investing in Technology at
24
3-4
New Technology Releases Annually
Pre-Investment
New Platform
Capability
…
and Driving Toward Even Faster Releases
…
…
Increases Conversion Rates
Increases Conversion Rates
Pre-Platform
Migration
Post-Platform
Migration
+~20%
Number of Pages to Booking
Pre-Investment
~6
Pages
1
Page
New Platform
Capability |
 15
Opening Up Significant
Opening Up Significant
Opportunity in Travel
Opportunity in Travel
Industry Leading Mobile, Social and Deal
Initiatives Drive Traffic and Revenue
50-70%
of Mobile Bookings
of Mobile Bookings
Completed within
Completed within
One Day
of Travel / Stay
of Travel / Stay
in App Development
Leading Travel
App Developer
in App Success
#1 Free iPhone
Travel Apps in
40+ Countries
1
in Deals
…
…
Expedia
Expedia
Leads the Way
Leads the Way
The World Is
The World Is
Changing …
Changing …
PC-Connected
Users
24 x 7
Mobile Users
Unique Supply Deal and
Unique Supply Deal and
Value Proposition to
Value Proposition to
Customers:
Customers:
40-50% Off
Just for Mobile
Just for Mobile
1
Source: AppAnnie |
 16
Expedia’s Significant Competitive Moats
SCALE and BREADTH
SCALE and BREADTH
Global Scale Across Multiple Travel Brands and Product Offerings
Global Scale Across Multiple Travel Brands and Product Offerings
DIVERSE DEMAND
DIVERSE DEMAND
Multiple Sources
Multiple Sources
Leisure
Leisure
Corporate
Corporate
Call Centers
Call Centers
Traditional Travel Agency
Traditional Travel Agency
Online
Online
SUPPLY
SUPPLY
Global Travel Supply Footprint and
Global Travel Supply Footprint and
Deeper Supplier Relationships
Deeper Supplier Relationships
TECHNOLOGY PLATFORM
TECHNOLOGY PLATFORM
Investment in Technology to
Investment in Technology to
Drive Conversion and Bookings
Drive Conversion and Bookings |
 17
Experienced Leadership Team
with Deep Industry Knowledge
Dara
Dara
Khosrowshahi
Khosrowshahi
Chief Executive Officer
and President
6 Years at Expedia
Mark
Mark
Okerstrom
Okerstrom
Chief Financial Officer
5 Years at Expedia
Barry
Barry
Diller
Diller
Senior Executive
16 Years at
IAC/Expedia |
 18
FINANCIALS |
 19
Large User Base With Multiple Growth Vectors
Large User Base With Multiple Growth Vectors
Key Financial Highlights
High Quality Diversified Revenue Streams
High Quality Diversified Revenue Streams
Consistent, Robust Cash Flow Generation and Strong EPS Growth
Consistent, Robust Cash Flow Generation and Strong EPS Growth
Strong Balance Sheet Allows Ample Value-Add Opportunities
Strong Balance Sheet Allows Ample Value-Add Opportunities
Investing Now to Support Future Growth |
     20
Investing to Drive Accelerating Growth
ADJUSTED EBITDA¹
ADJUSTED EPS GROWTH
2,3,4
$ Millions
’07-’10 CAGR: 2.8%
TTM 3Q11 Y-o-Y Growth: 2.2%
’07-’10 CAGR: 2.8%
TTM 3Q11 Y-o-Y Growth: 2.2%
’07-’10 CAGR: 6.4%
TTM 3Q11 Y-o-Y Growth: 8.2%
’07-’10 CAGR: 6.4%
TTM 3Q11 Y-o-Y Growth: 8.2%
2
See Appendix B for Non-GAAP to GAAP Reconciliation
3
Adj. EPS does not take into account the reverse stock split expected to occur
immediately prior to the contemplated TripAdvisor spin transaction
4
Adj. EPS is EPS for Expedia, Inc. considering TripAdvisor on a discontinued
operations basis REVENUE
$ Billions
’07-’10 CAGR :
6.1%
TTM 3Q11 Y-o-Y Growth: 15.5%
’07-’10 CAGR :
6.1%
TTM 3Q11 Y-o-Y Growth: 15.5%
1
See Appendix A for Non-GAAP to GAAP Reconciliation
GROSS BOOKINGS
World’s Largest Travel Company
World’s Largest Travel Company
$ Billions |
 21
High Quality, Diversified Revenue
Weighted Towards Growth
1
Other Leisure includes Classic Vacations, Expedia Local Expert and
CruiseShipCenters 2
Hotels.com includes Venere |
 22
The Three Stages of Expedia Growth
STAGE 1
2010
STAGE 2
2011-2012
STAGE 3
2013
Revenue Growth
Modest:
6.1% Growth¹
Accelerating
Continuing
Line Item Trajectory
(% of Revenues)
Cost of Revenue
22.5%
Flat as
% of Revenue
Declining
as
%
of
Revenue
Selling and Marketing
40.3%
Increasing as
% of Revenue
Flat to Slightly
Increasing as
% of Revenue
Technology
and Content
9.8%
Increasing as
% of Revenue
Flat or Declining
as
%
of
Revenue
G&A
8.5%
Declining
as
% of Revenue
Declining
as
%
of Revenue
Adjusted
EBITDA Margin²
22.3%
Slightly Decreasing as
% of Revenue
Increasing as
% of Revenue
1
Represents 2007 –
2010 CAGR
2
See Appendix A for Non-GAAP to GAAP Reconciliation |
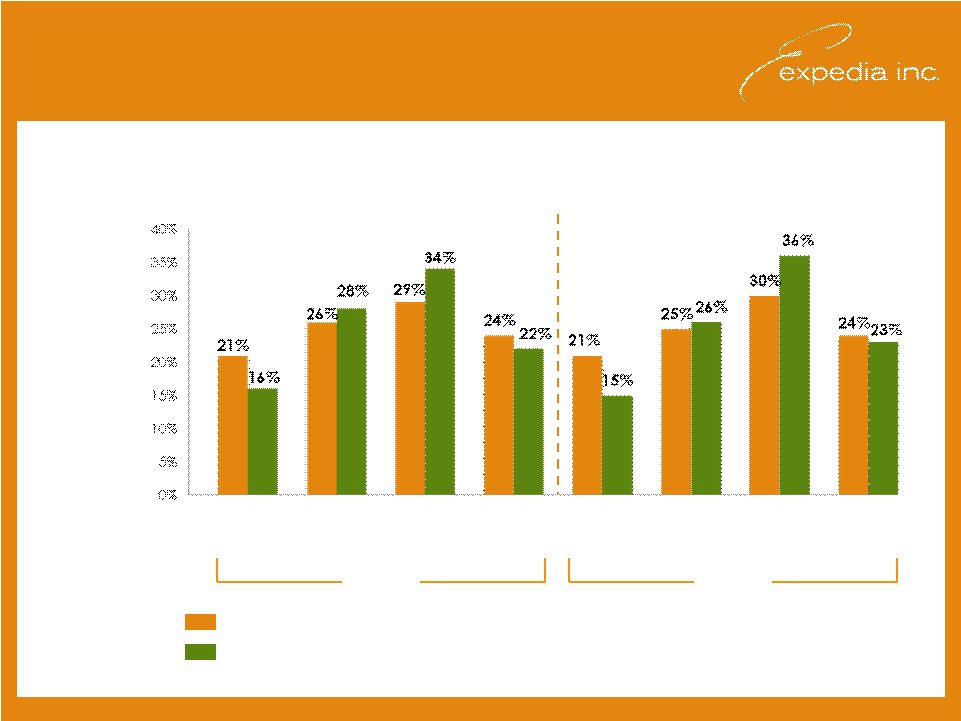 23
Understanding Expedia’s Seasonality
QUARTERLY REVENUE AND ADJUSTED EBITDA CONTRIBUTION
Quarterly Adjusted EBITDA % of Total Annual Adjusted EBITDA
Quarterly Revenue % of Total Annual Revenue
2009
Quarterly Adj.
EBITDA Margin:
Quarter as %
of Total Year
1Q
18%
2Q
26%
3Q
28%
4Q
23%
1Q
15%
2Q
23%
3Q
28%
4Q
21%
2010 |
 24
$ Millions
2008
2009
2010
TTM 3Q11
Capex
$142
$78
$136
$195
Capex (% of Revenue)
5.2%
2.8%
4.5%
5.7%
Share Repurchases
$ –
$ –
$489
$306
Dividend Payment
–
–
79
77
Acquisitions & Other
Investments¹ 342
12
98
88
2
Cash Interest Paid³
54
79
78
124
Consistent, Robust Cash Flow
Available to Drive Equity Returns
Note:
Share
repurchases
and
dividend
payments
reflect
consolidated
Expedia
amounts;
Free
cash
flow
defined
as
net
cash
provided
by
operating
activities
less
capital
expenditures
1
Includes
certain
investment
activity
included
in
sales
and
maturities
of
investments
as
well
as
sales
(purchases)
of
interest
in
controlled
subsidiaries,
net,
as
recorded
on
Expedia’s
cash
flow
statement
2
Acquisitions are as of TTM ending 9/30/2011. Includes $22mm of acquisitions as well as
additional investments in majority-owned subsidiaries and the AirAsia joint venture
3
Includes interest on 8.5% Notes
CONSISTENT AND
STRONG FREE CASH
FLOW DRIVERS:
Strong Adjusted EBITDA
Generation
Working Capital Benefit from
Growing Merchant Hotel
Business
Declining Cash Taxes
Annual Free
Annual Free
Cash Flow
Cash Flow
Between
Between
$300M and
$300M and
$600M
$600M
DRIVES |
 25
Expedia Pro Forma Capitalization
$ Millions
AS OF 9/30/2011
PF 9/30/2011
Cash, Cash Equivalents & Short Term Investments1
$2,006
$1,842
Revolving Credit Facility2
–
–
5.950% Notes Due 20203
749
749
7.456% Notes Due 2018
500
500
8.500% Notes Due 2016
4
396
–
Total Debt
$1,645
$1,249
Net Debt
$(361)
$(593)
TTM Adjusted EBITDA
5
683
683
Total Debt / TTM Adjusted EBITDA
2.4x
1.8x
Net Debt / TTM Adjusted EBITDA
(0.5)x
(0.9)x
Source: Company financial reports and estimates. Some numbers may not add due to
rounding 1
Excludes restricted cash
2
Total
size
of
revolving
credit
facility
closed
in
February
2010
is
$750mm;
available
capacity
reduced
by
$20mm
in
outstanding
letters
of
credit
as
of
September
30,
2011
3
The 5.950% Notes were issued at 99.893% of par resulting in a discount, which is being
amortized over their life 4
The 8.5% Notes were issued at 98.572% resulting in a discount, which is being
amortized over their life 5
TTM ending 9/30/11Adjusted EBITDA excludes segment results for TripAdvisor
|
 26
Summary
Global Leader in ~$1 Trillion Market with
Global Leader in ~$1 Trillion Market with
Strong Offline-to-Online Trends
Strong Offline-to-Online Trends
Significant Growth Opportunities Across Geographies
Significant Growth Opportunities Across Geographies
Rapid Expansion in Highly Fragmented Hotel Industry
Rapid Expansion in Highly Fragmented Hotel Industry
Technology Platform Investment and
Technology Platform Investment and
Innovation Driving Higher Conversion
Innovation Driving Higher Conversion
Success in New Distribution Channels, e.g. Mobile
Success in New Distribution Channels, e.g. Mobile
A Growth
Company
Powerful Free Cash Flow Generation
Powerful Free Cash Flow Generation |
 27
APPENDICES |
 28
$ Millions
2007
2008
2009
2010
TTM ENDING
9/30/2011
Trip
Adv.
Expe.
Inc. ²
Total
Trip
Adv.
Expe.
Inc. ²
Total
Trip
Adv.
Expe.
Inc. ²
Total
Trip
Adv.
Expe.
Inc. ²
Total
Trip
Adv.
Expe.
Inc. ²
Total
Adjusted EBITDA
$623
$619
$659
$677
$324
$683
$1,007
Depreciation
57
72
93
105
17
126
143
OIBA¹
$104
$565
$669
$150
$548
$698
$196
$566
$761
$260
$571
$831
$307
$557
$864
Amortization of Intangible Assets
-
-
(78)
-
-
(69)
-
-
(38)
-
-
(37)
-
-
(35)
Impairment of Goodwill
-
-
-
-
-
(2,762)
-
-
-
-
-
-
-
-
-
Impairment of Intangible and
Other Long-Lived Assets
-
-
-
-
-
(234)
-
-
-
-
-
-
-
-
-
Legal Reserves and Occupancy
Tax Assessments
-
-
-
-
-
-
-
-
(68)
-
-
(6)
-
-
(7)
Stock-Based Compensation
-
-
(63)
-
-
(61)
-
-
(62)
-
-
(60)
-
-
(59)
Restructuring Charges
-
-
-
-
-
-
-
-
(34)
-
-
-
-
-
-
Realized Loss on Revenue Hedges
-
-
-
-
-
-
-
-
11
-
-
4
-
-
17
Spin-off Costs
-
-
-
-
-
-
-
-
-
-
-
-
-
-
(7)
Operating Income / (Loss)
$-
$-
$529
$-
$-
$(2,429)
$-
$-
$571
$-
$-
$732
$-
$-
$774
Other Expense, Net
-
-
(32)
-
-
(86)
-
-
(113)
-
-
(111)
-
-
(118)
Income before Income Taxes
$-
$-
$497
$-
$-
$(2,515)
$-
$-
$458
$-
$-
$621
$-
$-
$656
Provision for Income Taxes
-
-
(203)
-
-
(6)
-
-
(154)
-
-
(195)
-
-
(181)
Net Income
$-
$-
$294
$-
$-
$(2,521)
$-
$-
$304
$-
$-
$426
$-
$-
$475
Net Income Attributable to
Noncontrolling Interests
-
-
2
-
-
3
-
-
(4)
-
-
(4)
-
-
(2)
Net Income Attributable to
Expedia, Inc.
$-
$-
$296
$-
$-
$(2,518)
$-
$-
$300
$-
$-
$422
$-
$-
$473
Non-GAAP / GAAP Reconciliation
Appendix A: Adjusted EBITDA
1
Note: Numbers may not sum due to rounding
1
As previously reported in Expedia, Inc.'s annual and quarterly reports filed with the
Securities and Exchange Commission for the periods reflected above
2
Represents the remaining segments -
Leisure, Egencia and Corporate, as reported under the Expedia, Inc. consolidated
financial statements |
 29
$ Thousands
2007
2008
2009
2010
TTM ENDING
9/30/2011
Net Income / (Loss) from Continuing Operations
$241,968
$(2,340,174)
$214,406
$302,251
$323,575
Stock-Based Compensation
59,948
55,731
55,756
52,507
50,728
Amortization of Intangibles
68,367
58,275
23,875
22,514
23,148
Restructuring Charges
-
-
34,168
-
-
Noncontrolling Investment Basis Adjustment
-
-
5,158
-
-
Legal Reserves and Occupancy Tax Assessments
-
-
67,658
5,542
7,334
Foreign Currency Loss on U.S. Dollar Cash Balances Held by
eLong
-
8,586
128
2,711
2,723
Impairment of Goodwill
8,642
2,480,470
-
-
-
Impairment of Intangibles
-
233,900
-
-
-
Federal Excise Tax Refunds
(12,058)
-
-
-
-
(Gain) / Loss on Derivative Instruments Assumed at Spin-Off
5,748
(4,600)
38
-
-
Amort. of Intangible Assets as Part of Equity Method Investments
2,324
2,593
458
-
-
Unrealized (Gain) / Loss on Revenue Hedges
-
-
(1,033)
4,898
(13,654)
Noncontrolling Interests
(4,515)
(3,837)
(1,343)
(2,877)
(3,243)
Provision for Income Taxes
(38,774)
(196,092)
(86,521)
(26,541)
(20,259)
Adjusted Net Income from Continuing Operations
$331,650
$294,852
$312,748
$361,005
370,352
GAAP Diluted Weighted Average Shares Outstanding
314,233
286,167
292,141
288,028
278,541
Additional Restricted Stock Units
6,237
13,771
6,367
3,777
2,748
Adjusted Diluted Weighted Average Shares Outstanding
320,470
299,938
298,508
291,805
281,289
Adjusted Earnings from Continued Operations Per Share
$1.03
$0.98
$1.05
$1.24
$1.32
Non-GAAP / GAAP Reconciliation
Appendix B: Adjusted EPS Reconciliation
Note: Numbers may not sum due to rounding |
 30
$ Thousands
2010
TTM ENDING
9/30/11
Cost of Revenue
$685
$752
Stock-Based Compensation
(2)
(3)
Cost of Revenue ex. Stock-Based Compensation
$683
$749
Selling and Marketing
$1,235
$1,444
Stock-Based Compensation
(14)
(14)
Selling and Marketing ex. Stock-Based Compensation
$1,221
$1,430
Technology and Content
$311
$360
Stock-Based Compensation
(14)
(15)
Technology and Content ex. Stock-Based Compensation
$296
$345
G&A
$287
$328
Stock-Based Compensation
(29)
(28)
G&A ex. Stock-Based Compensation
$258
$300
Non-GAAP / GAAP Reconciliation
Appendix C: Non-GAAP Expense Items
Non-GAAP Cost of Revenue, Selling and Marketing, Technology and Content and
General and Administrative Expenses Excluding Stock-Based Compensation
Note: Numbers may not sum due to rounding |