Attached files
| file | filename |
|---|---|
| 8-K - FORM 8-K - MCMORAN EXPLORATION CO /DE/ | d267503d8k.htm |
 December 7,
2011 James R. Moffett
Co-Chairman of the Board,
President & CEO
Capital One Southcoast
6
th
Annual Energy Conference
Exhibit 99.1 |
 2
Cautionary Statement
Cautionary Statement
This is an oral presentation which is accompanied by slides. Readers are urged to review our SEC
filings. This
presentation contains forward-looking statements that involve a number of assumptions, risks and uncertainties that could cause actual results to differ
materially from those contained in the forward-looking statements. We caution readers that
forward-looking statements are not guarantees of future performance or exploration and
development success, and our actual exploration experience and future financial results may differ materially from those anticipated, projected
or assumed in the forward-looking statements. Such forward-looking statements include,
but are not limited to, statements regarding various oil and gas discoveries, oil and gas
exploration, development and production activities, capital expenditures, reclamation costs, anticipated and potential production and flow
rates, and other statements that are not historical facts. No assurance can be given that any of
the events anticipated by the forward-looking statements will transpire or occur, or
if any of them do so, what impact they will have on our results of operations or financial condition. Important factors that may cause actual
results to differ materially from those anticipated by forward-looking statements include,
but are not limited to, those associated with general economic and business conditions,
failure to realize expected value creation from acquired properties, variations in the market demand for, and prices of, oil and natural gas,
drilling results, unanticipated fluctuations in flow rates of producing wells due to mechanical
or operational issues (including those experienced at wells operated by third parties where
we are a participant), changes in oil and natural gas reserve expectations, the potential adoption of new governmental regulations,
unanticipated hazards for which we have limited or no insurance coverage, failure of third party
partners to fulfill their capital and other commitments, the ability to satisfy future cash
obligations and environmental costs, adverse conditions, such as high temperatures and pressure that could lead to mechanical failures or
increased costs, the ability to retain current or future lease acreage rights, the ability to
satisfy future cash obligations and environmental costs, access to capital to fund
drilling activities, as well as other general exploration and development risks and hazards, and other factors described in more detail in Part I, Item 1A. "Risk
Factors" included in our Annual Report on Form 10-K for the year ended December 31, 2010,
filed with the SEC as updated by our subsequent filings with the SEC.
Investors are cautioned that many of the assumptions upon which our forward-looking
statements are based are likely to change after our forward-looking statements are
made, including for example the market prices of oil and natural gas, which we cannot control, and production volumes and costs, some aspects of
which we may or may not be able to control. Further, we may make changes to our business plans
that could or will affect our results. We caution investors that we do not intend to
update our forward-looking statements, notwithstanding any changes in our assumptions, changes in our business plans, our actual experience, or
other changes, and we undertake no obligation to update any forward-looking statements more
frequently than quarterly.
The SEC requires oil and gas companies, in their filings with the SEC, to disclose proved
reserves that a company has demonstrated by actual production or conclusive formation
tests to be economically and legally producible under existing economic and operating conditions. Beginning with year-end reserves for 2009,
the SEC permits oil and gas companies, in their filings with the SEC, to disclose probable and
possible reserves, as such terms are defined by the SEC. We use certain phrases and terms
in this presentation, such as "gross unrisked potential” and “reserve potential," which the SEC's guidelines prohibit us from including in filings
with the SEC. “Gross unrisked potential” and “reserve potential” do not take
into account the certainty of resource recovery, which is contingent on exploration
success, technical improvements in drilling access, commerciality and other factors, and are
therefore not indicative of expected future resource recovery and should not be relied
upon. We urge you to consider closely the disclosure of proved reserves included in McMoRan's Annual Report on Form 10-K for the year ended
December 31, 2010.
This presentation contains a financial measure, earnings before interest, taxes,
depreciation, amortization and exploration expenses (EBITDAX), commonly used in the oil
and natural gas industry but not defined under GAAP. As required by SEC Regulation G, reconciliations of this measure to amounts reported in McMoRan’s
consolidated financial statements are included in the supplemental schedules of this
presentation. |
 Highlights
Industry Leader in Ultra-Deep Exploration
-
Drilling Continues to De-risk Play & Open Up New Trend
-
2011 Results Expanded Resource Potential of Trend
-
Identified 5 Hydrocarbon Bearing Geologic Sections Below the Salt Weld
-
3 Wells Currently Drilling
Advancing Davy Jones Development Activities; Completion Activities
Under Way
Favorable Production Performance
-
3Q Rate of 187 MMcfe/d Exceeded July Estimate
-
2011 Annual Estimate 187 MMcfe/d
$642 MM in Cash at 9/30/11
3 |
 4
2011 Outlook Summary
2011 Outlook Summary
2011 Production Estimate
(1)
-
Annual Average 187 MMcfe/d
-
4Q11e
–
170
MMcfe/d
2011
EBITDAX
Estimate
–
$310
MM
(2)
2011
Capital
Expenditures
Estimate
–
$500-550
MM
-
$300-350 MM in Exploration
-
$200 MM in Development
-
Spending to Continue to be Driven by Opportunities, Drilling Results and
Follow-on Development Activities
Abandonment Expenditures Estimate
-
~$140 MM in P&A Expenditures
-
~$60 MM Expected to be Covered by Insurance
-
$50 MM Escrowed as of 9/30/11 for Future P&A
-
Continue to Pursue Additional Reimbursements Under Insurance Programs for
Other 2008 Hurricane Related Claims Expected in Future Periods
e = estimate. See Cautionary Statement.
(1) Dependent on the timing of planned recompletions and start ups, production performance,
weather and other factors.
(2) Based on 2011 production estimate from existing fields and NYMEX forward curve pricing as
of October 11, 2011 ($3.69/MMbtu and $85.37/bbl for
remaining 3 months of 2011). Each $1.00/MMbtu change in the natural gas price in the remaining 3 months of 2011 would have a $13 MM impact
and each $5.00/bbl change in oil price would have a $4 MM impact
on this estimate. |
 5
Ultra-Deep
Accomplishments To-Date
Ultra-Deep
Accomplishments To-Date
Proved Wells Can be Drilled/Evaluated Safely Below Salt Weld
Confirmed Geologic Model in 5 Formations Below Salt Weld
Proved High Quality Reservoirs with Large Structural Features
Are Present Below Salt Weld
Developing Expertise/Technology for High Pressure/High
Temperature Completions
Identified Conventional Completion Opportunities
Activities to Date Have De-risked Shallow Water, Ultra-Deep Shelf Play
Flow Testing
Reserve Bookings Following Successful Flow Tests
Additional Delineation Drilling
Apply Model on Other Prospects within Newly Defined Trend
What’s Next? |
 6
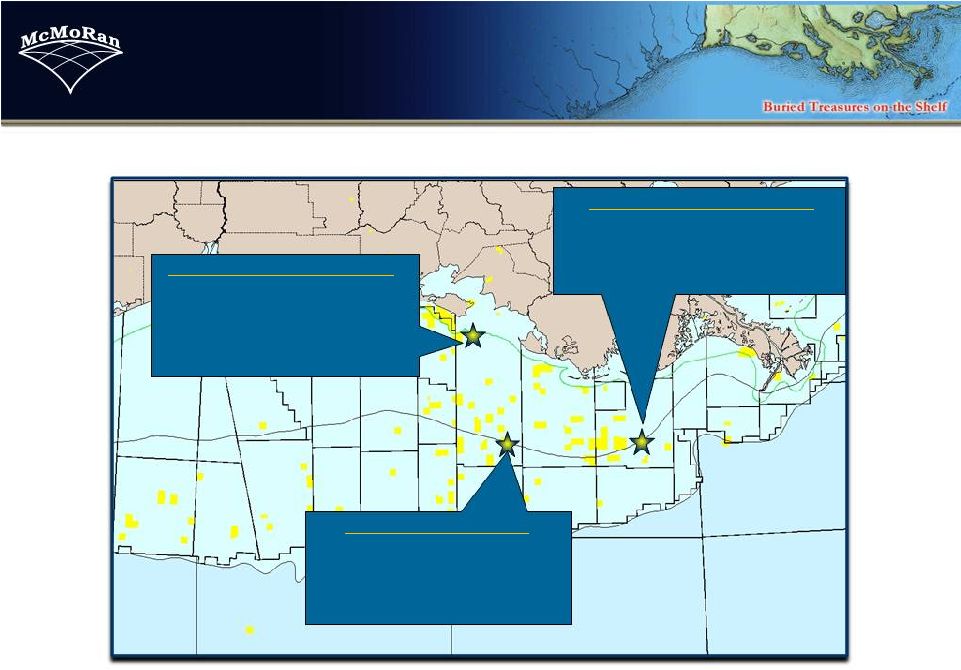
Lafitte Strategic Area
One Successful Sub-salt Well
Identified Hydrocarbon Bearing
Sands in Miocene
WI: 72.0%; NRI: 58.3%
Davy Jones Strategic Area
2 Successful Sub-salt Wells
Identified Hydrocarbon Bearing
Wilcox and Tuscaloosa Sands &
Cretaceous Carbonates
WI: 63.4%; NRI: 50.2%
Ultra-Deep Data Points
Ultra-Deep Data Points
Blackbeard Strategic Area
2 Successful Sub-salt Wells
Identified Hydrocarbon Bearing
Sands in Upper/Middle/Lower
Miocene and Frio |
 7
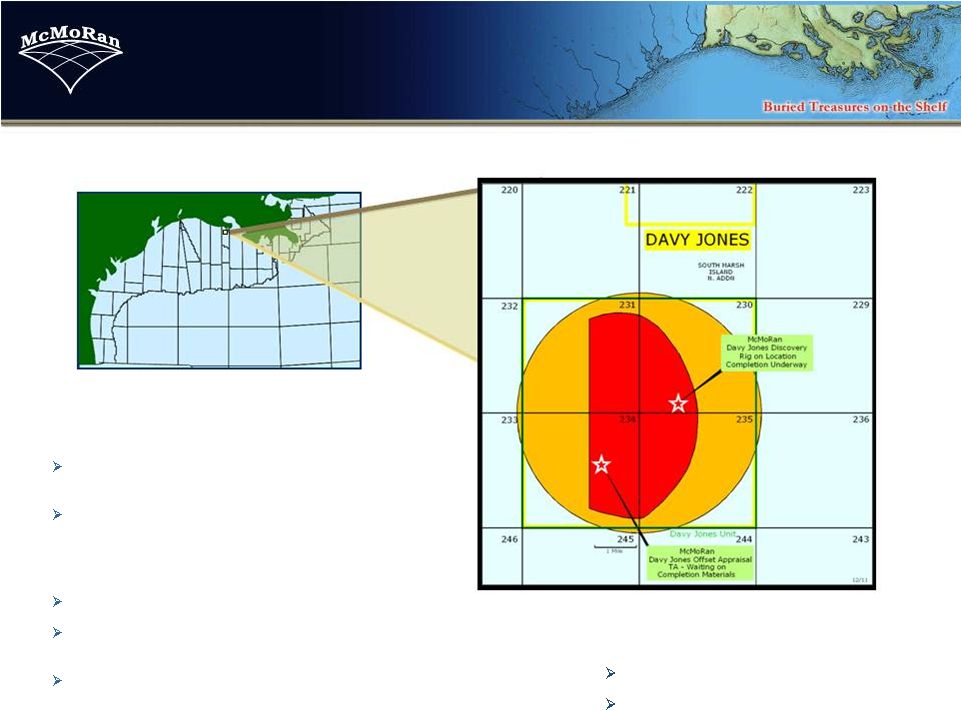
Located in 20 Feet of Water
Large Ultra-Deep Structure
Encompassing 4 OCS Lease Blocks
South Marsh Island 230/231/234/235
Davy Jones –
Major Ultra-Deep Discovery
Davy Jones –
Major Ultra-Deep Discovery
2 Wells Confirmed Presence of Wilcox Age Sands
on Shelf & Structural Continuity
Confirmed Prospectivity of Tuscaloosa Sands and
Cretaceous Carbonates
MMR WI: 63.4%
MMR NRI: 50.2%
2011 Drilling Results Expand Resource Potential
What Have We Learned?
What’s Next?
Completion/Flow Testing of Nos. 1 & 2 Wells
New Wilcox Delineation Well on Northern Part of
Structure
New Well to Evaluate Tuscaloosa and Lower
Cretaceous Updip |
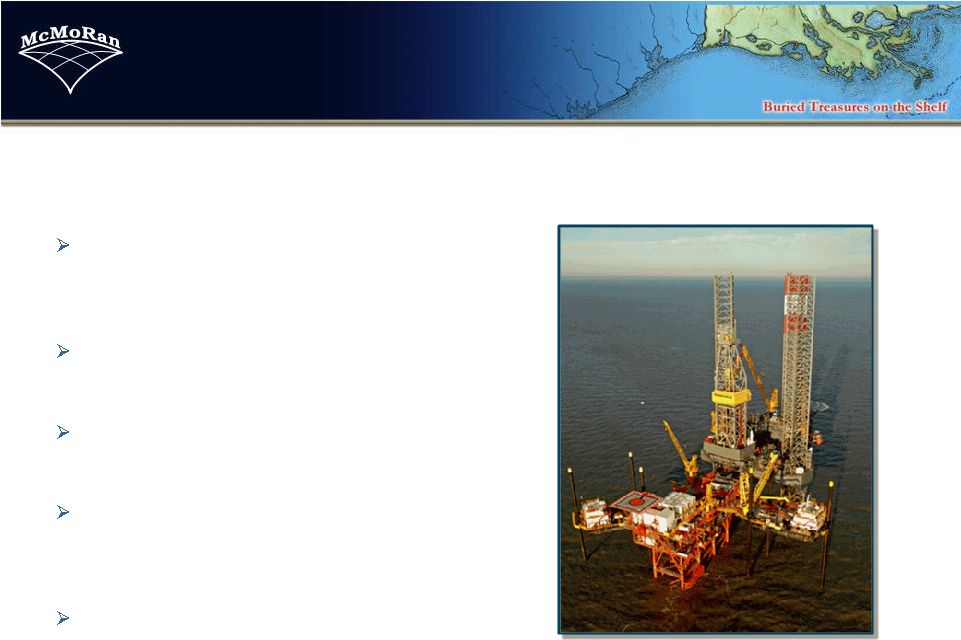 Davy Jones Field
Development Davy Jones Field Development
8
Production Platform for DJ #1 and
Central Processing Facility for Field
Have Been Installed
No. 1 Well Completion Under Way;
Flow Test Expected Within Weeks
No. 2 Well Completion/Flow Test
Expected
in
2
Half
2012
Both Wells Could Produce
Immediately Following
Successful Flow Tests
Initial Capacity of Production
Facility 150 MMcf/d; Expandable
to 275 MMcf/d Quickly
McMoRan Has Advanced the Technology, Equipment and
Processes Needed to Develop This Field
Rig on Location for completion activities of #1 Well
nd |
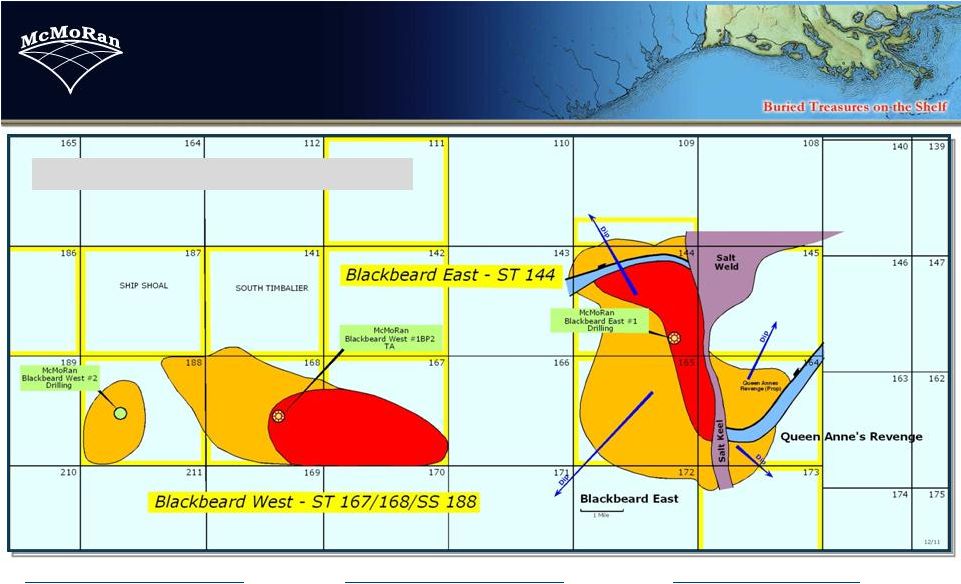 9
Located in 80 Feet of Water
Blackbeard Ultra-Deep
Exploration Area
Blackbeard Ultra-Deep
Exploration Area
Blackbeard West #2 (SS 188)
•
Spud on November 25, 2011
•
Drilling Below 3,100’
•
Targeting Miocene Sands Below
Salt Weld
•
PTD 26,000’
•
WI: 67.1 %; NRI: 51.3%
Blackbeard East (ST 144)
Blackbeard West #1 (ST 168)
•
Identified 4 Hydrocarbon Bearing
Sands in Miocene Below 30,000’
•
Deepest Well Drilled Below Mud
Line in GOM
•
WI: 67.1 %; NRI: 54.7%
•
176 Net Feet of Pay in Miocene
•
1st
Frio Sand Offshore Central LA
•
Drilling Below 33,000’
•
Targeting Eocene Age Sands
•
PTD 34,000’
•
WI: 72 %; NRI: 57.4% |
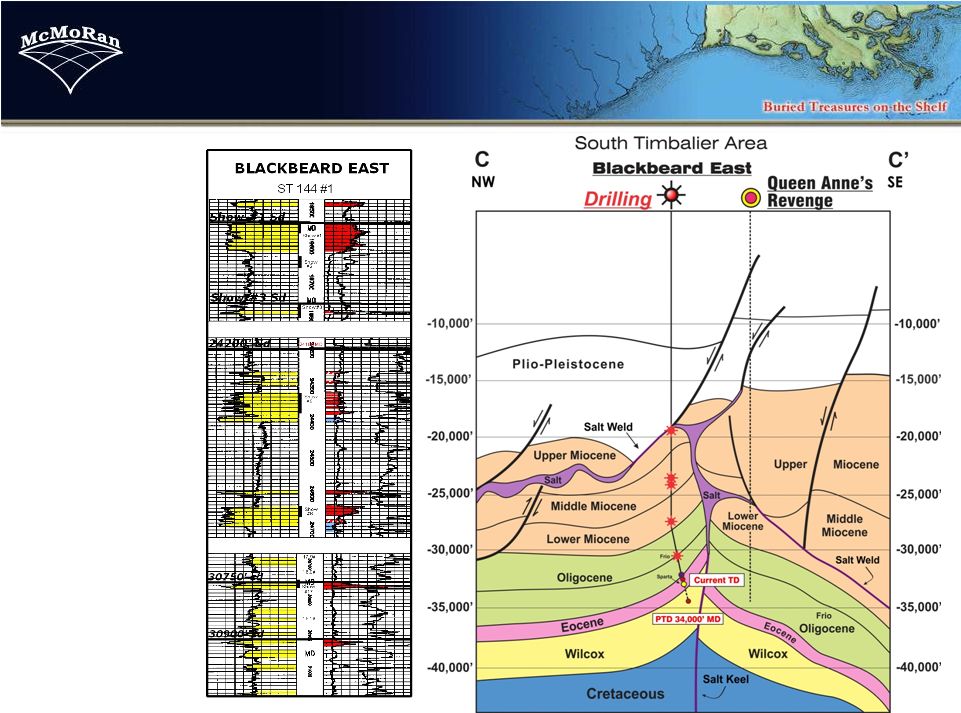 Blackbeard East
Cross Section 10
Upper Miocene
Middle Miocene
Frio |
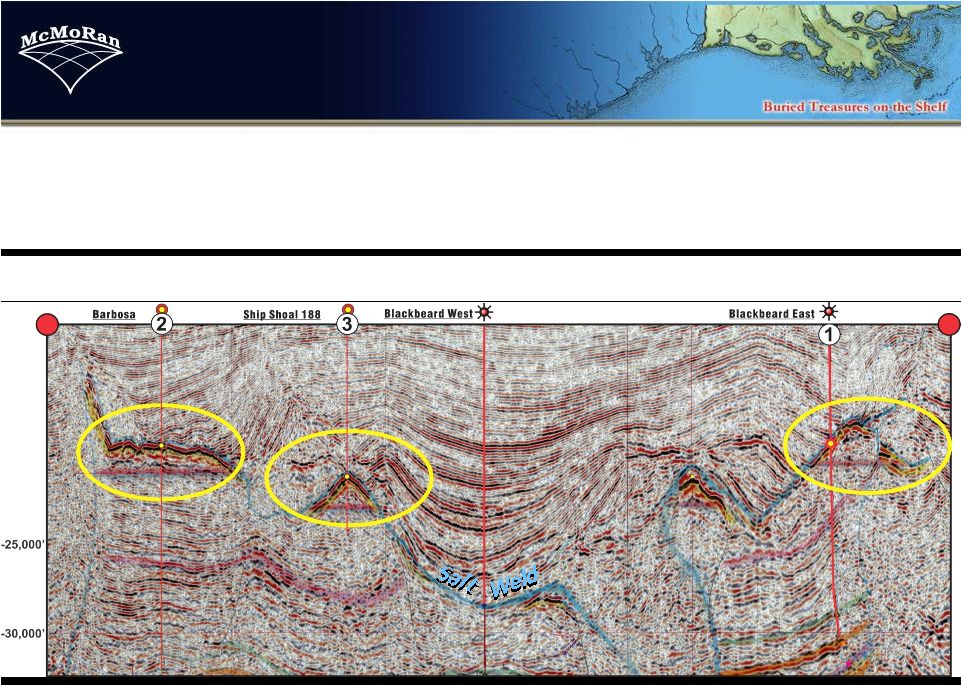 Other
Ultra-Deep Prospects with Similar Characteristics to Blackbeard
Other Ultra-Deep Prospects with
Similar Characteristics to Blackbeard
Velocity Anomaly Seen at Blackbeard East
May be Visible at Other Nearby Prospects
11
West
East
Velocity Anomalies
Below Salt Weld
Velocity Anomalies
Below Salt Weld
Drilling
Drilling |
 12
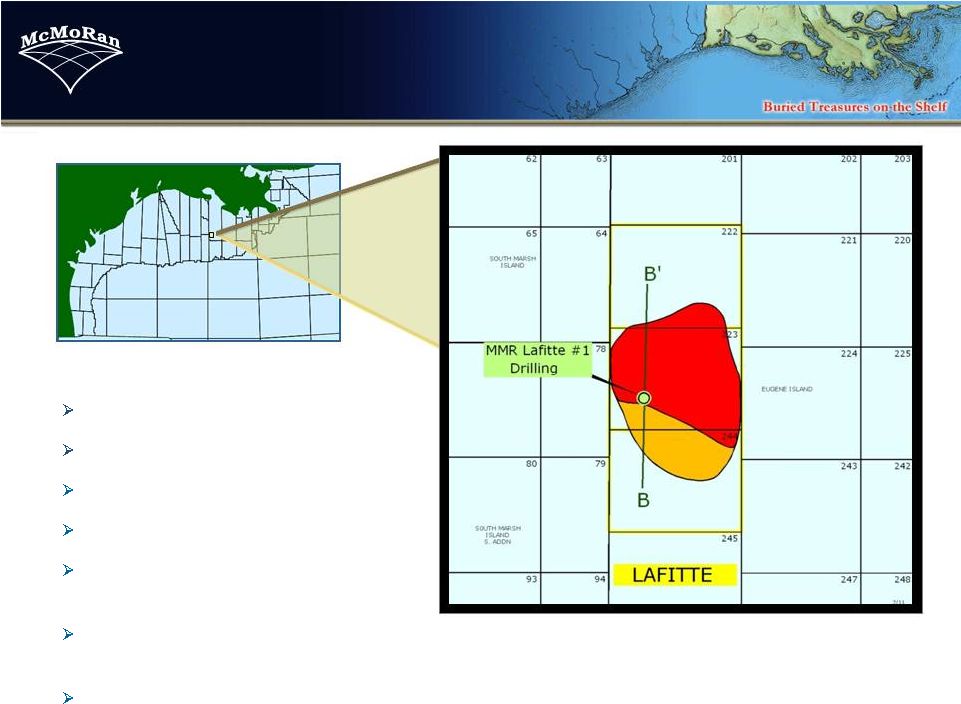
Lafitte
Ultra-Deep Exploration Prospect
Lafitte
Ultra-Deep Exploration Prospect
Located in 140 Feet of Water
MMR WI: 72.0%
MMR NRI: 58.3%
Spud Date: October 3, 2010
Drilling Below 30,600’
Identified 171’
Net Pay in Miocene,
Including 56’
in Cris-R
Deepening to Evaluate Oligocene
Targets Below the Salt Weld
PTD: 32,000’
Eugene Island Blocks 222/223/244 |
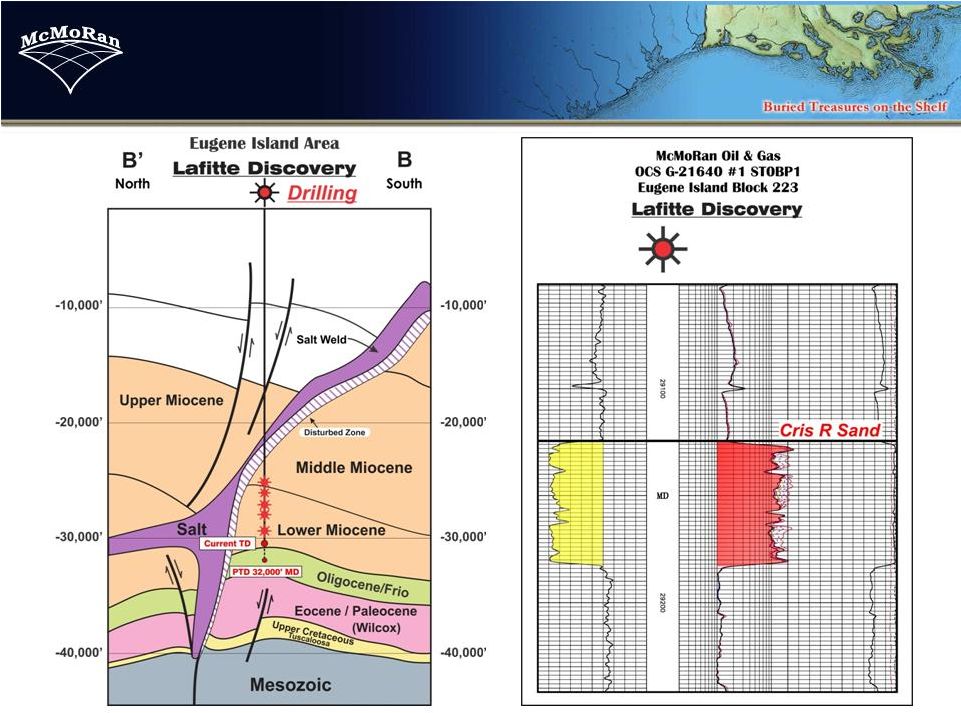 13
Lafitte Cross Section
Lafitte Cross Section |
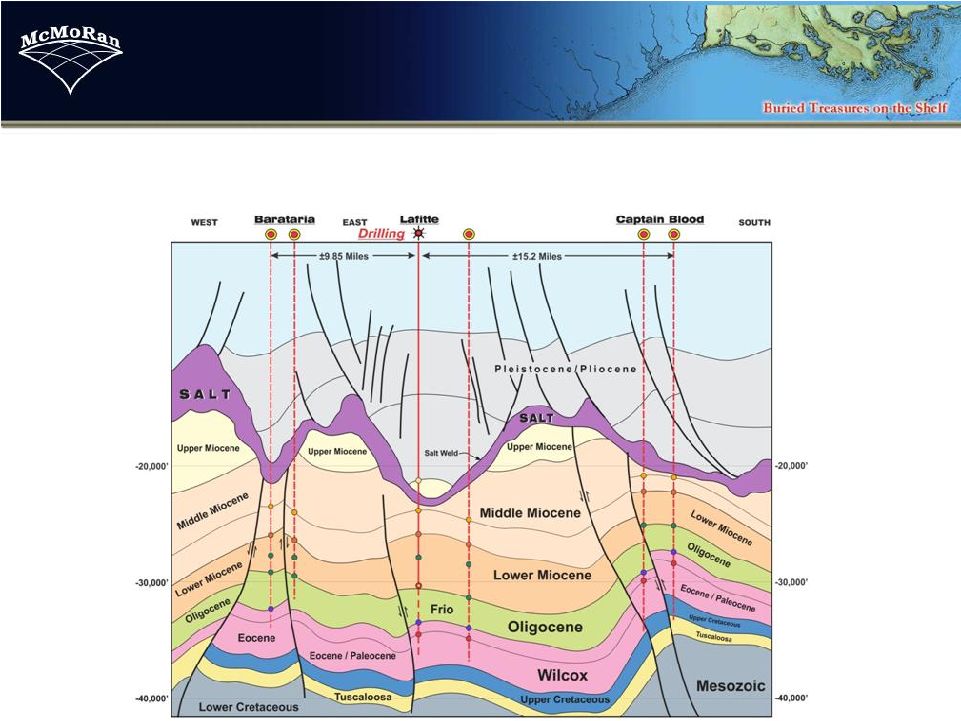 14
Lafitte/Barataria/Captain Blood
Cross Section
Lafitte/Barataria/Captain Blood
Cross Section
Presence of Sands at Lafitte, if Confirmed, Would Enhance the Prospectivity
of Barataria and Captain Blood, as They are All One Complex. |
 15
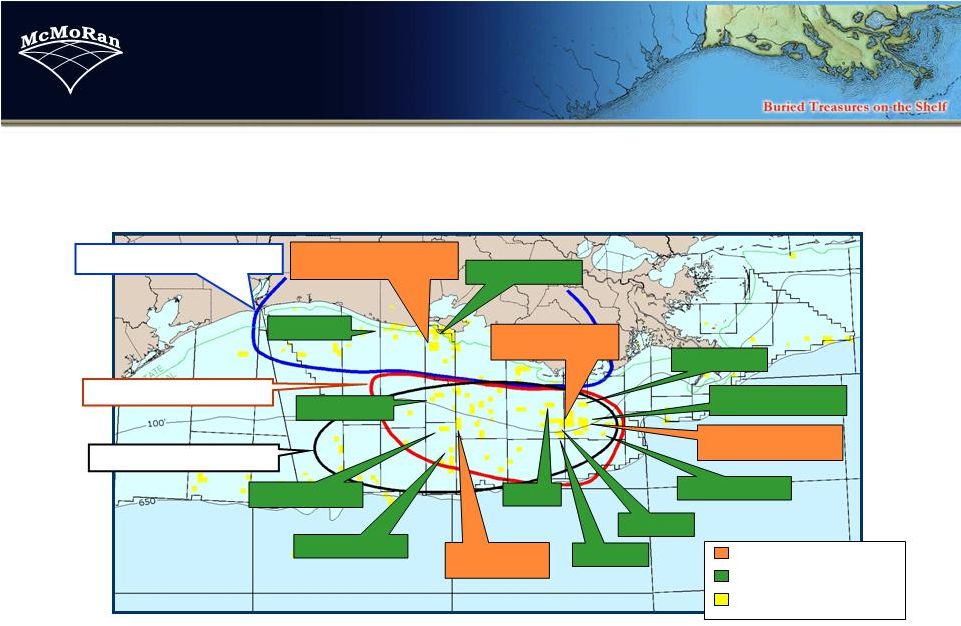
Ultra-Deep Prospects/Potential
Ultra-Deep Prospects/Potential
BONNET
ENGLAND
DRAKE
HOOK
CAPTAIN BLOOD
BARATARIA
CALICO JACK
DAVY JONES
(#1 completion under way)
JOHN PAUL JONES
BLACKBEARD EAST
(in progress)
BLACKBEARD WEST
(#2 in progress)
Unrisked Potential for Ultra-Deep Focus Area: 30+ Tcfe Gross, 14+ Tcfe Net*
Gross Unrisked Potential Could Exceed 100 Tcfe
____________________
Ultra-Deep Prospects
Ultra-Deep Discoveries
McMoRan Acreage
MMR Wilcox/Cretaceous Play
MMR Miocene/Wilcox Play
MMR Oligocene/Frio Play
BARBOSA
MORGAN
QUEEN ANNE’S
REVENGE
LAFITTE
(in progress)
* Assumes McMoRan has rights to 48% NRI; actual WI & NRI are pending unitization and
parties’ participation on a per prospect basis. NOTE: We use certain phrases and terms in this presentation, such as "gross and net
unrisked potential” and “resource potential” which the SEC's
guidelines prohibit us from including in filings with the SEC. See Cautionary Statement.
|
 16
Resource Potential Identified
to Date From Drilling Results
Resource Potential Identified
to Date From Drilling Results
Gross
Resource
MMR
Prospect
Sand Age
Potential
Share
Blackbeard West
Miocene
2.4
1.3
Oligocene
2.0
1.1
Blackbeard East
Miocene
0.8
0.4
Frio
0.5
0.3
Davy Jones #1 & #2
Wilcox
4.4
2.1
Tuscaloosa
1.6
0.8
Lower Cretaceous
0.7
0.3
Lafitte
Miocene
1.3
0.8
Barbosa
Miocene
2.0
1.2
TOTAL
15.7
8.3
(1)
A portion of this section on this prospect has not yet been drilled. 900 Bcfe of resource
potential based on cross correlation of velocity anomaly seen at Blackbeard East.
(2)
~1 Tcfe of resource potential based on cross correlation to Blackbeard East that has not yet
been drilled at Blackbeard West. (3)
Prospect has not yet been drilled. Resource potential based on cross correlation of velocity
anomaly seen at Blackbeard East. (Tcfe)
(Tcfe)
(1)
(2)
(3) |
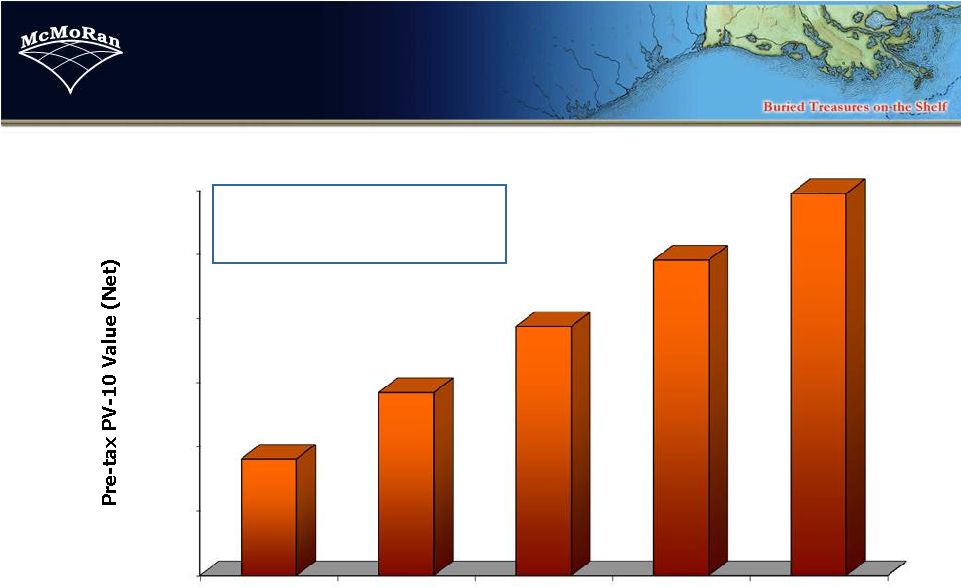 Ultra-Deep
Economic Model Value of Each 2 Tcfe Net (~4 Tcfe Gross)*
Ultra-Deep Economic Model
Value of Each 2 Tcfe Net (~4 Tcfe Gross)*
17
Price Case
($ in billions)
F&D Cost:
$1.50/Mcfe*
Breakeven Price:
~$2.50/Mcf
For 15% IRR
PV Value in Ground
$0.91/Mcf
$1.43/Mcf
$1.94/Mcf
$2.46/Mcf
$2.98/Mcf
$-
$1.0
$2.0
$3.0
$4.0
$5.0
$6.0
$4/Mcf
$5/Mcf
$6/Mcf
$7/Mcf
$8/Mcf
$1.8
$2.9
$3.9
$4.9
$6.0
____________________
* Assumes each well costs $200 mm to drill/complete and 200 Bcfe EUR per well.
Well cost could differ depending upon depths of targets, casing programs and other factors. First production
per well commences 18 months following spud date at initial production
rate of 70 Mmcfe/d. NOTE: These are model results presented for illustrative purposes
only. We use certain phrases and terms in this presentation, such as "gross and net unrisked potential" and “resource
potential” which the SEC's
guidelines prohibit us from including in filings with the SEC. See Cautionary Statement. |
 18
Conclusion
Conclusion
Substantial Value in Data Gained to Date
Multiple Near-term Catalysts Could Enhance Value
•
Drilling Results
•
Flow Testing
Opportunities to Unlock Additional Value from
Acreage/Prospect Inventory |