Attached files
| file | filename |
|---|---|
| 8-K - 8-K - FIFTH THIRD BANCORP | d265908d8k.htm |
 ©
Fifth Third Bank | All Rights Reserved
Exhibit 99.1
Goldman Sachs
U.S. Financial Services Conference
Kevin T. Kabat
President & Chief Executive Officer
December 7, 2011
Please refer to earnings release dated October 20, 2011 and
10-Q dated November 9, 2011 for further information
|
 2
©
Fifth Third Bank | All Rights Reserved
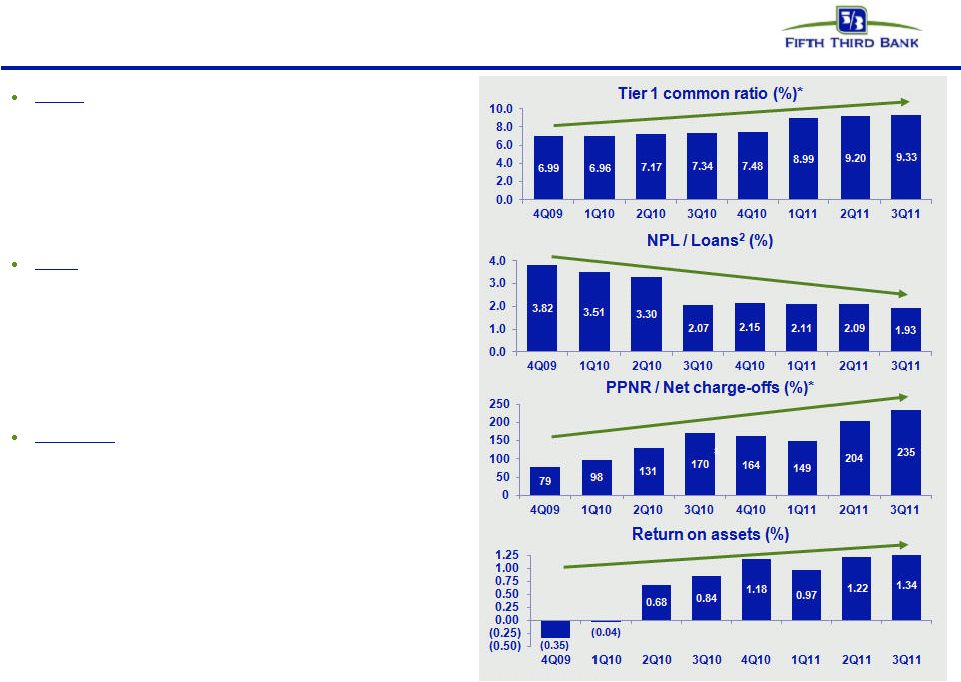
Strong levels of
profitability
Broad-based
credit
improvements
Exceed fully
phased-in Basel
III capital
standards today
All crisis-era
government
support
programs exited;
no TLGP
No significant
business at Fifth
Third impaired by
crisis
Continued
investments to
maintain and
enhance
revenue-
generation
Disciplined
expense control
Traditional
banking focus
consistent with
direction of
financial reform
Well-positioned for success and leadership in new banking landscape
Key themes |
 3
©
Fifth Third Bank | All Rights Reserved
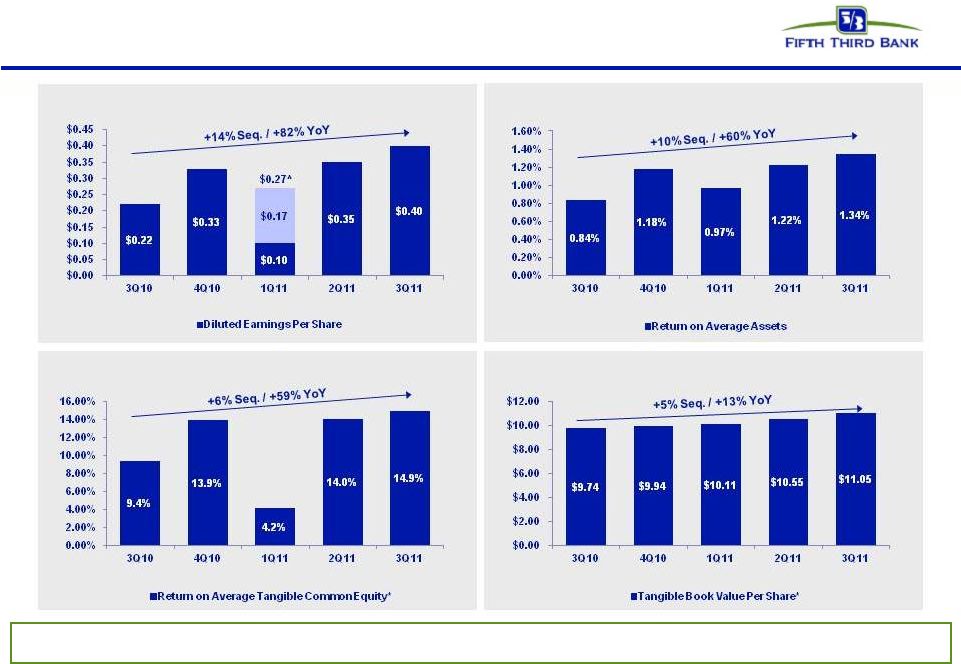
Strong levels of profitability
Diluted Earnings Per Share
Return on Average Assets
* Non-GAAP measure. See Reg. G reconciliation on pages 28-30.
^ Reflects $0.17 per diluted share impact of discount accretion on TARP preferred
stock Tangible Book Value Per Share*
Continued strong operating results
Return on Average Tangible Common Equity* |
 4
©
Fifth Third Bank | All Rights Reserved
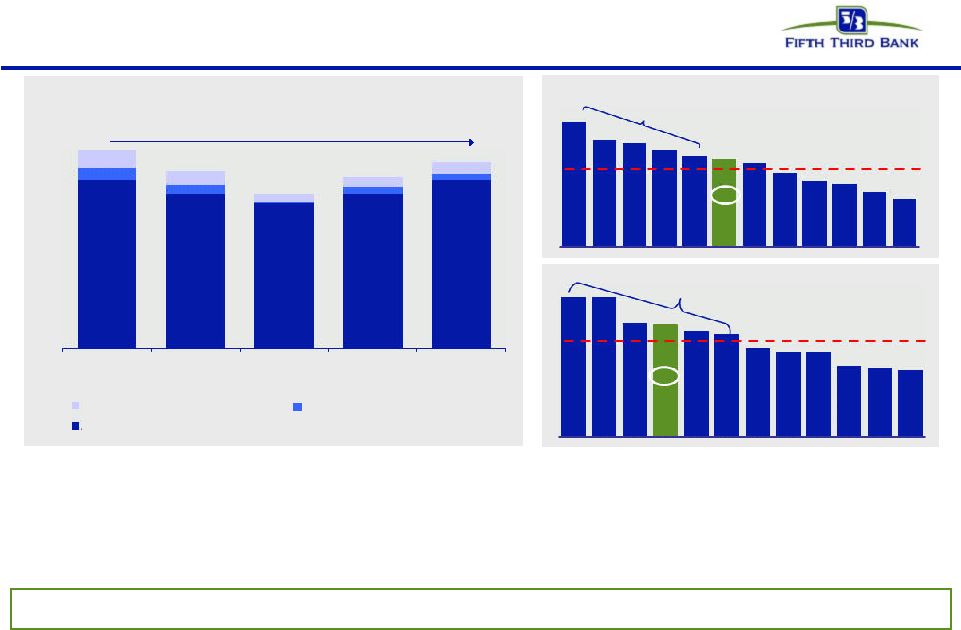
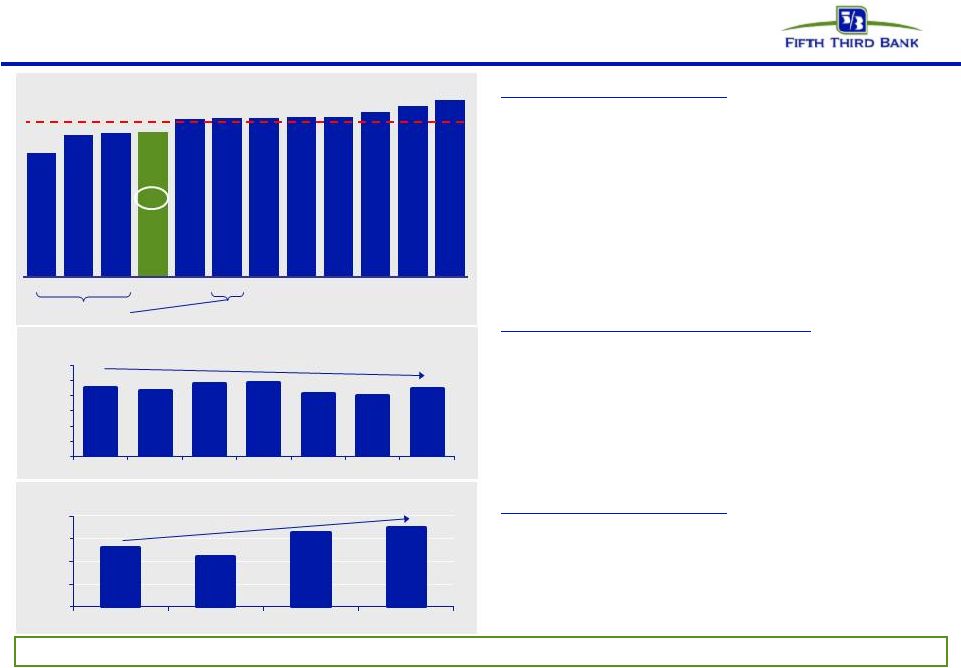
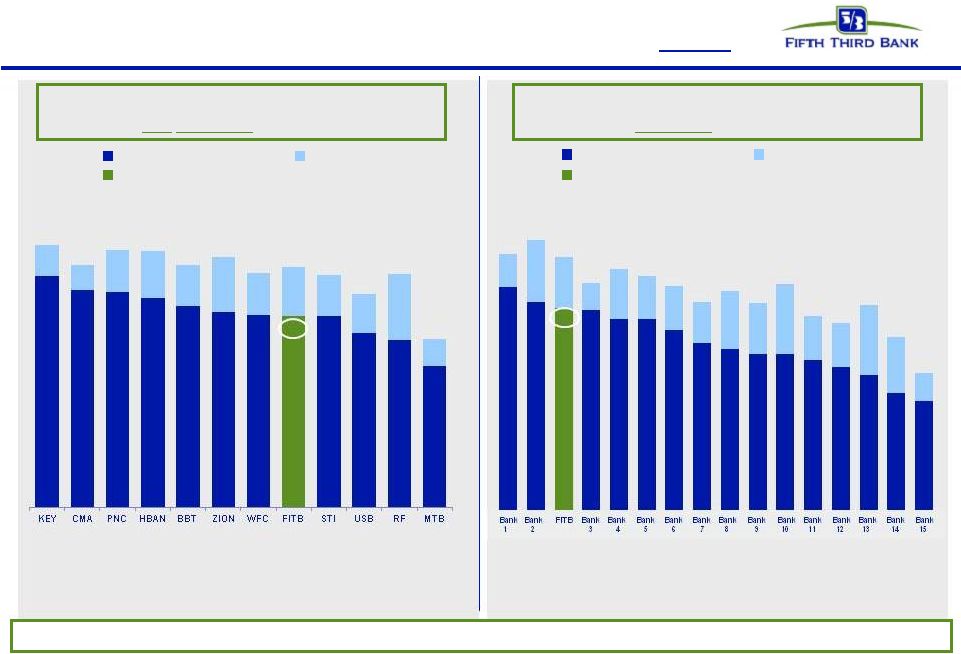
Strong pre-provision net revenue*
PPNR* trend
•
PPNR* of $617mm flat from 2Q11 reflecting strong mortgage banking results
•
PPNR* down 19% from 3Q10 driven by lower mortgage banking revenue, the 3Q10 net benefit from
the settlement of BOLI-related litigation, and improved credit costs
•
Adjusted PPNR* of $633mm, including positive adjustments totaling $16mm, up 9% sequentially and
flat year-over-year
Adjusted PPNR / Risk-weighted assets*
Adjusted PPNR / Total assets*
Robust pre-provision profitability = strong capacity to absorb losses and generate capital
PPNR (19%); Adjusted PPNR 0%; Credit-adjusted PPNR** (6%)
PPNR
$760 $583 $545
$619
$617 3Q10
4Q10
1Q11
2Q11
3Q11
Significant purchase
accounting benefit
Peer avg.: 1.9%
3.4%
3.0%
2.9%
2.7%
2.5%
2.4%
2.3%
2.0%
1.8%
1.8%
1.5%
1.3%
USB
WFC
BBT
CMA
PNC
FITB
RF
HBAN
STI
MTB
KEY
ZION
634
581
545
582
633
67
53
32
36
45
44
34
3
28
25
Adjusted PPNR
Fee Income Credit Items
Noninterest Expense Credit Items
Peer avg.: 1.9%
Significant purchase
accounting benefit
(ex-FITB)
2.7%
2.7%
2.2%
2.2%
2.1%
2.0%
1.7%
1.7%
1.6%
1.4%
1.3%
1.3%
USB
CMA
WFC
FITB
PNC
BBT
MTB
RF
HBAN
STI
ZION
KEY
Source: SNL Financial and company reports. Data as of 3Q11.
* Non-GAAP measure. See Reg. G reconciliation on pages 28-30.
** There are limitations on the usefulness of credit-adjusted PPNR, including the significant
degree to which changes in credit and fair value are integral, recurring components of the Bancorp’s core operations
as a financial institution. This measure has been included herein to facilitate a greater understanding
of the Bancorp’s financial condition. |
 5
©
Fifth Third Bank | All Rights Reserved
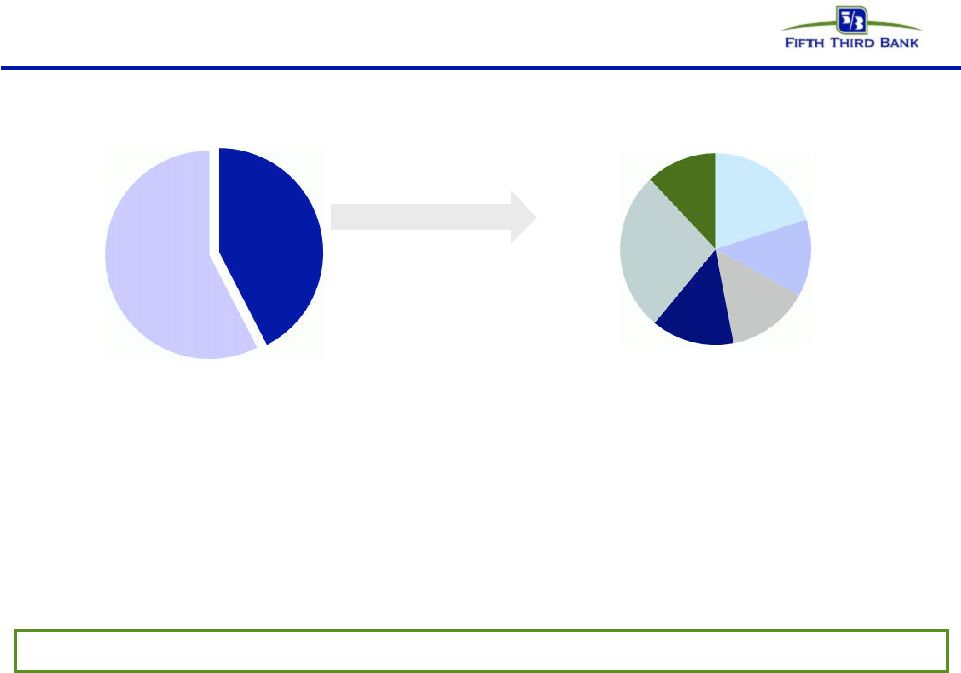
Diverse revenue stream
•
—
Current NII lower than normalized levels due to impact of low rate environment (e.g.
low cost deposits including DDAs providing little NII benefit)
•
Added clarity regarding effect of reform on deposit and interchange fees
—
Service charge impact from Reg E in run-rates
—
Initial $30 million per quarter impact of Durbin amendment expected to be mitigated
over time (~2/3 by mid-2012); will implement carefully and
deliberately 20% Deposit fees
13%
Corporate
banking
14%
Investment
advisors
14%
Other
27%
Mortgage
12%
42% Fee income
58%
NII
Fee income as % of 3Q11 revenue
3Q11 Fee income distribution
Revenue results remain solid, profitability strong despite sluggish economy
Business mix provides higher than average diversity among spread and fee revenues Card & Processing
|
 6
©
Fifth Third Bank | All Rights Reserved
Customer oriented solutions
Providing customers with products and services they find valuable
•
Reduce the cost associated with debit card offering
•
Changes and eliminations of reward programs
•
Selected fees
•
Incorporation of debit usage into bundled deposit product offerings
•
Implementation of new products
Multi-pronged mitigation approach
•
Conducted market research to determine what matters most to our
customers •
Received feedback from customer base and prospective customers
•
Listening to our customers
•
Broad
suite
of
product
offerings
with
distinct
value
propositions
to
appeal
to
various
customer
segments
•
Implementation of new products, like DUO Card
–
DUO Card introduced in 3Q11
–
Customer chooses to pay debit or credit at the point of sale
•
Letting customers choose how to pay for products and services they use
Working carefully to ensure we align value to the customer with value to us |
 7
©
Fifth Third Bank | All Rights Reserved
Disciplined expense control
Efficiency ratio*
Peer average: 65%
Sales / support ratio**
Efficient business model:
•
Efficiency ratio better than most peers through
weak economic environment
–
Reflects below-capacity balance sheet and
lower revenue than we expect and can
support longer term
–
Current impact of credit costs on revenue
and expenses
•
Expenses being managed carefully in response
to revenue environment
–
No net growth over past few years
–
Continuous process of expense evaluation
at Fifth Third
Investment for the future:
•
Sales to support ratio has increased through
careful management of back office and front
office staff
Managing expenses for current revenue environment and long-term franchise
value Noninterest expense trend ($mm)
(1%)
Significant purchase
accounting benefit
* Source: Company reports. Data as of 3Q11. Efficiency ratio calculated as reported
noninterest expense / (net interest income (fully taxable equivalent)+ noninterest income)
** Sales / support ratio calculated as Sales Headcount (full-time equivalent) /
Support Headcount (full-time equivalent) 52%
59%
60%
60%
66%
66%
66%
67%
67%
69%
71%
74%
USB
WFC
PNC
FITB
HBAN
BBT
RF
KEY
MTB
ZION
STI
CMA
$956
$935
$979
$987
$918
$901
$946
$500
$700
$900
$1,100
1Q10
2Q10
3Q10
4Q10
1Q11
2Q11
3Q11
100%
110%
120%
130%
140%
4Q08
4Q09
4Q10
3Q11
$1,000
$800
$600
Disciplined
expense
management |
 8
©
Fifth Third Bank | All Rights Reserved
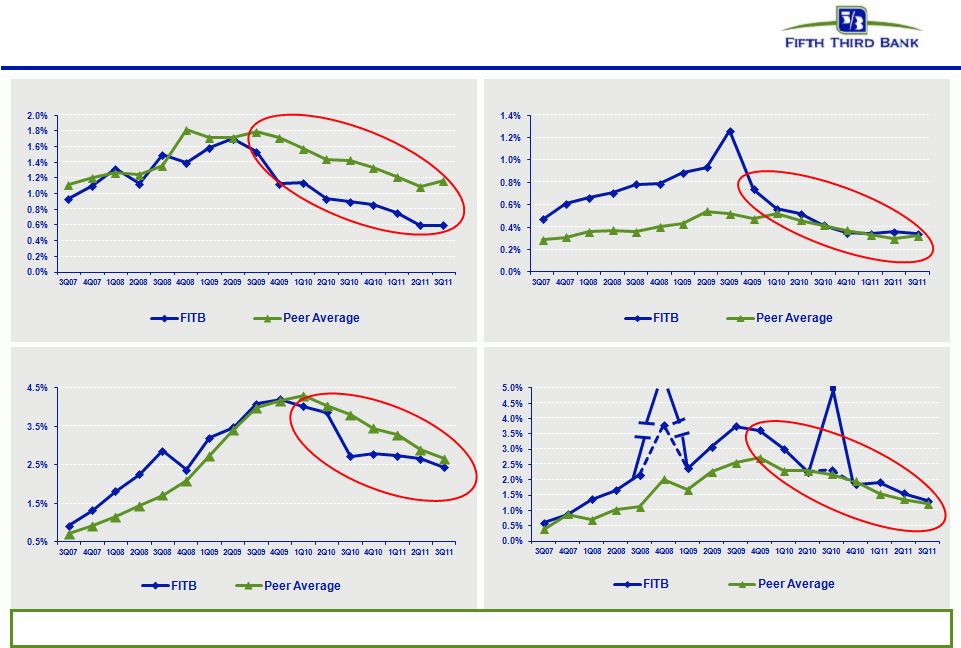
Broad-based credit improvements
FITB credit metrics are in line with or better than peers
NPA ratio vs. peers
Net charge-off ratio vs. peers
Loans 90+ days delinquent % vs. peers
Loans 30-89 days delinquent % vs. peers
(7.5%)*
(HFS transfer)
3.8%
Before credit
actions
5.0%*
2.3%
Before credit
actions
Peer average includes: BBT, CMA, HBAN, KEY, MTB, PNC, RF, STI, USB, WFC, and ZION
Source: SNL Financial and company filings. All ratios exclude loans held-for-sale and covered
assets for peers where appropriate. * 4Q08 NCOs included $800mm in NCOs related to commercial
loans moved to held-for-sale; 3Q10 NCOs included $510mm in NCOs related to loans sold or moved to held-for-sale |
 9
©
Fifth Third Bank | All Rights Reserved
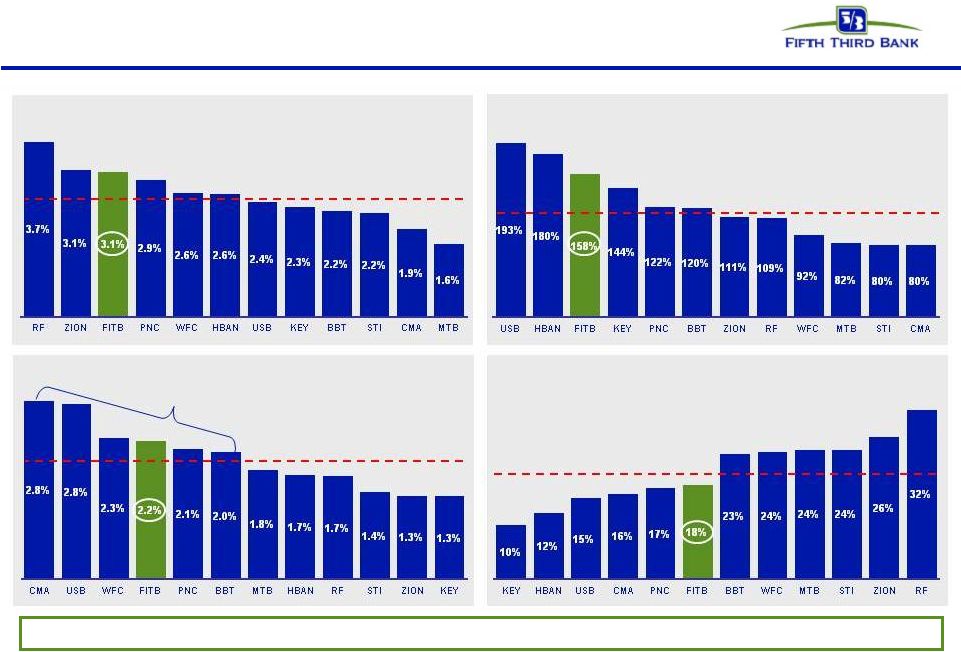
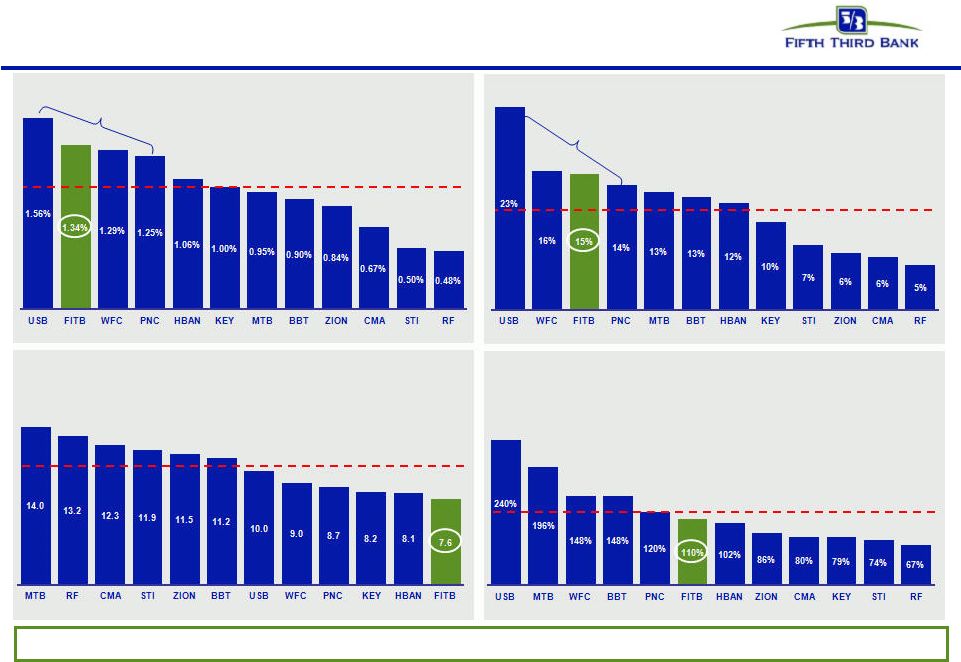
Strong credit coverage levels
Source: SNL Financial and company reports. Data as of 3Q11. HFI NPAs and NPLs
exclude loans held-for-sale and also exclude covered assets for BBT, USB, and ZION
* Non-GAAP measure. See Reg. G reconciliation on pages 28-30.
Reserves and capital levels significant in relation to problem assets
Adjusted PPNR (Annualized) / Average Assets*
Peer average: 1.9%
Reserves / NPLs
Peer average: 119%
“Texas Ratio”
(HFI NPAs + Over 90s) / (Reserves + TCE)*
Peer average: 20%
Reserves / Loans
Peer average: 2.5%
Significant purchase
accounting benefit
(ex-FITB) |
 10
©
Fifth Third Bank | All Rights Reserved
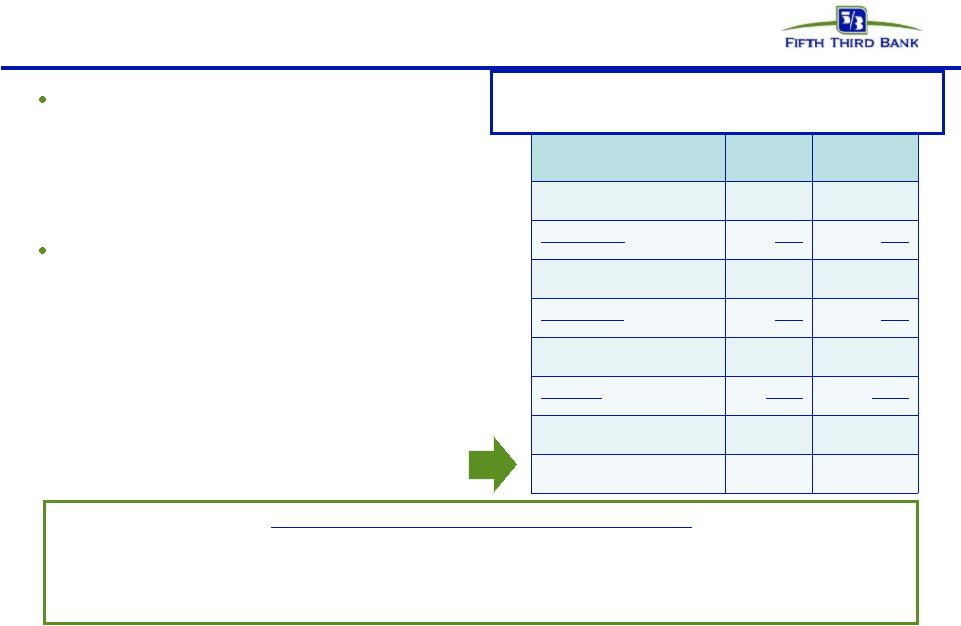
Expect ROAA upside longer-term
Third quarter ROA of 1.34% included
—
Provision expense / average loans
of 44 bps
—
$70mm of credit-related costs in
revenue and expense
Elevated credit costs should decline as
conditions normalize
—
Credit-related costs historically of
~$25mm (pre-credit crisis)
—
1997-2006 Average Provision /
Loans of ~50 bps (45 bps average
net charge-off ratio)
—
3Q11 results and historical average
credit results would produce an
ROAA of approximately 1.4%
Long-term target of 1.3 –
1.5% return on assets
Earning asset growth
Mid-50% efficiency ratio long-term
NIM of 3.5-4.0%
Provision of 40-60 bps
Fees / Revenue ~40%
Mitigation of financial reform
3Q11
Actual
3Q11
Illustrative*
PPNR ex-credit costs**^
$687
$687
Credit costs
(70)
(25)
PPNR**
617
662
Provision***
(87)
(99)
Pre-tax income
530
563
Taxes***
(149)
(169)
Net Income
381
394
ROAA
1.34%
1.38%
Illustrative ROA calculation using
historical NCO and credit-related costs*
* Not a projection
** Non-GAAP measure. See Reg. G reconciliation on pages 28-30.
*** Illustrative provision calculated using 50 bps historical average provision /
loan ratio; Illustrative taxes assumed effective tax rate of ~30% ^There are
limitations on the usefulness of PPNR excluding credit costs, including the significant degree to which changes in credit and fair value are integral, recurring components of the
Bancorp’s
core
operations
as
a
financial
institution.
This
measure
has
been
included
herein
to
facilitate
a
greater
understanding
of
the
Bancorp’s
financial
condition
Upper end of ROA target range assumes balance sheet growth and normalized rate
environment |
 11
©
Fifth Third Bank | All Rights Reserved
Exceed
fully
phased-in
Basel
III
capital
standards
today
Source: SNL Financial, company filings, and third-party estimates. Regulatory
financial data as of 3Q11. *
Peers
include
BAC,
BBT,
C,
CMA,
COF,
HBAN,
JPM,
KEY,
MTB,
PNC,
RF,
STI,
USB,
WFC, ZION
** Non-GAAP measure. See Reg. G reconciliation on pages 28-30.
Fifth Third’s capital position already well in excess of established standards,
likely standards, and most peers Tier 1 common (peers)
Tier 1 common (FITB)
Reserves
(Tier 1 common + reserves) / RWA**
(not
adjusted
for
Basel
III)
12.8%
11.8%
12.5%
11.8%
12.2%
12.5%
11.7%
11.3%
10.4%
11.4%
8.2%
11.4%
Peers* not in order of graph at left; estimated
(Tier 1 common + reserves) / RWA**
(adjusted
for
Basel
III)
Note:
Estimates
based
on
current
Basel
III
rules
released
by
the
Basel
Committee;
actual
rules subject to U.S. banking regulation. Assumes unrealized securities gains
included in Tier 1 common. Not adjusted for potential mitigation efforts.
Four large peers include estimated Basel III RWA impact based on BIS
proposals. Reserves
Tier 1 common (peers)
Tier 1 common (FITB)
9.8%
12.1%
11.3%
10.6%
10.5%
10.2%
9.8%
9.5%
9.4%
9.3%
9.3%
8.5%
8.2%
6.9% |
 12
©
Fifth Third Bank | All Rights Reserved
Capital management philosophy
Organic growth opportunities
•
Support growth of core banking franchise
•
Continued loan growth despite sluggish
economy
Return to more normal dividend policy
*
•
Strong levels of profitability would support
significantly higher dividend than current level
•
Incorporated higher dividends in 1Q11 CCAR**
submission
Strategic opportunities
*
•
Prudently expand franchise via disciplined
acquisitions or de novos, increasing density in
core markets
•
Expect future acquisition activity although less
likely in near-term
•
Attain top 3 market position in 65% of markets
or more longer term
Repurchases / Redemptions
*
•
Common shares:
—
Manage excess capital in light of regulatory
environment, other deployment alternatives,
maintenance of buffers over targeted / required
capital levels, and stock price
—
Not included in 1Q11 CCAR** submission
•
Trust preferred shares (TruPS):
—
Potential
redemption
of
certain
TruPS
included
in
1Q11
CCAR
**
submission
—
Have called $517mm due to regulatory capital
treatment event or on normal call dates
—
Will
evaluate
remaining
TruPS
in
context
of
regulatory developments and desired capital
structure given continued changes in regulations
Strong
internal
capital
generation;
current
long-term
Tier
1
common
equity
target
of
~8%
* Subject to Board of Directors and regulatory approval
** Comprehensive Capital Analysis and Review by Federal Reserve; proposed future capital actions
confidentially submitted |
 13
©
Fifth Third Bank | All Rights Reserved
As a $50B+ asset Bank Holding Company, Fifth Third is required to submit an annual capital
plan to the Federal Reserve
Capital plans and potential distributions evaluated in the context of:
–
Current, expected, and stressed capital levels
–
Under current U.S. rules under Basel III framework
–
Earnings power and other resources to absorb losses (i.e. reserves)
2012 Annual capital plan
2012 required capital plan submission timeline
–
Instructions
and
guidance
from
Federal
Reserve
received
November
22,
2011
–
FR Y-14Q schedules required by December 15, 2011
–
Comprehensive capital plan submission required by January 9, 2012
–
Federal Reserve response by March 15, 2012
Fifth Third believes it is well-positioned from a capital standpoint
–
Have managed capital using multi-scenario stress testing since early-mid
2008 –
Current capital levels under Basel III rules exceed all requirements as if rules
through 2019 fully phased-in today
–
Expect continued normalization of dividend payout ratio as well as initiation of
share repurchases to be
included
in
2012
plan
submission
in
order
to
prudently
manage
growth
of
excess
capital
levels
–
Do not currently expect significant changes in common equity ratios in CCAR plan for
2012 •
•
•
• |
 14
©
Fifth Third Bank | All Rights Reserved
Strong returns drive capital generation
# Non-GAAP measure. See Reg. G reconciliation on pages 28-30.
* 3Q11 annualized
Price as of 12/02/11
Well above average profitability and capital generation, well below average
valuation Price / Tangible Book Value
Peer average: 122%
Peer average: 11.4%
Significant purchase
accounting benefit
(ex-FITB)
Peer average: 1.0%
Price / Earnings*
Peer average: 10.7
Significant purchase
accounting benefit
(ex-FITB)
Return on Average Tangible Common Equity
*#
Return on Average Assets
* |
 15
©
Fifth Third Bank | All Rights Reserved
Well-positioned for the future
•
Holding company cash currently sufficient for more than 2 years of obligations;
minimal holding company or Bank debt maturities until 2013
•
Fifth Third has completely exited all crisis-era government support
programs Superior capital and liquidity position
•
NCOs of 1.3%; 2.4x reserves / annualized NCOs
•
$1.2B problem assets addressed through loan sales and transfer to HFS in 3Q10
•
Substantial reduction in exposure to CRE since 1Q09; relatively low CRE exposure
versus peers Proactive approach to risk management
•
Traditional commercial banking franchise built on customer-oriented localized
operating model •
Strong market share in key markets with focus on further improving density
•
Fee income ~40% of total revenues
Diversified traditional banking platform
•
PPNR^ has remained strong throughout the credit cycle
•
PPNR^ substantially exceeds annual net charge-offs (235% PPNR / NCOs^ in
3Q11) •
1.3% ROAA; 15% return on average tangible common equity^
Industry leader in earnings power
^ Non-GAAP measure. See Reg. G reconciliation on pages 28-30.
–
Fifth Third is one of the few large banks that have no TLGP-guaranteed debt to
refinance in 2012 |
 16
©
Fifth Third Bank | All Rights Reserved
Cautionary statement
This report contains statements that we believe are “forward-looking statements” within
the meaning of Section 27A of the Securities Act of 1933, as amended, and Rule 175 promulgated
thereunder, and Section 21E of the Securities Exchange Act of 1934, as amended, and Rule 3b-6 promulgated thereunder. These
statements relate to our financial condition, results of operations, plans, objectives, future
performance or business. They usually can be identified by the use of forward-looking
language such as “will likely result,” “may,” “are expected to,” “is anticipated,” “estimate,” “forecast,” “projected,” “intends to,” or may include other
similar words or phrases such as “believes,” “plans,” “trend,”
“objective,” “continue,” “remain,” or similar expressions, or future or conditional verbs such as “will,”
“would,” “should,” “could,” “might,” “can,” or
similar verbs. You should not place undue reliance on these statements, as they are subject to risks and uncertainties,
including but not limited to the risk factors set forth in our most recent Annual Report on Form
10-K. When considering these forward-looking statements, you should keep in mind these
risks and uncertainties, as well as any cautionary statements we may make. Moreover, you should treat these statements as speaking
only as of the date they are made and based only on information then actually known to us.
There are a number of important factors that could cause future results to differ materially
from historical performance and these forward-looking statements. Factors that might cause
such a difference include, but are not limited to: (1) general economic conditions and weakening in the economy, specifically the real
estate market, either nationally or in the states in which Fifth Third, one or more acquired entities
and/or the combined company do business, are less favorable than expected; (2) deteriorating
credit quality; (3) political developments, wars or other hostilities may disrupt or increase volatility in securities markets or other
economic conditions; (4) changes in the interest rate environment reduce interest margins; (5)
prepayment speeds, loan origination and sale volumes, charge-offs and loan loss provisions;
(6) Fifth Third’s ability to maintain required capital levels and adequate sources of funding and liquidity; (7) maintaining capital
requirements may limit Fifth Third’s operations and potential growth; (8) changes and trends in
capital markets; (9) problems encountered by larger or similar financial institutions may
adversely affect the banking industry and/or Fifth Third; (10) competitive pressures among depository institutions increase significantly;
(11) effects of critical accounting policies and judgments; (12) changes in accounting policies or
procedures as may be required by the Financial Accounting Standards Board (FASB) or other
regulatory agencies; (13) legislative or regulatory changes or actions, or significant litigation, adversely affect Fifth Third, one or
more acquired entities and/or the combined company or the businesses in which Fifth Third, one or more
acquired entities and/or the combined company are engaged, including the Dodd-Frank Wall
Street Reform and Consumer Protection Act; (14) ability to maintain favorable ratings from rating agencies; (15)
fluctuation of Fifth Third’s stock price; (16) ability to attract and retain key personnel; (17)
ability to receive dividends from its subsidiaries; (18) potentially dilutive effect of future
acquisitions on current shareholders’ ownership of Fifth Third; (19) effects of accounting or financial results of one or more acquired entities; (20)
difficulties in separating Vantiv, LLC, formerly Fifth Third Processing Solutions from Fifth Third;
(21) loss of income from any sale or potential sale of businesses that could have an adverse
effect on Fifth Third’s earnings and future growth; (22) ability to secure confidential information through the use of computer systems
and telecommunications networks; and (23) the impact of reputational risk created by these
developments on such matters as business generation and retention, funding and
liquidity. You should refer to our periodic and current reports filed with the
Securities and Exchange Commission, or “SEC,” for further information on other factors, which
could cause actual results to be significantly different from those expressed or implied by these
forward-looking statements. |
 17
©
Fifth Third Bank | All Rights Reserved
Appendix |
 18
©
Fifth Third Bank | All Rights Reserved
A foundation of continued robust results
Capital
–
exceeds required and targeted levels
—
Tier
1
common*
capital
up
~500bps
or
$4.6bn
from
4Q08
—
Capital base transformed through series of capital actions
–
~9.8% pro forma
Tier 1 common ratio* on a fully-phased in
Basel III-adjusted basis
—
Capital levels supplemented by strong reserve levels
–
Loan loss reserves 3.08% of loans and 158% of NPLs
Credit
–
ongoing steady improvement
—
Broad-based improvements in problem loans
–
72% reduction in 90+ day delinquent loans since 3Q09
–
NCO ratio of 1.32%, lowest level since 1Q08
–
235% PPNR / NCOs*
—
Balance sheet risk lowered through asset sales, resolutions
–
$1.4bn (48%) decline in NPLs since 4Q09
Profitability
–
strong relative and absolute results
—
PPNR* remained stable throughout cycle
—
6 consecutive profitable quarters
—
Return on assets 1.3%
—
Return
on
average
tangible
common
equity
*
15%
* Non-GAAP measure; see Reg. G reconciliation on pages 28-30.
1
Current estimate (non-GAAP), subject to final rule-making and clarification
by U.S. banking regulators; currently assumes unrealized securities gains
are included in common equity for purposes of this calculation
2
Nonperforming
loans
and
leases
as
a
percent
of
portfolio
loans,
leases
and
other
assets,
including other real estate owned (does not include nonaccrual loans
held-for-sale) 3
Excluding $510mm net charge-offs attributable to credit actions
3
1 |
 19
©
Fifth Third Bank | All Rights Reserved
Environment characterized by low growth
expectations and low interest rates
Potential lower growth and prolonged low-
rate environment
Lower securities reinvestment yields on
portfolio cash flows
Strong deposit flows
Competitive dynamics
Elevated mortgage refinance activity
Firms facing significant litigation related to:
—
Mortgage securitizations
—
GSE repurchases
—
Private label mortgage repurchases
Concerns about European banks and
sovereign debt
Higher capital standards and limitations on
distributions
Continued strong loan production
—
Rates on loan originations have remained
relatively stable
Careful management of liability costs
—
Disciplined pricing on deposits
—
Continued evaluation of term liabilities
including CDs and TruPS
Strong mortgage banking results
Mortgage risks manageable
—
Quarterly mortgage repurchase costs
~$20-25mm and claims inventory declining
—
Total mortgage securitizations outstanding
$28mm
(2003 HELOC) and performing well
No direct European sovereign exposure
—
Total exposure to European peripheral*
borrowers less than $0.2 billion
—
Gross exposure to European banks less than
$0.3 billion
Strong profitability and capital in excess of fully
phased-in
Basel
III
standards
today
* Greece, Ireland, Italy, Portugal, Spain
Fifth Third is well-positioned to deal with current environmental
challenges Characteristics
of
current
environment
Fifth Third’s response / position |
 20
©
Fifth Third Bank | All Rights Reserved
Traditional banking focus
consistent with direction of financial reform
Fifth Third’s business model is driven by traditional banking activities,
consistent with direction of financial reform
—
Dodd-Frank / Basel III do not require substantial changes to Fifth Third’s
business model or asset mix with attendant execution risk
—
Low level of financial system “interconnectedness”
–
International activity primarily related to trade finance and lending to U.S.
subsidiaries of foreign companies
–
(e.g.)
Fifth
Third
loss
in
Lehman
bankruptcy
expected
to
be
less
than
$2mm
—
Little to no impact from Volcker rule (de minimis market maker in derivatives,
proprietary trading)
–
Daily VaR ~$1mm or less
–
Small private equity portfolio ~$100mm
—
No originations of CDOs, securitizations on behalf of others
—
Didn’t originate or sell subprime mortgages or Option ARMs
—
No mortgage securitizations outstanding (except ~$28mm HELOC from 2003)
Business
profile
positions
Fifth
Third
well
–
today
and
in
the
future
•
No significant business at Fifth Third impaired during crisis
• |
 21
©
Fifth Third Bank | All Rights Reserved
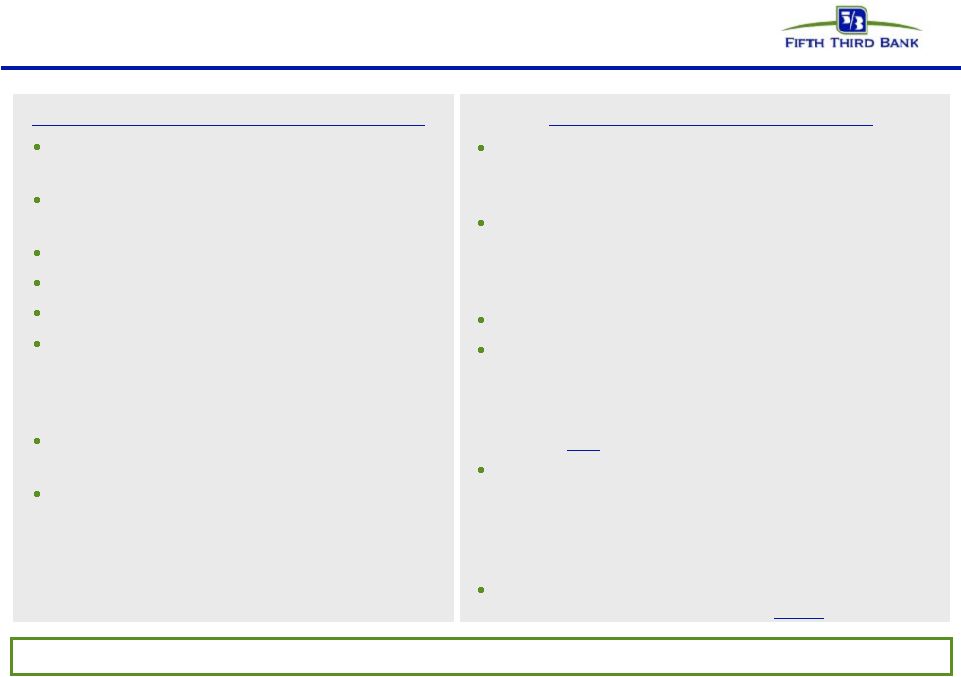
Net interest income
NII and NIM (FTE)
•
Sequential net interest income trends reflect:
–
Growth in C&I, residential mortgage, auto, and bankcard loan balances
–
Higher securities balances
–
Partially offset by lower yields on loans and securities
•
NII up $33mm from 2Q11, down $14mm from 3Q10; NIM +3 bps from 2Q11, -5 bps from
3Q10 •
Yield on interest-earning assets declined 9 bps sequentially and 29 bps
year-over-year –
Effect offset by lower liability costs, down 14 bps from 2Q11 and down 27 bps from
3Q10 –
Expect less asset yield compression and less liability rate improvement over next
year * Represents purchase accounting adjustments included in net interest
income. Selected Yield Analysis
3Q10
2Q11
3Q11
Seq.
(bps)
YoY
(bps)
Commercial and industrial loans
4.81%
4.35%
4.29%
(6)
(52)
Commercial mortgage loans
3.97%
4.00%
3.94%
(6)
(3)
Commercial construction loans
3.06%
3.01%
3.02%
1
(4)
Residential mortgage loans
4.81%
4.54%
4.47%
(7)
(34)
Home equity
3.99%
3.91%
3.89%
(2)
(10)
Automobile loans
5.71%
4.81%
4.52%
(29)
(119)
Credit card
10.70%
9.91%
9.49%
(42)
(121)
Total loans and leases
4.85%
4.54%
4.48%
(6)
(37)
Taxable securities
4.06%
3.97%
3.88%
(9)
(18)
Tax exempt securities
4.05%
6.41%
5.84%
(57)
179
Other short-term investments
0.36%
0.25%
0.25%
-
(11)
Total interest-earning assets
4.57%
4.37%
4.28%
(9)
(29)
Total interest-bearing liabilities
1.13%
1.00%
0.86%
(14)
(27)
Net interest rate spread (FTE)
3.44%
3.37%
3.42%
5
(2) |
 22and
interest-bearing liabilities
©
Fifth Third Bank | All Rights Reserved
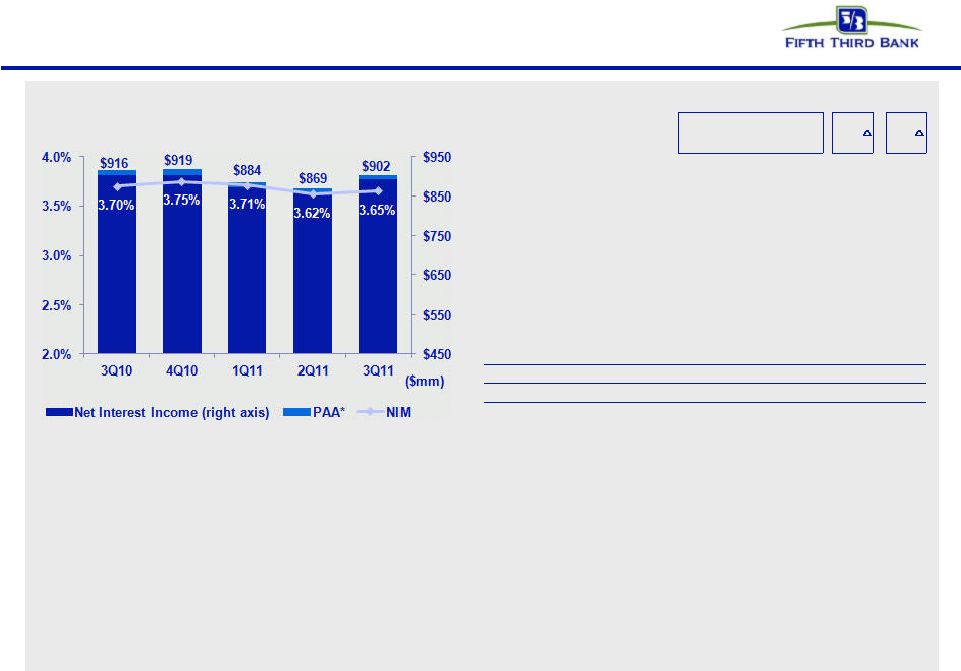
Core funded balance sheet and pricing discipline
•
Strong, deposit-rich core funding mix supports
relatively low cost of funds
–
Low reliance on wholesale funding
•
Run-off of high cost CDs (particularly from 2H08)
will benefit NII in 4Q11
–
Incremental $15mm in 4Q11 versus 3Q11
•
Pricing discipline on commercial loans
–
Spreads have narrowed from post-crisis levels
but remain attractive
–
Loan origination rates have stabilized the past
several months
SOURCE: SNL Financial and company reports. Data as of 3Q11
End of period transaction deposits defined as DDA, NOW and Savings/MMDA accounts;
Cost of Funds defined as interest incurred on interest-bearing liabilities as a percentage of average noninterest-bearing deposits
Transaction Deposits / Total Deposits
C&I Spread to 1-month LIBOR
Peer average
82%
Cost of Funds
Peer average
0.72% |
 ©
Fifth Third Bank | All Rights Reserved
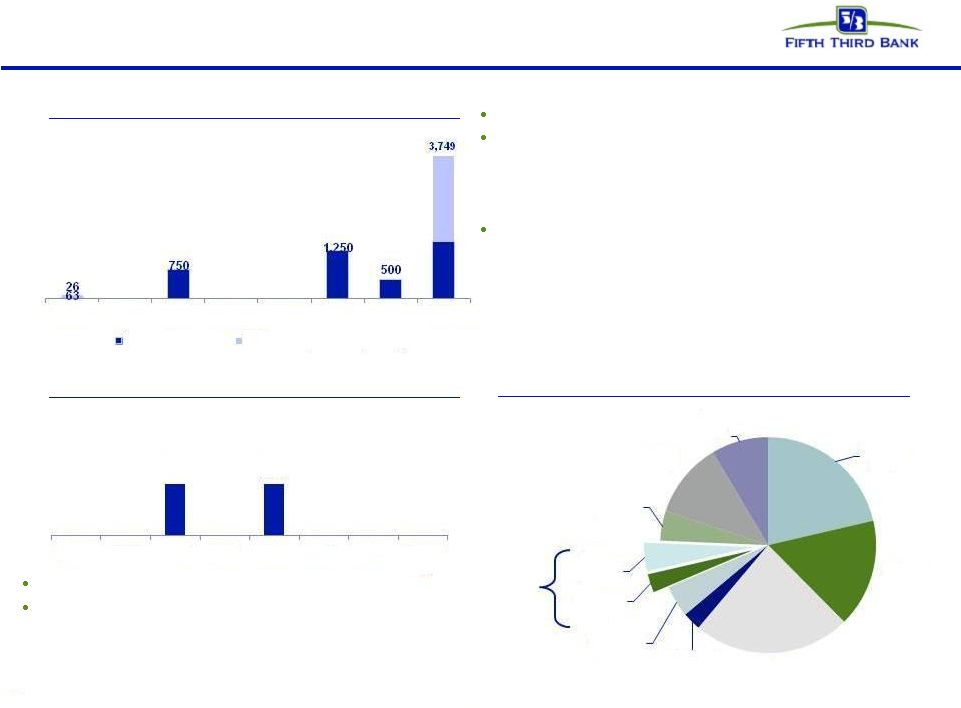
Liquidity levels elevated in 3Q11
As of 3Q11, readily available borrowing capacity at FHLB:
$6.3B; contingent borrowing capacity at the Fed: $21.2B
—
Executed $2.5B in three-month FHLB borrowings in July
as a precaution to supplement liquidity through the
discussion and resolution of the U.S. debt ceiling limit
Holding Company cash at 9/30/11: $2.1B
Cash currently sufficient to satisfy all fixed obligations
for more than 2 years (debt maturities, common and
preferred dividends, interest and other expenses)
without accessing capital markets; relying on dividends
from subsidiaries; proceeds from asset sales
Expected cash obligations over the next 12 months
—
$25mm debt maturities
—
~$300mm common dividends
—
~$35mm Series G preferred dividends
—
~$459mm interest and other expenses
Holding company unsecured debt maturities ($mm)
Bank
unsecured
debt
maturities
($mm
–
excl.
Brokered
CDs)
Heavily core funded
Strong liquidity profile
S-T
wholesale
7%
23
Demand
21%
Interest
checking
16%
Savings/
MMDA
24%
Foreign office
3%
Consumer
time
5%
Non-core
deposits
3%
S
-T
borrowings
4%
Other
liabilities
4%
Equity
11%
L-T debt
9%
2011
2012
2013
2014
2015
2016
2017
2018 on
Fifth Third Bancorp
Fifth Third Capital Trust (Bancorp)
$500
$500
2011
2012
2013
2014
2015
2016
2017
2018
on |
 24
©
Fifth Third Bank | All Rights Reserved
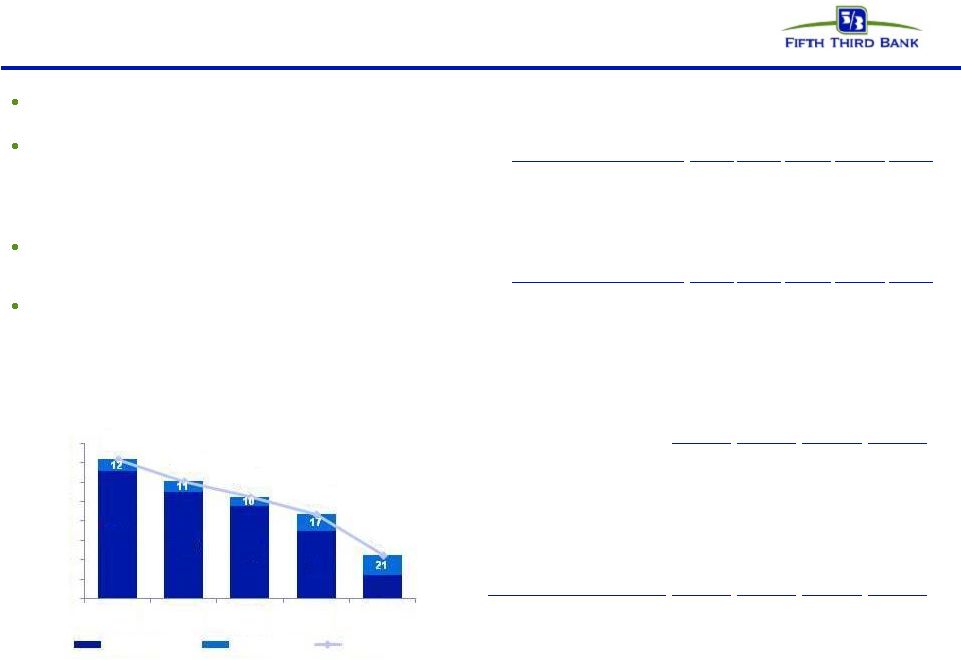
Mortgage repurchase overview
33% drop in 3Q11 outstanding claims balance driven by
high number of resolutions in quarter
Virtually all sold loans and the majority of new claims
relate to agencies
—
98% of outstanding balance of loans sold
—
Three-quarters
of
current
quarter
outstanding
claims
Majority of outstanding balances of the serviced for
others portfolio relates to origination activity in 2009
and later
Private claims and exposure relate to whole loan sales
(no outstanding first mortgage securitizations)
—
Preponderance of private sales prior to 2006
Repurchase Reserves* ($ in millions)
Outstanding Counterparty Claims ($ in millions)
Outstanding Balance of Sold Loans ($ in millions)
3Q10
4Q10
1Q11
2Q11
3Q11
Beginning balance
85
103
101
87
80
Net reserve additions
47
21
10
15
20
Repurchase losses
(29)
(23)
(23)
(22)
(31)
Ending balance
103
101
87
80
69
2005 and prior
GSE
GNMA
Private
Total
$7,838
$301
$578
$8,717
2006
1,791
64
277
2,132
2007
2,911
95
239
3,244
2008
2,975
729
0.3
3,704
2009 and later
29,971
8,718
1
38,690
Total
$45,485
$9,907
$1,096
$56,488
*
$184
$161
$145
$127
$85
$40
$60
$80
$100
$120
$140
$160
$180
$200
3Q10
4Q10
1Q11
2Q11
3Q11
Agencies
Private
Claims
172
150
135
110
64
Includes reps and warranty reserve ($52mm) and reserve for loans sold with recourse ($17mm) |
 25
©
Fifth Third Bank | All Rights Reserved
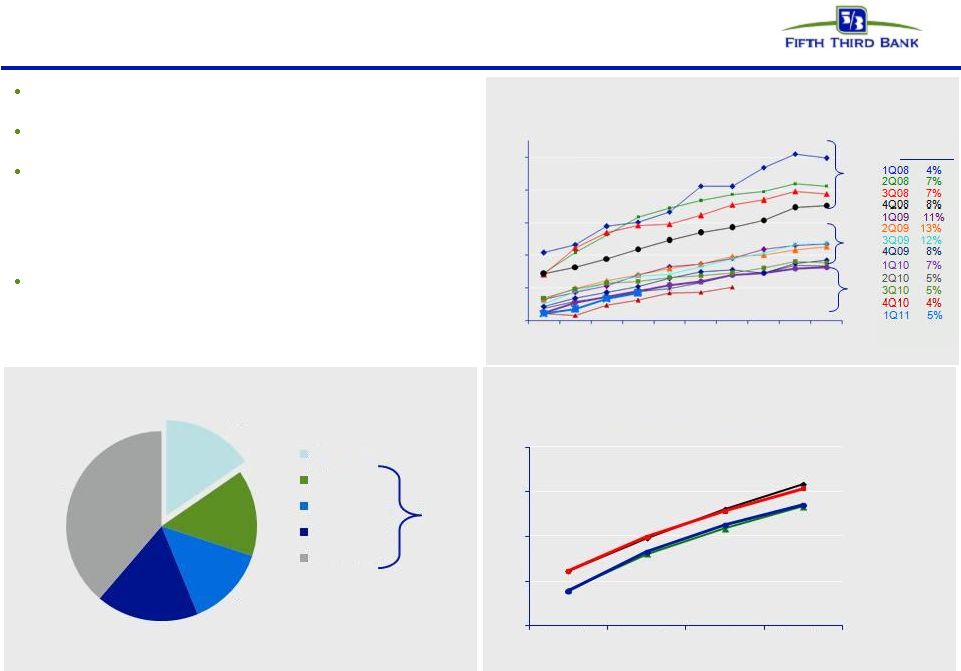
Troubled debt restructurings overview
Successive improvement in vintage performance during
2008 and 2009 as volume of modification increased
Fifth Third’s mortgage portfolio TDRs have redefaulted
at a lower rate than GSE composites
Of $1.8B in consumer TDRs, $1.6B were on accrual
status and $215mm were nonaccruals
—
$1.1B of TDRs are current and have been on the
books 6 or more months; within that, nearly
$940mm of TDRs are current and have been on
the books for more than a year
As current TDRs season, their default propensity
declines significantly
—
We see much lower defaults on current loans after
a vintage approaches 12 months since
modification
TDR performance has improved in newer vintages
Outperforming redefault benchmarks
Source: Fifth Third and OCC/OTS data through 1Q11
Mortgage TDR 60+ redefault trend by vintage*
Months since modification
Mortgage TDR 60+ redefault rate: Fifth Third comparison
(January 1, 2008 through June 2011)*
Fannie Mae
Industry
portfolio loans
Fifth Third
Volume by
vintage
Freddie Mac
$1.3B current consumer TDRs (%)
* Fifth Third data includes changes made to align with OCC/OTS methodology (i.e.
excludes government loans, closed loans and OREO from calculations)
2008
2009
2010
3
4
5
6
7
8
9
10
11
12
50%
0%
10%
40%
30%
20%
15%
15%
14%
17%
39%
< 6 months
6
-12 months
12-18 months
18-24 months
24+ months
$1.1
billion
0%
10%
20%
30%
40%
3 months
6 months
9 months
12 months |
 26
©
Fifth Third Bank | All Rights Reserved
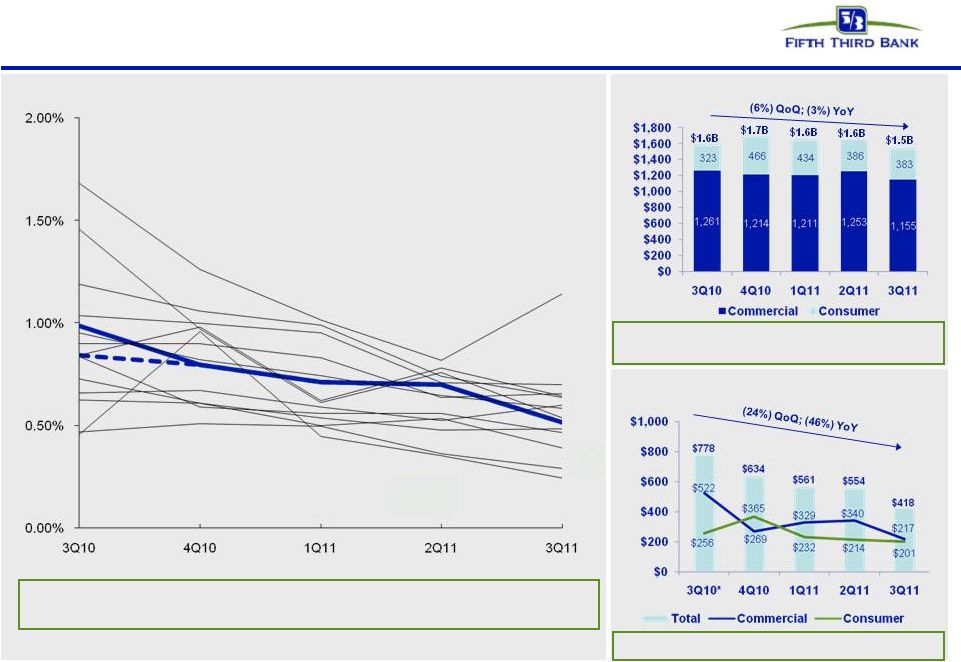
Non-performing loans
* 3Q10 inflows into NPLs HFS were $217mm, reflecting performing loans moved to
held-for-sale in 3Q10 that were deemed impaired as a result of the decision to sell these loans.
Prior period NPL inflows restated to reflect additional detail and with transfers to
nonaccrual status presented to reflect gross inflows and charge-offs. See
slide 27 for more information. Non-performing loans ($mm)
Non-performing loans improving with lower
severity mix; benefit of sales/transfers
Fifth Third’s non-performing loan inflows (relative to loans) have been
proportionally lower than peers
FITB NPL inflows (relative to loans) vs. peers
Source: SNL Financial and company filings. Peers include: BAC, BBT, C, CMA, HBAN,
JPM, KEY, MTB, PNC, RF, STI, USB, and WFC New HFI non-performing loan
flows ($mm) NPL inflows down significantly
FITB
FITB
ex-HFS |
 27
©
Fifth Third Bank | All Rights Reserved
NPL HFI Rollforward
Commercial
3Q10
4Q10
1Q11
2Q11
3Q11
Beginning NPL Amount
1,980
1,261
1,214
1,211
1,253
Transfers to nonperforming
522
269
329
340
217
Transfers to performing
(21)
(2)
(2)
(10)
(11)
Transfers to performing (restructured)
(10)
-
-
-
(1)
Transfers to held for sale
(342)
-
(16)
(15)
(58)
Loans sold from portfolio
(5)
(9)
(12)
(7)
(17)
Loan paydowns/payoffs
(153)
(111)
(108)
(91)
(77)
Transfer to other real estate owned
(92)
(48)
(37)
(39)
(20)
Charge-offs
(627)
(170)
(164)
(141)
(136)
Draws/other extensions of credit
9
24
7
5
5
Ending Commercial NPL
1,261
1,214
1,211
1,253
1,155
Consumer
3Q10
4Q10
1Q11
2Q11
3Q11
Beginning NPL Amount
549
323
466
434
386
Transfers to nonperforming
256
365
232
214
201
Transfers to performing
(45)
(36)
(35)
(34)
(33)
Transfers to performing (restructured)
(29)
(25)
(50)
(41)
(39)
Transfers to held for sale
(205)
-
-
-
-
Loans sold from portfolio
-
-
(1)
(21)
-
Loan paydowns/payoffs
(37)
(17)
(18)
(27)
(27)
Transfer to other real estate owned
(50)
(20)
(18)
(15)
(16)
Charge-offs
(118)
(130)
(144)
(126)
(91)
Draws/other extensions of credit
2
4
2
2
2
Ending Consumer NPL
323
466
434
386
383
Total NPL
1,584
1,680
1,645
1,639
1,538
Total new nonaccrual loans - HFI
778
634
561
554
418
NPL rollforward
Significant improvement in NPL inflows over past year
Prior period NPL inflows restated to reflect additional detail and with transfers
to nonaccrual status presented to reflect gross inflows and charge-offs. |
 28
©
Fifth Third Bank | All Rights Reserved
Regulation G Non-GAAP reconciliation
$ in millions
(unaudited)
For the Three Months Ended
September
June
March
December
September
June
March
December
2011
2011
2011
2010
2010
2010
2010
2009
Pre-tax Pre-provision Net Revenue:
Income before income taxes (a)
$ 530
$
506
$ 377
$
417
$ 303
$
242
$
(22) $
(214) Provision expense (b)
87
113
168
166
457
325
590
776
Pre-tax, pre-provision net revenue (PPNR) (a) + (b)
617
619
545
583
760
567
568
562
Annualized PPNR (c)
2,448
2,483
2,210
2,313
3,015
2,274
2,304
2,230
Adjustments remove (benefit) / detriment
Securities (gains) / losses
(26)
(6)
(8)
(21)
(4)
(8)
(14)
(2)
Gain on BOLI settlement
-
-
-
-
(127)
-
-
-
Valuation of 2009 Visa total return swap
17
4
9
5
-
-
9
-
Vantiv, LLC warrants & puts
(3)
(29)
2
(3)
5
(10)
2
(20)
Termination of certain borrowings & hedging
transactions
28
-
-
-
-
-
-
-
Other litigation reserve expense
-
-
-
-
-
3
4
22
Extinguishment (gains) / losses
-
(6)
(3)
17
-
-
-
-
Adjusted PPNR (k)
633
582
545
581
634
552
569
562
Annualized Adjusted PPNR (d)
2,511
2,334
2,210
2,305
2,515
2,214
2,308
2,230
Credit-related items in noninterest income
Gain / (loss) on sale of loans
3
8
17
21
(1)
25
8
8
Commercial loans HFS FV adjustment
(6)
(9)
(16)
(35)
(9)
(9)
(17)
(30)
Gain / (loss) on sale of OREO properties
(21)
(26)
(2)
(19)
(29)
(16)
(21)
(22)
Mortgage repurchase costs
(2)
(0)
(2)
(1)
(4)
-
(2)
-
Total credit-related revenue impact (i)
25
28
3
34
44
1
31
45
Credit-related items in noninterest expense
Mortgage repurchase expense
19
14
8
20
45
39
17
11
Provision for unfunded commitments
(10)
(14)
(16)
(4)
(23)
9
11
44
Derivative valuation adjustments
4
1
(0)
(1)
8
8
(2)
21
OREO expense
7
6
13
11
9
6
9
6
Other problem asset related expenses
25
30
28
27
28
29
37
29
Total credit-related operating expenses (j)
45
36
32
53
67
91
73
111
Credit-adjusted PPNR (k) + (i) + (j)
703
646
580
668
745
643
673
717
PPNR excluding credit costs (a) + (b) + (i) + (j)
687
683
580
670
871
658
672
717
Financial & Asset Quality Metrics:
Risk-weighted assets (e)
$ 102,562
$ 100,320
$ 99,392
$ 100,561
$ 98,904
$ 97,888
$ 99,220
$ 100,862
Net charge-offs
262
304
367
356
956
434
582
708
Annualized net charge-offs (f)
1,039
1,219
1,488
1,412
3,793
1,741
2,360
2,809
Total assets (g)
114,905
110,805
110,485
111,007
112,322
112,025
112,651
113,380
Average assets (h)
113,295
111,200
110,844
111,858
111,854
112,613
113,433
111,505
Ratios:
PPNR / RWA (c) / (e)
2.4%
2.5%
2.2%
2.3%
3.0%
2.3%
2.3%
2.2%
PPNR / NCO (c) / (f)
235%
204%
149%
164%
79%
131%
98%
79%
PPNR / Total assets (c) / (g)
2.1%
2.2%
2.0%
2.1%
2.7%
2.0%
2.0%
2.0%
PPNR / Average assets (c) / (h)
2.2%
2.2%
2.0%
2.1%
2.7%
2.0%
2.0%
2.0%
Adjusted PPNR / RWA (d) / (e)
2.4%
2.3%
2.2%
2.3%
2.5%
2.3%
2.3%
2.2%
Adjusted PPNR / NCO (d) / (f)
242%
191%
149%
163%
66%
127%
98%
79%
Adjusted PPNR / Total assets (d) / (g)
2.2%
2.1%
2.0%
2.1%
2.2%
2.0%
2.0%
2.0%
Adjusted PPNR / Average assets (d) / (h)
2.2%
2.1%
2.0%
2.1%
2.2%
2.0%
2.0%
2.0% |
 29
©
Fifth Third Bank | All Rights Reserved
Regulation G Non-GAAP reconciliation
$ and shares in millions
(unaudited)
For the Three Months Ended
September
June
March
December
September
2011
2011
2011
2010
2010
Net income available to common shareholders (U.S. GAAP)
$
373
$
328
$
88
$
270
$
175 Add:
Intangible amortization, net of tax
3
4
5
7
7
Tangible net income available to common shareholders
376
332
93
277
182
Tangible net income available to common shareholders (annualized) (a)
1,492
1,332
377
1,099
722
Average Bancorp shareholders' equity (U.S. GAAP)
12,841
12,365
13,052
14,007
13,852
Less:
Average preferred stock
398
398
1,557
3,648
3,637
Average goodwill
2,417
2,417
2,417
2,417
2,417
Average intangible assets
47
52
59
67
78
Average tangible common equity (b)
9,979
9,498
9,019
7,875
7,720
Total Bancorp shareholders' equity (U.S. GAAP)
13,029
12,572
12,163
14,051
13,884
Less:
Preferred stock
(398)
(398)
(398)
(3,654)
(3,642)
Goodwill
(2,417)
(2,417)
(2,417)
(2,417)
(2,417)
Intangible assets
(45)
(49)
(55)
(62)
(72)
Tangible common equity, including unrealized gains / losses (c)
10,169
9,708
9,293
7,918
7,753
Less: Accumulated other comprehensive income / loss
(542)
(396)
(263)
(314)
(432)
Tangible common equity, excluding unrealized gains / losses (d)
9,627
9,312
9,030
7,604
7,321
Total assets (U.S. GAAP)
114,905
110,805
110,485
111,007
112,322
Less:
Goodwill
(2,417)
(2,417)
(2,417)
(2,417)
(2,417)
Intangible assets
(45)
(49)
(55)
(62)
(72)
Tangible assets, including unrealized gains / losses (e)
112,443
108,339
108,013
108,528
109,833
Less: Accumulated other comprehensive income / loss, before tax
(834)
(609)
(405)
(483)
(665)
Tangible assets, excluding unrealized gains / losses (f)
111,609
107,730
107,608
108,045
109,168
Common shares outstanding (g)
920
920
919
796
796
Total nonperforming assets, excluding held-for-sale (h)
1,944
Total ninety days past due loans and leases (i)
274
Allowance for loan and lease losses (j)
2,439
Ratios:
Return on average tangible common equity (a) / (b)
14.9%
14.0%
4.2%
13.9%
9.4%
Tangible
common
equity
(excluding
unrealized
gains/losses)
(d)
/
(f)
8.63%
8.64%
8.39%
7.04%
6.70%
Tangible
common
equity
(including
unrealized
gains/losses)
(c)
/
(e)
9.04%
8.96%
8.60%
7.30%
7.06%
Tangible book value per share (c) / (g)
11.05
10.55
10.11
9.94
9.74
"Texas Ratio" (HFI NPAs + Over 90s) / (Reserves + TCE) ((h) + (i)) / ((c) +
(j)) 18% |
 30
©
Fifth Third Bank | All Rights Reserved
Regulation G Non-GAAP reconciliation
$ in millions
(unaudited)
For the Three Months Ended
September
June
March
December
September
2011
2011
2011
2010
2010
Total Bancorp shareholders' equity (U.S. GAAP)
$ 13,029
$ 12,572
$ 12,163
$ 14,051
$ 13,884
Goodwill and certain other intangibles
(2,514)
(2,536)
(2,546)
(2,546)
(2,525)
Unrealized gains
(542)
(396)
(263)
(314)
(432)
Qualifying trust preferred securities
2,273
2,312
2,763
2,763
2,763
Other
20
20
12
11
8
Tier I capital
12,266
11,972
12,129
13,965
13,698
Less:
Preferred stock
(398)
(398)
(398)
(3,654)
(3,642)
Qualifying trust preferred securities
(2,273)
(2,312)
(2,763)
(2,763)
(2,763)
Qualifying noncontrolling interest in consolidated subsidiaries
(30)
(30)
(30)
(30)
(30)
Tier I common equity (a)
9,565
9,232
8,938
7,518
7,263
Unrealized gains
542
Disallowed deferred tax assets
-
Disallowed MSRs
64
Other
10
Less:
10% of individual deferred tax assets, MSRs, investment in financial entities
-
15% of aggregate deferred tax assets, MSRs, investment in financial entities
-
Tier 1 common equity, Basel III pro forma (b)
10,181
Risk-weighted assets, determined in accordance with
prescribed regulatory requirements (c)
$ 102,562
$ 100,320
$ 99,392
$ 100,561
$ 98,904
Add:
Regulatory deductions not deducted from Tier 1 common equity,
risk-weighted at 250%
1,377
Risk-weighted assets, Basel III proforma (d)
103,939
Allowance for loan and lease losses (e)
$ 2,439
Ratios:
Tier I common equity (a) / (c)
9.33%
9.20%
8.99%
7.48%
7.34%
Tier I common equity, Basel III proforma (b) / (d)
9.80%
Tier I common + reserves / RWA ((a) + (e)) / (c)
11.70%
Tier I common + reserves / RWA, Basel III pro forma ((b) + (e)) / (d)
12.14% |