Attached files
| file | filename |
|---|---|
| 8-K - JOINT FORM 8-K - KANSAS CITY POWER & LIGHT CO | f8kirdeck12-7_11.htm |

December 2011 Investor Presentation
Great Plains Energy
Investor Presentation
December 2011
Exhibit 99.1

December 2011 Investor Presentation
2
Statements made in this presentation that are not based on historical facts are forward-looking, may involve risks and
uncertainties, and are intended to be as of the date when made. Forward-looking statements include, but are not limited to,
the outcome of regulatory proceedings, cost estimates of capital projects and other matters affecting future operations. In
connection with the safe harbor provisions of the Private Securities Litigation Reform Act of 1995, Great Plains Energy and
KCP&L are providing a number of important factors that could cause actual results to differ materially from the provided
forward-looking information. These important factors include: future economic conditions in regional, national and
international markets and their effects on sales, prices and costs, including but not limited to possible further deterioration in
economic conditions and the timing and extent of economic recovery; prices and availability of electricity in regional and
national wholesale markets; market perception of the energy industry, Great Plains Energy and KCP&L; changes in business
strategy, operations or development plans; effects of current or proposed state and federal legislative and regulatory actions
or developments, including, but not limited to, deregulation, re-regulation and restructuring of the electric utility industry;
decisions of regulators regarding rates the companies can charge for electricity; adverse changes in applicable laws,
regulations, rules, principles or practices governing tax, accounting and environmental matters including, but not limited to,
air and water quality; financial market conditions and performance including, but not limited to, changes in interest rates
and credit spreads and in availability and cost of capital and the effects on nuclear decommissioning trust and pension plan
assets and costs; impairments of long-lived assets or goodwill; credit ratings; inflation rates; effectiveness of risk
management policies and procedures and the ability of counterparties to satisfy their contractual commitments; impact of
terrorist acts, including but not limited to cyber terrorism; ability to carry out marketing and sales plans; weather conditions
including, but not limited to, weather-related damage and their effects on sales, prices and costs; cost, availability, quality
and deliverability of fuel; the inherent uncertainties in estimating the effects of weather, economic conditions and other
factors on customer consumption and financial results; ability to achieve generation goals and the occurrence and duration
of planned and unplanned generation outages; delays in the anticipated in-service dates and cost increases of additional
generation, transmission, distribution or other projects; the inherent risks associated with the ownership and operation of a
nuclear facility including, but not limited to, environmental, health, safety, regulatory and financial risks; workforce risks,
including, but not limited to, increased costs of retirement, health care and other benefits; and other risks and uncertainties.
This list of factors is not all-inclusive because it is not possible to predict all factors. Other risk factors are detailed from time
to time in Great Plains Energy’s and KCP&L’s quarterly reports on Form 10-Q and annual report on Form 10-K filed with the
Securities and Exchange Commission. Each forward-looking statement speaks only as of the date of the particular
statement. Great Plains Energy and KCP&L undertake no obligation to publicly update or revise any forward-looking
statement, whether as a result of new information, future events or otherwise.
Forward-Looking Statement

December 2011 Investor Presentation
3
Overview
December 2011 Investor Presentation
4
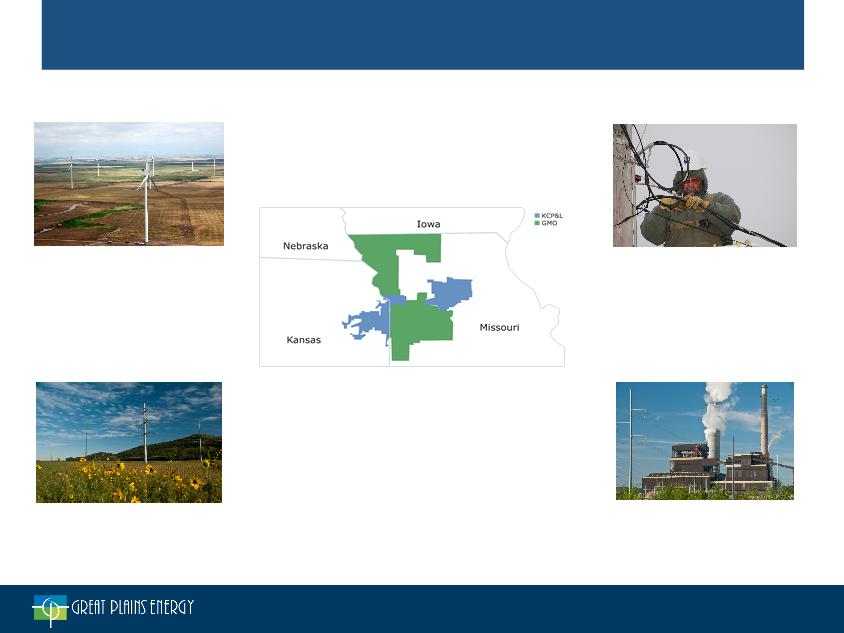
• Solid Midwest electric utility operating under the KCP&L brand
• Transformational events in 2008 to focus business model on fully
regulated utility operations
regulated utility operations
– Sale of Strategic Energy
– Acquisition of Aquila (now KCP&L Greater Missouri Operations
Company, or “GMO”)
Company, or “GMO”)
• Company attributes
– ~824,000 customers / 3,000 employees
– ~6,600 MW of primarily low-cost coal baseload generation
– 5-year projected synergies post-GMO acquisition of ~$757M
– ~$8.8bn in assets at 2010YE
– ~$5.6bn in rate base
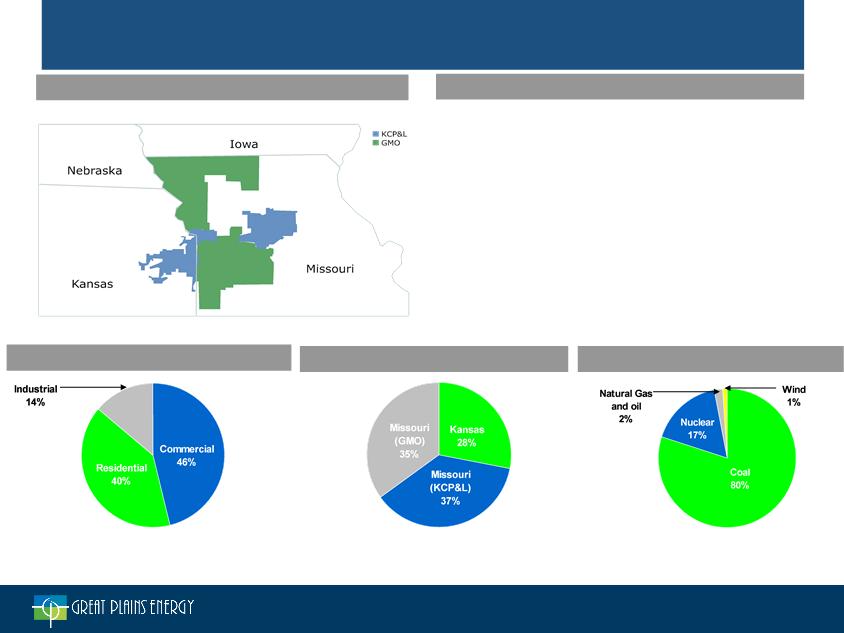
Service Territories: KCP&L and GMO
Business Highlights
2010 Retail MWh Sold by Customer Type
2010 Retail MWh Sales by Jurisdiction
2010 MWh Generated by Fuel Type
Total: ~ 23,806 MWhs*
Total: ~ 23,806 MWhs*
Total: ~ 26,679 MWhs*
Solid Vertically-Integrated Midwest Utility
* In thousands
December 2011 Investor Presentation
5
5
2005 - 2,382
2010 - 3,188
INCREASE = 34%
2005 - 500,000
2010 - 823,200
INCREASE = 65%
2005 - 14,400
2010 - 25,600
2010 - 25,600
INCREASE = 78%
2005 - 2,788 MW
2010 - 4,345 MW
INCREASE = 56%
2005 - $2.12 Billion
2010 - $5.59 Billion
INCREASE = 164%
GXP’s Transformation: 2005 - Present
Rate Base
Utility Employees
Customers
T&D Route-Miles
Base Load Generation
December 2011 Investor Presentation
6
|
Leading Industries
(Employees in 000’s)
|
|
|
State & Local Government
|
124.8
|
|
Full and Limited-Service Restaurants
|
63.3
|
|
General Medical & Surgical Hospitals / Offices of
Physicians |
46.7
|
|
Federal Government
|
29.1
|
|
Employment Services
|
20.6
|
|
Depository Credit Intermediation
|
16.3
|
|
Grocery Stores
|
16.2
|
|
Department Stores
|
15.5
|
|
Computer Systems Design and Related Srvcs
|
15.2
|
|
Management of Companies and Enterprises
|
15.2
|
KC Metropolitan Area Economy - Snapshot
|
Top 10 Employers
(# of Employees)
|
|
|
HCA Midwest Health System
|
8,127
|
|
Wal-Mart Stores, Inc.
|
7,400
|
|
Sprint Corporation
|
7,300
|
|
St. Luke’s Health System
|
6,622
|
|
McDonald’s USA LLC
|
5,700
|
|
Cerner Corporation
|
4,980
|
|
Children’s Mercy Hospital & Clinics
|
4,812
|
|
DST Systems, Inc.
|
4,425
|
|
Truman Medical Center
|
4,081
|
|
University of Kansas Hospital
|
3,880
|
• The Kansas City metro area economy is represented by a diverse set of
industries, supported by a sizeable presence in the governmental sector
industries, supported by a sizeable presence in the governmental sector
Strengths
• Diversified economy
• Stability from governmental sector
• Well-developed transportation &
distribution network
distribution network
• Central national location
• Low cost of living/business
Weaknesses
• Increased competition from other
Midwest business centers
Midwest business centers
• High dependence on Sprint Nextel
and telecom
and telecom
• Suburban sprawl
• Low employment growth
Opportunities
• New Ford product lines create local
jobs
jobs
• Google ultra-high speed fiber
network supports tech economy
network supports tech economy
• Kansas wind power attracts clean-
energy firms
energy firms
Source: The Kansas City Business Journal, BLS and Moody’s Analytics
Source for Listed Attributes: Moody’s Analytics

December 2011 Investor Presentation
7
Recent Developments and
September 30, 2011 Year-to-Date
Operating & Financial Update
December 2011 Investor Presentation
8
• KCC order stated that the decision to retrofit LaCygne 1 and 2 was
reasonable, reliable, efficient and prudent and the cost estimate is
reasonable
reasonable, reliable, efficient and prudent and the cost estimate is
reasonable
• Total project cost estimate, excluding AFUDC and property tax, of $1.23
billion; KCP&L’s total share is $615 million and Kansas jurisdictional share is
$281 million
billion; KCP&L’s total share is $615 million and Kansas jurisdictional share is
$281 million
• Requested environmental rider denied
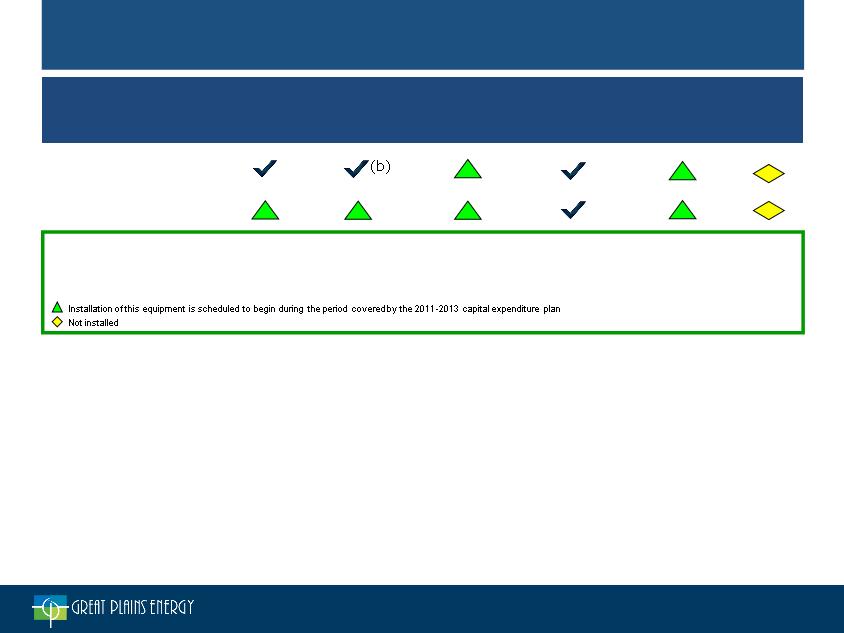
LaCygne Environmental Retrofit
Kansas Predetermination
|
Coal Unit
|
MW
|
SCR
|
Scrubber
|
Baghouse
|
Other
Particulate
Control
|
Mercury
Controls |
Cooling
Tower |
|
LaCygne 1
|
368(a)
|
|
|
|
|
|
|
|
LaCygne 2
|
341(a)
|
|
|
|
|
|
|
(a) KCP&L’s share of jointly-owned facility
(b) LaCygne 1 currently has a scrubber installed; however, 2011-13 capital expenditure plan includes the installation of a new scrubber on the unit
(c) Existing scrubber removes particulate matter but will be replaced by the baghouse
(d) Existing precipitator will be replaced by the baghouse
ü Installed
(c)
(d)
December 2011 Investor Presentation
9
• Air permits have been obtained
• Entered into a firm fixed Engineering, Procurement and Construction Services
(EPC) contract
(EPC) contract
• Construction of new duel flue chimney expected to begin 1Q 2012
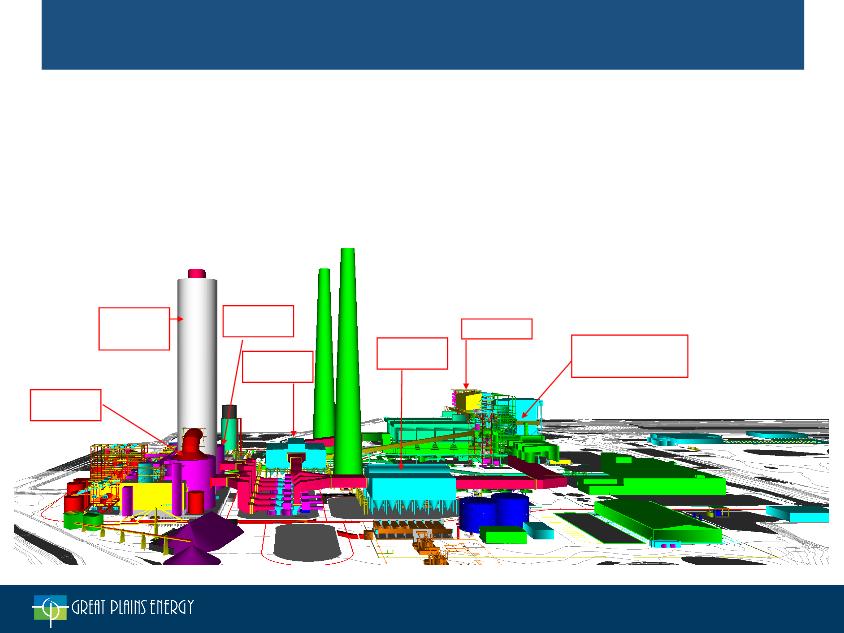
LaCygne Environmental Retrofit
Construction Update
Construction Update
New Duel
Flue
Chimney
Flue
Chimney
Unit 1 Wet
Scrubber
Scrubber
Unit 2 Wet
Scrubber
Scrubber
Unit 1
Baghouse
Baghouse
Unit 2 SCR
Low NOx Burners
and Overfire Air
System
and Overfire Air
System
Unit 2
Baghouse
Baghouse
Artist’s rendering of the LaCygne Generating Station Environmental Retrofit Project. Actual scale and location may vary.
December 2011 Investor Presentation
10
Collaboration
Agreement with
Sierra Club
Agreement with
Sierra Club
Renewable
Portfolio
Standards - KS
and MO
Portfolio
Standards - KS
and MO
Future Renewable
Requirements
Requirements
• 2007 Agreement
• KCP&L pledged to add 100 MW of wind (beyond
initial 100.5 MW at Spearville) by end of 2010
and 300 MW by end of 2012, subject to
regulatory approval
initial 100.5 MW at Spearville) by end of 2010
and 300 MW by end of 2012, subject to
regulatory approval
• 48 MW built in 2010 and 52 MW of RECs
purchased for 2010 applied to 2010
commitment; 48 MW and recent 131 MW PPA
apply toward 2012 commitment
purchased for 2010 applied to 2010
commitment; 48 MW and recent 131 MW PPA
apply toward 2012 commitment
• In November 2011, entered into PPAs for 200
MW of wind; applies towards 2012 commitment
MW of wind; applies towards 2012 commitment
• RPS requirements are different in each state
– Missouri requirements based upon retail
energy sales and include solar needs
energy sales and include solar needs
– Kansas requirements based upon retail
peak load
peak load
Drivers of Future Renewable Energy Needs

December 2011 Investor Presentation
11
|
Analyst Day Presentation
|
|
• RFP for 220 MW of wind
projects being evaluated — Likely structure is a PPA
— Would consider using equity
to finance asset growth if expected to be EPS accretive within 12-24 months of issuance |
|
|
|
|
Renewable Investment and
Financing Considerations
|
Update to Plan
|
|
• Negotiated two wind contracts in 4Q 2011
for in-service by the end of 2012 — KCP&L - 100 MW PPA
— GMO - 100 MW PPA
|
|
• May consider future ownership
― Would consider using equity to finance asset
growth if expected to be EPS accretive within 12-24 months |

December 2011 Investor Presentation
12
|
Overview
of Rule
|
|
• Final rule signed in July
2011 |
|
• Regulates SO2 and NOx
|
|
• Allows limited air quality-
assured allowance trading |
|
• Includes Kansas and
Missouri |
|
• Uncertainty of rule
pending judicial and administrative consideration |
|
Potential Impact to
Great Plains Energy |
|
• Increased capital costs
from additional emissions control equipment* |
|
• Purchase allowances, if
available |
|
• Off-systems sales
margin threshold |
|
• Increased costs to
customers |
|
|
|
|
|
Achieving
Compliance
|
|
• Install emissions control
equipment |
|
• Purchase allowances, if
available |
|
• Change in plant
processes |
|
|
|
|
|
|
*Potential costs included in approximate $1 billion for environmental compliance as noted in 3Q 2011 10-Q
Cross-State Air Pollution Rule (CSAPR)

December 2011 Investor Presentation
13
Regulatory Update
• Missouri
― On December 1, KCP&L and GMO gave notice to the
Missouri Public Service Commission (MPSC) of their intent
to file rate cases
Missouri Public Service Commission (MPSC) of their intent
to file rate cases
• Rate cases anticipated to be filed in 1Q 2012
― On December 1, KCP&L and GMO filed with the MPSC a
notice of intent to file a merger case
notice of intent to file a merger case
• This filing preserves the ability to file a merger case
concurrently with the anticipated rate cases
concurrently with the anticipated rate cases
― KCP&L and GMO anticipate making a filing under the
Missouri Energy Efficiency Investment Act (MEEIA) by year
end
Missouri Energy Efficiency Investment Act (MEEIA) by year
end
• Kansas
― KCP&L anticipates filing for a property tax rider by year
end with an effective date in February 2012
end with an effective date in February 2012
December 2011 Investor Presentation
14
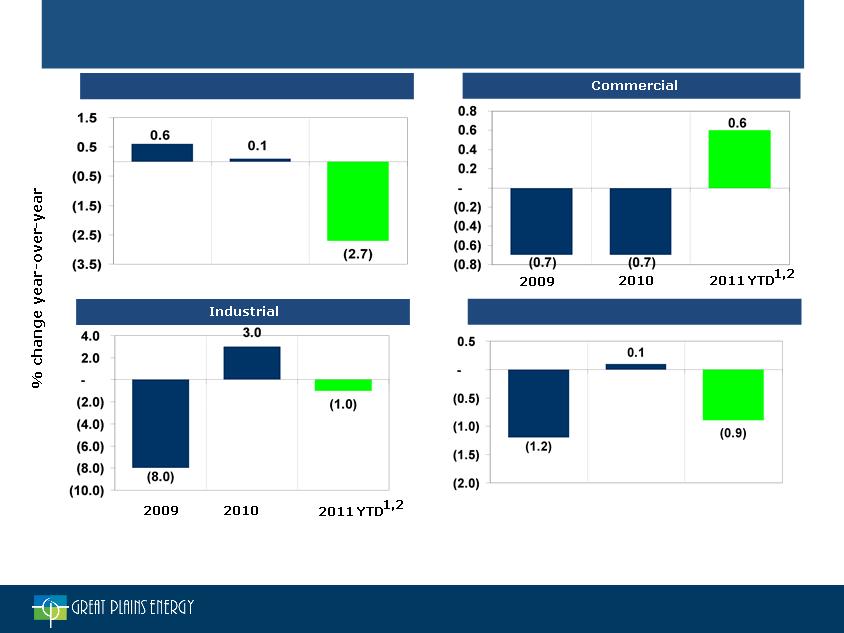
Weather-Normalized Year-over-Year
Retail MWh Sales
Retail MWh Sales
1 Drivers contributing to the portion of the YTD decline that occurred in 1Q11 may have included a) switching to natural gas heat; b) conversion to more
efficient heat pumps; c) conservation among KCP&L KS customers on an all-electric rate triggered by a substantial rate increase for this rate class in
KCP&L’s 2010 KS rate case; and d) continued challenges in the local economy
efficient heat pumps; c) conservation among KCP&L KS customers on an all-electric rate triggered by a substantial rate increase for this rate class in
KCP&L’s 2010 KS rate case; and d) continued challenges in the local economy
2 As of September 30
2009
2009
2010
2010
Residential
Total Customer Class
2011 YTD1,2
2011 YTD1,2
December 2011 Investor Presentation
15
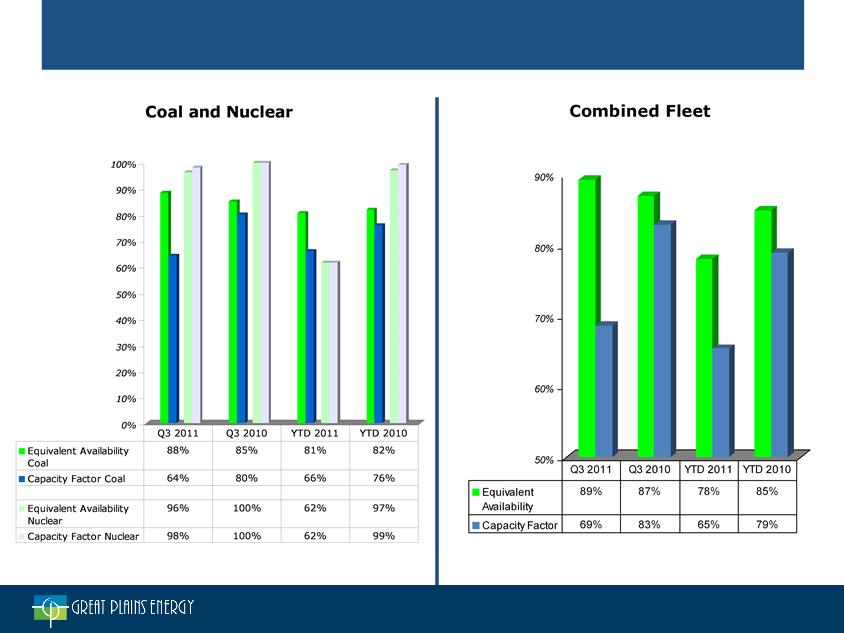
Plant Performance
1 As of September 30
1
1
1
1
December 2011 Investor Presentation
16
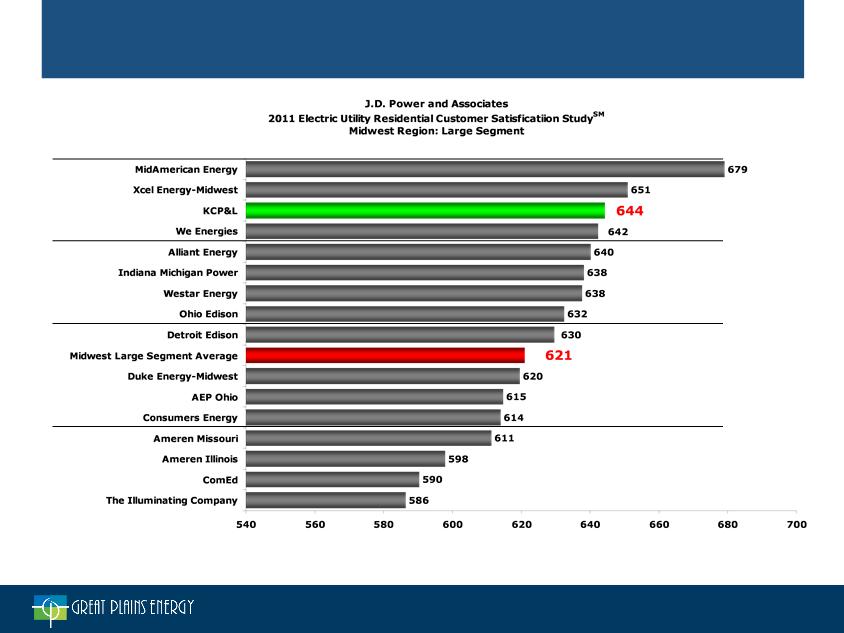
Source: J.D. Power and Associates 2011 Electric Utility Residential Customer Satisfaction StudySM
Tier 1
Tier 2
Tier 3
Tier 4
Customer Satisfaction

December 2011 Investor Presentation
17
2011 Quarterly and Year-to-Date September 30 EPS
Reconciliation Versus 2010
Reconciliation Versus 2010
|
|
Special
Factors |
WN Demand
|
Weather
|
Lag
|
Other
|
Total
|
|
1Q 2011
|
($0.07)
|
($0.04)
|
$0.01
|
($0.04)
|
-
|
($0.14)
|
|
2Q 2011
|
($0.06)
|
($0.01)
|
($0.03)
|
($0.02)
|
($0.04)
|
($0.16)
|
|
3Q 2011
|
($0.09)
|
$0.05
|
($0.03)
|
($0.03)
|
$0.05
|
($0.05)
|
|
Year To
Date |
($0.22)
|
$0.01
|
($0.04)
|
($0.09)
|
$0.01
|
($0.33)
|
|
|
2010 EPS
|
2011 EPS
|
Change in EPS
|
|
1Q
|
$0.15
|
$0.01
|
($0.14)
|
|
2Q
|
$0.47
|
$0.31
|
($0.16)
|
|
3Q
|
$0.96
|
$0.91
|
($0.05)
|
|
Year To
Date |
$1.57
|
$1.24
|
($0.33)
|
Contributors to Lower 2011 EPS Compared to 2010
Note: Numbers may not add due to the effect of dilutive shares on EPS

December 2011 Investor Presentation
18
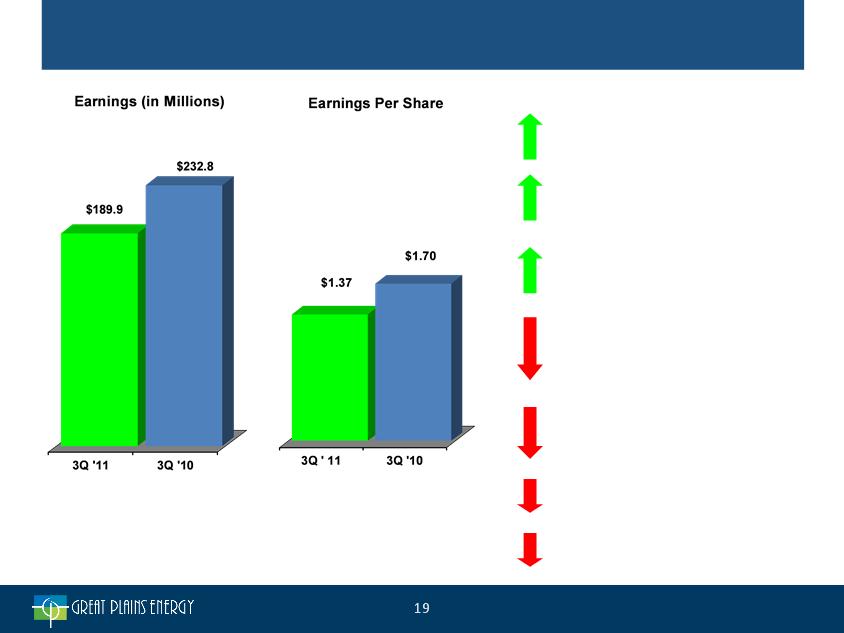
• Common stock outstanding for the year to date averaged 138.5 million shares, about 1 percent
higher than the same period in 2010
higher than the same period in 2010
|
|
Earnings (in Millions)
|
|
Earnings per Share
|
||
|
|
2011
|
2010
|
|
2011
|
2010
|
|
Electric Utility
|
$ 189.9
|
$ 232.8
|
|
$ 1.37
|
$ 1.70
|
|
Other
|
(17.6)
|
(16.1)
|
|
(0.13)
|
(0.12)
|
|
Net income
|
172.3
|
216.7
|
|
1.24
|
1.58
|
|
Less: Net income attributable to noncontrolling
interest |
-
|
(0.1)
|
|
-
|
-
|
|
Net income attributable to Great Plains Energy
|
172.3
|
216.6
|
|
1.24
|
1.58
|
|
Preferred dividends
|
(1.2)
|
(1.2)
|
|
-
|
(0.01)
|
|
Earnings available for common shareholders
|
$ 171.1
|
$ 215.4
|
|
$ 1.24
|
$ 1.57
|
Great Plains Energy Consolidated Earnings
and Earnings Per Share - Year-to-Date September 30
(Unaudited)
and Earnings Per Share - Year-to-Date September 30
(Unaudited)
December 2011 Investor Presentation
Electric Utility Year-to-Date Results
Decreased depreciation and amortization
• Lower regulatory amortization
• Lower depreciation rates established in recent
rate cases
rate cases
Decreased income tax expense
• Lower pre-tax income
Increased other operating expenses
• O&M and property taxes related to Iatan 2
• Disallowances and other costs resulting
from MO rate case orders
• Pension expense
• Flood related expenses
Decreased non-operating income and expenses
• Lower AFUDC equity
Charges related to organizational realignment
and voluntary separation program
and voluntary separation program
Key Earnings Drivers
$42.6M Pre-tax
$15.6M
$50.8M Pre-tax
Increased gross margin*
• New retail rates partially offset by an
extended Wolf Creek refueling outage, coal
conservation activities and higher coal
transportation costs
extended Wolf Creek refueling outage, coal
conservation activities and higher coal
transportation costs
$22.4M Pre-tax
$12.7M Pre-tax
$2.2M Pre-tax
*Gross margin is a non-GAAP measure that is defined and reconciled
to GAAP operating revenues in Appendix
to GAAP operating revenues in Appendix
Increased interest expense
• Lower AFUDC debt
• Lower carrying costs
$17.4M Pre-tax

December 2011 Investor Presentation
20
Special Factors Impacting
Year-to-Date Results and 2011 Guidance
Year-to-Date Results and 2011 Guidance
|
|
1Q
|
2Q
|
3Q
|
Total
|
|
Disallowances and other
accounting effects from Missouri rate case orders |
($0.03)
|
|
|
($0.03)
|
|
Organizational realignment and
voluntary separation program |
($0.04)
|
($0.01)
|
|
($0.05)
|
|
Wolf Creek extended outage
and replacement power |
|
($0.05)
|
|
($0.05)
|
|
Coal conservation and flooding
related expenses |
|
|
($0.09)
|
($0.09) (a)
|
|
Total
|
($0.07)
|
($0.06)
|
($0.09)
|
($0.22)
|
(a) Coal conservation ended mid-October and 4Q impact expected to be insignificant
(All Amounts Per-Share)
December 2011 Investor Presentation
21
|
Great Plains Energy Debt
|
||||||||
|
($ in Millions)
|
KCP&L
|
GMO (1)
|
GPE
|
Consolidated
|
||||
|
|
Amount
|
Rate (2)
|
Amount
|
Rate (2)
|
Amount
|
Rate (2)
|
Amount
|
Rate (2)
|
|
Short-term debt
|
$ 105.5
|
1.07%
|
$ 0.0
|
0.0%
|
$ 28.0
|
3.00%
|
$ 133.5
|
1.47%
|
|
Long-term debt (3)
|
2,064.5
|
6.04%
|
650.2
|
10.96%
|
986.8
|
6.61%
|
3,701.5
|
7.03%
|
|
Total
|
$2,170.0
|
5.80%
|
$650.2
|
10.96%
|
$1,014.8
|
6.51%
|
$3,835.0
|
6.83%
|
|
Secured debt = $749 (20%), Unsecured debt = $3,086 (80%)
(1) GPE guarantees substantially all of GMO’s debt
(2) Weighted Average Rates - excludes premium / discounts and fair market value adjustments; includes full Equity Units coupon (12%) for GPE
(3) Includes current maturities of long-term debt
|
||||||||
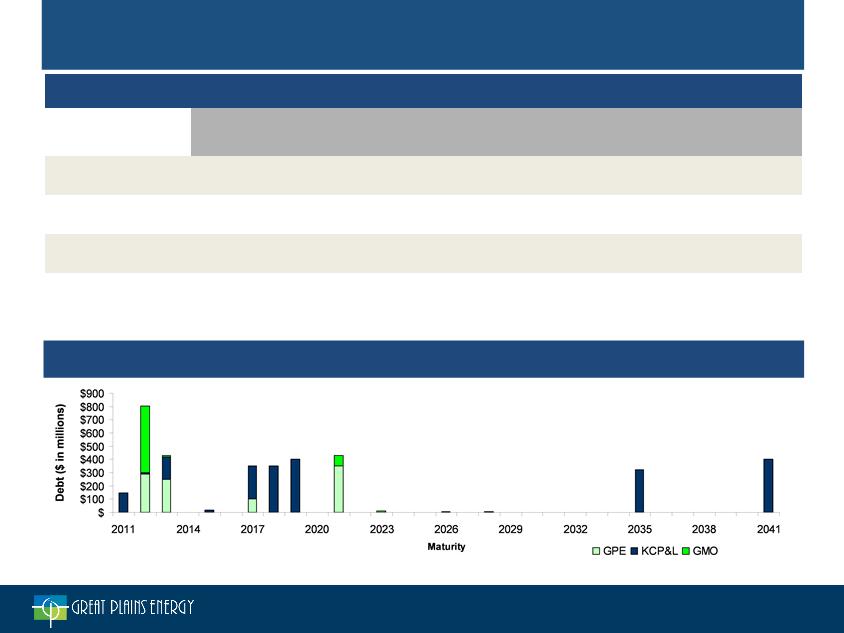
Long-Term Debt Maturities (4)
Debt Profile as of September 30, 2011
(4) 2013 reflects mode maturity for $167.6 million of KCP&L tax-exempt bonds subject to remarketing prior to final maturity date
(5) $150 million of KCP&L long-term debt matured November 15, 2011
(5)
December 2011 Investor Presentation
22
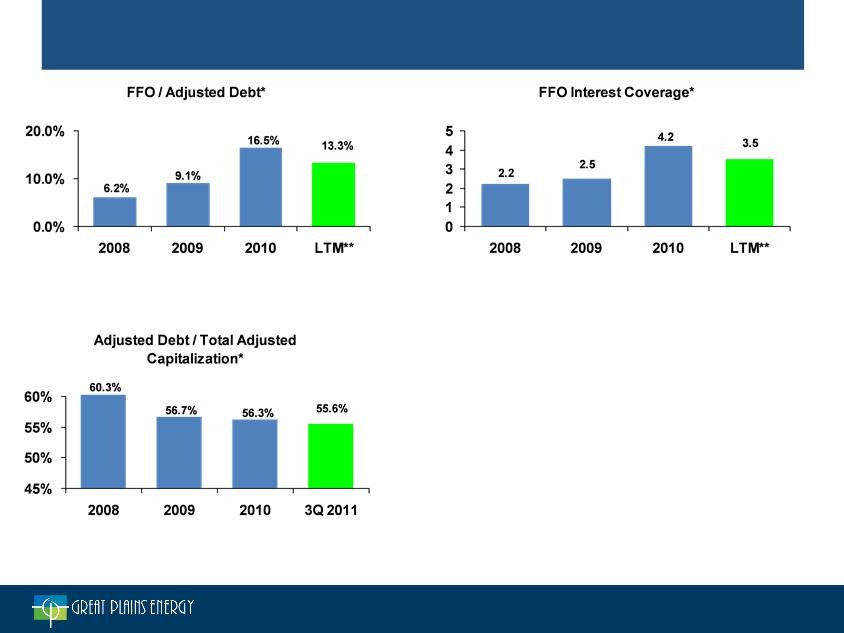
* All ratios calculated using Standard and Poor’s methodology. Ratios are non-GAAP measures that are defined and reconciled to GAAP in Appendix
** Last twelve months as of September 30, 2011
Credit Profile for Great Plains Energy
|
Current Credit Ratings
|
||
|
|
Moody’s
|
Standard & Poor’s
|
|
Great Plains Energy
Outlook
Corporate Credit Rating
Preferred Stock
Senior Unsecured Debt
|
Stable
-
Ba2
Baa3
|
Stable
BBB
BB+
BBB-
|
|
KCP&L
Outlook
Senior Secured Debt
Senior Unsecured Debt
Commercial Paper
|
Stable
A3
Baa2
P-2
|
Stable
BBB+
BBB
A-2
|
|
GMO
Outlook
Senior Unsecured Debt
Commercial Paper
|
Stable
Baa3
P-3
|
Stable
BBB
A-2
|

December 2011 Investor Presentation
23
Operations and Regulatory Strategy

December 2011 Investor Presentation
24
Environmental
1. Estimated cost of compliance with
current / proposed legislation =
approximately $1 billion:
current / proposed legislation =
approximately $1 billion:
• LaCygne
– Unit 1 (368 MW*) - scrubber
and baghouse - 2015
and baghouse - 2015
– Unit 2 (341 MW*) - full Air
Quality Control System
(“AQCS”) - 2015
Quality Control System
(“AQCS”) - 2015
• Montrose 3 (176 MW) - full AQCS -
2016 (approx.)
2016 (approx.)
• Sibley 3 (364 MW) - scrubber and
baghouse - 2016
baghouse - 2016
2. Other retrofits less likely and therefore
not included in estimated cost of
compliance:
not included in estimated cost of
compliance:
• Montrose 1 and 2 (total capacity 334
MW)
MW)
• Sibley 1 and 2 (total capacity 102
MW)
MW)
• Lake Road 4 and 6 (99 MW)
*KCP&L’s share of jointly-owned facility
Iatan 2 cooling tower fans. The use of a cooling tower for condenser cooling is an
integral part of Iatan’s environmentally friendly zero liquid discharge operation.
integral part of Iatan’s environmentally friendly zero liquid discharge operation.
December 2011 Investor Presentation
25
Renewable Energy and Energy Efficiency
1. Future renewable requirements
driven by the following:
driven by the following:
• Renewable Portfolio Standards
(“RPS”) in Missouri and Kansas
(“RPS”) in Missouri and Kansas
• 2007 Collaboration Agreement
with Sierra Club
with Sierra Club
2. Flexibility regarding acquisition of
future renewable resources:
future renewable resources:
• Through Purchased Power
Agreements (“PPAs”) and
purchases of Renewable Energy
Credits (“RECs”); or
Agreements (“PPAs”) and
purchases of Renewable Energy
Credits (“RECs”); or
• Adding to rate base if supported
by credit profile and available
equity and debt financing
by credit profile and available
equity and debt financing
3. Energy efficiency expected to be a
key component of future resource
portfolio:
key component of future resource
portfolio:
• Aggressive pursuit planned with
appropriate regulatory recovery
appropriate regulatory recovery
Spearville 2 Wind Energy Facility in Western Kansas
December 2011 Investor Presentation
26
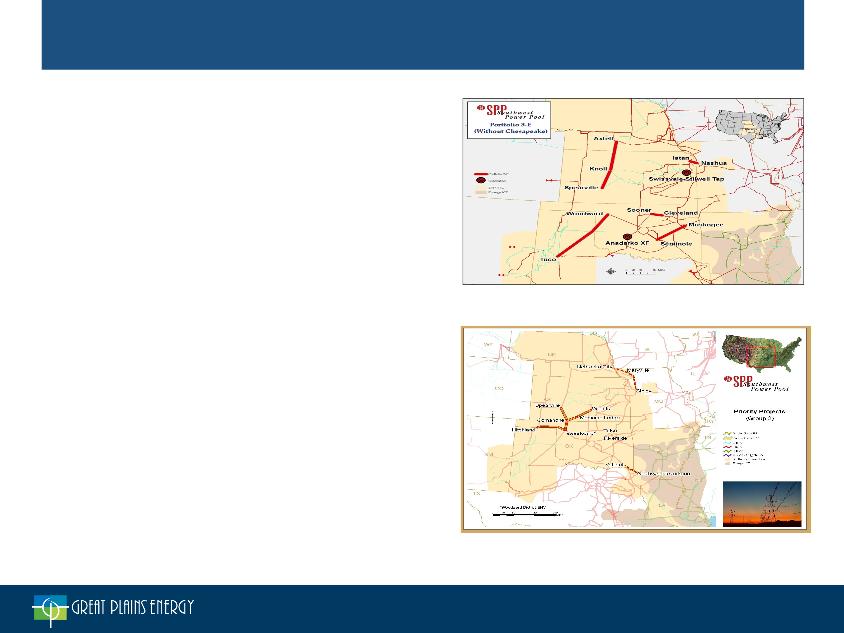
Transmission
1. Two significant projects are
currently in GXP’s plans:
currently in GXP’s plans:
• Iatan-Nashua 345kV line -
Projected $54M total cost and
2015 in-service date
Projected $54M total cost and
2015 in-service date
• Sibley-Maryville-Nebraska City
345kV line - Projected $380M
total cost and 2017 in-service
date
345kV line - Projected $380M
total cost and 2017 in-service
date
2. Increasingly competitive
environment requires consideration
of strategic options
environment requires consideration
of strategic options
3. Flexibility is important - opportunity
to pursue projects unilaterally but
also preserve capital if needed
through partnership
to pursue projects unilaterally but
also preserve capital if needed
through partnership
Iatan-Nashua 345kV, 30 miles, $54M
Expected in-service: 2015
Sibley-Maryville-Nebraska City 345kV,
170 miles, projected cost ~$380M
170 miles, projected cost ~$380M

December 2011 Investor Presentation
27
Plant Operations
1. No additional baseload
generation expected for
several years
generation expected for
several years
2. Targeting modest
improvements in existing
fleet performance in the
coming years
improvements in existing
fleet performance in the
coming years
3. No changes currently
planned regarding nuclear’s
role in the portfolio
planned regarding nuclear’s
role in the portfolio
Iatan 2, 850-megawatt coal fired power
plant recognized as power plant of the year
by Power Magazine
plant recognized as power plant of the year
by Power Magazine

December 2011 Investor Presentation
28
Regulatory
• Our rates continue to compare well regionally and nationally
• Over the last five years, the Company has received fair and
constructive treatment in both Kansas and Missouri, allowing
for recovery of our CEP capital additions
constructive treatment in both Kansas and Missouri, allowing
for recovery of our CEP capital additions
• We continue to aggressively pursue strategies to improve our
operating cost structure and are evaluating the best
combination of rate cases and riders/trackers to reduce
regulatory lag while minimizing the impact on customers
operating cost structure and are evaluating the best
combination of rate cases and riders/trackers to reduce
regulatory lag while minimizing the impact on customers

December 2011 Investor Presentation
29
2011 - 2012
Earnings Guidance

December 2011 Investor Presentation
30
Focused on Delivering Value to Shareholders
Earnings Growth
Expected Through Reduced Regulatory Lag, Disciplined Cost
Management and Long-Term Rate Base Growth
Management and Long-Term Rate Base Growth
Competitive Dividend
Goal to Maintain Competitive Dividend While Strengthening Key Credit
Metrics; Objective to Grow Dividend In Line With Payout Ratio
Targets
Metrics; Objective to Grow Dividend In Line With Payout Ratio
Targets
Objective: Improved Total Shareholder Returns
December 2011 Investor Presentation
31
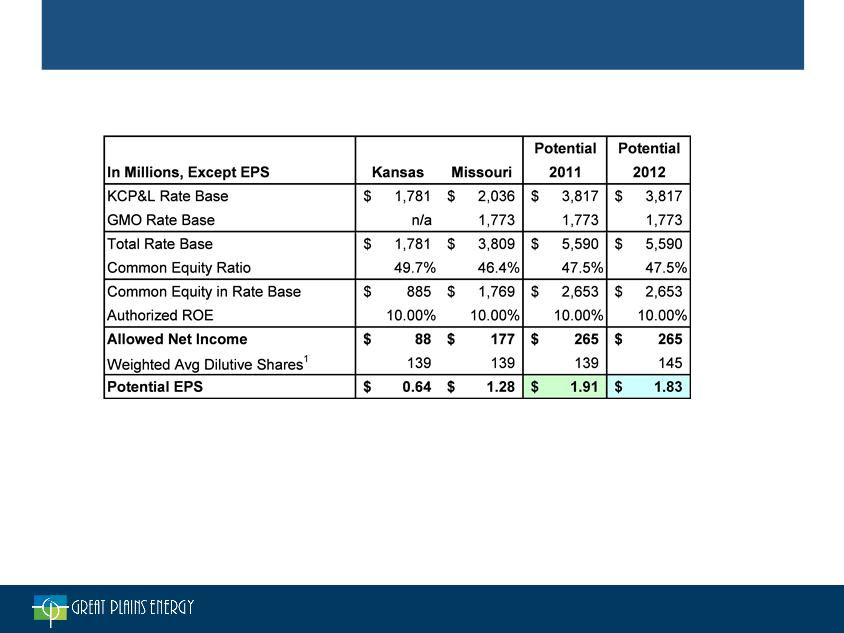
Potential Earnings from Regulated Operations
Based on Recent Rate Case Outcomes
Based on Recent Rate Case Outcomes
12012 includes conversion to 17.1M shares of GXP common stock in June

December 2011 Investor Presentation
32
2011 and 2012 EPS Guidance Range
• Increased 2011 guidance to $1.22 - $1.32 from $1.10 - $1.25
– Drivers:
• 3Q weather warmer than normal
• 3Q increase in weather-normalized demand
• Actual 2011 capital expenditures estimated to be $50 million less
than projected
than projected
• Reaffirming 2012 guidance of $1.35 - $1.55
• Reaffirming 2013 target of 50 basis points of lag in regulated
operations
operations

December 2011 Investor Presentation
33
• Strong emphasis on improving credit metrics
– Objective is visibility to sustainable FFO / Adjusted Debt* of 16%+
beginning in 2012
beginning in 2012
• Dividend is reviewed quarterly in context of this objective as well as a
belief that a sustainable and increasing dividend is a key driver of TSR
and therefore a desirable goal
belief that a sustainable and increasing dividend is a key driver of TSR
and therefore a desirable goal
• Target payout ratio remains 50-70%
Dividend Strategy Considerations
Competitive Dividend
Goal to Maintain Competitive Dividend While Strengthening Key Credit
Metrics; Objective to Grow Dividend In Line With Payout Ratio
Targets
Metrics; Objective to Grow Dividend In Line With Payout Ratio
Targets
• Company’s objective is to create shareholder value through
– Increased earnings from reduced lag, disciplined cost management and long
-term asset growth
-term asset growth
– A competitive dividend that complements this growth platform
*FFO / Adjusted Debt is a non-GAAP measure that is defined in the Appendix

December 2011 Investor Presentation
34
• Proven track record of constructive regulatory treatment
• Credibility with regulators in terms of planning and execution of large, complex projects
• Competitive retail rates on a regional and national level supportive of potential future
investment
investment
Diligent
Regulatory
Approach
Regulatory
Approach
• Target significant reduction in regulatory lag
• Seek to deliver earnings growth and increasing and sustainable cash dividends as a key
component of TSR
component of TSR
• Improvement in / stability of key credit metrics is a priority
Focused on
Shareholder
Value Creation
Shareholder
Value Creation
Excellent
Relationships
with Key
Stakeholders
Relationships
with Key
Stakeholders
• Customers - Tier 1 customer satisfaction
• Suppliers - strategic supplier alliances focused on long-term supply chain value
• Employees - strong relations between management and labor (3 IBEW locals)
• Communities - Leadership, volunteerism and high engagement in the areas we serve
• Environmental - additional ~$1 billion of “High Likelihood” capital projects planned to
comply with existing / proposed environmental rules
comply with existing / proposed environmental rules
• Transmission - additional $0.4 billion of capital additions planned
• Renewables - driven by Collaboration Agreement and MO/KS RPS; potential capital
additions
additions
• Other Growth Opportunities - selective future initiatives that will leverage our core
strengths
strengths
Attractive
Platform for
Long-Term
Growth
Platform for
Long-Term
Growth
GXP - Platform for Shareholder Value

December 2011 Investor Presentation
35
Great Plains Energy
Investor Presentation
December 2011

December 2011 Investor Presentation
36
Appendix

December 2011 Investor Presentation
37
Gross margin is a financial measure that is not calculated in accordance with generally accepted accounting
principles (GAAP). Gross margin, as used by Great Plains Energy, is defined as operating revenues less fuel,
purchased power and transmission of electricity by others. The Company’s expense for fuel, purchased
power and transmission of electricity by others, offset by wholesale sales margin, is subject to recovery
through cost adjustment mechanisms, except for KCP&L’s Missouri retail operations. As a result, operating
revenues increase or decrease in relation to a significant portion of these expenses. Management believes
that gross margin provides a more meaningful basis for evaluating the Electric Utility segment’s operations
across periods than operating revenues because gross margin excludes the revenue effect of fluctuations in
these expenses. Gross margin is used internally to measure performance against budget and in reports for
management and the Board of Directors. The Company’s definition of gross margin may differ from similar
terms used by other companies. A reconciliation to GAAP operating revenues is provided in the table above.
Great Plains Energy Reconciliation of
Gross Margin to Operating Revenues
(Unaudited)
Gross Margin to Operating Revenues
(Unaudited)
|
(millions)
|
Three Months Ended
September 30 |
Year to Date
September 30
|
||
|
|
2011
|
2010
|
2011
|
2010
|
|
Operating revenues
|
$773.7
|
$ 728.8
|
$1,831.7
|
$ 1,787.7
|
|
Fuel
|
(146.5)
|
(127.3)
|
(365.8)
|
(333.2)
|
|
Purchase power
|
(68.1)
|
(68.0)
|
(178.4)
|
(171.4)
|
|
Transmission of electricity by others
|
(8.6)
|
(8.1)
|
(23.1)
|
(20.9)
|
|
Gross margin
|
$550.5
|
$ 525.4
|
$1,264.4
|
$ 1,262.2
|
December 2011 Investor Presentation
38
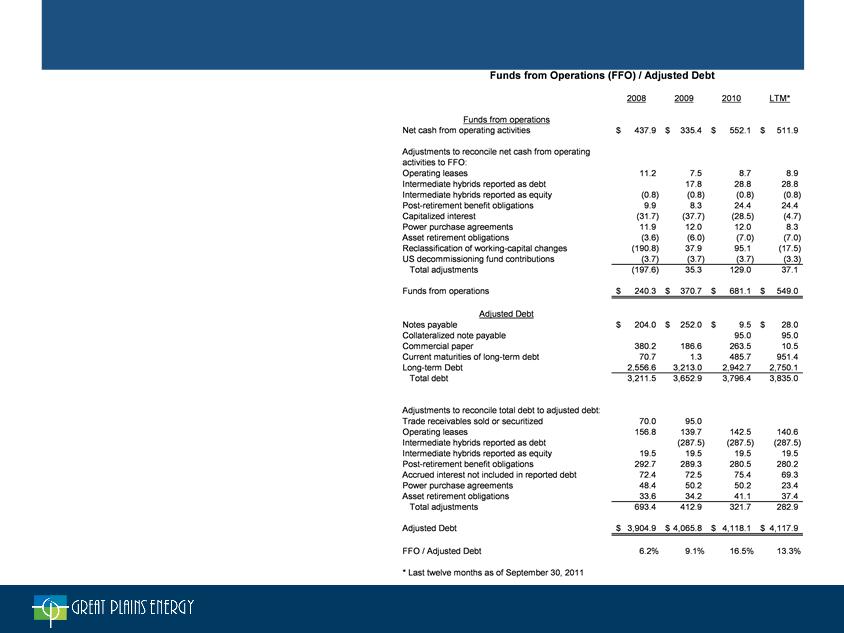
Credit Metric Reconciliation to GAAP
Funds from operations (FFO) to adjusted debt is a
financial measure that is not calculated in
accordance with generally accepted accounting
principles (GAAP). FFO to adjusted debt, as used
by Great Plains Energy, is defined in accordance
with Standard & Poor’s methodology used for
calculating FFO to debt. The numerator of the ratio
is defined as net cash from operating activities
(GAAP) plus non-GAAP adjustments related to
operating leases, hybrid securities, post-retirement
benefit obligations, capitalized interest, power
purchase agreements, asset retirement obligations,
changes in working capital and decommissioning
fund contributions. The denominator of the ratio is
defined as the sum of debt balances (GAAP) plus
non-GAAP adjustments related to some of the same
items adjusted for in the numerator and other
adjustments related to securitized receivables and
accrued interest. Management believes that FFO to
adjusted debt provides a meaningful way to better
understand the Company’s credit profile. FFO to
adjusted debt is used internally to help evaluate the
possibility of a change in the Company’s credit
rating.
December 2011 Investor Presentation
39
Credit Metric Reconciliation to GAAP
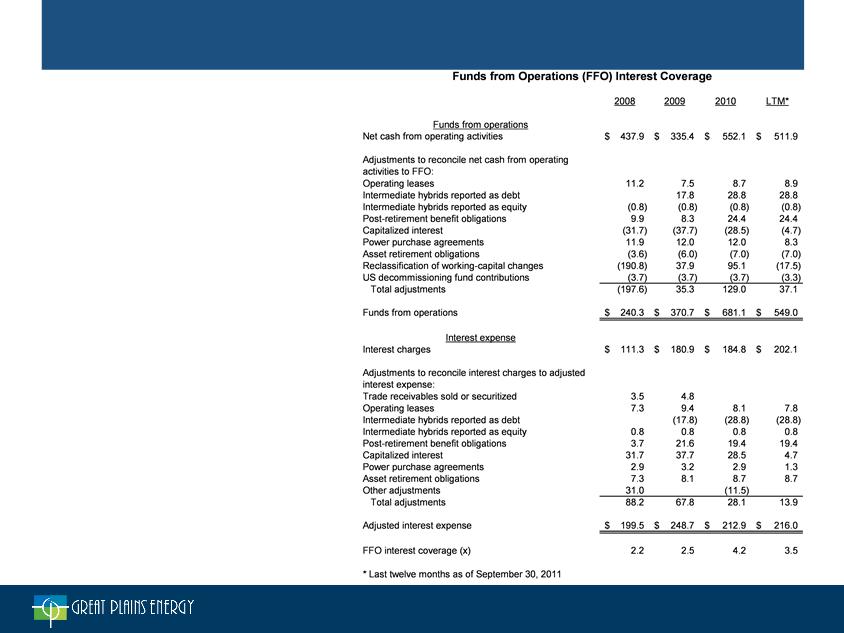
Funds from operations (FFO) interest coverage
ratio is a financial measure that is not calculated in
accordance with generally accepted accounting
principles (GAAP). FFO interest coverage, as
used by Great Plains Energy, is defined in
accordance with Standard & Poor’s methodology
used for calculating FFO interest coverage. The
numerator of the ratio is defined as net cash from
operating activities (GAAP) plus non-GAAP
adjustments related to operating leases, hybrid
securities, post-retirement benefit obligations,
capitalized interest, power purchase agreements,
asset retirement obligations, changes in working
capital and decommissioning fund contributions
plus adjusted interest expense (non-GAAP). The
denominator of the ratio, adjusted interest
expense, is defined as interest charges (GAAP)
plus non-GAAP adjustments related to some of
the same items adjusted for in the numerator and
other adjustments needed to match Standard &
Poor’s calculation. Management believes that
FFO interest coverage provides a meaningful way
to better understand the Company’s credit profile.
FFO interest coverage is used internally to help
evaluate the possibility of a change in the
Company’s credit rating.
December 2011 Investor Presentation
40
Credit Metric Reconciliation to GAAP
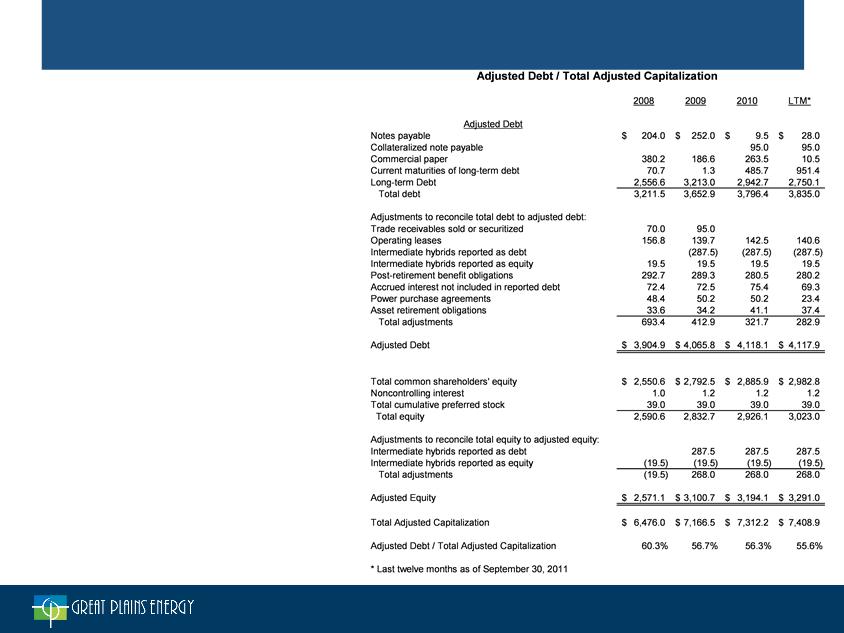
Adjusted debt to total adjusted capitalization is
a financial measure that is not calculated in
accordance with generally accepted accounting
principles (GAAP). Adjusted debt to total
adjusted capitalization, as used by Great Plains
Energy, is defined in accordance with Standard
& Poor’s methodology used for calculating the
ratio of debt to debt and equity. The numerator
of the ratio, adjusted debt, is defined as the
sum of debt balances (GAAP) plus non-GAAP
adjustments related to securitized receivables,
operating leases, hybrid securities, post-
retirement benefit obligations, accrued interest,
power purchase agreements and asset
retirement obligations. The denominator of the
ratio, total adjusted capitalization, is defined as
the sum of equity balances (GAAP) plus non-
GAAP adjustments related to hybrid securities
plus the non-GAAP adjusted debt as defined for
the numerator. Management believes that
adjusted debt to total adjusted capitalization
provides a meaningful way to better understand
the Company’s credit profile. Adjusted debt to
total adjusted capitalization is used internally to
help evaluate the possibility of a change in the
Company’s credit rating.
`