Attached files
| file | filename |
|---|---|
| 8-K - FORM 8-K - FIRST NIAGARA FINANCIAL GROUP INC | c25636e8vk.htm |
| EX-99.1 - EXHIBIT 99.1 - FIRST NIAGARA FINANCIAL GROUP INC | c25636exv99w1.htm |
Exhibit 99.2

| First Niagara Financial Group December 6, 2011 Differentiated Combination of Growth and Value |

| Safe Harbor Statement This presentation contains forward-looking information for First Niagara Financial Group, Inc. Such information constitutes forward-looking statements (within the meaning of the Private Securities Litigation Reform Act of 1995) which involve significant risks and uncertainties. Actual results may differ materially from the results discussed in these forward-looking statements. |

| The Path Forward Re-evaluated the strategic impact and economic benefits All the more comfortable with original strategic conclusions; transaction will make us a better bank Customer/community/in-market response continues to exceed expectations Longer-term financial returns and benefits remain solid; near-term upside acceptable Highly confident in our execution and integration of low risk, in-market transaction Modified capital plan to compensate for market disruption Reduce level of common equity to minimize shareholder dilution Adjust dividend in support of tangible common equity reduction Re-mix capital using preferred and sub debt to maintain "well capitalized" standing More optimally align capital levels with even lower balance sheet risk Aggressively respond to Tangible Book Value dilution challenge Prioritize and accelerate capital build for the foreseeable future Further sharpen focus on operational effectiveness, efficiency and profitability M&A pause until capital accumulation plan more fully advanced Continue to manage capital to optimize long-term total shareholder return 3 |
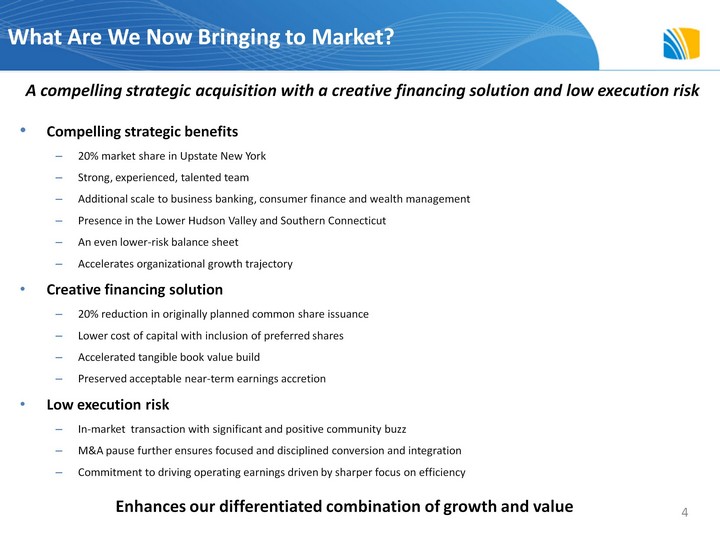
| What Are We Now Bringing to Market? Compelling strategic benefits 20% market share in Upstate New York Strong, experienced, talented team Additional scale to business banking, consumer finance and wealth management Presence in the Lower Hudson Valley and Southern Connecticut An even lower-risk balance sheet Accelerates organizational growth trajectory Creative financing solution 20% reduction in originally planned common share issuance Lower cost of capital with inclusion of preferred shares Accelerated tangible book value build Preserved acceptable near-term earnings accretion Low execution risk In-market transaction with significant and positive community buzz M&A pause further ensures focused and disciplined conversion and integration Commitment to driving operating earnings driven by sharper focus on efficiency Enhances our differentiated combination of growth and value A compelling strategic acquisition with a creative financing solution and low execution risk 4 |

| Northeast Regional Banking Profile First Niagara HSBC Pro Forma First Niagara: $38B in assets $30B in deposits $18B in loans 440 branches* Acquired Branches: $15B in assets $15B in deposits $2.5B in loans 200 locations 88 Rochester Syracuse Albany Poughkeepsie Buffalo Binghamton Hartford New Haven Philadelphia Pittsburgh 91 80 5 * After estimated divestitures of $4 billion and ~40 branches |

| Financing Strategy Optimize Capital Structure 50% reduction in common dividend payout accelerates tangible book value build Maintain well-capitalized position that supports organic growth Continue to opportunistically leverage and re-invest to perpetuate differentiating core growth trends Balance returns to shareholders and capital accumulation Pro Forma Capital Ratios at Q2 2012 Tier 1 Leverage 6.0% Tier 1 Common1 7.7% Tier 1 Risk Based Capital 9.8% Total Risk Based Capital 11.8% TCE / TA1 5.2% TCE / RWA1 8.4% 6 1Tier 1 Common, TCE/TA, and TCE/RWA are Non-GAAP measures. Refer to the appendix for further detail. |

| Transaction affords an opportunity to diversify securities portfolio, reducing MBS concentration, while minimizing interest rate risk Purchase of securities began in the fourth quarter; average yield of 3.5% Securities purchased include CMBS, ABS, CLO's and Corporate Bonds Average rating of purchased bonds is AA, with 85% above investment grade Expect securities purchases to be completed by March 2012 High Grade, Low Risk Securities Portfolio First Niagara (9/30/11) Pro Forma Securities Portfolio Composition (CHART) Market Value $14B Inv Grade % 97% Risk-Weighting 21% Market Value $11B Inv Grade % 99% Risk-Weighting 15% (CHART) 7 |
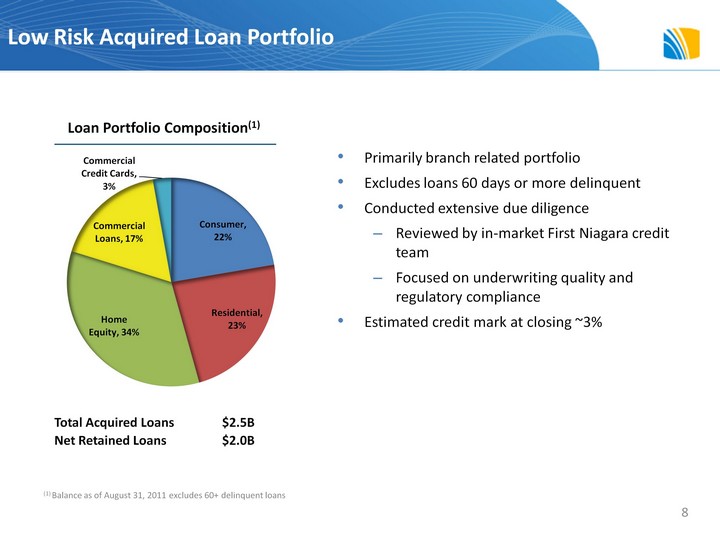
| Low Risk Acquired Loan Portfolio Primarily branch related portfolio Excludes loans 60 days or more delinquent Conducted extensive due diligence Reviewed by in-market First Niagara credit team Focused on underwriting quality and regulatory compliance Estimated credit mark at closing ~3% Loan Portfolio Composition(1) Total Acquired Loans $2.5B Net Retained Loans $2.0B (1) Balance as of August 31, 2011 excludes 60+ delinquent loans (CHART) 8 |

| Liquidity will be used to pay down ~$5B in wholesale funding; 80-100 basis points improvement Significant benefit to funding profile and cost; acquired retail deposit cost 34 basis points Holding company liquidity position in excess of 8 quarters of obligations 6249 LRA Improved Low Risk Funding Profile Cost of Funds(1) 0.76% Total Deposits $20B Total Borrowings $7B Cost of Funds(1) 0.62% Total Deposits $30B Total Borrowings $2B First Niagara (9/30/11) Pro Forma (1) Calculated using weighted average cost of funding for deposits and borrowings as of most recent quarter (CHART) (CHART) 9 |

| Transaction Assumptions On Acquired Operations Net Acquired Deposits $11 billion Incremental Loan Growth $100-200MM per year Loan Credit Mark 3% of loans outstanding at close Deposit Attrition 5% to 6% of total deposits over 9 months post-close Core Deposit Intangibles 2.0%, accelerated amortization over 8 years ($45MM in first 12 months) Balance Sheet Restructuring $5B wholesale liability pay down at close Net Interest Margin (1) 4.00%-4.50%; securities book yield of 3.50% Noninterest Income 0.80%-0.90% of average deposits Operating Costs 1.40% of average deposits (excludes intangible amortization) Allowance for Loan Loss Target reserves of 1.20% of new loan originations Restructuring Expenses $150-$175MM (pre-tax) expensed in 2012 Income Tax Treatment Core deposit intangible (CDI) and goodwill are tax deductible Divestitures $4 billion including $1.6 billion in DOJ divestitures Active marketing underway with agreements expected by calendar year-endModel assumes 4% average premium on divestitures (average expected to range from 4% to 5%) Represents net interest margin on the incremental increase in First Niagara's earning assets, comprised of approx. $2 billion loans yielding ~7% and $3.7 billion of securities yielding ~3.5%, funded by acquired deposits; excludes benefit related to debt prepayment 10 |

| Key Pro Forma Metrics * 2013 ROATCE:~18%** ROA: ~1.00% ROE & ROA Tangible book value per share: ~$5.25 at close Less than 5 year earn back period (including capital accumulation) Tangible book value CAGR through 2014 of 16% Tangible Book Value per Share 1-2% dilutive to 2012 operating EPS 4% accretive to 2013 operating EPS 9% accretive to 2014 operating EPS Accretion Current IBES mean 2012 estimate is high by approximately 6% - 7% Difference driven by lower than expected provision related to balance sheet growth, CDI amortization and efficiency ratio Pro forma Operating EPS 16+% IRR IRR 11 * Pro Forma metrics assume mid-single digit earnings growth rates at legacy First Niagara franchise **ROATCE is a Non-GAAP measure. Refer to Appendix for further details. |

| Why Invest in First Niagara Industry leading growth with Best in Class Asset Quality Compelling strategic benefits Creative financing solution Low execution risk Enhances our differentiated combination of growth and value 12 |

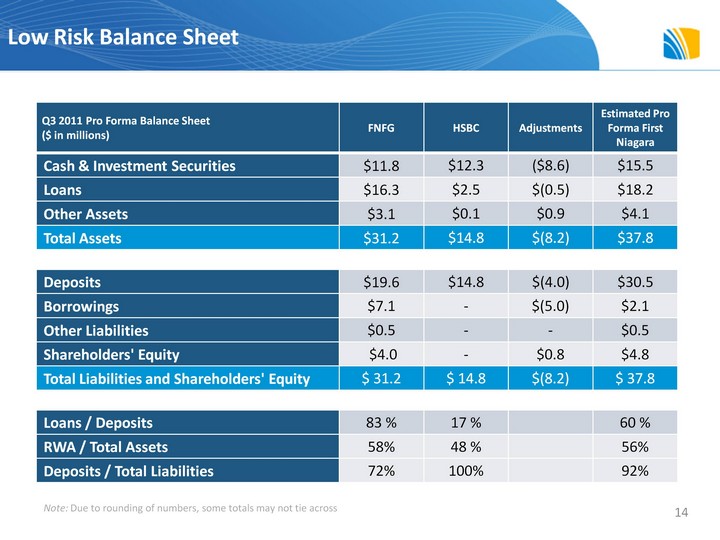
| Low Risk Balance Sheet Q3 2011 Pro Forma Balance Sheet($ in millions) FNFG HSBC Adjustments Estimated Pro Forma First Niagara Cash & Investment Securities $11.8 $12.3 ($8.6) $15.5 Loans $16.3 $2.5 $(0.5) $18.2 Other Assets $3.1 $0.1 $0.9 $4.1 Total Assets $31.2 $14.8 $(8.2) $37.8 Deposits $19.6 $14.8 $(4.0) $30.5 Borrowings $7.1 - $(5.0) $2.1 Other Liabilities $0.5 - - $0.5 Shareholders' Equity $4.0 - $0.8 $4.8 Total Liabilities and Shareholders' Equity $ 31.2 $ 14.8 $(8.2) $ 37.8 Loans / Deposits 83 % 17 % 60 % RWA / Total Assets 58% 48 % 56% Deposits / Total Liabilities 72% 100% 92% 14 Note: Due to rounding of numbers, some totals may not tie across |

| Loan Composition Source: Q3 2011 10-Q Note: Loan composition by region excludes our $299MM capital markets portfolio, nearly all of which are to companies in our footprint states or in states that border our footprint states Total Loans: $16bn (CHART) (CHART) 15 (CHART) (CHART) |

| Source: FNFG filings Total Nonaccruing Loans / Total Loans Net Charge-Offs / Average Loans Allowance for Loan Losses / Total Loans Allowance for Loan Losses / Total Nonaccruing Loans Credit Quality Trends 16 |

| Capital Trends Tier 1 Risk Based Capital Total Risk Based Capital TCE / TA1 Source: FNFG filings 17 Leverage TCE / RWA1 (CHART) (CHART) (CHART) (CHART) (CHART) 1 TCE/TA and TCE/RWA are Non-GAAP measures. Refer to appendix for further details. |
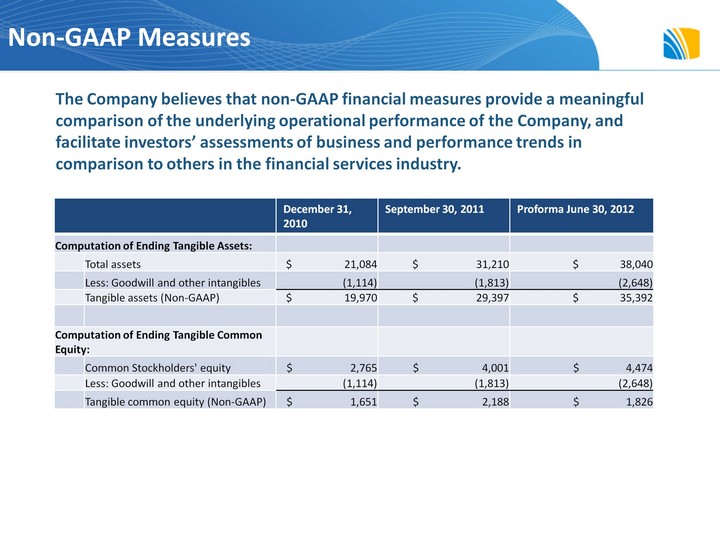
| Non-GAAP Measures December 31, 2010 September 30, 2011 Proforma June 30, 2012 Computation of Ending Tangible Assets: Computation of Ending Tangible Assets: Total assets $ 21,084 $ 31,210 $ 38,040 Less: Goodwill and other intangibles (1,114) (1,813) (2,648) Tangible assets (Non-GAAP) $ 19,970 $ 29,397 $ 35,392 Computation of Ending Tangible Common Equity: Computation of Ending Tangible Common Equity: Common Stockholders' equity $ 2,765 $ 4,001 $ 4,474 Less: Goodwill and other intangibles (1,114) (1,813) (2,648) Tangible common equity (Non-GAAP) $ 1,651 $ 2,188 $ 1,826 The Company believes that non-GAAP financial measures provide a meaningful comparison of the underlying operational performance of the Company, and facilitate investors' assessments of business and performance trends in comparison to others in the financial services industry. |

| Non-GAAP Measures (cont.) Proforma June 30, 2012 Computation of Average Tangible Common Equity: Computation of Average Tangible Common Equity: Average Common Stockholders' equity $ 4,728 Less: Average Goodwill and other intangibles (2,588) Average tangible common equity (Non-GAAP) $ 2,140 Proforma June 30, 2012 Computation of Tier 1 Common Capital: Computation of Tier 1 Common Capital: Tier 1 capital $ 2,133 Less: Qualifying restricted core capital elements (450) Tier 1 common capital (Non-GAAP) $ 1,683 |