Attached files
| file | filename |
|---|---|
| 8-K - 8-K - POPULAR, INC. | d263903d8k.htm |
 Investor
Day Investor Day
December 2, 2011
December 2, 2011
San Juan, Puerto Rico
San Juan, Puerto Rico
Exhibit 99.1 |
 Forward Looking
Statements Statements contained in this presentation that are not based on current or
historical fact are forward- looking in nature. Such forward-looking statements
are based on current plans, estimates and expectations and are made pursuant to the
Private Securities Litigation Reform Act of 1995. Forward-looking statements are
based on known and unknown risks, assumptions, uncertainties and other factors. The
Company's actual results, performance, or achievements may differ materially from any
future results, performance, or achievements expressed or implied by such forward-looking
statements.
The Company undertakes no obligation to publicly update or revise any forward-looking
statement. The financial information included in this presentation for the quarter
ended September 30, 2011 is based on unaudited data. Please refer to our Annual Report
on Form 10-K and other SEC reports for a discussion of those factors that could
impact our future results. 1 |
 Meeting
Agenda •
Welcome
Remarks,
Corporate
Overview
&
P.R
Business
-
Richard
L.
Carrión,
Chairman
&
CEO
10:00 a.m. (9:00 a.m. EST)
•
U.S.
Business
Overview
-
Carlos
J.
Vázquez,
President,
U.S.
Operations, EVP
10:30 a.m. (9:30 a.m. EST)
•
Credit
Risk
Management
-
Lidio
V.
Soriano,
Risk
Management, EVP
10:50 a.m. (9:50 a.m. EST)
•
Puerto
Rico
Mortgage
Market
Overview
-
Gilberto
Monzón,
Consumer
Business, EVP
11:10 a.m. (10:10 a.m. EST)
•
Break
11:30 a.m. (10:30 a.m. EST)
•
Earnings Potential
-
Jorge A. Junquera, CFO, SEVP
11:45 a.m. (10:45 a.m. EST)
•
Strategy
Moving
Forward
-
Richard
L.
Carrión,
Chairman
&
CEO
12:05 p.m. (11:05 a.m. EST)
•
Q&A
12:20 a.m. (11:20 a.m. EST)
2 |
 Corporate
Overview |
 Senior Management
Team 4
Richard L. Carrión
•
Chairman of the Board since 1993 and CEO since 1994
•
President from 1991 to January 2009 and since May 2010
•
BS (Wharton School of the University of Pennsylvania), MS of information technology
(M.I.T.) Jorge A.
Junquera
Carlos J. Vázquez
Ignacio Alvarez
•
EVP and Chief Legal Officer since 2010
•
Partner of Pietrantoni Mendez & Alvarez LLP, a San Juan, Puerto Rico-based law firm,
from September 1992 to June 2010 •
BSFS
(Georgetown
University
School
of
Foreign
Service),
JD
(Harvard
Law
School)
Lidio V. Soriano
•
EVP of Corporate Risk Management Group since August 2011
•
Independent
Consultant,
CFO
of
W
Holding,
Inc.
from
October
2008
to
April
2010
•
BS (Cornell University), MBA (Tulane University)
•
CFO and Head of Finance Group since 1996 and SEVP since 1997
•
President of U.S. Operations from 1996 to 2001 and Head of Retail Banking from 1988 to 1995
•
Investment Officer and Treasurer from 1976 to 1987
•
BS (King’s College), graduate of the Securities Industry Institute at the Wharton School
of Business •
President of U.S. Operations since September 2010 and EVP since February 2010 and from March
1997 to April 2004 •
Head of Individual Credit Operations in Puerto Rico from April 2004 to September 2010 and
Individual Banking in the United States from January 2010 to September 2010 •
BS (Rensselaer Polytechnic Institute), MBA (Harvard Business School) |
 Senior Management
Team 5
Juan Guerrero
•
EVP of Financial and Insurance Services Group since 2004
•
Director of Popular Securities since 1995, Popular Insurance since 2004 and Director of the
Popular Family of Funds since 2001 •
BS (Fairfield University), MBA (Indiana University)
Gilberto Monzón
•
EVP of Individual Credit Group since October 2010 and Head of Puerto Rico Mortgage Business
from July 1998 to October 2010 •
BS (Sacred Heart University), Graduate School of Mortgage Banking, U.S. Mortgage Bankers
Association •
Government
Relations
Committee
American
Bankers
Association
in
Washington,
D.C.
and
Residential
Board
of
Governors
MBA
of
America
Eduardo Negrón
•
EVP since 2008, Head of Administration Group since December
2010
•
Deputy Chief Legal Officer and Director of Government Affairs from 2005 to 2008
•
BA
(University
of
South
Florida),
CPA
since
1987,
JD
(University
of
Puerto
Rico)
Néstor Obie Rivera
•
EVP
of
Retail
Banking
and
Operations
since
April
2004
and
Head
of
Bank
Operations,
Real
Estate,
Information
Technology
and
Fraud
and
Security
since
2009
•
Head of Individual Banking from 1988 to 2004
•
BA
(University
of
Puerto
Rico),
MBA
(Inter
American
University),
graduate
studies
at
University
of
Wisconsin
•
1967 U.S. Air Force, Lackland AFB, 3276 Cryptographic Squadron
Eli Sepúlveda
•
EVP since February 2010 and Head of Puerto Rico Commercial Credit Group since January
2010 •
Head of Popular Auto from 2004 to 2008
•
BA (University of Puerto Rico), graduate studies at University of Wisconsin
Ricardo Toro
•
EVP of Commercial Banking Group since 2010
•
Head of Corporate Banking Division from 1989 to 2009
•
BA (University of Puerto Rico), MBA (University of Puerto Rico)
|
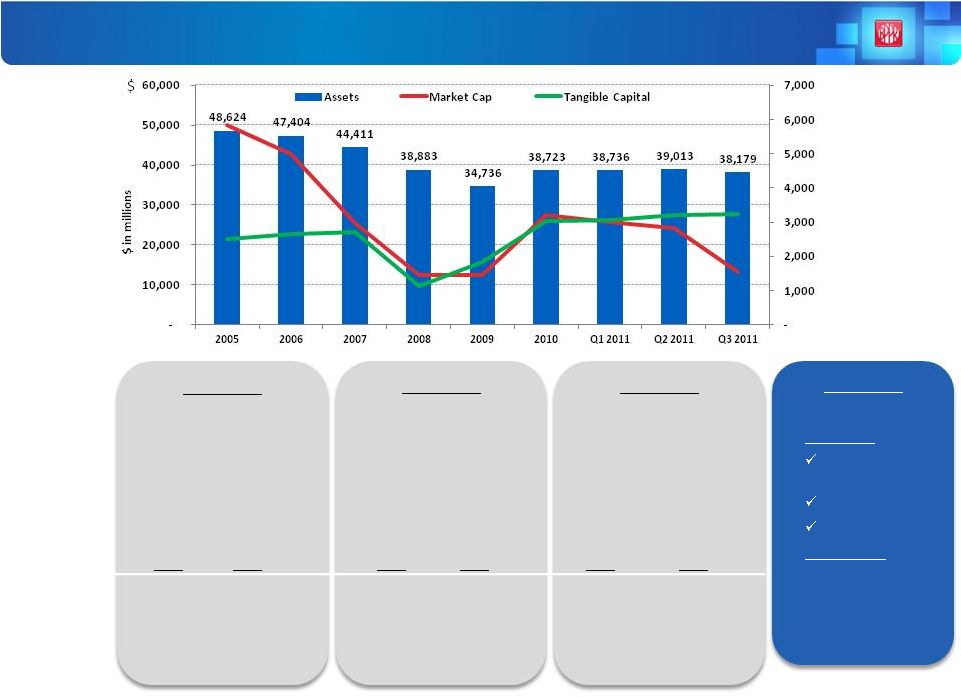 2005/2006
•
Aggressive diversification
consisting of Puerto Rico,
the U.S. and the Caribbean;
revenue diversification
through EVERTEC
•
Focused on growing U.S.
banking and mortgage
businesses (PFH & ELOAN )
2007/2008
•
Reorganized U.S. operation
to exit high-risk businesses
•
Shut down U.S. consumer
finance businesses (PFH &
ELOAN) & Texas region
•
Acquisition of P.R. Citibank
retail business
2009/2010
•
Focused on ensuring
capital and BHC liquidity
adequacy and participating
in the P.R. banking
consolidation
•
Raised common equity,
completed EVERTEC sale &
Westernbank transaction
2005
2006
2007
2008
2009
2010
Net Income (Loss)
$541M
$358M
($64M)
($1,244M)
($574M)
$137M
Tier 1 Common
7.98%
7.73%
7.08%
3.19%
6.39%
10.95%
NPL/Loans
1 .77%
2.24%
2.75%
4.67%
9.60%
7.58% ¹
FTEs
13,210
12,508
12,303
10,587
9,407
8,277
Where We Are Coming From
6
Strategy
Financials
2011/2012
•
Focused on:
Puerto Rico
Credit risk profile
improvement
Efficiency
Asset acquisition
United States
•
Repositioning as
community bank
•
Continued attention
to asset quality and
efficiency
¹
Excludes covered loans |
 Puerto Rico
Business Overview |
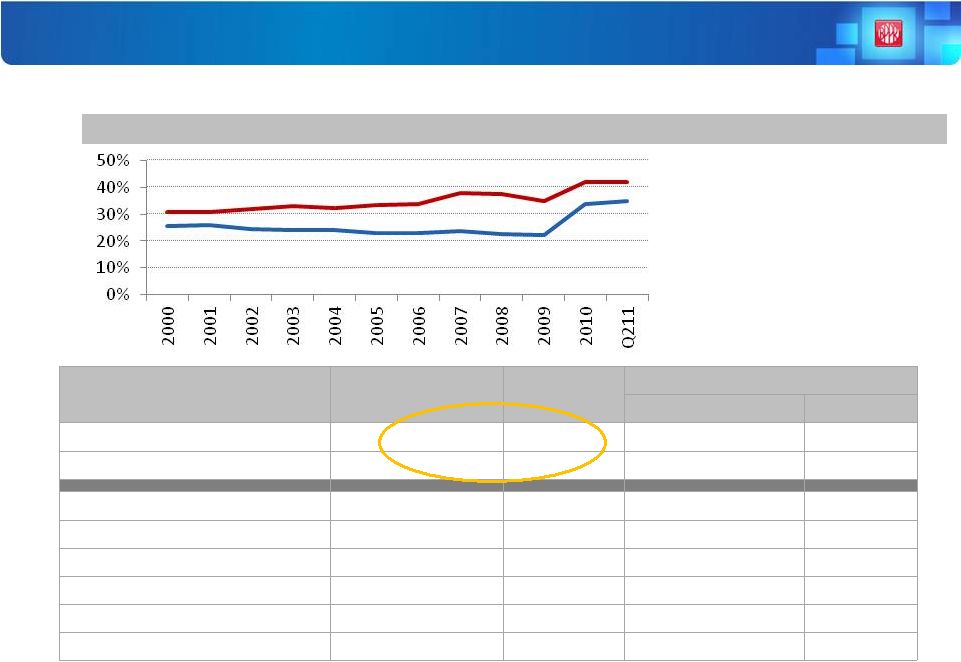 P.R. Franchise
Value Built Over 118 Years Category
Market Position as of
Q2 2011
Market Share
as of Q2 2011
Top Competitor
Institution/Group
Share
Total Deposits (Net of Brokered)
1
42%
Credit Unions
12%
Total Loans
1
35%
FirstBank
16%
Commercial & Construction Loans
1
41%
FirstBank
22%
Credit Cards
1
40%
MBNA
28%
Mortgage Loan Production
1
33%
Scotiabank
13%
Personal Loans
2
33%
Credit Unions
52%
Auto Loans/Leases
3
16%
Reliable
24%
Assets Under Management
3
14%
UBS
48%
•
Indisputable, sustained market leadership
Source: Puerto Rico Office of the Commissioner
of Financial Institutions
8
Source: Puerto Rico Office of the Commissioner of Financial Institutions
Market Share Trend (2000 –
2011)
Total Deposits (Net of Brokered)
Total Loans |
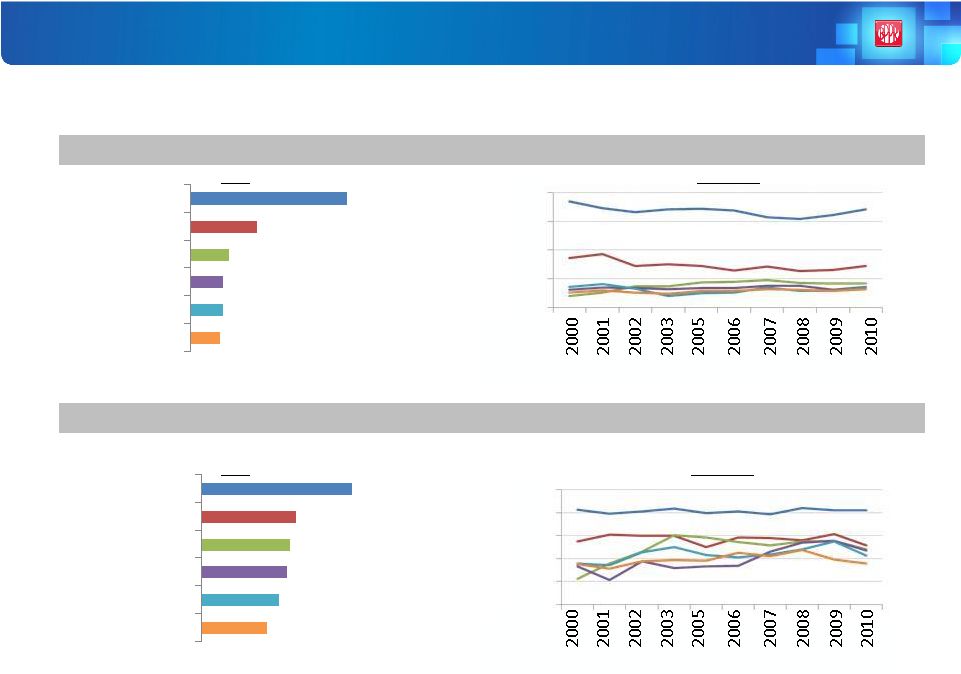 P.R. Franchise
Value Built Over 118 Years •
Extensive, loyal client base
Client Penetration (%)
Loyalty Rate (%)
Percentage of interviewees who state they are clients of each institution. Source:
Inmark/Gaither International, Financial Behavior of Individuals Puerto Rico, 2010.
2010
2000-2010
2010
2000-2010
Percentage of an institution’s clients who consider it as their main institution.
Source: Inmark/Gaither International, Financial Behavior of Individuals Puerto Rico, 2010.
9
68
29
17
14
14
13
BPPR
Credit Unions
Doral
Scotiabank
Santander
FirstBank
82
51
48
47
42
36
BPPR
Credit Unions
Doral
Scotiabank
Santander
FirstBank
80
60
40
20
0
100
80
60
40
20
0 |
 Puerto
Rico
Business
–
Financial
Overview
10
$ in millions (unaudited)
2008
2009
2010
Q1 11
Q2 11
Q3 11
Net Interest Income
$959
$867
$1,096
$295
$325
$321
Non Interest Income
532
667
448
122
114
118
Gross Revenues
1,491
1,534
1,544
417
439
439
Provision (BPPR)
(519)
(623)
(610)
(51)
(71)
(131)
Provision (covered WB)
(16)
(49)
(26)
Provision for loan losses
(519)
(623)
(610)
(67)
(120)
(157)
Personnel Expenses
(305)
(300)
(318)
(74)
(78)
(78)
Other Expenses
(426)
(454)
(542)
(126)
(139)
(143)
Expenses
(731)
(754)
(860)
(200)
(217)
(221)
Tax (Expense) Benefit
(14)
1
(27)
(146)
38
(7)
Net Income
$227
$158
$47
$4
$140
$54
NIM
3.94%
3.80%
4.43%
4.78%
5.19%
5.15%
•
Strong and stable top line despite challenging economic conditions
•
Healthy net interest margin
•
Impacted by high credit costs |
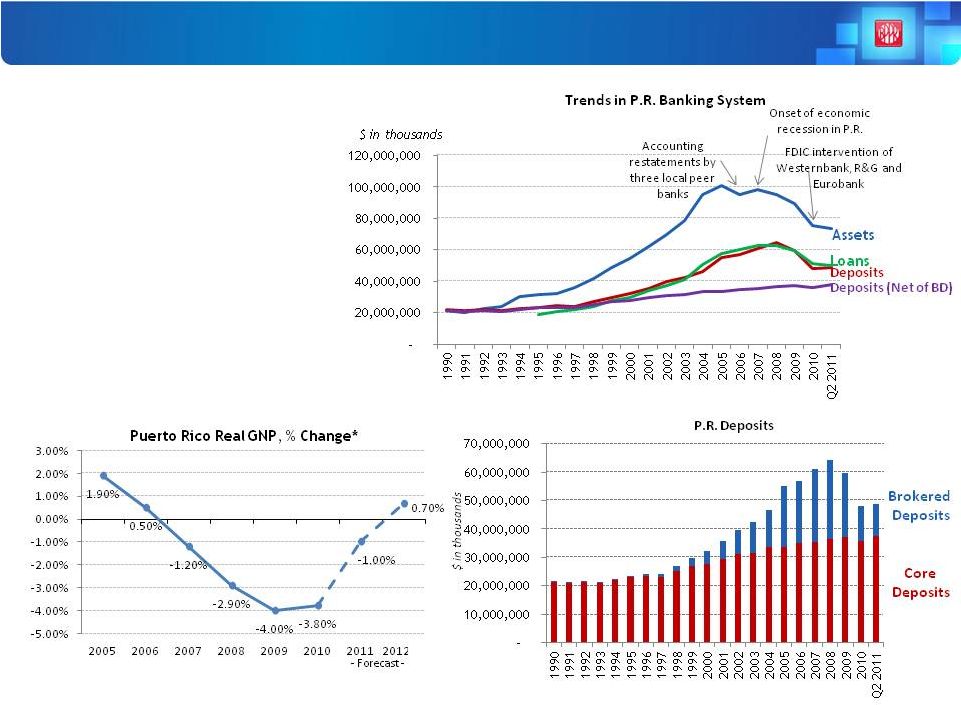 11
P.R. Banking Sector Has Been Contracting
•
Contraction in the market
as a result of economic
recession
•
High loan to deposit ratio
•
Reliance on brokered
deposits
•
Further consolidation
likely
*Source: Puerto Rico Planning Board / Fiscal Years |
 Westernbank
Acquisition •
Vital strategic transaction that further solidified our leadership position amid a contracting
market •
Largest FDIC-assisted transaction in 2010 in terms of assets
•
Required important actions
Common equity raise of $1.15 billion
Sale of 51% of EVERTEC
•
Execution highlights
At the time of acquisition, Westernbank had 1,444 employees and BPPR had 6,150, compared to
current BPPR headcount of 6,910
•
Increases in customer-oriented areas, as well as critical groups such as Risk Management,
Loss Mitigation and Commercial Loans
Conversion completed in August 2010, only four months after the acquisition
Net increase of 12 branches
Added
over
100k
clients
who
did
not
have
a
relation
with
BPPR
at
the
time
of
the
acquisition
Retained 85% of clients and 91% of deposits one year after the transaction
Positive financial impact
12 |
 Puerto
Rico
Business
–
Moving
Forward
13
Credit Risk
Management
Efficiency
Asset Growth
•
Continue to pursue sales of
loans held for sale
•
Emphasize resolution of large
cases
•
Further boost loss-mitigation
area
•
Redesign key processes
•
Implement retirement window
•
Consolidate branches
•
Continue to identify
opportunities to add low-risk
assets that can be managed
within existing infrastructure
Actions Taken
Moving Forward
•
Closed consumer-finance subsidiary
•
Strengthened collection areas
•
Emphasized loss-mitigation efforts
•
Sold $128 million (book value) in
construction and commercial loans
•
Controlled headcount and people-
related costs
•
Redesigned key processes
•
Acquired Citibank’s local retail
operations
•
Acquired R&G’s servicing rights
•
Acquired Westernbank
•
Acquired mortgage loans from
FirstBank
•
Acquired Citibank’s local AAdvantage
portfolio |
 U.S.
Business Overview U.S. Business Overview |
 Popular’s
U.S. Operations Have Changed Dramatically Since 2008 15
Operation was repositioned from a unit-based national lender to
a footprint-based relationship community bank
¹
Total Loans includes held-for-sale loans |
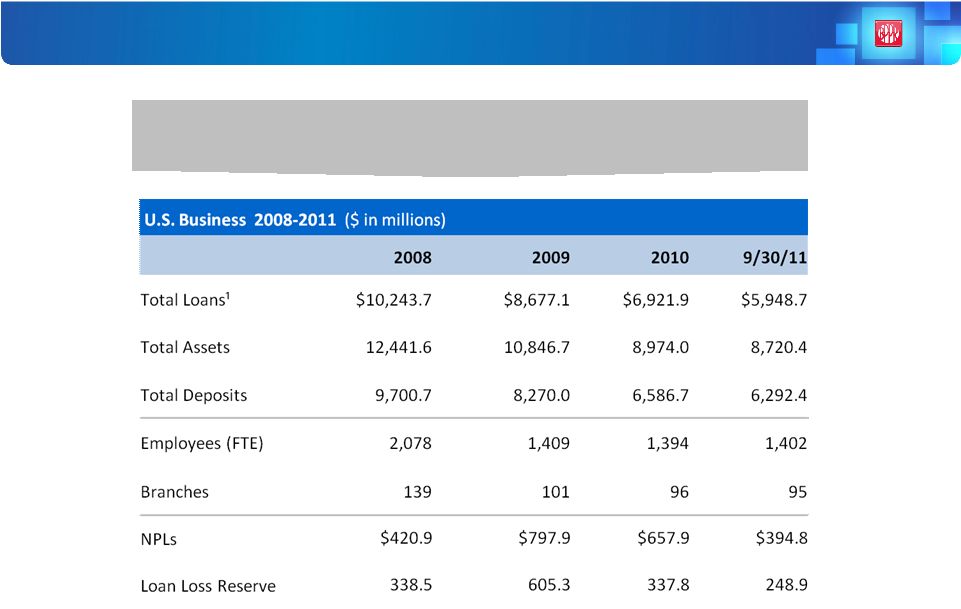
 U.S. Business
-
Loans by Category 2008-2011 ($ in millions)
2008
2009
2010
9/30/11
2008 -
9/30/11
Other Loans Held for Sale
$2.7
$1.8
$1.7
$3.2
$0.5
Commercial Real Estate
2,673.4
2,583.6
2,237.2
2,225.7
-447.7
Construction & Land Dev.
873.7
653.1
368.9
223.7
-650.0
Multifamily Real Estate Loans
817.6
909.1
955.6
899.1
81.5
Commercial & Industrial Loans
2,325.4
1,811.1
1,221.1
576.7
-1,748.7
Leases
366.6
56.8
30.2
17.9
-348.7
Other Commercial Loans
208.4
187.7
187.3
399.5
191.1
1-4 Family Mortgage & Helocs
2,799.7
2,368.8
1,847.8
1,538.0
-1,261.7
Other Consumer Loans
176.2
105.1
72.1
64.9
-111.3
Total Consolidated Loans¹
10,243.7
8,677.1
6,921.9
5,948.7
-4,295.0
Popular’s U.S. Operations Have Changed Dramatically Since 2008
16
The
loan
portfolio
continues
to
evolve,
reflecting
the
strategy
shift
¹
Total Loans includes held-for-sale loans |
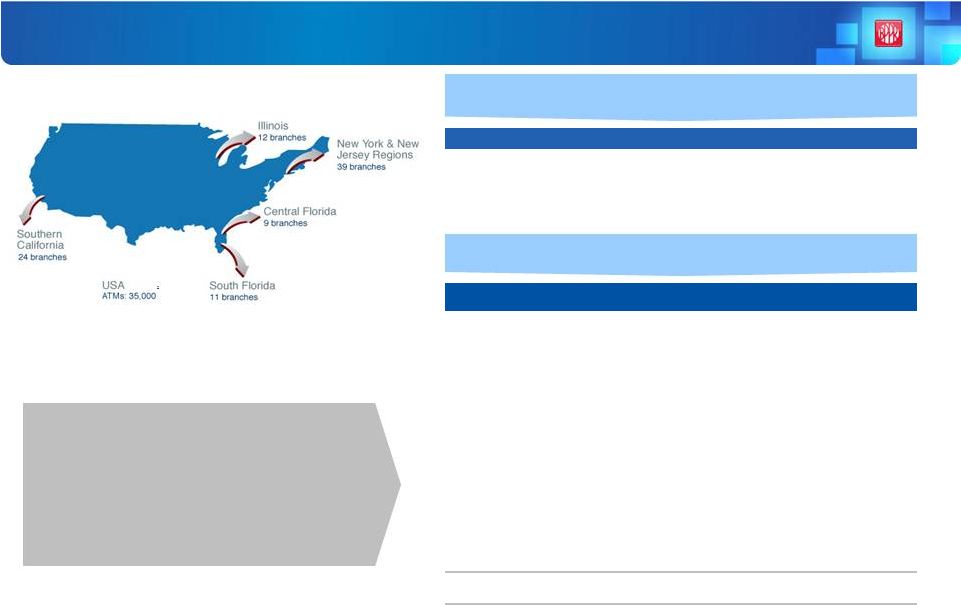 Popular
Community
Bank
(PCB)
/
BPNA
–
Overview
17
9/30/11
CA
IL
NY
CFL
SFL
Total
Total Deposits
$1,284.2
$792.9
$2,208.0
$235.7
$842.9
$5,363.7 ¹
No. of Branches
24
12
39
9
11
95
2008
2009
2010
9/30/11 YTD
Pre Provision Revenue
$492.5
$345.7
$364.6
$277.2
Pre Provision Revenue
% of Assets
3.96%
3.19%
4.06%
4.24%
Net interest income
$351.5
$315.5
$310.0
$222.9
Net Interest Margin
2.99%
2.90%
3.33%
3.62%
Provision
$472.3
$782.3
$402.2
$52.7
Personnel Expenses
$182.5
$117.4
$98.5
$73.4
Other Expenses
247.9
196.8
199.8
114.8
Total Expenses
$430.4
$314.2
$298.3
$188.2
Pre Provision Pre Tax
Revenues (less expenses)
$62.1
$31.5
$66.3
$89.0
Net (Loss) Income
($524.8)
($725.9)
($340.3)
$33.4
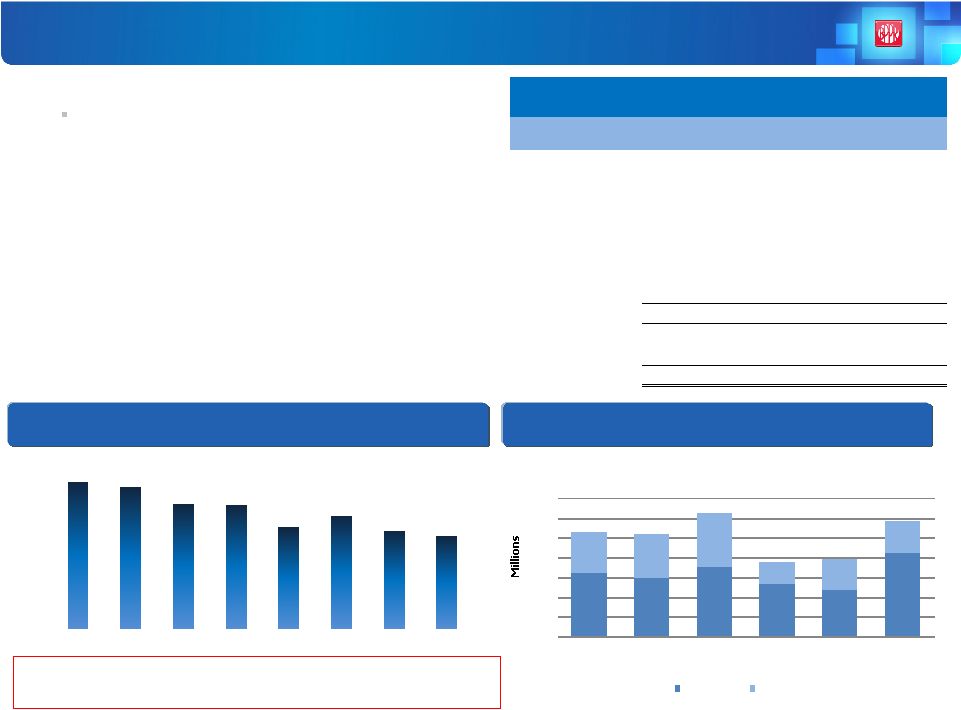
Regional Retail Breakdown
$ in millions
U.S. financial performance has reflected
this restructuring process while
maintaining stable revenues
Financial Performance
$ in millions
¹
Excludes deposits captured by E-LOAN
²
²
35,000 ATMs were added in September 2010 in leading national and
local merchant locations |
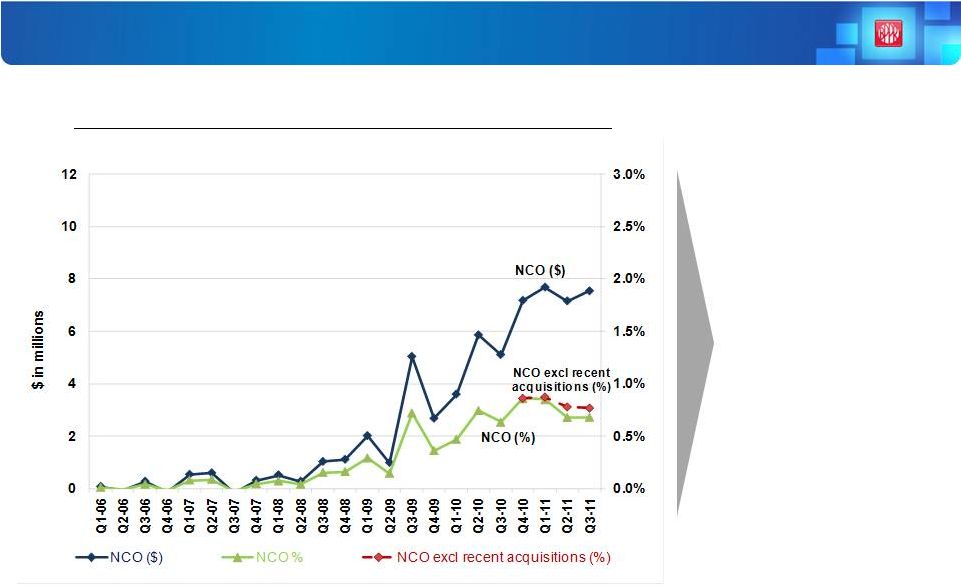
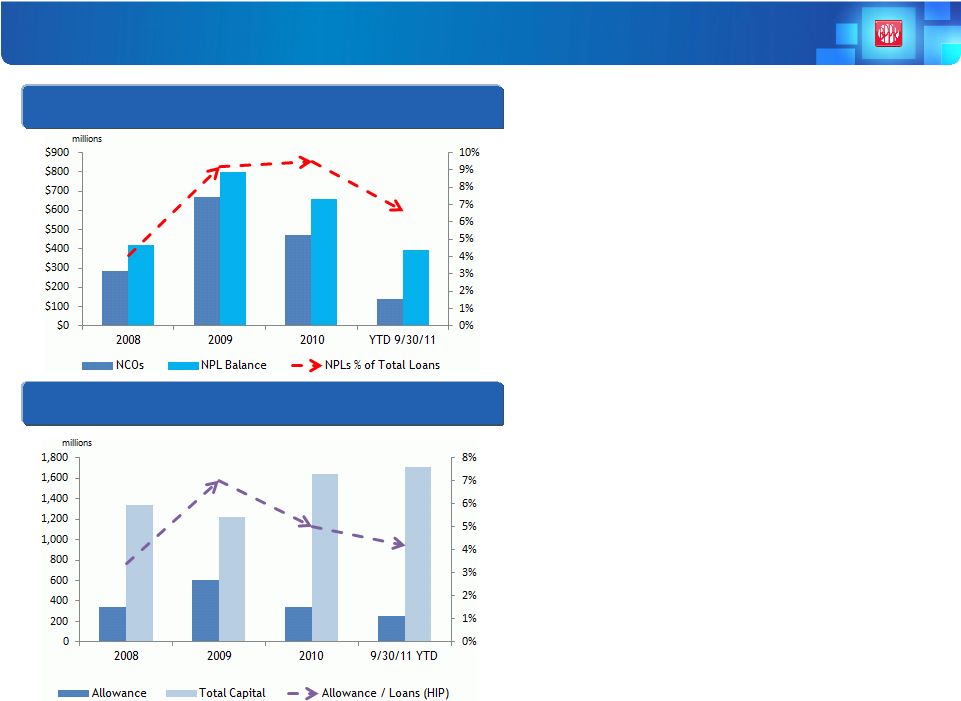 PCB/BPNA Credit
Trends Have Driven The Changes in Financial Performance 18
•
Net charge offs and non-performing loans
peaked in 2009; have since decreased and
should continue to improve
•
Non-performing loans as a percentage of total
portfolio have declined despite a shrinking loan
portfolio
•
Credit improvement is supported by strong
allowance for loan losses and capital. Allowance
to loans is tracking the reduction in losses
•
U.S.
mainland
operations
carry
a
fully
reserved
$1.3
billion¹
DTA.
Upon
our
return
to
profitability, some of that asset value may be
recaptured
Credit Metrics U.S.
Capital & Allowance
¹
Includes $697 million related to consolidated BPNA and $556 million
related to discontinued operations and U.S. holding Co.
|
 U.S.
Business
–
Moving
Forward
•
Solidify trend of improving credit quality
Continue roll off or disposition of discontinued portfolios
Actively and aggressively manage existing classified portfolio
New asset growth in selected categories
•
Enhance community banking strategy and profitability
Improve client mix, maximize value of rebranding
Organic or transactional growth in targeted portfolios within footprint
Continue rationalization of our retail network with locations, product
characteristics, product offering and channel expansion
•
As financial conditions and regulatory environment allow, consider strategic
options as far as markets served, products, segments and use of capital
19 |
 Risk
Management Risk Management |
 21
•
Board committee oversees risk program
•
Risks
are
jointly
managed
by
business
units
and
centralized
risk
group
•
Centralized risk group is responsible for assessing and reporting risk positions
•
Management committees provide direct oversight
•
Simple community banking business model
•
Diversified product mix with concentration in Puerto Rico
•
Strong capital position
•
Closely monitor liquidity and interest-rate risk positions
•
Contained within our core markets and customer base
•
Exposures and appetite are monitored regularly
•
Exposures are stress tested to ensure adequacy
•
No proprietary trading; limited derivatives (client driven)
•
Investment
portfolio
–
mostly
U.S.
and
P.R.
government
exposure
•
Operational risk –
contained losses
•
Compliance
and
reputational
risk
–
continuous
monitoring
21
Risk Model Overview
Governance
Risk Appetite
Market and Other Risks
Credit Risk |
 Credit Risk
Management •
Management’s top policy-making body
•
Reviews the adequacy of the allowance for loan losses, establishes credit
exposure reporting standards and monitors asset quality
•
Independent
of
the
lending
function
–
identifies,
measures
and
controls
credit
risk
•
Monitors credit underwriting standards and loan portfolio
•
Performs credit-process reviews of lending units
•
Segregated the underwriting, lending and workout functions from the core
commercial business.
•
Bolstered P.R.’s consumer loss mitigation function
•
Strengthened loan review and appraisal units to facilitate early identification of
risks and enhance controls
•
Adopted measures to strengthen credit-administration procedures, including a more
thorough review of a significant portion of our commercial loan portfolio in P.R. This
initiative follows a similar action taken in the U.S. in late 2010
22
Credit Risk
Management
Division
Credit Strategy
Committee
Recent
Actions |
 Loan Portfolio
Detail •
Diversified across two regions:
P.R. –
76% U.S. –
24%
•
There are no significant borrower or industry concentrations
•
Top 20 non-covered relationships are only 4% of
total loans
•
Low average loan size; commercial $476K and
mortgage $129K
•
Early-stage delinquencies have declined $533million or 45%
since December 2009
•
Approximately 50% of the inflow of NPLs in the P.R.
commercial portfolio were current as of Q3 11 in their
payments, vs. 17% in Q2 and 14% in Q1
30 –
89 DPD / Total Loans
5.0%
4.9%
4.3%
4.2%
3.5%
3.9%
3.4%
3.2%
4Q09
1Q10
2Q10
3Q10
4Q10
1Q11
2Q11
3Q11
Commercial & Construction NPL Inflows
Excludes Covered Loans & LHFS
Excludes Covered Loans & LHFS
Total
NPLs:
$2,276
($ in millions)
23
Loan Portfolio -
Q3 2011
$ in millions
PR
US
Total
% of
Total
Loans Held to Maturity:
Construction
$
164 $ 194
$ 358
1%
C&I
2,801
1,051
3,852
15%
CRE-
Owner Occupied
2,285
895
3,180
13%
CRE-
Non-Owner
Occupied
1,327
2,230
3,557
14%
Consumer
3,518
743
4,261
17%
Mortgage
4,633
833
5,466
22%
Total Non-Covered
14,728
5,946
20,674
82%
Covered Loan-
WB
4,512
-
4,512
18%
Total
$ 19,240
$ 5,946
$ 25,186
100%
161
149
174
133
116
212
104
109
136
57
79
77
2Q10
3Q10
4Q10
1Q11
2Q11
3Q11
$-
$50
$100
$150
$200
$250
$300
$350
PR Inflows
US Inflows
$1,732
$1,625
$1,614
$1,572
$2,344
$2,330
$2,313
|
 Credit
Summary Credit quality information excludes covered assets
$ in millions
Q3 11
Q2 11
Q3 11 vs.
Q2 11
Q1 11
YTD 2011
Loans Held to Maturity (HTM)
$20,674
$20,658
0.08%
$20,676
$20,674
Loans Held for Sale
369
509
-27.50%
570
369
Covered Loans
4,512
4,616
-2.25%
4,730
4,512
Total Loans
$25,555
$25,783
-0.88%
$25,976
$25,555
Non-performing assets (NPAs)
$2,167
$2,187
-0.91%
$2,235
$2,167
NPLs HTM to loans HTM
8.38%
7.86%
0.52%
7.81%
8.38%
Net charge-offs
$135
$133
1.50%
$139
$408
Net charge-offs to average loans
2.64%
2.59%
0.05%
2.74%
2.65%
Provision for loan losses
$151
$96
57.29%
$60
$306
Provision for loan losses to net
charge-offs
111.50%
71.76%
39.74%
42.86%
75.04%
Allowance for loan losses
$693
$690
0.43%
$727
$693
Allowance for loan losses to
loans (excl. LHFS)
3.35%
3.34%
0.01%
3.52%
3.35%
Allowance for loan losses to
NPLs HTM
39.99%
42.45%
-2.46%
45.07%
39.99%
•
NPAs
have
decreased
since
Q1
11
principally
driven
by
the
sale
of
non-performing
loans
•
NCOs
have remained relatively flat, although experiencing variability within the portfolios
•
Provision
for
loan
losses
has
increased
significantly
since
Q1
11
•
Allowance
&
allowance
to
loans
coverage
ratio
remained
relatively
flat
24 |
 Methodology
ASC 450
General
Reserve-
ASC
450
(FAS
5)
+
Specific
Reserve-
ASC
310
(FAS
114)
=
Total
ALLL
Current
Status
•
Use of trend factor makes our provision highly sensitive to recent losses
•
We will continue to review and enhance our ALLL as our loan portfolio and market
conditions change
Allowance for Loan and Lease Losses (ALLL)
•
Base
loss
-
36-month
average
net
charge-offs
for
commercial
and
construction
portfolios
and 18-month average net charge-offs for consumer and mortgage portfolios
•
Trend
factor-
Replaces base-loss period with 6-month average net charge-offs when it is
higher than base loss (up to determined cap)
•
Environmental
factor
-
Captures
certain
credit
and
economic
trends
and
factors
not
considered in base loss
•
General
reserve
-
Based
on
historical
losses
adjusted
for
a
recent
trend
factor
+
environmental factor.
•
Specific
reserve
-
Attributed
to
loans
deemed
impaired
(mostly
commercial
loans
over
$1 million)
25 |
 Non-covered
NPLs Total NPLs
$1,731,671
Total Non-Covered Reserves
$692,500
Coverage Ratio
40%
Lifetime Charge-offs (C/O)
$447,187
ALLL + C/O / NPL
66%
NPLs subject to specific impairment analysis (49%)
NPLs
$843,031
-
Mortgage -
$205,758 (2% Lifetime C/O)
-
Comm./Const.
-
$630,453
(25%
Lifetime
C/O)
ALLL
$26,747
Coverage Ratio
3%
Lifetime Charge-offs (C/O)
$243,273
ALLL + C/O / NPL
32%
NPLs not subject to specific analysis (51%)
NPLs
$888,640
Remaining Reserves*
$665,753
Coverage Ratio
75%
Lifetime Charge-offs (C/O)
$203,914
ALLL+ C/O / NPL
98%
ALLL and NPL coverage ratio remain adequate
•
49% of NPLs subject to specific analysis
Prompt charge-off of impaired portion of
collateral dependent commercial and
construction loans
Charge-off history of P.R. mortgage loans
•
Excluding loans subject to specific analysis and
charge-offs, NPL coverage ratio stands at 98%
NPL Coverage Ratio & Moving Forward
As
of
September
30,
2011
-
$
in
thousands
26
* Includes $32 million in specific reserve for certain performing loans.
As
of
September
30,
2011
-
$
in
thousands
As
of
September
30,
2011
-
$
in
thousands
•
Credit quality indicators in the U.S. continue reflecting signs of stability across all
portfolios •
P.R.’s economic situation continues to place pressure on our commercial and
mortgage portfolios. We are confident that our review led to early identification of
risks |
 Puerto Rico
Mortgage Business Puerto Rico Mortgage Business |
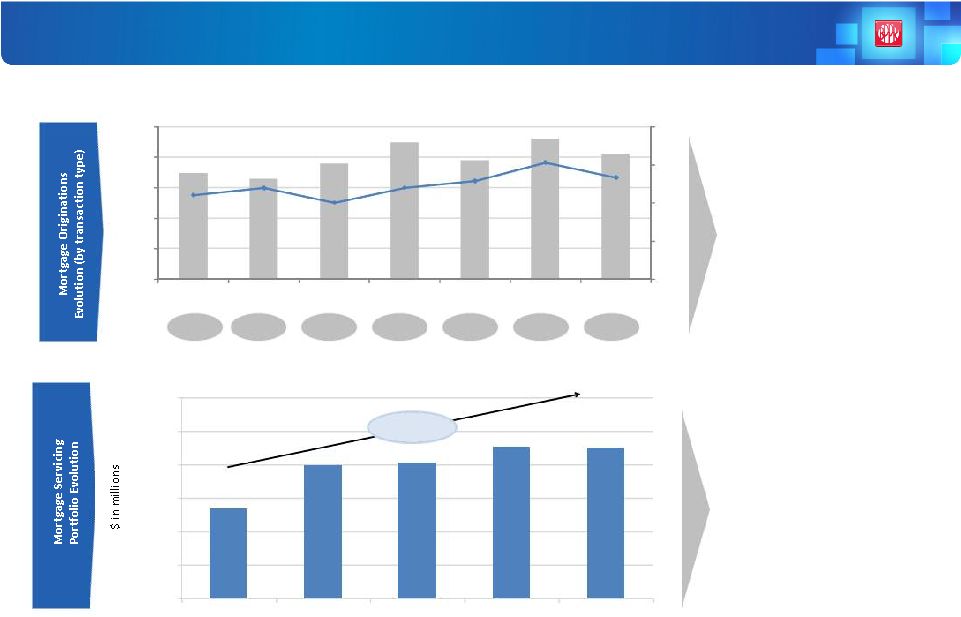 P.R. Mortgage
Business Continues to Increase Market Share 28
27%
27%
28%
30%
32%
33%
32%
Market
share of
originations
Popular has a strong,
seasoned team and most
extensive origination
network
•
Mortgage originations during
2011 have been higher than in
2010 in each of the first three
quarters
•
Popular’s market share has been
consistently improving (from 16%
in 2005 to 32% in Q3 11)
•
Popular’s largest competitor has
a market share of 13%
Popular is the largest
servicer and issuer on
the island
•
The mortgage servicing
portfolio has increased by
70% (from $13.5B to $22.5B)
during the last four years
•
As of Q3 11, the mortgage
servicing portfolio has the
following mix: 69% GNMA &
GSEs, 13% private labels and
18% BPPR owned
Source: Internal Reports, Office of the Commissioner of Financial Institutions of the
Commonwealth of Puerto Rico (OCFI) 277
327
55%
60%
50%
60%
65%
77%
67%
0
100
200
300
400
0%
20%
40%
60%
80%
100%
Q1-2010
Q2-2010
Q3-2010
Q4-2010
Q1-2011
Q2-2011
Q3-2011
New Money
Purchased
Mix
(%)
Total Originations
(in
millions $)
13,512
22,538
-
5,000
10,000
15,000
20,000
25,000
30,000
2007
2008
2009
2010
Q3 2011
+ 1.7X |
 Book
Value (1)
(in millions)
%
Insured
(2)
Average Loan
Balance
(in thousands)
# of Loans
Uninsured
90+ DPD
(in millions)
Uninsured
90+ DPD
(%)
$4,189.4
7.4%
$116.4
36,000
$340.6
8.1%
443.9
43.1%
111.8
3,971
103.0
23.2%
4,633.3
10.8%
115.9
39,971
443.6
(3)
12.3%
1,217.4
90.0
13,522
214.8
17.6%
Total Owned
$5,850.7
$109.4
53,493
$658.4
11.2%
Recourse
(Fannie Mae &
Freddie Mac)
$3,601.9
n/a
$103.9
34,651
$262.6
7.3%
Mortgage Portfolio Overview
P.R. Mortgage Portfolios
As of Sept. 30, 2011
29
•
More than 90% of portfolio is composed of fixed-rate mortgages (no mortgage broker business,
no ARMs)
•
Average loan balance of total owned portfolio is $109K
•
More than 7% of regular portfolio and 43% of repurchased portfolio is insured
•
Total uninsured delinquency of mortgage owned portfolio (excluding covered loans) is $444
million (1)
Book value net of credit losses
(2)
Insured does not consider MGIC (<2% of owned portfolio)
(3)
Does not include $137 million in mortgage TDRs below 90 DPD that were classified as
non-accrual status upon restructuring and $291 million in mortgage loans insured by
U.S. Sponsored Agencies and GNMA repurchased options Repurchased portfolio
Covered portfolio
Regular portfolio
Sub-Total
Owned
(excl.
covered portfolio) |
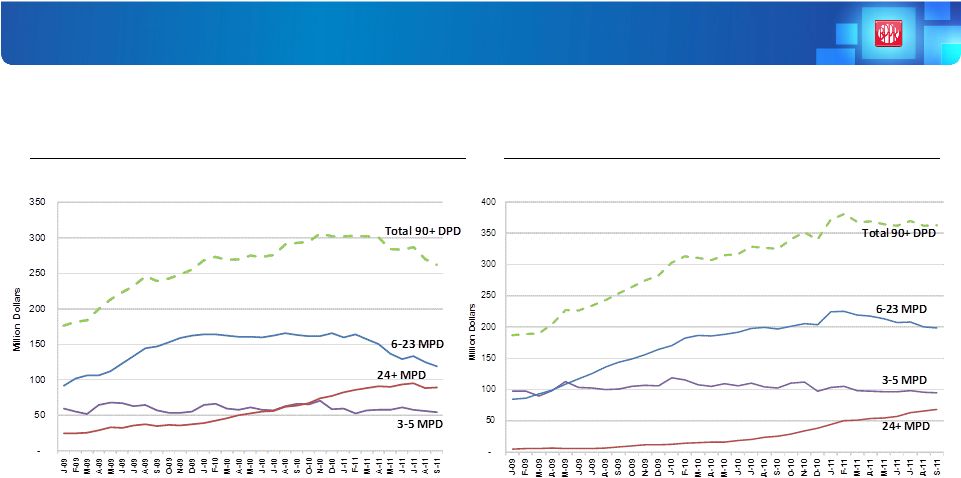 Total Delinquent
Balances are Decreasing in Both Regular & Recourse Portfolios. However, the 24+ MPD
Bucket Has Been Slower to Stabilize 30
Uninsured 90+ DPD $ Monthly Evolution
Regular portfolio
(1)
(1)
Excludes
regular
portfolio
serviced
by
others,
Popular
Finance,
Virgin
Islands
and
personal
loans
with
mortgage
guarantee
Uninsured 90+ DPD $ Monthly Evolution
Recourse portfolio + total repurchases
•
Stabilization
in
delinquency
is
mainly
driven
by
a
decrease
in
cases
entering
90+
DPD
and
an
increase
in
the
number of modifications
•
A new strategy launched during Q3 11 to control the increase in loans in the 24+ MPD bucket is
delivering positive results |
 Penetration of
Loss Mitigation (LM) in 90+ DPD buckets has been increasing, but opportunity to impact
more cases is still high 31
There is opportunity to increase the % of delinquent
loans modified by proactively reaching clients and
incorporating them into the LM pipeline
Active in
LM Pipeline
Previous
Alternative
Denied or
Withdrawn
No LM
History
28.1%
39.5%
Total 90+
DPD $
100%
% of
Total
Mortgage
Owned
90+
DPD
Dollars
(as
of
September
30,
2011)
•
Active cases in LM have
increased rapidly during 2011,
from 19% of total 90+ DPD
balance in January to 28% in
September
•
Until modified, all loans are
subject to normal collections
efforts. However, there is a
significant opportunity to
continue increasing LM
penetration given that 40% of
the 90+ DPD balance has
never been in the LM pipeline
during the last two years
•
70% of modified loans are
still performing after one year
21.6%
10.9%
(1)
Excludes regular portfolio serviced by others, Popular Finance, Virgin Islands and personal
loans with mortgage guarantee
1 |
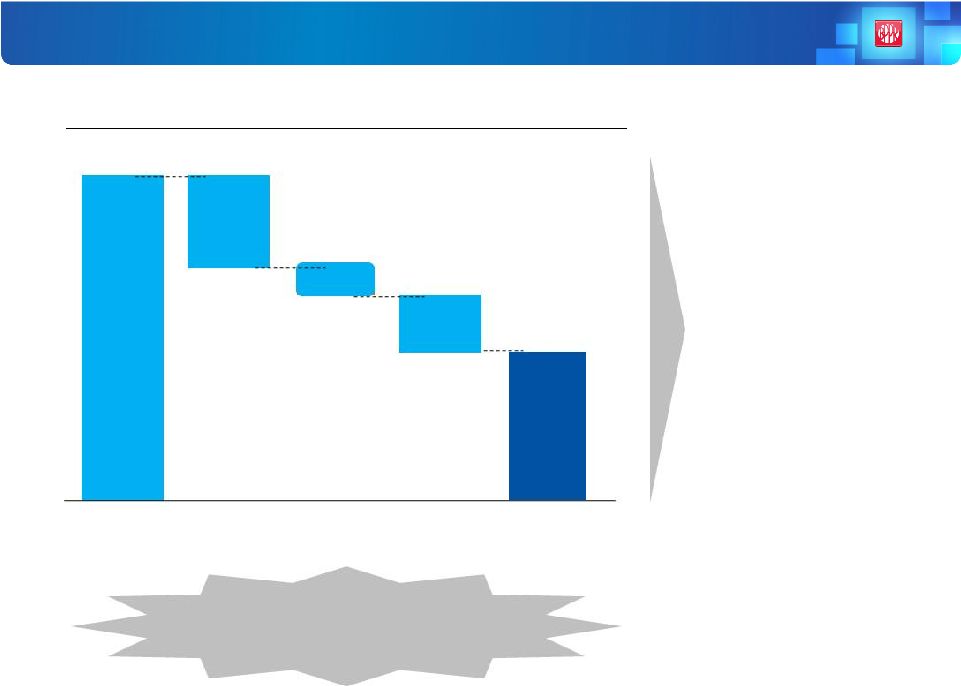
 Credit Losses
Increased from 2008 to 2010 and Stabilized in 2011 32
Historical
Puerto
Rico
Segment
Mortgage
Credit
Losses
2006
-
2011
•
Mortgage net losses
have historically stayed
at very low levels
•
Despite increase in
NCOs from 2008 to
2010, losses remain low
(<1% of total portfolio)
•
Credit losses have
stabilized in 2011 |
 P.R. Mortgage
Business – Moving Forward
33
•
Continue to maintain or grow market share under expected favorable conditions
in 2012
Continue capitalizing on broad package of government incentives,
which have
been extended until December 2012 with some minor modifications
Combine extensive distribution network with targeted campaigns
Create a team to capitalize on HARP Program opportunities
•
Continue
to
lower
regular
portfolio
delinquency
levels
by
maintaining
a
high
volume of loan modifications
Ensure that most delinquent cases are reviewed by the LM team to
reach
more clients in the most cost-effective way |
 Earnings
Potential |
 •
The company reported net income of $27.5 million in Q3 11
•
Tepid results show that in spite of strong and consistent top line revenues, high credit
costs are the main factor preventing Popular from reaching its profitability potential
•
Although
the
local
economy
is
leveling
off,
credit
costs
remain
elevated
due
to
a
lack
of
job
growth and high energy costs
•
Loan demand remains challenging both in P.R. and on the mainland, but we have made several
opportunistic portfolio purchases on the island
•
We continue to drive the cost of liabilities down by achieving lower costs of deposits and
accelerating payments to the FDIC Note
•
We are rolling out a plan to reduce expenses and increase efficiency in our distribution
system •
Recent deterioration in credit-quality metrics is causing volatility in the level of
reserve for loan losses
•
Credit costs are expected to remain elevated in Q4, but we continue to expect improvement in
2012
Current Situation: Driving forward against economic headwind
35 |
  Assumptions:
•
Net Interest Income decreases due to a contraction of the margin, partially offset by slight
increases in loan volumes •
Non-Interest Income increases slightly from higher deposit and service fees in P.R. and
U.S., higher brokerage and insurance commissions and lower amortization of the
indemnity asset in P.R. •
Expenses are lower due to cost-control initiatives in P.R. , lower costs in managing NPLs
and lower FDIC expenses from improved asset quality
•
Provision for loan losses is reduced substantially due to more normalized levels of NPLs and
charge-offs, which require only 1-1¼
% provision on loans
•
Taxes increase due to higher pretax income in P.R.; approximately 10% of net income from U.S.
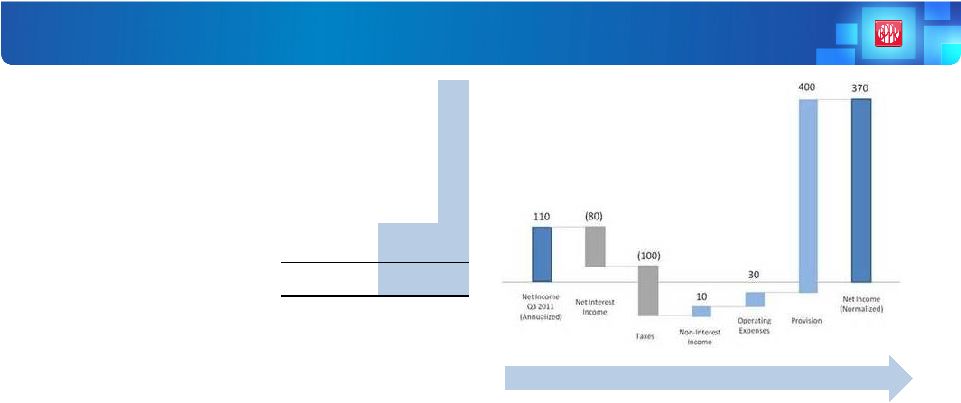
operations Potential Normalized Net Income –
Before Revenue Enhancing Opportunities
(in millions except per share data)
Annualized
Normalized
Q3 2011
Net Interest Income
1,480
$
1,400
$
Non-int Income
490
500
Top Line Revenue
1,970
1,900
Expenses
(1,130)
(1,100)
Pre-provision Net Revenue
840
800
Provision
(705)
(305)
Pretax Income
135
495
Tax
(25)
(125)
Net Income
110
$
370
$
Earning Assets
33,000
$
33,700
$
Equity
3,800
4,170
$
Margin
4.48%
4.15%
Efficiency
57.37%
57.89%
EPS
0.11
$
0.36
$
Variances leading to normalized earnings
36
Obtaining this level of normalized income and the time required to obtain it are subject to
various conditions, including continuing to reduce credit costs and economic scenarios in
the U.S. and P.R. We believe we should make significant progress during 2012 and be about
half way there at the end of 2012 |
 As economic
conditions and the regulatory environment allow, we will take advantage of opportunities
as they arise •
Dominant franchise in P.R. is capable of ramping up profitability as the economy
improves •
Lower expenses from the unwinding of the credit-risk management platform currently in
place to administer very high levels of defaulting loan portfolios
•
Potential gain on sale from our 49% ownership interest in EVERTEC
•
Potential realization of $1.3B DTA on the mainland
•
Well positioned to benefit from further consolidation of the financial industry in P.R.
•
Higher levels of interest rates provide:
•
additional margin upside given that 74% of our balance sheet is funded with deposits
•
leverage opportunity with tax exempt Federal securities to improve the bottom line in P.R.
with minimum credit risk and modest interest-rate risk
•
Ample capital structure gives us the ability to take advantage of opportunities
Further Opportunities to Enhance Net Income
37 |
 Strategy
Moving Forward |
 Moving
Forward 39
Puerto Rico
Strategy
•
Improve credit-risk profile
•
Expand efficiency efforts
•
Add low-risk assets to existing
infrastructure
BPNA
Challenges
Other Considerations
•
Pace of economic recovery in P.R.
•
Challenging regulatory environment
•
Continue implementation of
community banking strategy
•
Keep focus on asset quality and
efficiency
•
TARP repayment
•
Possibility of acquisition in the U.S. in the future
•
Deferred tax asset |
 Investor
Day Investor Day
December 2, 2011
December 2, 2011
San Juan, Puerto Rico
San Juan, Puerto Rico |