Attached files
| file | filename |
|---|---|
| 8-K - FORM 8-K - Sabra Health Care REIT, Inc. | a8kinvestorpresentation121.htm |
BANK OF AMERICA MERRILL LYNCH 2011 LEVERAGED FINANCE CONFERENCE
COMPANY PRESENTATION
December 1, 2011
FORWARD LOOKING STATEMENTS 2 Certain information contained in this presentation includes forward-looking statements. Forward-looking statements include statements regarding our expectations, beliefs, intentions, plans, objectives, goals, strategies, future events or performance and underlying assumptions and other statements that are not statements of historical facts. These statements may be identified, without limitation, by the use of expects, believes, intends, should or comparable terms or the negative thereof. Forward-looking statements in this presentation also include all statements regarding expected future financial position, results of operations, cash flows, liquidity, financing plans, business strategy, the expected amounts and timing of dividends and distributions, projected expenses and capital expenditures, competitive position, growth opportunities, potential acquisitions and plans and objectives of management for future operations. These statements are made as of the date hereof and are subject to known and unknown risks, uncertainties, assumptions and other factors-many of which are out of the Company's control and difficult to forecast-that could cause actual results to differ materially from those set forth in or implied by our forward-looking statements. These risks and uncertainties include but are not limited to: our dependence on Sun Healthcare Group, Inc. (Sun) until we are able to further diversify our portfolio; our ability to qualify and maintain our status as a real estate investment trust (REIT); changes in general economic conditions and volatility in financial and credit markets; our ability to pursue and complete acquisitions, including the ability of the parties to pending acquisitions to satisfy specified closing conditions, and the costs and management attention required to do so; the significant amount of our indebtedness; covenants in our debt agreements that may restrict our ability to make acquisitions, incur additional indebtedness and refinance indebtedness on favorable terms; increases in market interest rates; the impact of health care reform legislation on our business; the impact of reductions in CMS reimbursement on the business of our tenants; competitive conditions in our industry; and other factors discussed from time to time in our news releases, public statements and/or filings with the Securities and Exchange Commission (the SEC), especially the Risk Factors sections of our Annual and Quarterly Reports on Forms 10-K and 10-Q. The Company assumes no, and hereby disclaims any, obligation to update any of the foregoing or any other forward-looking statements as a result of new information or new or future developments, except as otherwise required by law. Forward-looking information is provided by us pursuant to the safe harbor established under the Private Securities Litigation Reform Act of 1995 and should be evaluated in the context of these factors. We disclaim any intent or obligation to update these forward-looking statements. TENANT INFORMATION This presentation includes information regarding Sun. Sun is subject to the reporting requirements of the SEC and is required to file with the SEC annual reports containing audited financial information and quarterly reports containing unaudited financial information. Sun's filings with the SEC can be found at www.sec.gov. This presentation also includes information regarding the tenants of each of (i) Texas Regional Medical Center at Sunnyvale (TRMC), (ii) Oak Brook Health Care Center (Oak Brook), and (iii) four skilled nursing facilities - Broadmeadow Healthcare, Capitol Healthcare, Pike Creek Healthcare and Renaissance Healthcare (collectively, the Cadia Portfolio) - we have acquired. The information related to these tenants that is provided in this presentation has been provided by the tenants or, in the case of Sun, derived from Sun's public filings or provided by Sun. We have not independently verified this information. We have no reason to believe that such information is inaccurate in any material respect. We are providing this data for informational purposes only. Tenant information related to the two skilled nursing facilities we acquired on September 30, 2011 - Honey Hill Care Center and Manokin Manor Nursing & Rehabilitation Center (collectively, the Aurora Portfolio) - and the facilities acquired subsequent to September 30, 2011 - Windcrest Alzheimer's Care Center and Wesley Woods Alzheimer's Care Center (collectively, the Encore Portfolio) and Creekside Senior Living - are not included in the information presented because they were not acquired until on or after the period presented.
NON-GAAP FINANCIAL MEASURES 3 This presentation includes the following financial measures defined as non-GAAP financial measures by the SEC: EBITDA, EBITDAR, EBITDAR(M), funds from operations (FFO), adjusted FFO (AFFO) and normalized AFFO, FFO per share, AFFO per diluted share and normalized AFFO per diluted share. These measures may be different than non-GAAP financial measures used by other companies and the presentation of these measures is not intended to be considered in isolation or as a substitute for financial information prepared and presented in accordance with U.S. generally accepted accounting principles. Facility EBITDAR(M) is defined as earnings before interest, taxes, depreciation, amortization, rent (EBITDAR) and management fees (EBITDARM) for a particular facility accruing to the operator/tenant of the property (not the Company), for the period presented. Facility EBITAR(M) Coverage is defined as Facility EBITDAR(M) divided by the same period cash rent for a particular facility. Tenant EBITDAR is defined as Facility EBITDAR, as defined herein, plus EBITDAR for the period presented for all other operations of any entities that guarantee the tenants' lease obligations to the Company. Tenant EBITDAR Coverage is defined as Tenant EBITDAR divided by the same period rent for all of our facilities plus rent expense for other operations of any entity that guarantees the tenant's lease obligations to the Company. EBITDA is defined as earnings before interest, taxes, and depreciation and amortization. FFO is calculated in accordance with The National Association of Real Estate Investment Trusts' (NAREIT) definition of funds from operations, and is defined as net income, computed in accordance with GAAP, excluding gains or losses from real estate dispositions, plus real estate depreciation and amortization. AFFO is defined as FFO excluding non-cash revenues (including straight-line rental income adjustments and amortization of acquired above/below market lease intangibles), non-cash expenses (including stock-based compensation expense and amortization of deferred financing costs), and acquisition pursuit costs. Normalized AFFO represents AFFO adjusted for one-time start-up costs. Reconciliations of these non-GAAP financial measures to the GAAP financial measures we consider most comparable are included under Reconciliation of Net Income to EBITDA, Funds from Operations (FFO), Adjusted Funds from Operations (AFFO) and Normalized AFFO in this presentation.
Company Update and Investment Highlights

SABRA HAS COMPETITIVE INDUSTRY PRESENCE 5
Formation
Formed by Opco / Propco split of Sun Healthcare Group
Independently traded as of November 2010 (NASDAQ: SBRA)
Structured as an UPREIT
B+/B2 rating (S&P / Moody's) - S&P upgrade from B on September 30, 2011
Portfolio
98 health care investments(1)
76 skilled nursing facilities
86 leased to Sun
Presence in 24 states
Capitalization
$369.8 mm equity market cap(1)
$697.6 mm total enterprise value(2)
$213.2 mm of capital invested(3)
$100.0 mm revolver with accordion feature
Management
Management team with over 50 years total operational experience
Rick Matros, Chairman & CEO
Harold Andrews, CFO
Talya Nevo-Hacohen, CIO
(1) As of November 22, 2011. (2) Based on September 30, 2011 Net Debt which consists of $56.4 million cash and $384.2 million debt, and closing share price of $10.03 as of November 22, 2011. (3) As of November 22, 2011 and since separation from Sun.
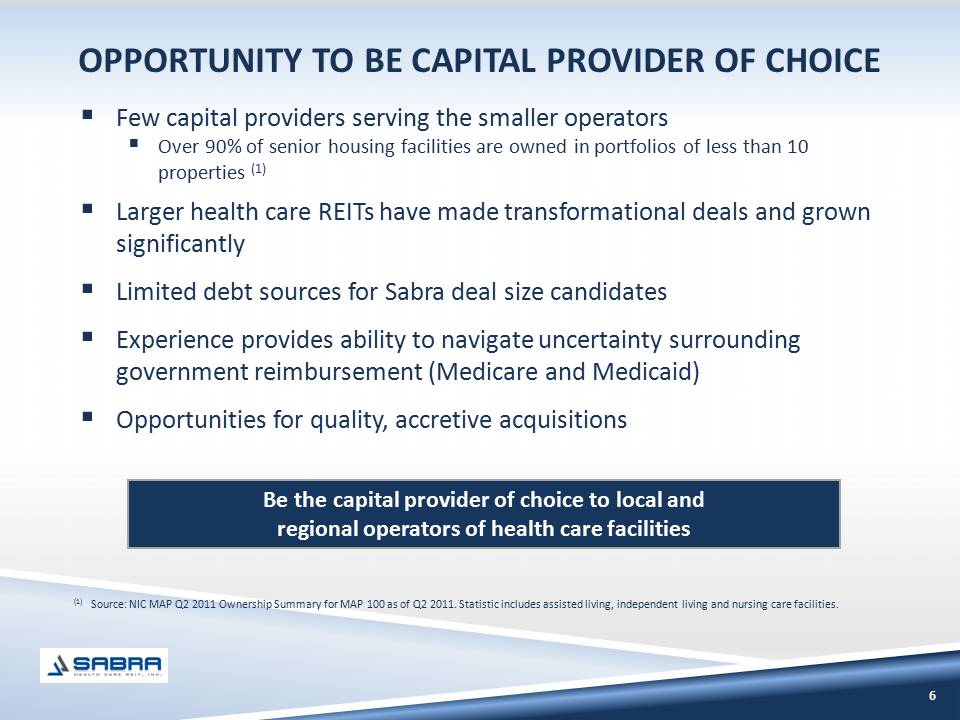
OPPORTUNITY TO BE CAPITAL PROVIDER OF CHOICE
Few capital providers serving the smaller operators
Over 90% of senior housing facilities are owned in portfolios of less than 10 properties (1)
Larger health care REITs have made transformational deals and grown significantly
Limited debt sources for Sabra deal size candidates
Experience provides ability to navigate uncertainty surrounding government reimbursement (Medicare and Medicaid)
Opportunities for quality, accretive acquisitions
(1) Source: NIC MAP Q2 2011 Ownership Summary for MAP 100 as of Q2 2011. Statistic includes assisted living, independent living and nursing care facilities.
Be the capital provider of choice to local and
regional operators of health care facilities
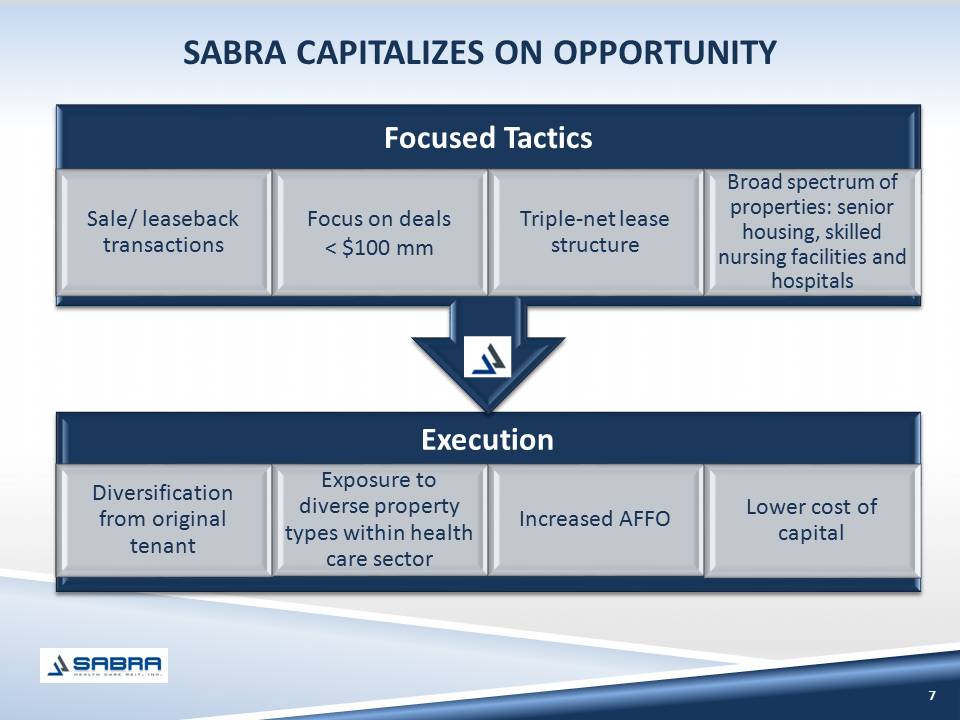
SABRA CAPITALIZES ON OPPORTUNITY
Focused Tactics
Execution
Diversification from original tenant Exposure to diverse property types within health care sector
Increased AFFO
Lower cost of capital
Sale/ leaseback transactions Focus on deals < $100 mm Triple-net lease structure Broad spectrum of properties: senior housing, skilled nursing facilities and hospitals
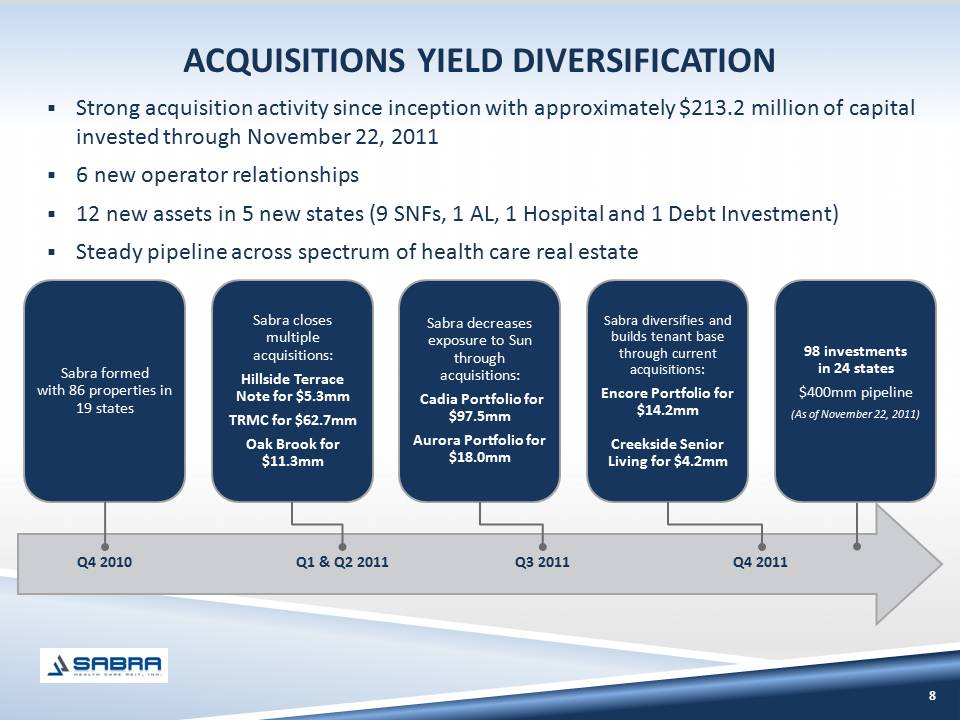
ACQUISITIONS YIELD DIVERSIFICATION
Strong acquisition activity since inception with approximately $213.2 million of capital invested through November 22, 2011
6 new operator relationships
12 new assets in 5 new states (9 SNFs, 1 AL, 1 Hospital and 1 Debt Investment)
Steady pipeline across spectrum of health care real estate
Sabra formed with 86 properties in 19 states Sabra closes multiple acquisitions: Hillside Terrace Note for $5.3mm TRMC for $62.7mm Oak Brook for $11.3mm Sabra decreases exposure to Sun through acquisitions: Cadia Portfolio for $97.5mm Aurora Portfolio for $18.0mm Sabra diversifies and builds tenant base through current acquisitions: Encore Portfolio for $14.2mm Creekside Senior Living for $4.2mm Q4 2010
Q1 & Q2 2011 Q3 2011
Q4 2011 98 investments in 24 states $400mm pipeline (As of November 22, 2011)
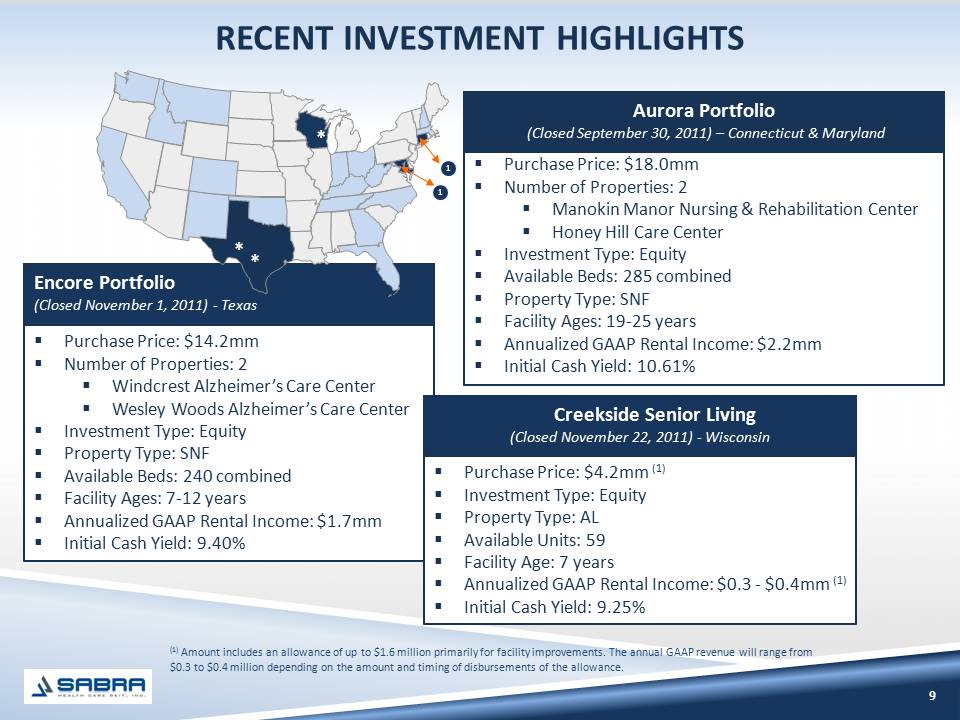
RECENT INVESTMENT HIGHLIGHTS
Encore Portfolio (Closed November 1, 2011) - Texas
Purchase Price: $14.2mm
Number of Properties: 2
Windcrest Alzheimer's Care Center
Wesley Woods Alzheimer's Care Center
Investment Type: Equity
Property Type: SNF
Available Beds: 240 combined
Facility Ages: 7-12 years
Annualized GAAP Rental Income: $1.7mm
Initial Cash Yield: 9.40%
Aurora Portfolio (Closed September 30, 2011) - Connecticut & Maryland
Purchase Price: $18.0mm
Number of Properties: 2
Manokin Manor Nursing & Rehabilitation Center
Honey Hill Care Center
Investment Type: Equity
Available Beds: 285 combined
Property Type: SNF
Facility Ages: 19-25 years
Annualized GAAP Rental Income: $2.2mm
Initial Cash Yield: 10.61%
Creekside Senior Living (Closed November 22, 2011) - Wisconsin
Purchase Price: $4.2mm (1)
Investment Type: Equity
Property Type: AL
Available Units: 59
Facility Age: 7 years
Annualized GAAP Rental Income: $0.3 - $0.4mm (1)
Initial Cash Yield: 9.25%
1) Amount includes an allowance of up to $1.6 million primarily for facility improvements. The annual GAAP revenue will range from $0.3 to $0.4 million depending on the amount and timing of disbursements of the allowance.
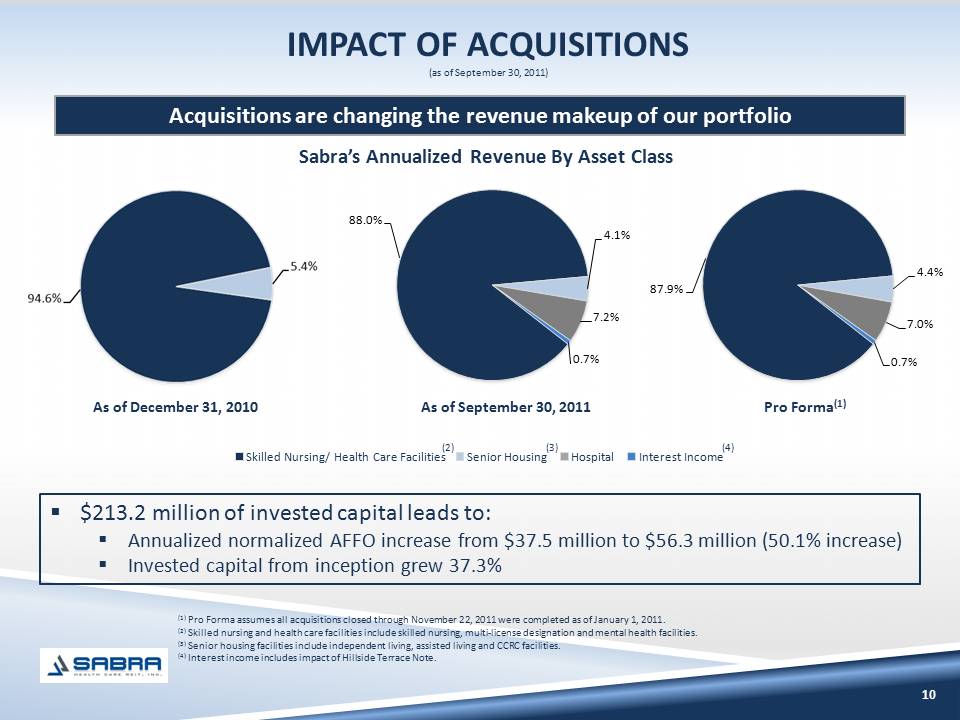
IMPACT OF ACQUISITIONS
As of December 31, 2010 As of September 30, 2011 Acquisitions are changing the revenue makeup of our portfolio (1) Pro Forma assumes all acquisitions closed through November 22, 2011 were completed as of January 1, 2011. (2) Skilled nursing and health care facilities include skilled nursing, multi-license designation and mental health facilities. (3) Senior housing facilities include independent living, assisted living and CCRC facilities. (4) Interest income includes impact of Hillside Terrace Note. Sabra's Annualized Revenue By Asset Class
$213.2 million of invested capital leads to:
Annualized normalized AFFO increase from $37.5 million to $56.3 million (50.1% increase)
Invested capital from inception grew 37.3%
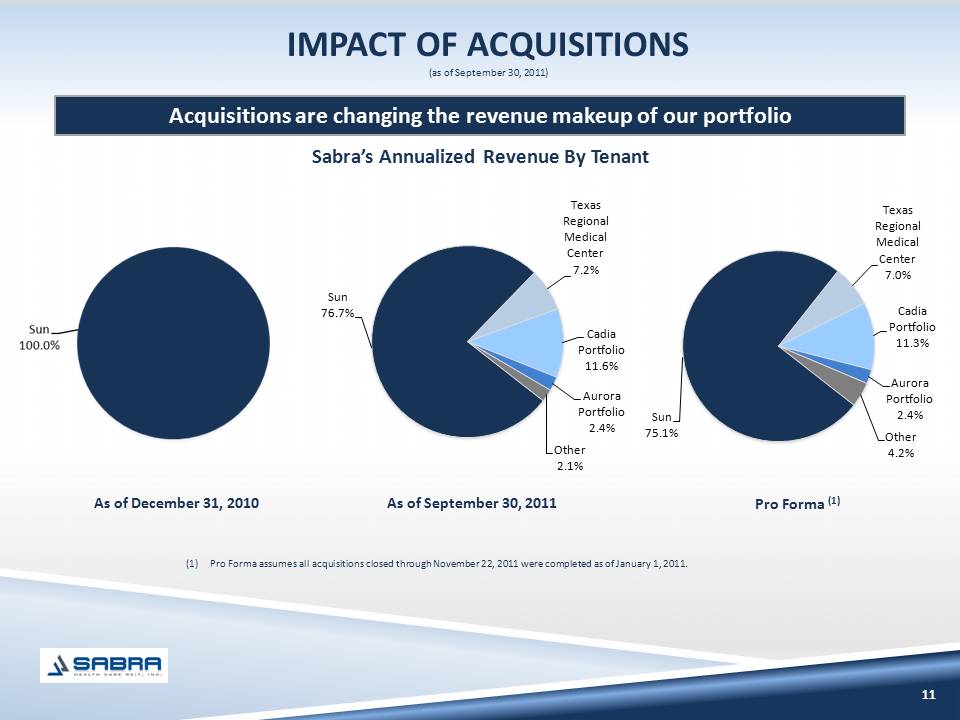
IMPACT OF ACQUISITIONS
Acquisitions are changing the revenue makeup of our portfolio
Sabra's Annualized Revenue By Tenant
(1)Pro Forma assumes all acquisitions closed through November 22, 2011 were completed as of January 1, 2011.
Texas Regional Medical Center
Cadia Portfolio
Aurora Portfolio
Other
Sun
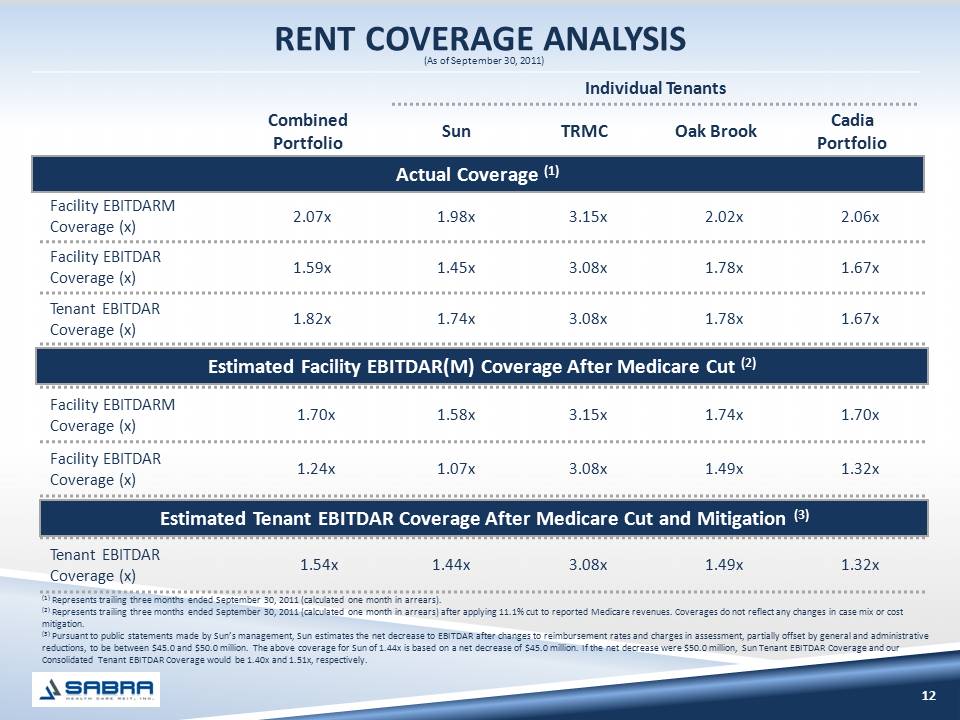
RENT COVERAGE ANALYSIS
Individual Tenants Combined Portfolio Sun TRMC Oak Brook Cadia Portfolio
Actual Coverage
Facility EBITDARM Coverage (x) 2.07x 1.98x 3.15x 2.02x 2.06x
Facility EBITDAR Coverage (x) 1.59x 1.45x 3.08x 1.78x
Tenant EBITDAR Coverage (x) 1.82x 1.74x 3.08x 1.78x 1.67x
Estimated Facility EBITDAR(M) Coverage After Medicare Cut (2)
Facility EBITDARM Coverage (x) 1.70x 1.58x 3.15x 1.74x 1.70x
Facility EBITDAR Coverage (x) 1.24x 1.07x 3.08x 1.49x 1.32x
Estimated Tenant EBITDAR Coverage After Medicare Cut and Mitigation (3)
Tenant EBITDAR Coverage (x) 1.54x 1.44x 3.08x 1.49x 1.32x
Represents trailing three months ended September 30, 2011 (calculated one month in arrears). (2) Represents trailing three months ended September 30, 2011 (calculated one month in arrears) after applying 11.1% cut to reported Medicare revenues. Coverages do not reflect any changes in case mix or cost mitigation. (3) Pursuant to public statements made by Sun's management, Sun estimates the net decrease to EBITDAR after changes to reimbursement rates and charges in assessment, partially offset by general and administrative reductions, to be between $45.0 and $50.0 million. The above coverage for Sun of 1.44x is based on a net decrease of $45.0 million. If the net decrease were $50.0 million, Sun Tenant EBITDAR Coverage and our Consolidated Tenant EBITDAR Coverage would be 1.40x and 1.51x, respectively.

Sabra's Portfolio & Primary Tenant
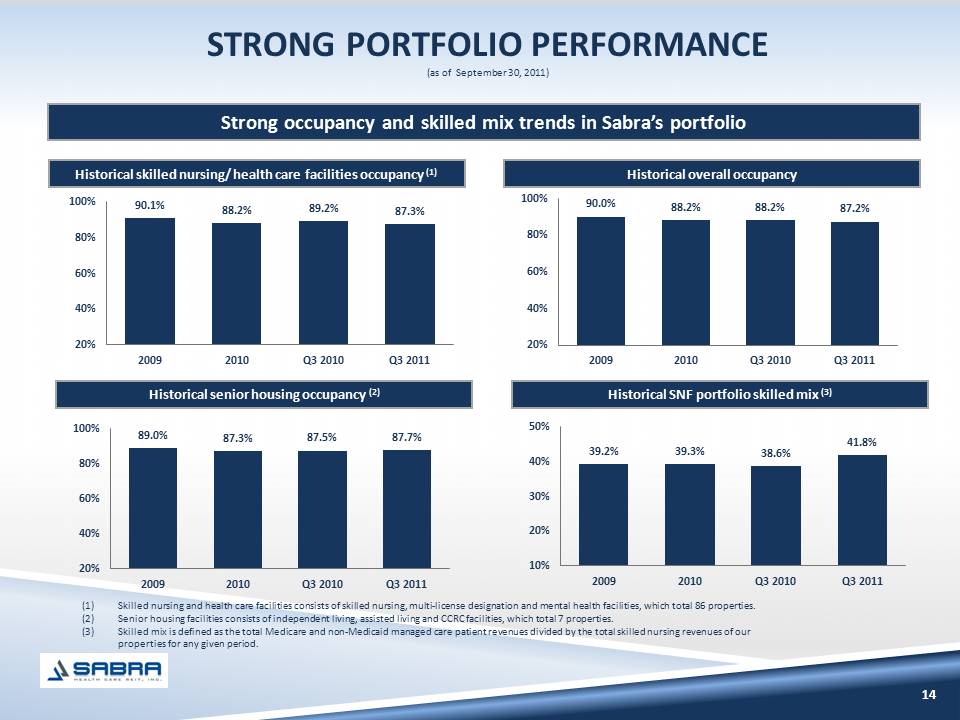
STRONG PORTFOLIO PERFORMANCE
Strong occupancy and skilled mix trends in Sabra's portfolio
90.1% 88.2% 89.2% 87.3%
20%
40%
60%
80%
100%
2009
2010
Q3 2010
Q3 201190.0% 88.2% 88.2% 87.2%
89.0% 87.3% 87.5%
87.7%
39.2% 39.3% 38.6% 41.8%
Historical skilled nursing/ health care facilities occupancy (1) Historical overall occupancy Historical senior housing occupancy (2)
Historical SNF portfolio skilled mix (3)
Skilled nursing and health care facilities consists of skilled nursing, multi-license designation and mental health facilities, which total 86 properties.
(2)Senior housing facilities consists of independent living, assisted living and CCRC facilities, which total 7 properties.
(3)Skilled mix is defined as the total Medicare and non-Medicaid managed care patient revenues divided by the total skilled nursing revenues of our properties for any given period.
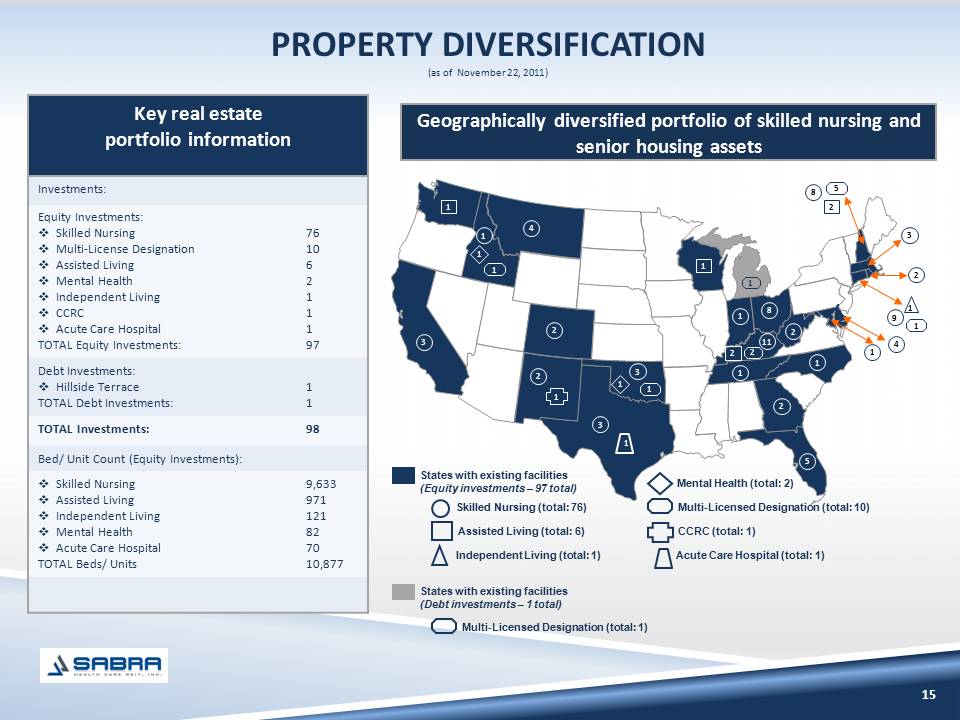
PROPERTY DIVERSIFICATION As of November 22, 2011
Key real estate
portfolio information
Equity Investments:
Skilled Nursing 76
Multi-License Designation 10
Assisted Living 6
Mental Health 2
Independent Living 1
CCRC 1
Acute Care Hospital 1
TOTAL Equity Investments: 98
Debt Investments: 1
Hillside Terrace
TOTAL Debt Investments: 1
Skilled Nursing 9,633
Assisted Living 971
Independent Living 121
Mental Health 82
Acute Care Hospital 70
TOTAL Beds/ Units 10,877
Geographically diversified portfolio of skilled nursing and senior housing assets
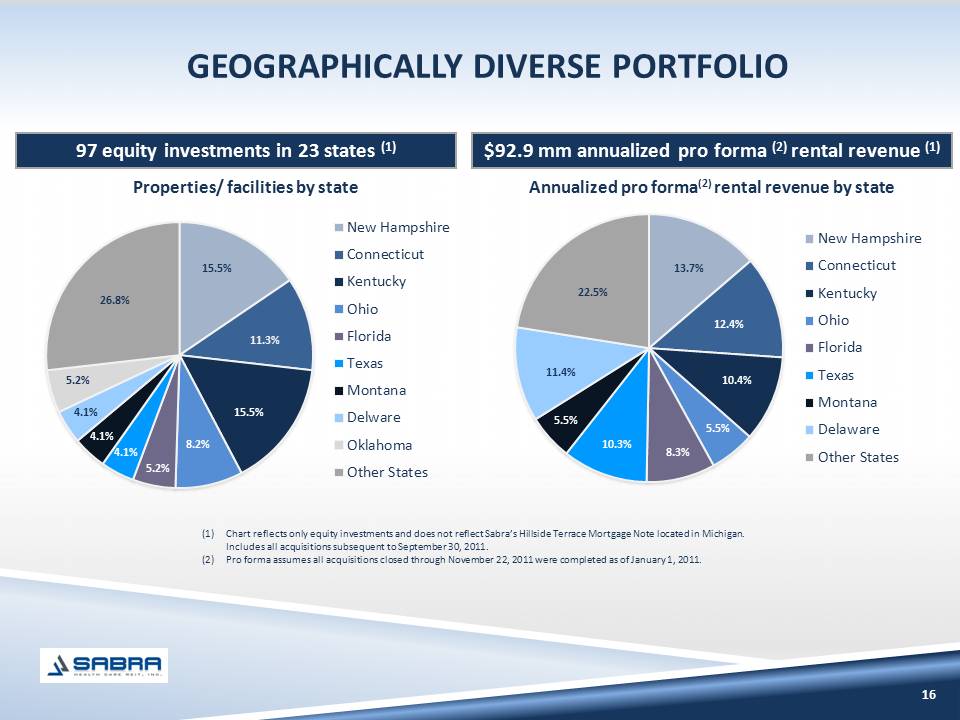
GEOGRAPHICALLY DIVERSE PORTFOLIO
97 equity investments in 23 states (1) $92.9 mm annualized pro forma (2) rental revenue (1)Properties/ facilities by state
Annualized pro forma(2) rental revenue by state
New Hampshire
Connecticut
Kentucky
Ohio
Florida
Texas
Montana
Delware
Oklahoma
Other States
Chart reflects only equity investments and does not reflect Sabra's Hillside Terrace Mortgage Note located in Michigan. Includes all acquisitions subsequent to September 30, 2011.
(2)Pro forma assumes all acquisitions closed through November 22, 2011 were completed as of January 1, 2011.
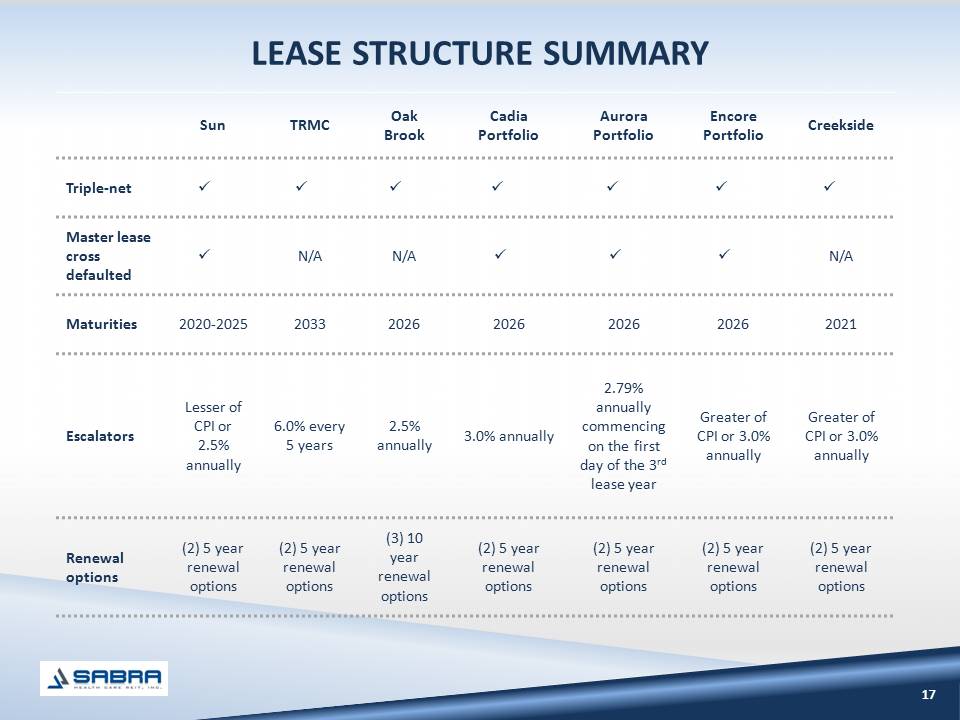
LEASE STRUCTURE SUMMARY
Sun
TRMC
Oak Brook
Cadia
Portfolio
Aurora Portfolio
Encore Portfolio
Creekside
Triple Net Master Lease cross defaulted Maturities Escalators Renewal Options
N/A 2020-2025 2033 2026 2021 Lesser of CPI or 2.5% annually 6.0% every 5 years 2.5% annually 2.79% annually commencing on the first day of the 3rd lease year Greater of CPI or 3.0% annually
(2) 5 year renewal options (3) 10 year renewal options
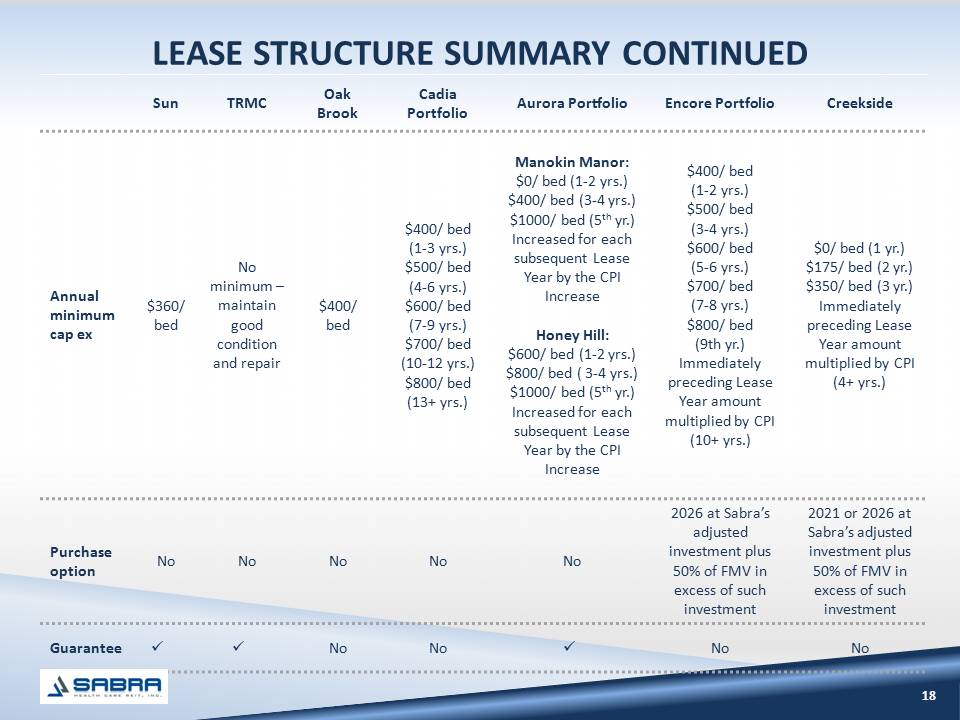
LEASE STRUCTURE SUMMARY CONTINUED
Sun
TRMC
Oak Brook
Cadia
Portfolio
Aurora Portfolio
Encore Portfolio
Creekside
Annual Minimum cap ex $360/ bed No minimum – maintain good condition and repair $400/ bed
$400/ bed (1-3 yrs.) $500/ bed (4-6 yrs.) $600/ bed (7-9 yrs.) $700/ bed (10-12 yrs.) $800/ bed (13+ yrs.) Manokin Manor: $0/ bed (1-2 yrs.) $400/ bed (3-4 yrs.) $1000/ bed (5th yr.) Increased for each subsequent Lease Year by the CPI Increase Honey Hill: $600/ bed (1-2 yrs.) $800/ bed ( 3-4 yrs.) $1000/ bed (5th yr.) Increased for each subsequent Lease Year by the CPI Increase $400/ bed (1-2 yrs.) $500/ bed (3-4 yrs.) $600/ bed (5-6 yrs.) $700/ bed (7-8 yrs.) $800/ bed (9th yr.) Immediately preceding Lease Year amount multiplied by CPI (10+ yrs.) $0/ bed (1 yr.) $175/ bed (2 yr.) $350/ bed (3 yr.) Immediately preceding Lease Year amount multiplied by CPI (4+ yrs.)
Purchase Option No No No No No 2026 at Sabra’s adjusted investment plus 50% of FMV in excess of such investment 2021 or 2026 at Sabra’s adjusted investment plus 50% of FMV in excess of such investment
Guarantee
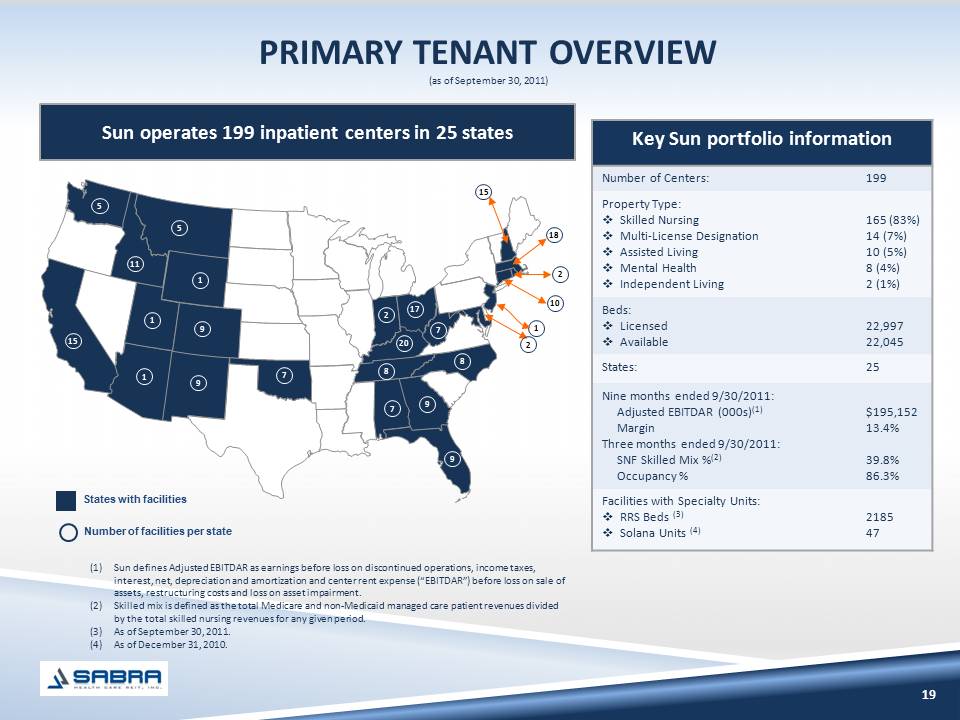
PRIMARY TENANT OVERVIEW
Sun operates 199 inpatient centers in 25 states
1)Sun defines Adjusted EBITDAR as earnings before loss on discontinued operations, income taxes, interest, net, depreciation and amortization and center rent expense (EBITDAR) before loss on sale of assets, restructuring costs and loss on asset impairment.
(2)Skilled mix is defined as the total Medicare and non-Medicaid managed care patient revenues divided by the total skilled nursing revenues for any given period.
(3)As of September 30, 2011.
(4)As of December 31, 2010.
Key Sun portfolio information
Number of Centers: 199
Property Type:
Skilled Nursing 165 (83%)
Multi-License Designation 14 (7%)
Assisted Living 10 (5%)
Mental Health 8 (4%)
Independent Living 2 (1%)
Beds:
Licensed 22,997
Available 22,045
Nine Months Ended 09/30/2011:
Adjusted EBITDAR (000s) $195,152
Margin 13.4%
Three months ended 09/30/2011:
SNF Skilled Mix % 39.8%
Occupancy % 86.3%
Facilities with Specialty Units:
RRS Beds 2185
Solana Units 47

FINANCIALLY SECURE PRIMARY TENANT
$150.8 million of liquidity as of September 30, 2011(5)
0.46x Net Debt-to-Adjusted EBITDA ratio(6)
(1)For the quarter ended September 30, 2011.
(2)Sun defines Adjusted EBITDAR as earnings before loss on discontinued operations, income taxes, interest, net, depreciation and amortization and center rent expense (EBITDAR) before loss on sale of assets, restructuring costs and loss on asset impairment.
(3)For the nine months ended September 30, 2011.
(4)Net free cash flow for Sun is defined as net operating cash flow less capital expenditures and principal payments under long-term debt agreements.
(5)Includes $59.6 million available under Sun's revolving credit facility.
(6)Based on net debt as of September 30, 2011 and annualized adjusted EBITDA for the nine months ended September 30, 2011.
Strong Operating Performance
$485.9 million in Revenue(1)
$63.8 million in Adjusted EBITDAR(1)(2)
$49.3 million net operating cash flow(3)
$8.6 million net free cash flow (3)(4)
Corporate guarantee across diverse health care services
Sun Healthcare Group, SunBridge Healthcare, CareerStaff, SolAmor Hospice, SunDance Rehabilitation
Attractive business profile
Strong operating performance
Transparency and visibility Balance sheet strength
Public entity
Sabra management team has substantial experience with Sun's operations

Financial Overview
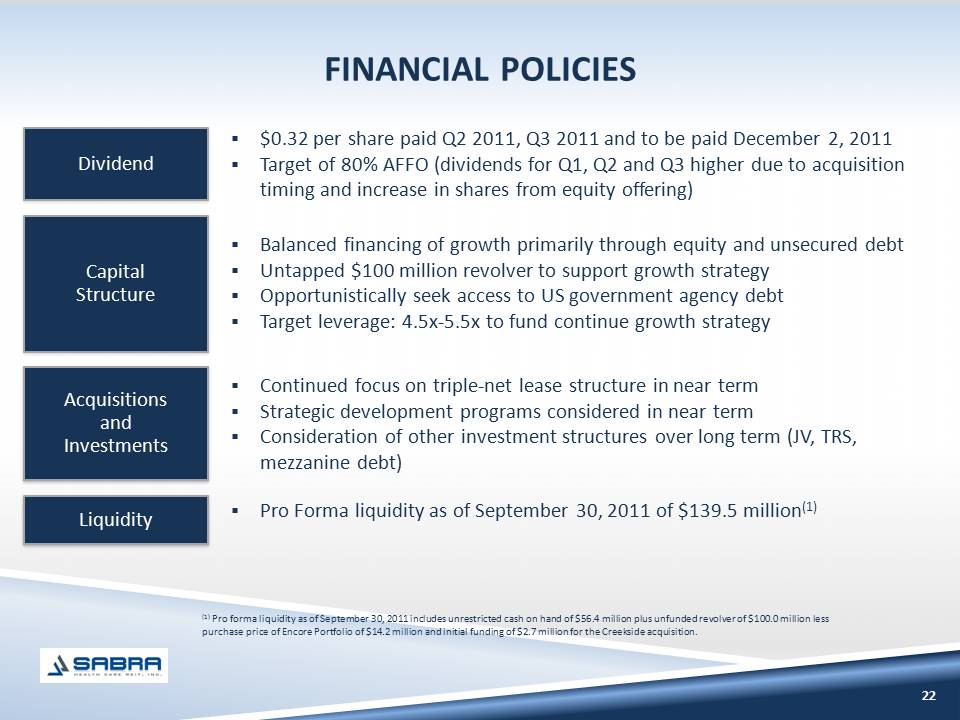
FINANCIAL POLICIES
Dividend
$0.32 per share paid Q2 2011, Q3 2011 and to be paid December 2, 2011
Target of 80% AFFO (dividends for Q1, Q2 and Q3 higher due to acquisition timing and increase in shares from equity offering)
Acquisitions and Investments
Continued focus on triple-net lease structure in near term
Strategic development programs considered in near term
Consideration of other investment structures over long term (JV, TRS, mezzanine debt)
Liquidity
Pro Forma liquidity as of September 30, 2011 of $139.5 million(1)
Capital Structure
Balanced financing of growth primarily through equity and unsecured debt
Untapped $100 million revolver to support growth strategy
Opportunistically seek access to US government agency debt
Target leverage: 4.5x-5.5x to fund continue growth strategy
(1) Pro forma liquidity as of September 30, 2011 includes unrestricted cash on hand of $56.4 million plus unfunded revolver of $100.0 million less purchase price of Encore Portfolio of $14.2 million and initial funding of $2.7 million for the Creekside acquisition.
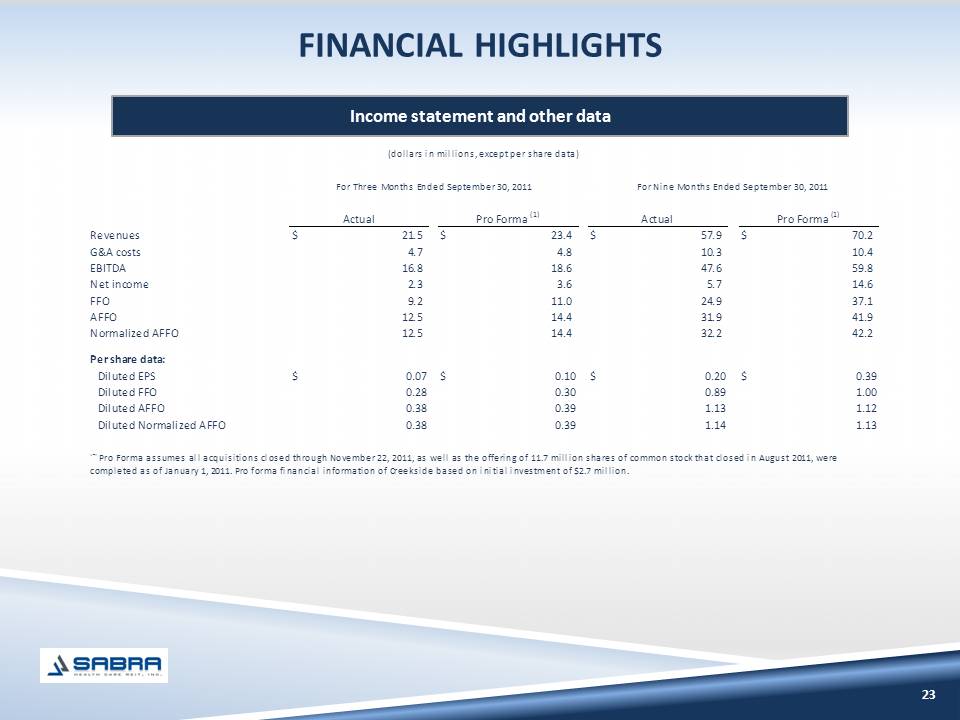
FINANCIAL HIGHLIGHTS
Income statement and other data
Revenues $21.5 $23.4 $57.9 $70.2
G&A costs 4.7 4.8 10.3 10.4
EBITDA16.8 18.6 47.6 59.8
Net income2.3 3.6 5.7 14.6
FFO9.2 11.0 24.9 37.1
AFFO 12.5 14.4 31.9 41.9
Normalized AFFO12.5 14.4 32.2 42.2
Per share data:
Diluted EPS$0.07$0.10$0.20$0.39
Diluted FFO0.280.300.891.00
Diluted AFFO0.380.391.131.12
Diluted Normalized AFFO 0.380.391.141.13(1)
Pro Forma assumes all acquisitions closed through November 22, 2011, as well as the offering of 11.7 million shares of common stock that closed in August 2011, were completed as of January 1, 2011. Pro forma financial information of Creekside based on initial investment of $2.7 million.
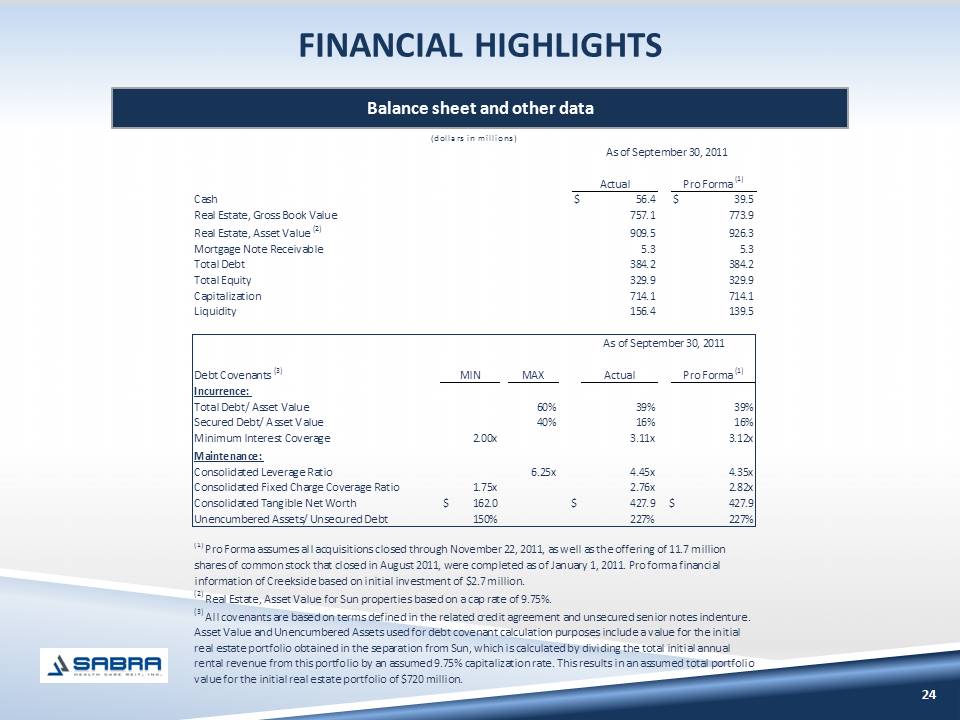
FINANCIAL HIGHLIGHTS
24
Balance sheet and other data
Cash $56.4 $39.5Real Estate, Gross Book Value 757.1 773.9 Real Estate, Asset Value (2) 909.5 926.3 Mortgage Note Receivable5.35.3Total Debt384.2384.2Total Equity329.9329.9Capitalization714.1714.1Liquidity156.4139.5Debt Covenants (3)MAX Actual Incurrence: Total Debt/ Asset Value60%39%39%Secured Debt/ Asset Value40%16%16%Minimum Interest Coverage2.00x3.11x3.12xMaintenance: Consolidated Leverage Ratio6.25x4.45x4.35xConsolidated Fixed Charge Coverage Ratio1.75x2.76x2.82xConsolidated Tangible Net Worth$ 162.0 $ 427.9 $ 427.9 Unencumbered Assets/ Unsecured Debt150%227%227%Pro Forma (1)As of September 30, 2011(1) Pro Forma assumes all acquisitions closed through November 22, 2011, as well as the offering of 11.7 million shares of common stock that closed in August 2011, were completed as of January 1, 2011. Pro forma financial information of Creekside based on initial investment of $2.7 million.(2) Real Estate, Asset Value for Sun properties based on a cap rate of 9.75%. (3) All covenants are based on terms defined in the related credit agreement and unsecured senior notes indenture. Asset Value and Unencumbered Assets used for debt covenant calculation purposes include a value for the initial real estate portfolio obtained in the separation from Sun, which is calculated by dividing the total initial annual rental revenue from this portfolio by an assumed 9.75% capitalization rate. This results in an assumed total portfolio value for the initial real estate portfolio of $720 million. (dollars in millions)Pro Forma (1)Actual MINAs of September 30, 2011

PRO FORMA DEBT MATURITY SCHEDULE
Weighted Average Cost of Debt(1): 7.25%
Mortgage Notes
Senior Unsecured Notes
Minimal near-term debt maturities
(1) 6.00% weighted average interest rate on mortgage debt and 8.13% on Senior Notes.
25 $0.8 $3.2 $3.5 $3.7 $86.0 $1.7 $1.8 $1.9 $2.1 $2.2 $51.8 $225 $0
$50
$100
$150
$200
$250

Geographically Diverse Portfolio
Attractive Industry Fundamentals
Favorable Long-Term Lease Structure
Strong Lease Coverage
Strong Asset Coverage
Financially Secure Primary Tenant
Growth Opportunities
Experienced Management Team
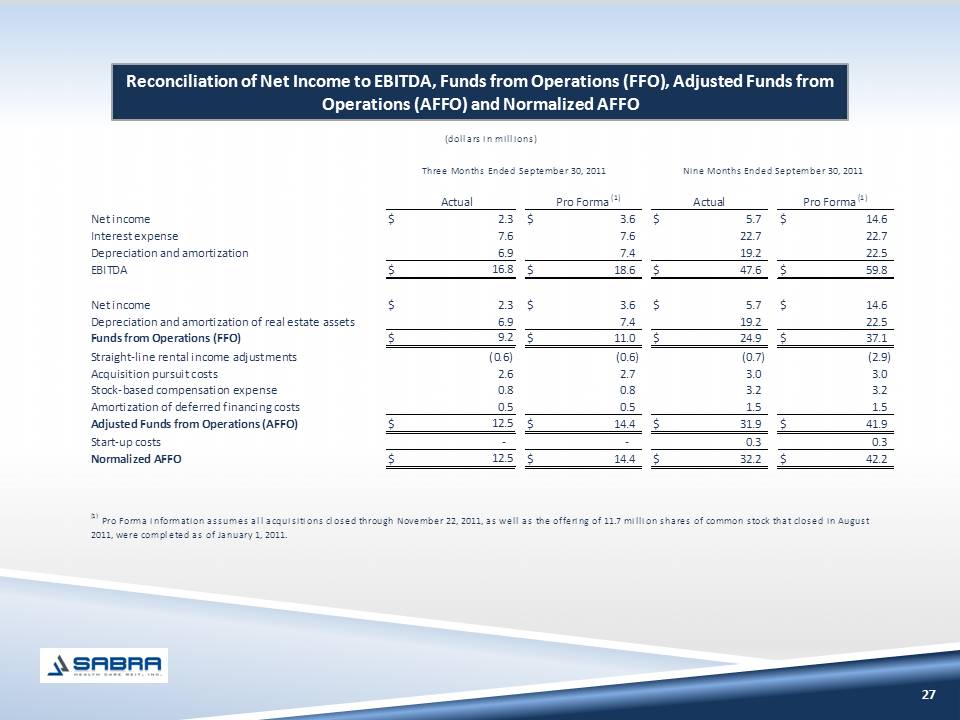
Reconciliation of Net Income to EBITDA, Funds from Operations (FFO), Adjusted Funds from Operations (AFFO) and Normalized AFFO Actual Pro Forma (1)Net income$2.3$3.6 $5.7 $14.6 Interest expense7.67.6 22.7 22.7 Depreciation and amortization6.97.4 19.2 22.5 EBITDA$16.8$18.6 $47.6 $59.8 Net income$2.3$3.6 $5.7 $14.6 Depreciation and amortization of real estate assets6.97.4 19.2 22.5 Funds from Operations (FFO)$9.2$11.0 $24.9 $37.1 Straight-line rental income adjustments (0.6)(0.6) (0.7) (2.9) Acquisition pursuit costs2.62.7 3.0 3.0 Stock-based compensation expense0.80.8 3.2 3.2 Amortization of deferred financing costs0.50.5 1.5 1.5 Adjusted Funds from Operations (AFFO)$12.5$14.4 $31.9 $41.9 Start-up costs - - 0.3 0.3 Normalized AFFO$12.5$14.4 $32.2 $42.2 (1) Pro Forma information assumes all acquisitions closed through November 22, 2011, as well as the offering of 11.7 million shares of common stock that closed in August 2011, were completed as of January 1, 2011. Three Months Ended September 30, 2011Nine Months Ended September 30, 2011