Attached files
| file | filename |
|---|---|
| 8-K - FORM 8-K - SEACOR HOLDINGS INC /NEW/ | d263829d8k.htm |
 Local
Service | Global Strength Charles Fabrikant
Executive Chairman of the Board
Investor Presentation
by November 30, 2011
Exhibit 99.1 |
 2
Forward-Looking Statements
This presentation includes “forward-looking statements” within the meaning of the Private
Securities Litigation Reform Act of 1995. Such forward- looking statements concerning
management’s expectations, strategic objectives, business prospects, anticipated economic performance and financial
condition and other similar matters involve known and unknown risks, uncertainties and other important
factors that could cause the actual results, performance or achievements of results to differ
materially from any future results, performance or achievements discussed or implied by such
forward-looking statements. Such risks, uncertainties and other important factors include, among
others: decreased demand and loss of revenues as a result of U.S. government implemented
moratoriums directing operators to cease certain drilling activities and any extension of such moratoriums (the
“Moratoriums”), weakening demand for the Company’s services as a result of unplanned
customer suspensions, cancellations, rate reductions or non- renewals of vessel charters and
aviation equipment or failures to finalize commitments to charter vessels and aviation equipment in response to
Moratoriums, increased government legislation and regulation of the Company’s businesses could
increase cost of operations, increased competition if the Jones Act is repealed, liability, legal
fees and costs in connection with providing spill and emergency response services, including the
Company’s involvement in response to the oil spill as a result of the sinking of the Deepwater
Horizon in April 2010, decreased demand for the Company’s services as a result of declines
in the global economy, declines in valuations in the global financial markets and illiquidity in the credit
sectors, including, interest rate fluctuations, availability of credit, inflation rates, change in laws,
trade barriers, commodity prices and currency exchange fluctuations, the cyclical nature of the
oil and gas industry, activity in foreign countries and changes in foreign political, military and
economic conditions, changes in foreign and domestic oil and gas exploration and production activity,
safety record requirements related to Offshore Marine Services, Marine Transportation Services
and Aviation Services, decreased demand for Marine Transportation Services and Harbor and
Offshore Towing Services due to construction of additional refined petroleum products, natural gas or
crude oil pipelines or due to decreased demand for refined petroleum products, crude oil or
chemical products or a change in existing methods of delivery, compliance with U.S. and foreign
government laws and regulations, including environmental laws and regulations, the dependence of
Offshore Marine Services, Marine Transportation Services and Aviation Services on several
customers, consolidation of the Company’s customer base, the ongoing need to replace aging vessels and
aircraft, industry fleet capacity, restrictions imposed by the Shipping Acts and Aviation Acts on the
amount of foreign ownership of the Company’s Common Stock, operational risks of Offshore
Marine Services, Marine Transportation Services, Harbor and Offshore Towing Services and Aviation
Services, effects of adverse weather conditions and seasonality, future phase-out of Marine
Transportation Services’ double-bottom tanker, dependence of spill response revenue on
the number and size of spills and upon continuing government regulation in this area and Environmental
Services’ ability to comply with such regulation and other governmental regulation, changes in
National Response Corporation’s Oil Spill Removal Organization classification, liability in
connection with providing spill response services, the level of grain export volume, the effect of fuel prices on
barge towing costs, variability in freight rates for inland river barges, the effect of international
economic and political factors in Inland River Services’ operations, adequacy of insurance
coverage, the attraction and retention of qualified personnel by the Company and various other matters and factors,
many of which are beyond the Company’s control. In addition, these statements constitute the
Company’s cautionary statements under the Private Securities Litigation Reform Act of 1995.
It is not possible to predict or identify all such factors. Consequently, the foregoing should not be considered
a complete discussion of all potential risks or uncertainties. The words “estimate,”
“project,” “intend,” “believe,” “plan” and similar expressions are
intended to identify forward-looking statements. Forward-looking statements speak only as of the
date of the document in which they are made. The Company disclaims any obligation or undertaking
to provide any updates or revisions to any forward-looking statement to reflect any change in the
Company’s expectations or any change in events, conditions or circumstances on which the
forward-looking statement is based. The forward-looking statements in this presentation
should be evaluated together with the many uncertainties that affect the Company’s businesses, particularly those
mentioned under “Forward-Looking Statements” on the Company’s Form 10-K and the
Company’s Form 10-Q and SEACOR’s periodic reporting on Form 8-K (if any), which
are incorporated by reference.
|
 3
SEACOR Attitude
Maintain a conservative balance sheet and
transparent reporting.
Invest for appreciation and long-term, not just
accretion or today.
Leverage our expertise, geographic reach, and
asset base.
Partner with complementary expertise.
Practice patience, be prepared, and hope for
luck. |
 4
SEACOR Focus
Energy
Food
Infrastructure
and
Transportation |
 5
5,311 Employees Worldwide
as of December 31, 2010
Global Reach |
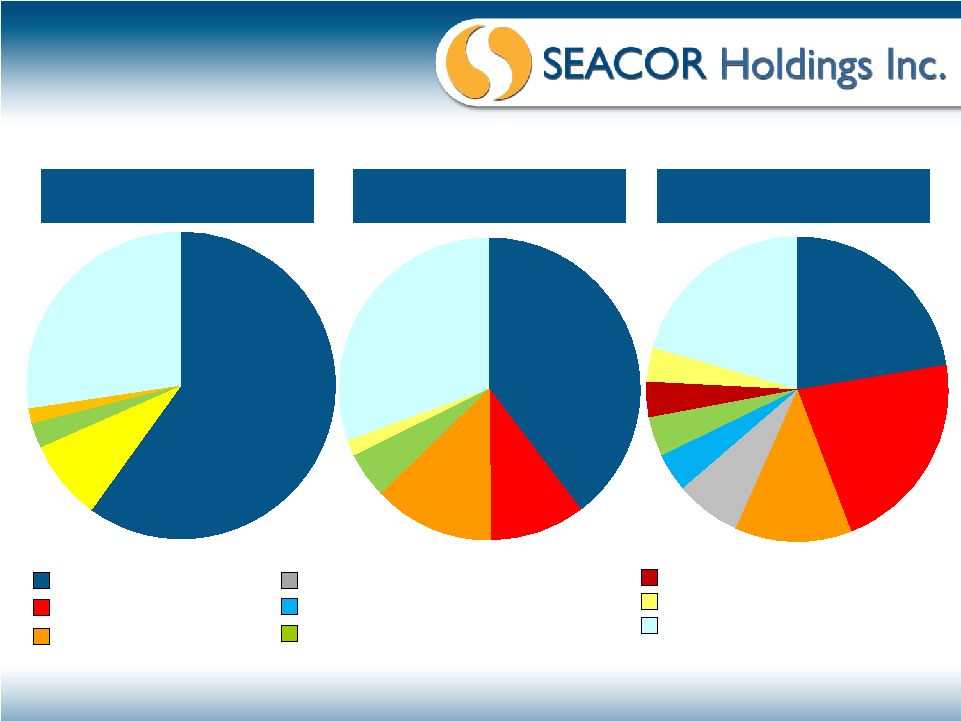 22%
22%
13%
7%
4%
4%
4%
3%
21%
40%
10%
13%
5%
2%
30%
60%
8%
3%
2%
27%
Growth with Diversification
As of December 31, 2000
Total Assets: $1.1 billion
As of June 30, 2005
Total Assets: $1.8 billion
As of September 30, 2011
Total Assets: $3.7 billion
Offshore Marine Services
Aviation Services
Inland River Services
Marine Transportation Services
Environmental Services
Commodity Trading and Logistics
Harbor and Offshore Towing Services
Other
Corporate (primarily liquid assets)
Note: Assets have been extracted from our Quarterly Reports on Form 10-Q and
our 2000 Annual Report on Form 10-K for all the business units with the
exception of Harbor and Offshore Towing Services. In our public filings, Harbor and Offshore Towing
Services is the main component of Other.
6 |
 $0
$150
$300
$450
$600
$750
$900
1993
1995
1997
1999
2001
2003
2005
2007
2009
YTD
2011
Cash from Operating Activities
Proceeds from Asset Sales
Capital Expenditures
7
Funding Capital Expenditures
(USD in millions)
1
Note: Cash flow data has been extracted from our Quarterly Reports on Form 10-Q
and our Annual Reports on Form 10-K. Amounts presented reflect the
current presentation of cash from operating activities. 1
Nine months ended September 30, 2011.
Since 1993, we sold approximately $2.5 billion in older assets, earned cash from
operations of approximately $2.9 billion and invested approximately $3.5
billion in capital expenditures. |
 8
Our Portfolio
Offshore Marine Services
Aviation Services
Inland River Services
Marine Transportation Services
Harbor and Offshore Towing Services
Environmental Services
Commodity Trading and Logistics |
 Offshore Marine Services -
Assets
Crew/FSV
Specialty
9
Specialty
AHTS
Supply
Standby Safety |
 Offshore Marine Services –
Fleet Details
10
Note: Fleet data has been extracted from our Quarterly Reports on Form 10-Q and
our Annual Reports on Form 10-K. 1
Average vessel age excludes the standby safety fleet.
Since Seabulk acquisition in
July 2005, we:
built, acquired, and
upgraded existing
offshore vessels, and
other offshore marine
equipment for
approximately $670
million.
disposed of 187 vessels
and other equipment for
net proceeds of
approximately $1 billion.
Fleet Count by Type
2003
2005
2007
2009
2011
Owned
AHTS
18
24
15
18
15
Crew (incl. Fast Support)
51
75
52
41
33
Mini-supply
26
22
15
6
5
Supply
12
32
13
11
10
Towing Supply
11
31
13
7
2
Standby Safety
19
21
23
24
26
Specialty
2
14
10
4
3
Total Owned
139
219
141
111
94
Average Vessel Age
1
10
16
13
11
10
Joint Ventured
54
33
11
12
17
Leased-in
36
43
42
27
22
Pooled or Managed
6
6
12
15
16
Total
235
301
206
165
149 |
 SEACOR’s “Deepwater”
Support Fleet
11
12 AHTS Vessels (11 U.S.-flag)
8 U.S.-flag Fast Support Vessels
2 Specialty Vessels (1 U.S.-flag)
14 Supply Vessels (9 U.S.-flag)
7 Heavy Twin Helicopters
34 Medium Twin Helicopters
Note: Fleet includes company-owned, joint ventured, leased-in, and pooled
or managed equipment as of September 30, 2011. |
 Offshore Marine Services -
Financials
12
Note: Income statement data has been extracted from our Quarterly Reports on Form
10-Q and our Annual Reports on Form 10-K. For details
on
the
definition
of
average
gross
property
&
equipment,
average
net
property
and
equipment,
operating
income
before
depreciation
and
amortization
(“OIBDA”),
return
on
average
gross
property
and
equipment,
and
return
on
average
net
property
and
equipment, see Appendix A.
1
Nine months ended September 30, 2011.
1
(USD in millions)
2006
2007
2008
2009
2010
YTD 2011
Revenue
682.6
$
692.4
$
708.7
$
562.3
$
515.9
$
267.0
$
Operating Expenses
339.0
374.5
390.1
309.6
309.6
199.7
Administrative and General
46.4
51.9
58.4
47.0
50.8
33.5
Depreciation and Amortization
81.5
60.5
55.6
54.9
51.8
36.5
Total Costs and Expenses
466.9
486.9
504.2
411.5
412.1
269.8
Gains on Asset Dispositions and Impairments, Net
67.0
82.5
69.2
22.5
29.5
13.2
Operating Income
282.7
$
288.0
$
273.8
$
173.2
$
133.2
$
10.4
$
Average Gross Property and Equipment
992.0
1,059.7
1,101.4
1,072.4
1,007.0
982.8
Average Net Property and Equipment
729.8
779.7
814.0
765.5
664.9
616.4
Reconciliation of Non-U.S. GAAP Financial Measures
Operating Income
282.7
288.0
273.8
173.2
133.2
10.4
Depreciation and Amortization
81.5
60.5
55.6
54.9
51.8
36.5
OIBDA
364.2
$
348.5
$
329.4
$
228.1
$
185.0
$
46.9
$
Return on Average Gross Property and Equipment
37%
33%
30%
21%
18%
6%
Return on Average Net Property and Equipment
50%
45%
40%
30%
28%
10% |
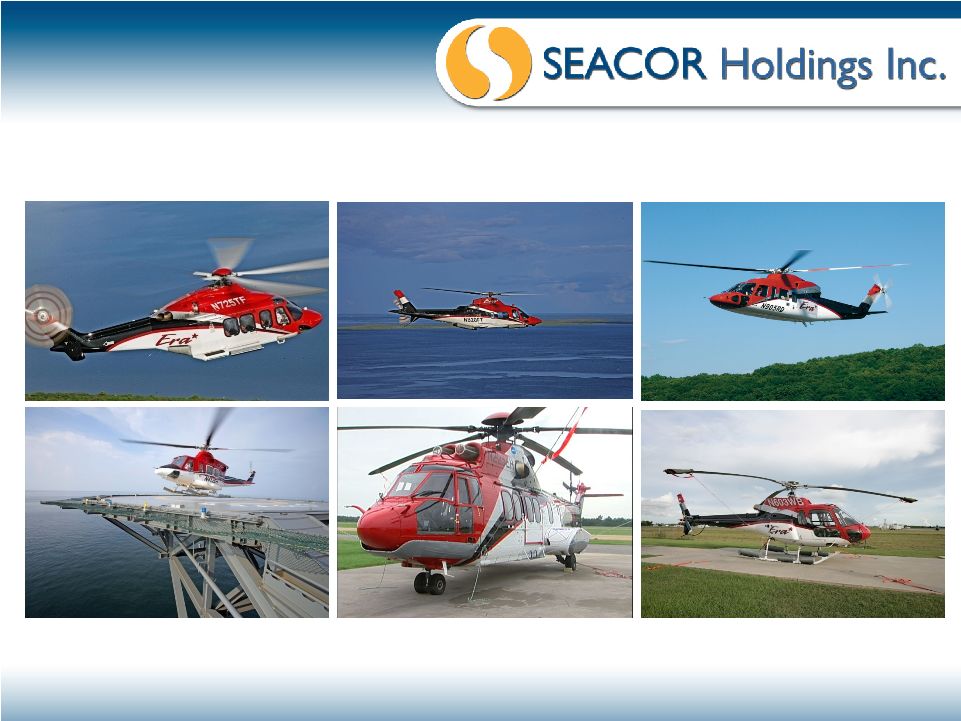 Aviation Services -
Assets
13
AW139 -
Medium
A109 –
Light twin
S76-C++ -
Medium
Bell 412 -
Medium
AS350B2 –
Light single
EC225 -
Heavy |
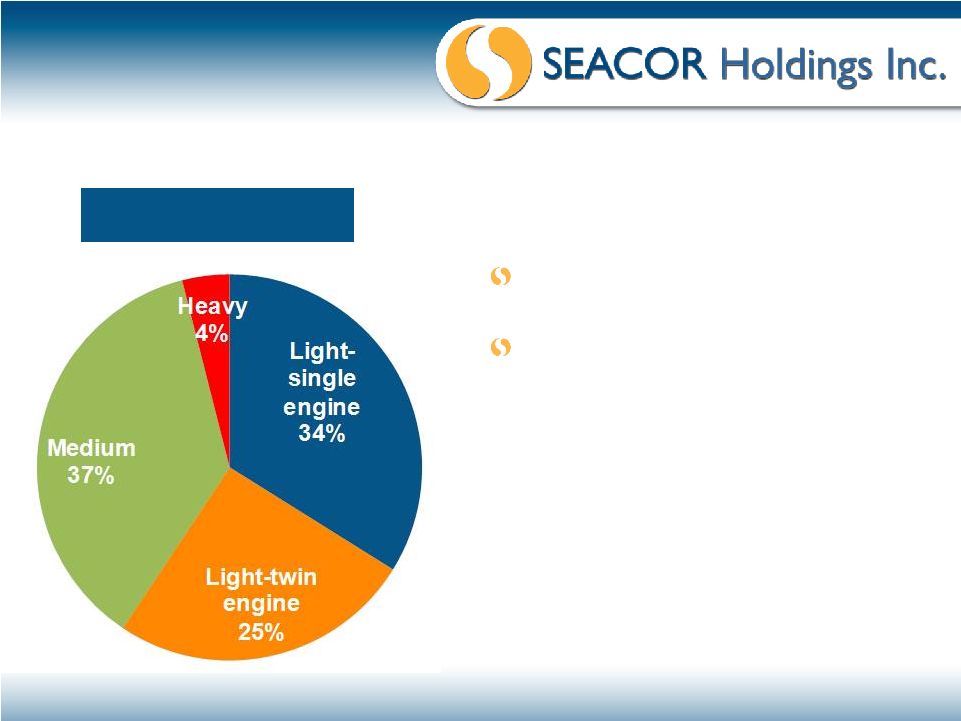
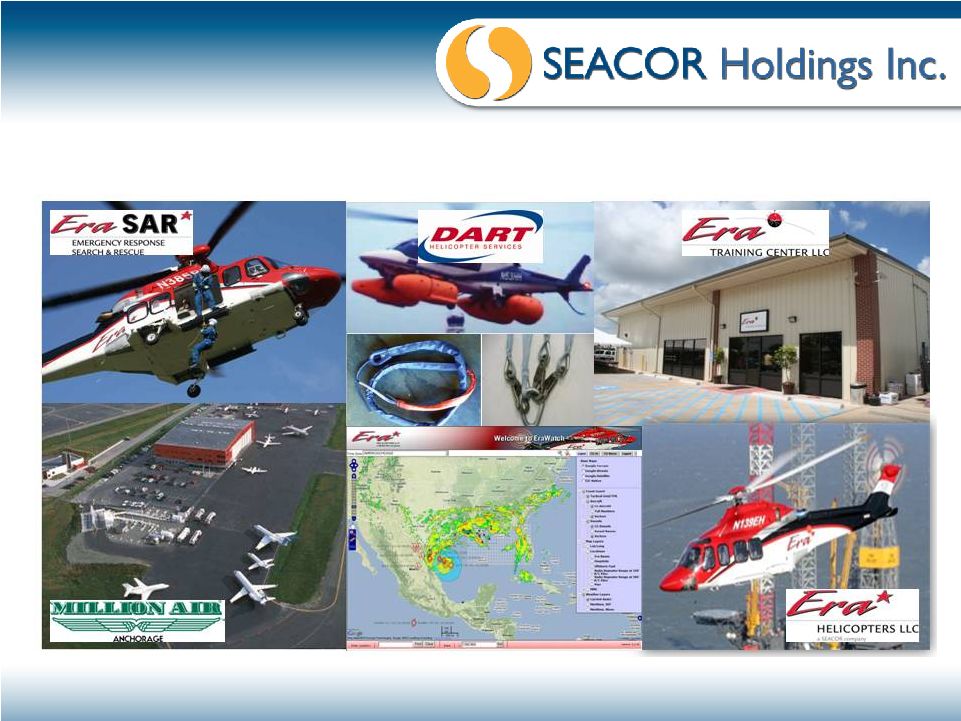 Aviation Services -
Operations
14 |
 Aviation Services –
Operations
as of September 30, 2011
15
United States
Sweden
Aircraft in Region (# of aircraft)
Spain
Canada
India
Mexico
UK
Norway
Brazil
Training Center
Joint Ventures
Indonesia
1
130
4
12
4
1
18
2
3
2 |
 Aviation Services –
Fleet Details
16
As of September 30, 2011
177
Helicopters
Since Era acquisition in December
2004, we:
acquired new equipment for
approximately $870 million.
disposed
of
71
helicopters
2
and
other equipment for net proceeds
of approximately $150 million.
Note: Fleet data has been extracted from our Quarterly Reports on Form 10-Q and
our Annual Reports on Form 10-K . 1
Includes 147 company-owned, 7 joint ventured, 11 leased-in, and 12 managed.
2
Includes helicopters sold, scrapped, or destroyed.
1 |
 Aviation Services -
Financials
17
1
Note: Income statement data has been extracted from our Quarterly Reports on Form
10-Q and our Annual Reports on Form 10-K. For details
on
the
definition
of
average
gross
property
&
equipment,
average
net
property
and
equipment,
operating
income
before
depreciation
and
amortization
(“OIBDA”),
return
on
average
gross
property
and
equipment,
and
return
on
average
net
property
and
equipment, see Appendix A.
1
Nine months ended September 30, 2011.
(USD in millions)
2006
2007
2008
2009
2010
YTD 2011
Revenue
156.0
$
215.0
$
248.6
$
235.7
$
235.4
$
196.5
$
Operating Expenses
121.6
157.2
181.5
148.0
147.2
121.6
Administrative and General
14.9
18.9
20.1
21.4
25.8
20.1
Depreciation and Amortization
20.0
27.6
36.4
37.4
43.4
33.4
Total Costs and Expenses
156.5
203.7
238.0
206.7
216.4
175.1
Gains on Asset Dispositions and Impairments, Net
11.1
8.0
4.9
0.3
0.8
13.3
Operating Income
10.6
$
19.4
$
15.5
$
29.3
$
19.7
$
34.6
$
Average Gross Property and Equipment
250.0
351.8
476.5
607.5
716.4
805.1
Average Net Property and Equipment
222.2
307.2
402.6
498.2
568.5
621.6
Reconciliation of Non-U.S. GAAP Financial Measures
Operating Income
10.6
19.4
15.5
29.3
19.7
34.6
Depreciation and Amortization
20.0
27.6
36.4
37.4
43.4
33.4
OIBDA
30.6
$
47.0
$
51.9
$
66.7
$
63.1
$
68.0
$
Return on Average Gross Property and Equipment
12%
13%
11%
11%
9%
11%
Return on Average Net Property and Equipment
14%
15%
13%
13%
11%
15% |
 Inland River Services -
Assets
Covered Hoppers
10,000 Bbl Tank Barges
30,000 Bbl Tank Barges
Grain Elevator
Open Hoppers
18
Unit
Tow
Liquid
Barges
Gateway Terminals
Towboats |
 Inland River Services –
Areas of Operation
19
Argentina, Brazil, and Paraguay
Columbia
United States
•
St. Louis, Missouri – HQ
•
Sauget and McLeansboro, Illinois
•
Paducah, Kentucky
•
Memphis, Tennessee
•
Greenville, Mississippi
•
New Orleans, Louisiana
•
Fleet Locations in MO, AK, IL and
TN •
Buenos Aires - HQ
•
Corumbá, Brazil
•
Asunción, Paraguay
•
Rosario, Argentina
•
Ibicuy, Argentina
•
Barranquilla
•
Cartegena
|
 Inland River Services –
Fleet Profile
20
Joint
Pooled or
Type
Owned
Ventured
Leased-In
Managed
Total
Dry Cargo Barges
689
172
2
626
1,489
Liquid Tank Barges
70
-
-
9
79
Deck Barges
20
-
-
-
20
Towboats
16
15
-
-
31
Dry Cargo Vessel
-
1
-
-
1
Total
795
188
2
635
1,620
As of September 30, 2011
Since launching new construction program in 2003, we:
built or acquired 631 barges, 11 towboats, and other property and
equipment for approximately $450 million.
1
disposed of 242 barges, six towboats, and other property and
equipment for net proceeds of approximately $144 million.
2
Note: Fleet data has been extracted from our Quarterly Reports on Form 10-Q and
our Annual Reports on Form 10-K . 1
Excludes14
barges
and
eight
towboats
related
to
the
acquisition
of
Waxler
Transportation
Company,
Inc,
and
Waxler
Towing
Company, Incorporated.
2
Excludes 73 barges associated with non-operating activities.
|
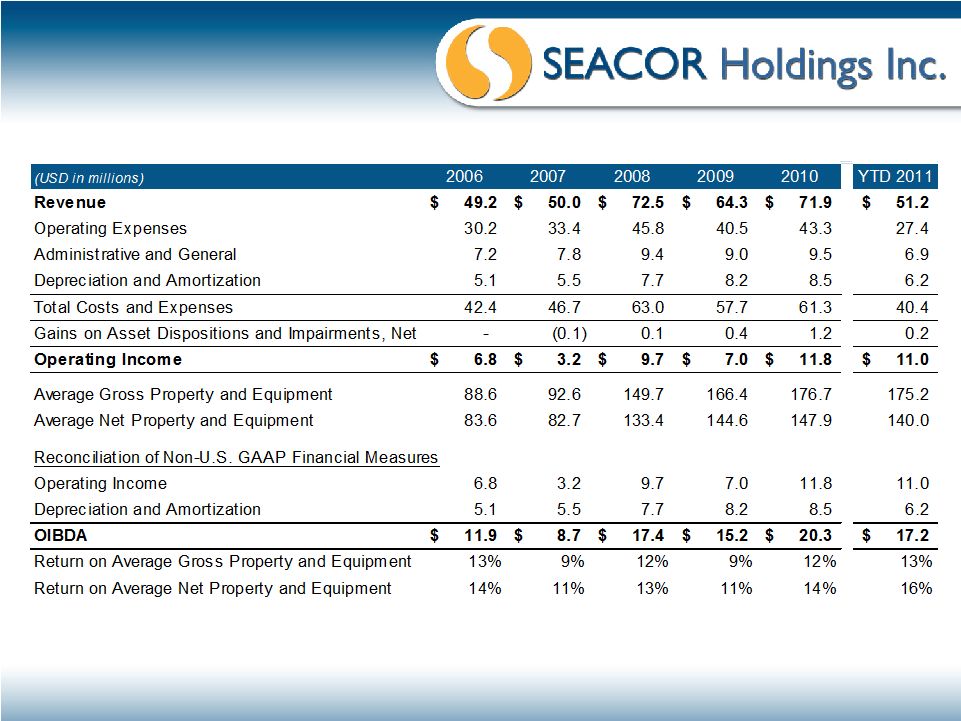
 Inland River Services -
Financials
21
Note: Income statement data has been extracted from our Quarterly Reports on Form
10-Q and our Annual Reports on Form 10-K. For details
on
the
definition
of
average
gross
property
&
equipment,
average
net
property
and
equipment,
operating
income
before
depreciation
and amortization (“OIBDA”), return on average gross property and
equipment, and return on average net property and equipment, see Appendix
A. 1
Nine months ended September 30, 2011.
1 |
 22
Marine Transportation Services -
Assets
Harbor and Offshore Towing Services -
Assets
Seabulk Trader
Seabulk Challenge
Seabulk Arctic
RORO Vessels
Tractor Tug
Conventional Tug
1
Roll-on/Roll-off vessels.
1 |
 Harbor and Offshore Towing Services -
Port Locations |
 24
Marine Transportation Services and Harbor
and Offshore Towing Services –
Fleet Profile
Since Seabulk acquisition in July
2005, we:
added approximately $40 million
and disposed of approximately
$275 million
of assets to the
marine transportation fleet.
added approximately $120
million and disposed of
approximately $15 million of
assets to the harbor and offshore
towing fleet.
Note: Fleet data has been extracted from our Quarterly Reports on Form 10-Q and
our Annual Reports on Form 10-K . 1
Primarily consists of the sale leaseback of the two U.S.-flag double-hull
tankers in 2010 and the sale of the two foreign flag double-hull tankers
in 2005. 1 |
 Marine Transportation Services –
Financials
25
Note: Income statement data has been extracted from our Quarterly Reports on Form
10-Q and our Annual Reports on Form 10-K. For details
on
the
definition
of
average
gross
property
&
equipment,
average
net
property
and
equipment,
operating
income
before
depreciation
and
amortization
(“OIBDA”),
return
on
average
gross
property
and
equipment,
and
return
on
average
net
property
and
equipment,
see
Appendix A.
1
Nine months ended September 30, 2011.
1 |
 Harbor and Offshore Towing Services –
Financials
26
1
Note: Income statement data has been extracted from our Quarterly Reports on Form
10-Q and our Annual Reports on Form 10-K. For details
on
the
definition
of
average
gross
property
&
equipment,
average
net
property
and
equipment,
operating
income
before
depreciation
and
amortization
(“OIBDA”),
return
on
average
gross
property
and
equipment,
and
return
on
average
net
property
and
equipment,
see
Appendix A.
1
Nine months ended September 30, 2011. |
 27
Environmental Services -
Businesses |
 Environmental Services -
Financials
(USD in millions)
2006
2007
2008
2009
2010
YTD 2011
Revenue
144.5
$
156.8
$
168.0
$
145.8
$
874.4
$
152.0
$
Operating Expenses
103.2
111.3
117.3
103.8
593.3
104.6
Administrative and General
20.6
23.3
27.5
25.5
31.6
25.6
Depreciation and Amortization
3.4
4.9
7.1
7.2
8.4
7.4
Total Costs and Expenses
127.1
139.5
151.9
136.4
633.2
137.6
Gains (Losses) on Asset Dispositions
(0.2)
0.2
0.1
(0.2)
0.5
-
Operating Income
17.2
$
17.5
$
16.2
$
9.2
$
241.7
$
14.4
$
Derivative Losses
-
-
-
-
-
-
Foreign Currency Gains (Losses)
(0.1)
(0.1)
(0.3)
-
(0.1)
-
Other, Net
-
-
-
-
-
-
Equity Earnings of 50% or Less
Owned Companies
0.1
0.2
0.6
0.2
0.7
-
Segment Profit
17.2
$
17.7
$
16.5
$
9.4
$
242.2
$
14.4
$
28
1
Note: Income statement data has been extracted from our Quarterly Reports on Form
10-Q and our Annual Reports on Form 10-K. 1
Nine months ended September 30, 2011. |
 Ethanol plant
Tank barge
Commodity Trading and Logistics -
Energy
Tank railcar
Tank farms
29 |
 Commodity Trading and Logistics -
Financials
30
1
Note: Income statement data has been extracted from our Quarterly Reports on Form
10-Q and our Annual Reports on Form 10-K. 1
Nine months ended September 30, 2011.
(USD in millions)
2007
2008
2009
2010
YTD
2011
Revenue
9.6
$
208.3
$
472.6
$
741.9
$
718.5
$
Operating Expenses
9.7
189.9
460.7
729.1
703.8
Administrative and General
0.9
9.0
12.6
11.4
6.8
Depreciation and Amortization
-
-
-
0.1
-
Total Costs and Expenses
10.6
198.9
473.4
740.6
710.7
Operating Income (Loss)
(1.0)
$
9.4
$
(0.8)
$
1.3
$
7.8
$
Derivative Gains (Losses)
0.7
(0.4)
4.0
(4.7)
(7.0)
Foreign Currency Gains (Losses)
-
0.1
0.5
(0.5)
0.1
Other, Net
-
-
-
0.8
-
Equity in Earnings (Losses) of
50% or Less Owned Companies
-
0.2
(0.1)
(0.6)
(3.3)
Segment Profit (Loss)
(0.3)
$
9.2
$
3.6
$
(3.7)
$
(2.3)
$
Segment Profit (Loss) -
Energy
(0.3)
0.4
6.1
4.4
(2.0)
Segment Profit (Loss) -
Sugar
-
0.2
(0.7)
0.9
1.0
Segment Profit (Loss) -
Rice
-
8.6
(1.8)
(9.0)
(1.3) |
 31
Consolidated Company |
 $0
$20
$40
$60
$80
$100
-$30
$20
$70
$120
$170
$220
$270
$320
1997
1998
1999
2000
2001
2002
2003
2004
2005
2006
2007
2008
2009
2010
32
Stockholder Value
Since 2006, $1 billion spent on Special
Cash Dividend and Share Repurchases,
highest
among
peer
group.
1
Average
price
per
share
–
Share
Repurchases
Cash
spent
per
period
–
Share
Repurchases
(USD in millions, except share data)
Note:
Share
repurchases,
average
price
per
share
and
the
Special
Cash
Dividend
have
been
extracted
from
our
Quarterly
Reports
on
Form 10-Q and our Annual Reports on Form 10-K with the exception of average
price per share presented from 1997 to 1999. Average price per share during
from 1997 to 1999 have been adjusted for the three-for-two stock split effective June 15, 2000.
1
Our
peer
group
includes
Tidewater,
Bourbon,
Gulfmark,
Hornbeck,
Farstad,
Bristow
and
Kirby.
Statements
are
based
on
review
of
public filings.
Cash
spent
per
period
–
Special
Cash
Dividend |
 $0
$20
$40
$60
$80
$100
1993
1995
1997
1999
2001
2003
2005
2007
2009
2011
Book Value Per Share
2010 Special Cash Dividend
33
Solid Track Record
3
Note: Stockholders’
equity, common shares outstanding, and net income have been extracted from our
Quarterly Reports on Form 10- Q and our Annual Reports on Form
10-K with the exception of amounts referenced in footnote 1. 1
Growth
in
book
value
from
December
31,
1992
($7.84)
to
September
30,
2011.
Amounts
presented
from
1992
to
1999
have
been
adjusted for the three-for-two stock split effective June 15, 2000.
Amounts presented for 2010 and 2011 add back the 2010 Special Cash Dividend
of $15 per common share paid to shareholders of record on December 14, 2010.
2
Average from December 31, 1993 to September 30, 2011. For definitions of
After-Tax Returns on Equity see Appendix B. 3
As of September 30, 2011
Compounded Annual Growth in
Book Value Per Share
1
: 15%
Average After-Tax ROE
2
: 13% |
 -20%
-10%
0%
10%
20%
30%
40%
50%
60%
1993
1995
1997
1999
2001
2003
2005
2007
2009
2011
34
Minimal Leverage
Note: Total debt, cash and near cash assets, and total equity have been extracted
from our Quarterly Reports on Form 10-Q and our Annual Reports on Form
10-K. Amounts presented from 2004 to 2008 are restated for the adoption of new accounting rules related to the Company’s
convertible debt, which was repaid in 2009. For definitions of total debt to total
capital and net debt to total capital see Appendix B. 1
As of September 30, 2011.
1
Total
Debt
/
Total
Capital
From 1993 to 2004, our average Total Debt / Total Capital was 40%.
From 2005 to September 30, 2011, our average Total Debt / Total Capital was 33%.
Net
Debt
/
Total
Capital |
 Conservative Balance Sheet
Note: Balance sheet data has been extracted from our September 30, 2011 Quarterly
Report on Form 10-Q. 1
Includes
cash
and
cash
equivalents,
restricted
cash,
marketable
securities,
construction
reserve
funds,
and
Title
XI
reserve
funds.
2
Includes current and long -term debt and capital lease obligations.
3
For definitions of total debt to total capital and net debt to total capital see
Appendix B. (USD in millions)
As of September 30, 2011
Cash and Near Cash Assets
1
707.3
$
Total Assets
3,662.3
Total Debt
698.4
Stockholders' Equity
1,831.6
Total Equity
1,842.6
Total Debt to Total Capital
3
27.5%
Total Net Debt to Total Capital
3
-0.4%
2
35 |
 Stock Performance
36
(20)%
(15)%
(10)%
(5)%
-
%
5 %
10 %
15 %
20 %
Nov-10
Feb-11
May-11
Aug-11
Nov-11
5 Years
(100)%
100 %
300 %
500 %
700 %
900 %
1,100 %
1,300 %
Dec-92
Dec-94
Dec-96
Dec-98
Dec-00
Dec-02
Dec-04
Dec-06
Dec-08
Dec-10
1 Year
Since IPO
10 Years
CKH
S&P 500
Source: Yahoo!Finance |
 37
Appendix A: Definitions
Average
gross
property
and
equipment
is
computed
by
averaging
the
beginning and ending quarterly values during the period. In our public filings, we
disclose net property and equipment by segment. We do not disclose total
gross property
and
equipment
by
business
unit,
however,
for
historical
cost
for
major
classes of equipment refer to Note 1 to our Consolidated Financial Statements
in our Annual Reports on Form 10-K.
Average
net
property
and
equipment
is
computed
by
averaging
the
beginning
and ending quarterly values during the period.
Operating
income
before
depreciation
and
amortization
(“OIBDA”)
is
a
non-
U.S. GAAP financial measure and calculated as operating income (loss) plus
depreciation and amortization.
Return
on
average
gross
property
and
equipment
is
calculated
as
operating
income before depreciation and amortization, a non-U.S. GAAP financial
measure, divided by average gross property and equipment. Returns for the
nine months ended September 30, 2011 were annualized.
Return
on
average
net
property
and
equipment
is
calculated
as
operating
income before depreciation and amortization, a non-U.S. GAAP financial
measure, divided by average net property and equipment. Returns for the nine
months ended September 30, 2011 were annualized.
|
 38
Appendix B: Definitions
Book
value
per
share
is
calculated
as
SEACOR
Holdings
Inc.
stockholders’
equity divided by common shares outstanding at the end of the period.
After-Tax
Return
on
Equity
is
calculated
as
net
income
attributable
to
SEACOR
Holdings
Inc.
divided
by
SEACOR
Holdings
Inc.
stockholders’
equity
at the beginning of the year.
Total
Debt
to
Total
Capital
is
calculated
as
total
debt
divided
by
the
sum
of
total equity. Total equity is defined as SEACOR Holdings Inc.
stockholders’ equity plus noncontrolling interests in subsidiaries.
Net
Debt
to
Total
Capital
is
calculated
as
total
debt
less
cash
and
near
cash
assets divided by the sum of total equity. Total equity is defined as SEACOR
Holdings Inc. stockholders’
equity plus noncontrolling interests in subsidiaries.
|