Attached files
| file | filename |
|---|---|
| 8-K - FORM 8-K - HOMEAWAY INC | d263801d8k.htm |
 J.P. Morgan
SMid Cap Conference
November 30, 2011
Exhibit 99.1 |
 Confidential
© Copyright 2011 HomeAway, Inc.
Safe Harbor Statement
This presentation contains “forward-looking”
statements that are based on our management’s beliefs and assumptions and on
information currently available to management. Forward-looking statements include
information concerning our possible or assumed future results of operations, business
strategies, financing plans, competitive position, industry environment, potential growth
opportunities, potential market opportunities, the effects of competition and the effects of
the release of our IPO lock-up share trading restrictions.
Forward-looking statements include all statements that are not historical facts and can be
identified by terms such as “anticipates,” “believes,”
“could,”
“seeks,”
“estimates,”
“intends,”
“may,”
“plans,”
“potential,”
“predicts,”
“projects,”
“should,”
“will,”
“would”
or
similar expressions and the negatives of those terms. Forward-looking statements represent
our management’s beliefs and assumptions only as of the date of this presentation,
November 30, 2011. Forward-looking statements involve known and unknown
risks, uncertainties and other factors that may cause our actual
results, performance or achievements to be materially different
from
any future results, performance or achievements expressed or implied by the
forward-looking statements. A detailed discussion of such risks and uncertainties
are contained in our prospectus, which was filed with the SEC on June 29, 2011, as well as with our
most
recent Form 10-q filed with the SEC on November 4, 2011. Except as required by
law, we assume no obligation to update these forward-looking statements publicly,
or to update the reasons actual results could differ materially from those anticipated in the
forward-looking statements, even if new information becomes available in
the future.
2 |
 Travelers
To make finding, selecting and renting a
vacation home as easy as booking a hotel
Our Mission
To make every vacation rental in the world available to every traveler in the world
through our online marketplace
Vacation Rental Owners/Managers
To be their most effective marketing partner
and #1 source of bookings
3
Confidential ©
Copyright 2011 HomeAway, Inc. |
 Confidential
© Copyright 2011 HomeAway, Inc.
Headquartered in Austin, TX
145+ countries, 11 languages
905
employees
¹
625,000+
listings
²
The World’s Largest Vacation Rental Marketplace
4
Owners/managers pay ~$300
to list properties
Free for travelers
~90%+ annual subscription revenues
Key Facts
Simple Business Model
120
82
54
18
168
2006
2007
2008
2009
2010
32
(1)
24
34
51
2006
2007
2008
2009
2010
($MM)
($MM)
Revenues
Free Cash Flow
1
As of 9/30/2011
2
Paid vacation rental listings as of 9/30/2011
3
Includes Headquarter CapEx of $4.9MM
3 |
 Clear market
leader with powerful global footprint Strong network effects and significant
competitive advantages Industry disruption provides numerous growth opportunities
Large, highly fragmented vacation rental industry presents huge opportunity
Rapidly growing, highly predictable and profitable subscription-based business
model Compelling
value
proposition
for
vacation
rental
owners/managers
and
travelers
Why Invest in HomeAway?
5
Confidential ©
Copyright 2011 HomeAway, Inc. |
 Confidential
© Copyright 2011 HomeAway, Inc.
6.1 Million
0.2 Million
US and Europe
Number of Properties
Not
Rented
13.5MM
Rented
6.1MM
HomeAway
Listings
(625K+)
¹
Vacation
Rentals
19.6MM Vacation Homes
US and Europe
Highly Fragmented Supplier Base Ideal
for Market Maker
6.1MM Properties
16 Average Weeks Rented per Year
x
~$85
Billion
²
Hotels
Transforming an $85Bn, Highly Fragmented Industry
6
$882 Average Rental Rate
x
1
Global paid vacation rental listings as of 9/30/2011
2
According to November 2010 Radius Global Market Research survey titled “Market Sizing
Study” |
 ~15.0%
2.5%
Vacation Rentals
Hotels
Take Rate
HomeAway Addressable Market
$85 Billion Industry
x
$8.5 Billion
10% Take Rate
Supply
Demand
Services
Key Players in Value Chain
Platform Player With Significant Addressable Market
7
Confidential ©
Copyright 2011 HomeAway, Inc. |
 Confidential
© Copyright 2011 HomeAway, Inc.
Annual Listing Fee
Estimated Annual
Rental Income
Outstanding Value Creation
~$335
¹
~40x:
Estimated ROI for
Owners/Managers
Strong
Growth
in
Listings
²
Outstanding Value Proposition for Owners/Managers
8
~$13,000
(000’s)
1
As of 9/30/2011
2
Paid vacation rental listings as of 12/31 each year |
 Wider
Selection Lower Total Cost
Additional Space
Increased Privacy
Multiple Bedrooms
Multiple Bathrooms
Personal Kitchen
Common Living Areas
Private Swimming Pools
Compelling Value Proposition for Travelers
9
Example:
Family Trip
to Disney
4 bedroom house in Orlando
3,000 sq.ft. plus private pool
$214/night
or
$1,500/week
Vacation Rental
Hyatt Regency, Orlando
400 sq.ft., 2 beds, 1 bath
$300/night or $2,100/week
Hotel
“A greatly increased use of apartments and vacation homes in place of standard hotels
is the most pronounced trend in travel…”
Arthur Frommer, December 13, 2010
Confidential ©
Copyright 2011 HomeAway, Inc. |
 Global Vision
and Platform 10
U.S.
Germany
France
U.K.
Italy
Brazil
Market Leader
Brand Portfolio
19
countries
with
dedicated
HomeAway websites
145
countries
with
vacation
rentals
listed on HomeAway websites
7 countries
with
HomeAway offices
Travel is a Global Experience for Consumers
International HomeAway Websites
Confidential ©
Copyright 2011 HomeAway, Inc.
United Kingdom
Canada
Spain
Argentina
Brazil
Sweden
Austria
Finland
France
Australia
Portugal
India
Italy
Norway
Columbia
Denmark
Germany
Mexico
The Netherlands |
 884
1,048
1,139
1,269
1,559
1,411
Q2’10
Q3’10
Q4’10
Q1’11
Q2’11
Q3'11
Proprietary, Trusted Platform
11
270
¹
customer
service
personnel
Proprietary mix of cutting-edge technology
and business processes
Property Reviews
(000’s)
Commitment to Trust & Security
1
As of 9/30/2011
Confidential ©
Copyright 2011 HomeAway, Inc. |
 Confidential
© Copyright 2011 HomeAway, Inc.
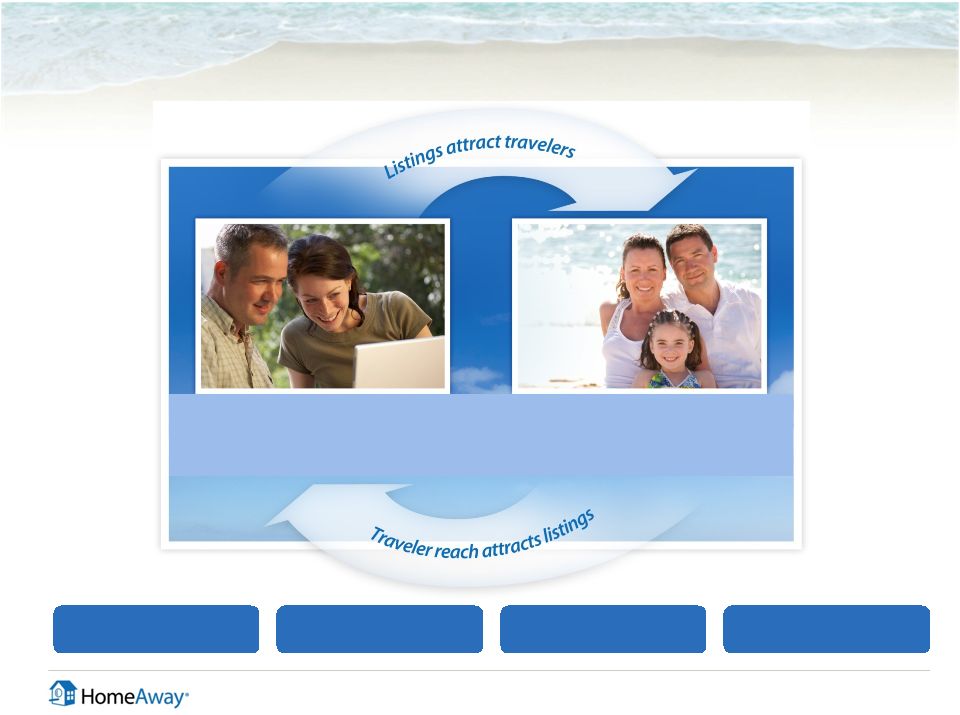
Network Effect is the Greatest Competitive Advantage
Owners/Managers
Easy to get started
Income from your vacation home
Dedicated help and support
Travelers
More space
More privacy
Better value than hotels
Global Presence
Trust and Security
Product and
Technology Innovation
Marketing
12 |
 Confidential
© Copyright 2011 HomeAway, Inc.
Multiple Growth Drivers
13
Increase
Number of Listings
x
Base Price
Market-Based /
Tiered Pricing
Cross-selling /
add-ons
Best User Experience
Property Manager Channel
Awareness Marketing
New Geographies
Online Payments
Online Bookings
Traveler Products
Reflected in…
Increase
Revenue Per Listing
Average Revenue
per Listing
Other
Revenue
Through… |
 Tiered Pricing
Illustration 14
Confidential ©
Copyright 2011 HomeAway, Inc. |
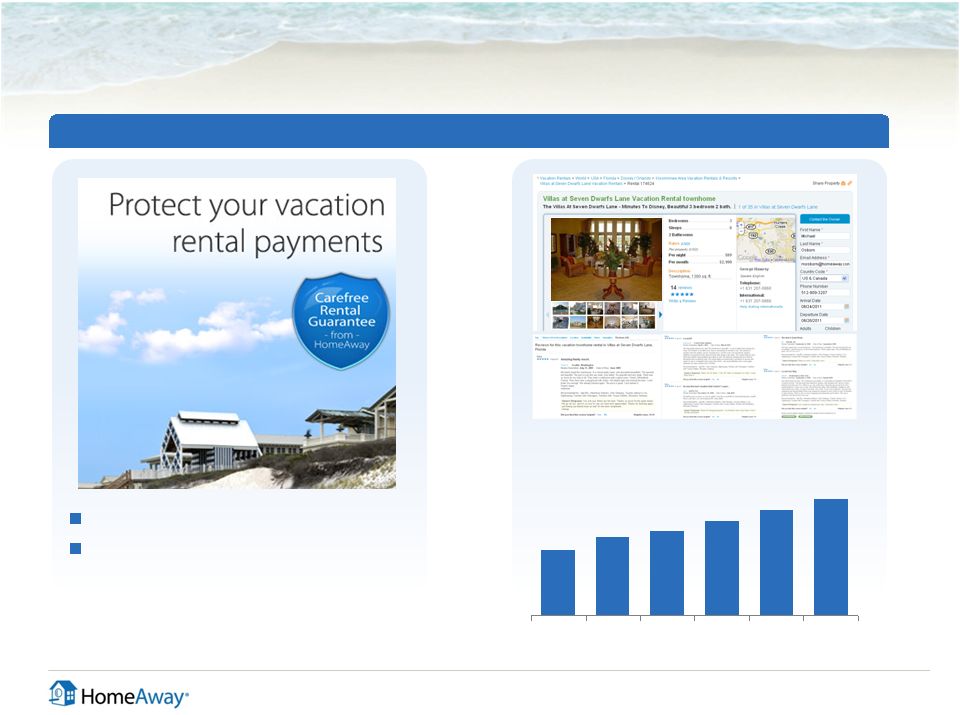
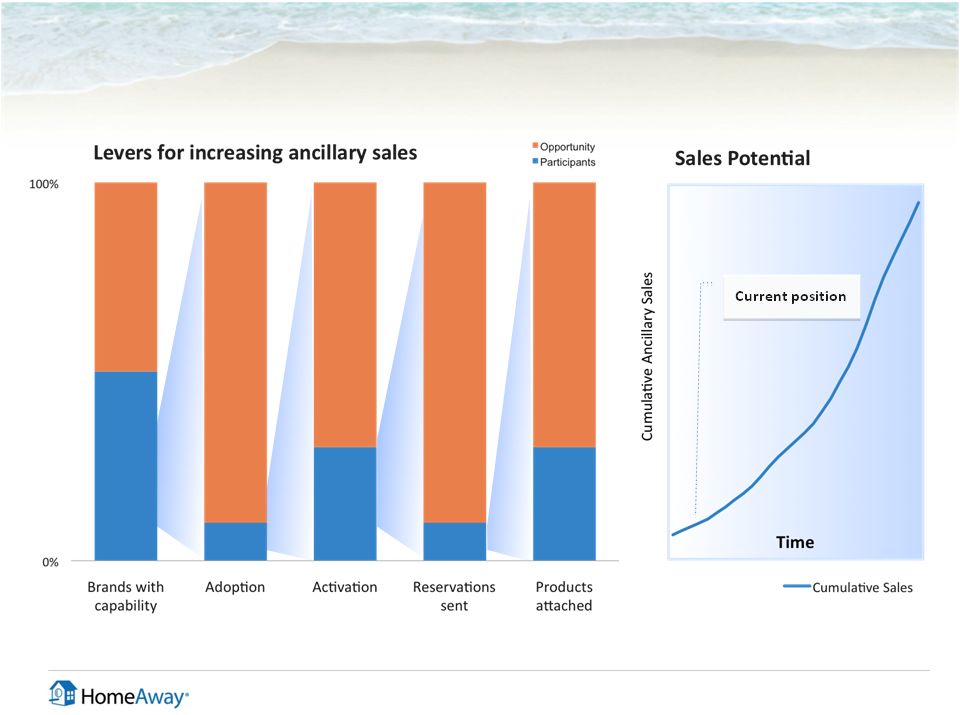 Payments and
Ancillary Products Illustration 15
Confidential ©
Copyright 2011 HomeAway, Inc. |
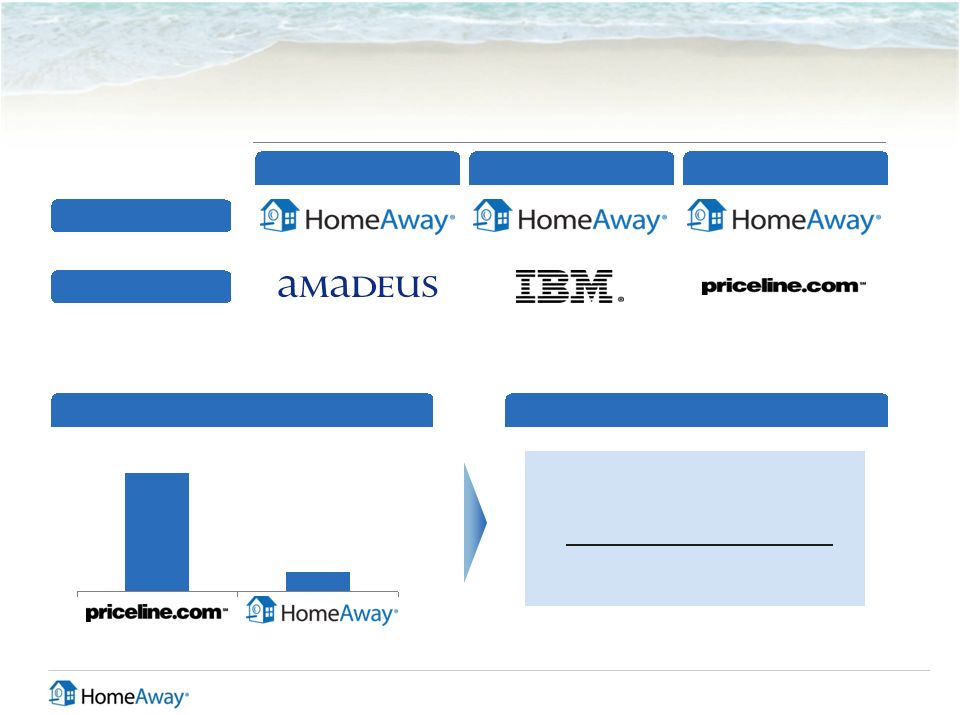
 Delivering
Against Long-Term Strategy Phase I = ’05-’10
Consolidation
Phase II = ’07-’11
Professionalization
Phase III = Now
Optimization
Phase IV = Future
Going Mainstream
World-Class
Capabilities
Operations
•
General management
•
SEO
•
Marketing
•
Sales
•
M&A
•
Customer service
Product
•
Agile development
•
Global teams
•
Secure IT
Single Network
•
Non-cyclical
•
Disciplined approach
to adding cost
Secure and Stable
Profit Model
•
Price-to-value
•
Regional/global
distribution packages
•
Payments and online
booking
•
Traveler products such
as insurance
•
OTA distribution
Future
Monetization
e-Commerce
World-Class
User Experience
16
The catalyst for the
travel industry’s #1
consumer trend
•
Marketing Leadership:
viral/social, broad
reach, and
nontraditional
•
Supply Leadership:
migrating offline renters
online
Confidential ©
Copyright 2011 HomeAway, Inc. |
 Blue-Chip
Investors World-Class Management Team and Investors
17
Highly Experienced Management Team
Previous Experience
Brian Sharples
Co-founder, President &
Chief Executive Officer
Carl Shepherd
Co-founder,
Chief Strategy Officer
Lynn Atchison
Chief Financial Officer
Brent Bellm
Chief Operating Officer
Tom Hale
Chief Product Officer
Ross Buhrdorf
Chief Technology Officer
Confidential ©
Copyright 2011 HomeAway, Inc. |
 Confidential
© Copyright 2011 HomeAway, Inc.
Predictable, Profitable, Cash-Rich Business Model
18
Predictable
Free Cash Flow
Profitable
Subscription-Based Revenue Model
High Renewal Rates (75%+)
Leveraged Cost Structure
High Degree of Control over Margins
Annual Up-front Cash (~90%)
Low Capital Expenditures |
 Confidential
© Copyright 2011 HomeAway, Inc.
0
10
20
30
40
50
60
3Q’08
4Q’08
1Q’09
2Q’09
3Q’09
4Q’09
1Q’10
2Q’10
3Q’10
4Q’10
1Q’11
2Q'11
3Q'11
Revenue
($MM)
Strong and Consistent Revenue Growth
19 |
 Confidential
© Copyright 2011 HomeAway, Inc.
Rest of World
2%
76%
73%
74%
2008
2009
2010
Strong Renewal
Globally
Diversified
¹
13%
Subscription-Driven
¹
Europe
United States
Other
Listings
87%
36%
62%
Recurring and Diversified Revenue Streams
20
1
As of 9/30/2011 |
 Confidential
© Copyright 2011 HomeAway, Inc.
30.6
43.2
34.1
50.0
24.8
2008
2009
2010
9 MOS.
2010
9 MOS.
2011
High EBITDA margins
Operating leverage from scale
Efficient operating expenses
Highly Efficient Operating Model with Strong Cash Flows
21
% Margin
32%
30%
25%
28%
29%
Adjusted EBITDA
($MM)
Free Cash Flow
($MM)
Seasonality
Best financial indicator
Low capital expenditures
33.9
48.6
38.5
51.5
32.3
2008
2009
2010
9 MOS.
2010
9 MOS.
2011
CapEx:
$4.5
$12.6
$10.4
$6.1
$8.9
1
2009 CapEx includes Leasehold Improvement Additions (Headquarter CapEx) of $4.9MM 1 |
 Confidential
© Copyright 2011 HomeAway, Inc.
Average Revenue per Listing Trend
22
Influenced by…
$290
$298
$314
$311
$328
$339
$335
$250
$275
$300
$325
$350
1Q'10
2Q'10
3Q'10
4Q'10
1Q'11
2Q'11
3Q'11
Pricing changes
Entry into new markets
Short season products
Revenue recognition policy |
 Confidential
© Copyright 2011 HomeAway, Inc.
Clear market leader with powerful global footprint
Strong network effects and significant competitive advantages
Industry disruption provides numerous growth opportunities
Large, highly fragmented vacation rental industry presents huge opportunity
Rapidly growing, highly predictable and profitable subscription-based business
model Compelling
value
proposition
for
vacation
rental
owners/managers
and
travelers
Why Invest in HomeAway?
23 |
 Confidential
© Copyright 2011 HomeAway, Inc.
Appendix
24 |
 Confidential
© Copyright 2011 HomeAway, Inc.
IPO Lock-up Expiration Impact to Shares Outstanding
25
1
Excludes vested options of approximately 5.5 million
Common Stock Outstanding
Float
Lock Up Release
12/26/11
Black Out
Release Feb.
2012
Publicly-held shares
9.2
Board and C-Team
52.9
1
Current employees & consultants
0.9
1
Former Employees
1.0
Other
16.5
9.2
17.5
53.8
% of Outstanding
11.4%
21.8%
66.8%
Breakdown of Other
Tiger, Trident & Google
8.6
~ 3 unrelated
Former Owners of Websites Purchased
5.2
~ 16 unrelated
Other
2.7
~ 25 unrelated |