Attached files
| file | filename |
|---|---|
| 8-K - Apple Hospitality REIT, Inc. | c67732_8-k.htm |
Exhibit 99.1
DEAR SHAREHOLDER

I am pleased to report that the Apple REIT Nine, Inc. portfolio of hotels achieved for the three- and nine-month periods ending September 30, 2011, an average occupancy of 72 percent and 71 percent, an average daily rate (ADR) of $107 and $108, and revenue per available room (RevPAR) of $78 and $76, respectively. Our hotels are diversified across 27 states and although the strength of recovery and ramp-up have varied by market, we are generally very pleased with the performance of our hotels during this initial stage of ownership. Despite minimal improvement in our nation’s economy since the recession, hotel industry analysts report increases in demand for hotel rooms due in part to the relatively small number of new hotels entering the supply side. As these lodging fundamentals further improve, we are optimistic operations among our hotels will continue to strengthen.
Modified funds from operations (MFFO) for the three- and nine-month periods ending September 30, 2011, totaled $31.8 million, or $0.17 per share, and $93.2 million, or $0.51 per share. Based on current trends within our markets, we remain on track to achieve anticipated MFFO for the year ending December 31, 2011, of $112 to $125 million, or approximately $0.61 to $0.68 per share, and net income of approximately $59 to $72 million, or $0.32 to $0.39 per share. The annualized distribution rate is $0.88 per share. We closely monitor our annualized distribution rate, taking into account varying economic cycles and capital improvements as well as current and projected hotel performance, and may make adjustments as needed, based on available cash resources.
Since the time of Apple REIT Nine’s first distribution payment through September 30, 2011, we have paid approximately $309 million to shareholders—$2.93 per share—and achieved MFFO of approximately $191 million and net income of approximately $91 million.(A) The Company has strategically invested approximately $28 million in capital improvements, maintaining the exceptional quality for which the Marriott® and Hilton® brands are known, and today our balance sheet remains among the strongest in our industry, with approximately six percent debt as compared to our total initial capitalization.
The Company currently owns 410 acres of land in the Ft. Worth, TX area that includes 110 sites that are leased to a third party for the production of natural gas. As we continually monitor the profitability of our real estate in an effort to maximize shareholder value, with the approval of our Board of Directors, we have entered into an agreement for the potential sale of these sites at a return that based on current profitability would otherwise take several years to achieve. Certain conditions must be met before the transaction will be completed. If the Company is successful in this transaction, our remaining portfolio would reflect our core strategy of outstanding hospitality assets.
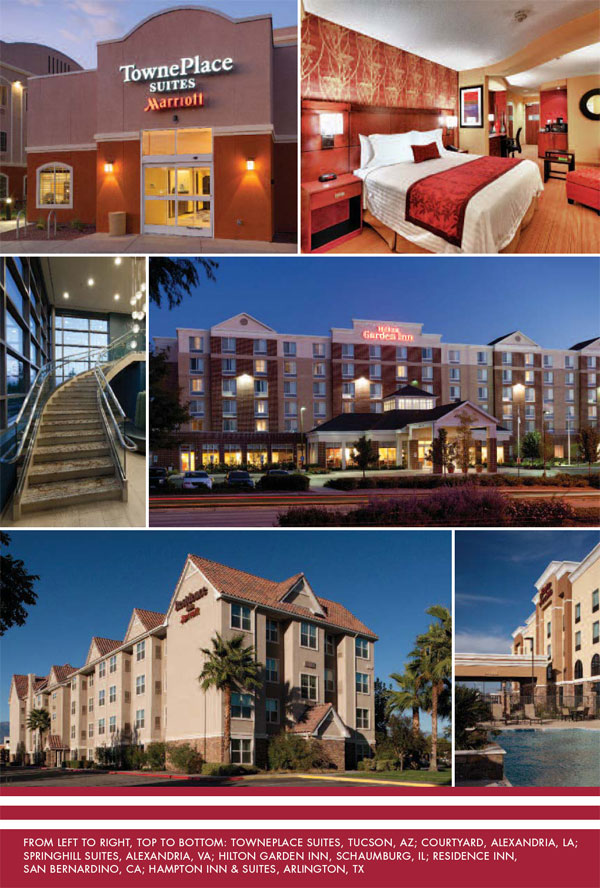
On October 6, 2011, the Company acquired a new 124-room TownePlace Suites® by Marriott® in Tucson, Arizona. With this purchase, our hospitality portfolio includes 87 hotels with 11,106 guestrooms in 27 states. With 43 acquisitions in 2010 and 10 acquisitions plus one new hotel opening in 2011, I believe Apple REIT Nine has entered the lodging marketplace at an opportune time. Thank you for your investment in our Company.

Chairman and Chief Executive Officer
STATEMENTS OF OPERATIONS (Unaudited)
|
|
|
|
|
|
|
|
|
|
|
|
|
|
|
|
(In thousands except statistical data) |
|
Three months |
|
Three months |
|
Nine months |
|
Nine months |
|
||||
|
|
|
|
|
|
|||||||||
|
|
|
|
|
|
|
|
|
|
|
|
|
|
|
|
REVENUES |
|
|
|
|
|
|
|
|
|
|
|
|
|
|
Room revenue |
|
$ |
78,302 |
|
$ |
40,028 |
|
$ |
221,240 |
|
$ |
96,373 |
|
|
Other revenue |
|
|
7,366 |
|
|
3,754 |
|
|
20,858 |
|
|
9,512 |
|
|
|
|
|
|
|
|
||||||||
|
Total hotel revenue |
|
$ |
85,668 |
|
$ |
43,782 |
|
$ |
242,098 |
|
$ |
105,885 |
|
|
|
|
|
|
|
|
|
|
|
|
|
|
|
|
|
EXPENSES |
|
|
|
|
|
|
|
|
|
|
|
|
|
|
Direct operating expense |
|
$ |
21,992 |
|
$ |
11,845 |
|
$ |
61,317 |
|
$ |
29,160 |
|
|
Other hotel operating expenses |
|
|
32,593 |
|
|
16,446 |
|
|
90,683 |
|
|
41,294 |
|
|
General and administrative |
|
|
1,753 |
|
|
1,425 |
|
|
5,298 |
|
|
4,500 |
|
|
Acquisition related costs |
|
|
75 |
|
|
4,626 |
|
|
4,423 |
|
|
10,126 |
|
|
Depreciation |
|
|
12,311 |
|
|
7,334 |
|
|
35,787 |
|
|
18,725 |
|
|
Interest expense, net |
|
|
1,310 |
|
|
263 |
|
|
3,043 |
|
|
567 |
|
|
|
|
|
|
|
|
||||||||
|
Total expenses |
|
$ |
70,034 |
|
$ |
41,939 |
|
$ |
200,551 |
|
$ |
104,372 |
|
|
|
|
|
|
|
|
|
|
|
|
|
|
|
|
|
NET INCOME |
|
|
|
|
|
|
|
|
|
|
|
|
|
|
Income from continuing operations |
|
$ |
15,634 |
|
$ |
1,843 |
|
$ |
41,547 |
|
$ |
1,513 |
|
|
Income from discontinued operations |
|
|
5,128 |
|
|
4,716 |
|
|
14,560 |
|
|
14,145 |
|
|
|
|
|
|
|
|
||||||||
|
Net income |
|
$ |
20,762 |
|
$ |
6,559 |
|
$ |
56,107 |
|
$ |
15,658 |
|
|
|
|
|
|
|
|
||||||||
|
Income from continuing operations per share |
|
$ |
0.08 |
|
$ |
0.02 |
|
$ |
0.23 |
|
$ |
0.02 |
|
|
Income from discontinued operations per share |
|
|
0.03 |
|
|
0.03 |
|
|
0.08 |
|
|
0.11 |
|
|
|
|
|
|
|
|
||||||||
|
Net income per share |
|
$ |
0.11 |
|
$ |
0.05 |
|
$ |
0.31 |
|
$ |
0.13 |
|
|
|
|
|
|
|
|
||||||||
|
|
|
|
|
|
|
|
|
|
|
|
|
|
|
|
MODIFIED FUNDS FROM OPERATIONS (A) |
|
|
|
|
|
|
|
|
|
|
|
|
|
|
Net income |
|
$ |
20,762 |
|
$ |
6,559 |
|
$ |
56,107 |
|
$ |
15,658 |
|
|
Depreciation of real estate owned |
|
|
12,511 |
|
|
7,934 |
|
|
37,187 |
|
|
20,483 |
|
|
|
|
|
|
|
|
||||||||
|
Funds from operations |
|
$ |
33,273 |
|
$ |
14,493 |
|
$ |
93,294 |
|
$ |
36,141 |
|
|
|
|
|
|
|
|
||||||||
|
Straight-line rental income |
|
|
(1,533 |
) |
|
(1,546 |
) |
|
(4,625 |
) |
|
(4,557 |
) |
|
Acquisition related costs |
|
|
75 |
|
|
4,626 |
|
|
4,423 |
|
|
10,126 |
|
|
|
|
|
|
|
|
||||||||
|
Modified FFO |
|
$ |
31,815 |
|
$ |
17,573 |
|
$ |
93,092 |
|
$ |
41,710 |
|
|
|
|
|
|
|
|
||||||||
|
FFO per share |
|
$ |
0.18 |
|
$ |
0.10 |
|
$ |
0.51 |
|
$ |
0.29 |
|
|
Modified FFO per share |
|
$ |
0.17 |
|
$ |
0.12 |
|
$ |
0.51 |
|
$ |
0.34 |
|
|
|
|
|
|
|
|
|
|
|
|
|
|
|
|
|
WEIGHTED-AVERAGE SHARES OUTSTANDING |
|
|
182,769 |
|
|
144,264 |
|
|
182,337 |
|
|
124,054 |
|
|
|
|
|
|
|
|
|
|
|
|
|
|
|
|
|
OPERATING STATISTICS |
|
|
|
|
|
|
|
|
|
|
|
|
|
|
Occupancy |
|
|
72 |
% |
|
70 |
% |
|
71 |
% |
|
67 |
% |
|
Average daily rate |
|
$ |
107 |
|
$ |
104 |
|
$ |
108 |
|
$ |
103 |
|
|
RevPAR |
|
$ |
78 |
|
$ |
73 |
|
$ |
76 |
|
$ |
69 |
|
|
Number of hotels |
|
|
86 |
|
|
54 |
|
|
|
|
|
|
|
|
Distributions per share |
|
$ |
0.22 |
|
$ |
0.22 |
|
$ |
0.66 |
|
$ |
0.66 |
|
|
|
|
|
|
|
|
|
|
|
|
|
|
|
|
|
BALANCE SHEET HIGHLIGHTS (Unaudited) |
|||||||||||||
|
|
|
|
|
|
|
|
|
|
|
|
|
|
|
|
(In thousands) |
|
|
|
|
September 30, 2011 |
|
|
|
|
December 31, 2010 |
|
||
|
|
|
|
|
|
|
||||||||
|
|
|
|
|
|
|
|
|
|
|
|
|
|
|
|
ASSETS |
|
|
|
|
|
|
|
|
|
|
|
|
|
|
Investment in real estate, net |
|
|
|
|
$ |
1,454,865 |
|
|
|
|
$ |
1,461,922 |
|
|
Real estate held for sale |
|
|
|
|
|
157,020 |
|
|
|
|
|
0 |
|
|
Cash and cash equivalents |
|
|
|
|
|
61,402 |
|
|
|
|
|
224,108 |
|
|
Other assets |
|
|
|
|
|
57,094 |
|
|
|
|
|
59,912 |
|
|
|
|
|
|
|
|
|
|
|
|
||||
|
Total assets |
|
|
|
|
$ |
1,730,381 |
|
|
|
|
$ |
1,745,942 |
|
|
|
|
|
|
|
|
|
|
|
|
||||
|
|
|
|
|
|
|
|
|
|
|
|
|
|
|
|
LIABILITIES AND SHAREHOLDERS’ EQUITY |
|
|
|
|
|
|
|
|
|
|
|||
|
Notes payable |
|
|
|
|
$ |
124,880 |
|
|
|
|
$ |
99,649 |
|
|
Other liabilities |
|
|
|
|
|
13,828 |
|
|
|
|
|
12,254 |
|
|
|
|
|
|
|
|
|
|
|
|
||||
|
Total liabilities |
|
|
|
|
|
138,708 |
|
|
|
|
|
111,903 |
|
|
Total shareholders’ equity |
|
|
|
|
|
1,591,673 |
|
|
|
|
|
1,634,039 |
|
|
|
|
|
|
|
|
|
|
|
|
||||
|
Total liabilities & shareholders’ equity |
|
|
|
|
$ |
1,730,381 |
|
|
|
|
$ |
1,745,942 |
|
|
|
|
|
|
|
|
|
|
|
|
||||
(A) Funds from operations (FFO) is defined as net income (computed in accordance with generally accepted accounting principles – GAAP) excluding gains and losses from sales of depreciable property, plus depreciation and amortization. Modified funds from operations (MFFO) excludes rental revenue earned, but not received during the period or (straight-line rent) and costs associated with the acquisition of real estate. The company considers FFO and MFFO in evaluating property acquisitions and its operating performance and believes that FFO and MFFO should be considered along with, but not as an alternative to, net income and cash flows as a measure of the company’s activities in accordance with GAAP. FFO and MFFO are not necessarily indicative of cash available to fund cash needs. The difference in net income and MFFO from January 2008 through September 2011 is depreciation of real estate owned of approximately $86 million, acquisition related costs of approximately $29 million and straight-line rental income of $15 million.
The financial information furnished reflects all adjustments necessary for a fair presentation of financial position at September 30, 2011, and the results of operations for the interim periods ended September 30, 2011. Such interim results are not necessarily indicative of the results that can be expected for the full year. The accompanying financial statements should be read in conjunction with the audited financial statements and related notes appearing in the Apple REIT Nine, Inc. 2010 Annual Report.
|
|
|
STATE / CITY |
|
ALABAMA |
|
Dothan, Troy |
|
ALASKA |
|
Anchorage |
|
ARIZONA |
|
Chandler (2), Phoenix (2), Tucson (2) |
|
ARKANSAS |
|
Rogers (2) |
|
CALIFORNIA |
|
Clovis (2), Santa Ana, San Bernardino, Santa Clarita (4) |
|
COLORADO |
|
Pueblo |
|
FLORIDA |
|
Fort Lauderdale, Miami,
Orlando (2), Panama City, |
|
GEORGIA |
|
Albany |
|
IDAHO |
|
Boise |
|
ILLINOIS |
|
Mettawa (2), Schaumburg, Warrenville |
|
INDIANA |
|
Indianapolis, Mishawaka |
|
LOUISIANA |
|
Alexandria, Baton Rouge, Lafayette (2), West Monroe |
|
MARYLAND |
|
Silver Spring |
|
MASSACHUSETTS |
|
Andover |
|
MICHIGAN |
|
Novi |
|
MINNESOTA |
|
Rochester |
|
MISSISSIPPI |
|
Hattiesburg |
|
MISSOURI |
|
Kansas City, St. Louis (2) |
|
NEW JERSEY |
|
Mt. Laurel, West Orange |
|
NORTH CAROLINA |
|
Charlotte, Durham, Fayetteville, Holly Springs, Jacksonville |
|
OHIO |
|
Cleveland/Twinsburg |
|
OKLAHOMA |
|
Oklahoma City |
|
PENNSYLVANIA |
|
Malvern, Collegeville, Pittsburgh |
|
TENNESSEE |
|
Jackson (2), Johnson City, Nashville |
|
TEXAS |
|
Arlington, Austin (5),
Austin/Round Rock, Beaumont, |
|
UTAH |
|
Salt Lake City |
|
VIRGINIA |
|
Alexandria, Bristol, Manassas |
|
|
|
CORPORATE HEADQUARTERS |
|
814 East Main Street |
|
|
|
INVESTOR INFORMATION |
|
For
additional information about the |
CORPORATE PROFILE
Apple REIT Nine, Inc. is a real estate investment trust (REIT) focused on the acquisition and ownership of income-producing real estate that generates attractive returns for our shareholders. Our hotels operate under the Courtyard® by Marriott®, Fairfield Inn® by Marriott®, Fairfield Inn & Suites® by Marriott®, Marriott® Hotels & Resorts, Residence Inn® by Marriott®, SpringHill Suites® by Marriott®, TownePlace Suites® by Marriott®, Embassy Suites Hotels®, Home2 Suites by Hilton®, Homewood Suites by Hilton®, Hilton®, Hilton Garden Inn®, Hampton Inn® and Hampton Inn & Suites® brands. As of November 9, 2011, the Apple REIT Nine portfolio consisted of 87 hotels with 11,106 guestrooms in 27 states and 110 parcels of land leased to a third party.
MISSION
Apple REIT Nine, Inc. is a premier real estate investment company committed to providing maximum value for our shareholders.
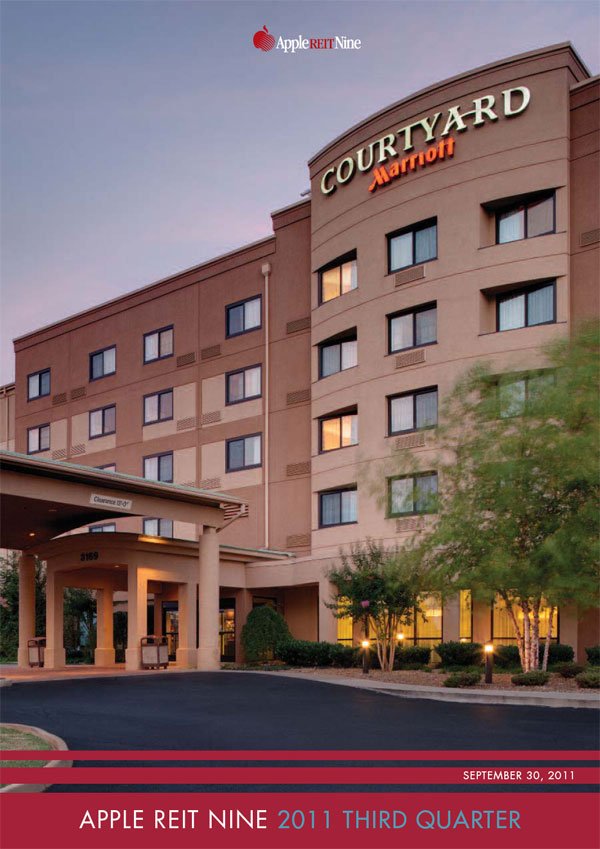
COVER: COURTYARD, BRISTOL, VA
This quarterly report contains forward-looking statements within the meaning of the Securities Act of 1933 and the Securities Exchange Act of 1934. Such statements involve known and unknown risks, uncertainties, and other factors which may cause the actual results, performance, or achievements of the company to be materially different from any future results, performance or achievements expressed or implied by such forward-looking statements. Such factors include: the availability and terms of financing; changes in national, regional and local economies and business conditions; competitors within the hotel industry; the outcome of current and future litigation and regulatory proceedings or inquiries; and the ability of the company to implement its acquisition strategy and operating strategy and to manage planned growth.
In addition, the timing and amounts of distributions to common shareholders are within the discretion of the company’s board of directors. Although the company believes that the assumptions underlying the forward-looking statements contained herein are reasonable, any of the assumptions could be inaccurate; therefore, there can be no assurance that such statements included in this quarterly report will prove to be accurate. In light of the significant uncertainties inherent in the forward-looking statements included herein, the inclusion of such information should not be regarded as a representation by the company or any other person that the results or conditions described in such statements or the objectives and plans of the company will be achieved.
“Courtyard® by Marriott®,” “Fairfield Inn® by Marriott®,” “Fairfield Inn & Suites® by Marriott®,” “Marriott®,” “Residence Inn® by Marriott®,” “SpringHill Suites® by Marriott®” and “TownePlace Suites® by Marriott®” are each a registered trademark of Marriott International, Inc. or one of its affiliates. All references to “Marriott” mean Marriott International and all of its affiliates and subsidiaries, and their respective officers, directors, agents, employees, accountants and attorneys. Marriott is not responsible for the content of this correspondence, whether relating to the hotel information, operating information, financial information, Marriott’s relationship with Apple REIT Nine, Inc. or otherwise. Marriott is not involved in any way whether as an “issuer” or “underwriter” or otherwise in the Apple REIT Nine offering and receives no proceeds from the offering. Marriott has not expressed any approval or disapproval regarding this correspondence, and the grant by Marriott of any franchise or other rights to Apple REIT Nine shall not be construed as any expression of approval or disapproval. Marriott has not assumed and shall not have any liability in connection with this report.
“Embassy Suites Hotels®,” “Hampton Inn®,” “Hampton Inn & Suites®,” “Hilton®,” “Hilton Garden Inn®,” “Home2 Suites by Hilton®,” and “Homewood Suites by Hilton®” are each a registered trademark of Hilton Worldwide or one of its affiliates. All references to “Hilton” mean Hilton Worldwide and all of its affiliates and subsidiaries, and their respective officers, directors, agents, employees, accountants and attorneys. Hilton is not responsible for the content of this correspondence, whether relating to hotel information, operating information, financial information, Hilton’s relationship with Apple REIT Nine, Inc., or otherwise. Hilton is not involved in any way, whether as an “issuer” or “underwriter” or otherwise, in the Apple REIT Nine offering and receives no proceeds from the offering. Hilton has not expressed any approval or disapproval regarding this correspondence, and the grant by Hilton of any franchise or other rights to Apple REIT Nine shall not be construed as any expression of approval or disapproval. Hilton has not assumed and shall not have any liability in connection with this report.