Attached files
| file | filename |
|---|---|
| 8-K - 8-K - Guaranty Bancorp | a11-30513_18k.htm |
Exhibit 99.1
|
|
2011 FBR Fall Investor Conference New York, New York November 29, 2011 |
|
|
Forward Looking Statements 2 This presentation contains forward-looking statements, which are included in accordance with the “safe harbor” provisions of the Private Securities Litigation Reform Act of 1995. In some cases, you can identify forward-looking statements by terminology such as “may,” “will,” “should,” “could,” “expects,” “plans,” “intends,” “anticipates,” “believes,” “estimates,” “predicts,” “potential,” or “continue,” or the negative of such terms and other comparable terminology. These forward-looking statements involve known and unknown risks, uncertainties and other factors that may cause the Company’s actual results, performance or achievements to be materially different from any future results, performance or achievements expressed or implied by such forward-looking statements. Such factors include, among others, the following: failure to maintain adequate levels of capital and liquidity to support Company’s operations; the effect of the regulatory written agreement the Company and its bank subsidiary have entered into and potential future supervisory action against the Company or its bank subsidiary; general economic and business conditions in those areas in which the Company operates; demographic changes; competition; fluctuations in interest rates; continued ability to attract and employ qualified personnel; ability to receive regulatory approval for our bank subsidiary to declare dividends to the Company; adequacy of our allowance for loan losses, changes in credit quality and the effect of credit quality on our provision for credit losses and allowance for loan losses; changes in governmental legislation or regulation, including, but not limited to, any increase in FDIC insurance premiums; changes in accounting policies and practices; changes in the deferred tax asset valuation allowance; changes in business strategy or development plans; changes in the securities markets; changes in consumer spending, borrowing and savings habits; the availability of capital from private or government sources; competition for loans and deposits and failure to attract or retain loans and deposits; changes in the financial performance and/or condition of our borrowers and the ability of our borrowers to perform under the terms of their loans and other terms of credit agreements; political instability, acts of war or terrorism and natural disasters; and additional “Risk Factors” referenced in the Company’s most recent Annual Report on Form 10-K filed with the Securities and Exchange Commission, as supplemented from time to time. When relying on forward-looking statements to make decisions with respect to the Company, investors and others are cautioned to consider these and other risks and uncertainties. The Company can give no assurance that any goal or plan or expectation set forth in forward-looking statements can be achieved and readers are cautioned not to place undue reliance on such statements, which speak only as of the date made. The forward-looking statements are made as of the date of these materials, and the Company does not intend, and assumes no obligation, to update the forward-looking statements or to update the reasons why actual results could differ from those projected in the forward-looking statements. Investors and security holders are urged to read the Company’s Annual Report on Form 10-K, quarterly reports on Form 10-Q and other documents filed by the Company with the SEC. The documents filed by the Company with the SEC may be obtained at the company’s website at www.gbnk.com or at the SEC's website at www.sec.gov. These documents may also be obtained free of charge from the Company by directing a request to: Guaranty Bancorp, 1331 Seventeenth St., Suite 345, Denver, CO 80202.; Attention: Christopher Treece/Investor Relations; Telephone 303-675-1194. |
|
|
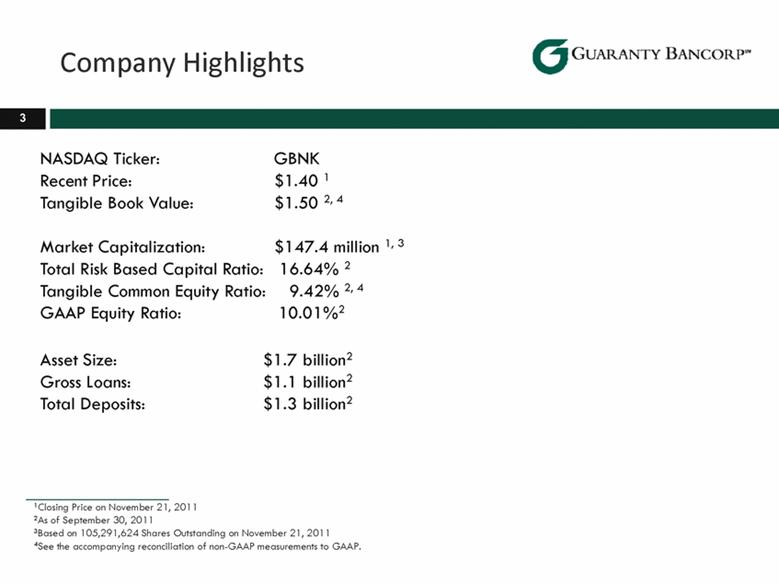
Company Highlights 3 NASDAQ Ticker: GBNK Recent Price: $1.40 1 Tangible Book Value: $1.50 2, 4 Market Capitalization: $147.4 million 1, 3 Total Risk Based Capital Ratio: 16.64% 2 Tangible Common Equity Ratio: 9.42% 2, 4 GAAP Equity Ratio: 10.01%2 1Closing Price on November 21, 2011 2As of September 30, 2011 3Based on 105,291,624 Shares Outstanding on November 21, 2011 4See the accompanying reconciliation of non-GAAP measurements to GAAP. Asset Size: $1.7 billion2 Gross Loans: $1.1 billion2 Total Deposits: $1.3 billion2 |
|
|
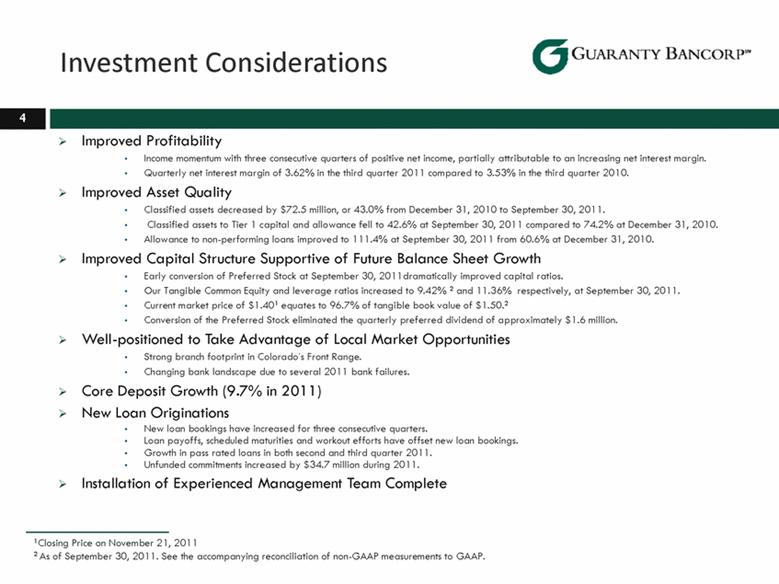
Investment Considerations 4 Improved Profitability Income momentum with three consecutive quarters of positive net income, partially attributable to an increasing net interest margin. Quarterly net interest margin of 3.62% in the third quarter 2011 compared to 3.53% in the third quarter 2010. Improved Asset Quality Classified assets decreased by $72.5 million, or 43.0% from December 31, 2010 to September 30, 2011. Classified assets to Tier 1 capital and allowance fell to 42.6% at September 30, 2011 compared to 74.2% at December 31, 2010. Allowance to non-performing loans improved to 111.4% at September 30, 2011 from 60.6% at December 31, 2010. Improved Capital Structure Supportive of Future Balance Sheet Growth Early conversion of Preferred Stock at September 30, 2011dramatically improved capital ratios. Our Tangible Common Equity and leverage ratios increased to 9.42% 2 and 11.36% respectively, at September 30, 2011. Current market price of $1.401 equates to 96.7% of tangible book value of $1.50.2 Conversion of the Preferred Stock eliminated the quarterly preferred dividend of approximately $1.6 million. Well-positioned to Take Advantage of Local Market Opportunities Strong branch footprint in Colorado’s Front Range. Changing bank landscape due to several 2011 bank failures. Core Deposit Growth (9.7% in 2011) New Loan Originations New loan bookings have increased for three consecutive quarters. Loan payoffs, scheduled maturities and workout efforts have offset new loan bookings. Growth in pass rated loans in both second and third quarter 2011. Unfunded commitments increased by $34.7 million during 2011. Installation of Experienced Management Team Complete 1Closing Price on November 21, 2011 2 As of September 30, 2011. See the accompanying reconciliation of non-GAAP measurements to GAAP. |
|
|
5 Mission Statement: Guaranty Bank and Trust is a Colorado community bank with over 50 years serving the market. Our highly skilled and experienced bankers help individuals and businesses meet their financial goals by offering practical advice, personalized solutions and local decision making. Why we are uniquely positioned in the marketplace: Exceptional customer service and knowledge of our customer base Balanced retail and commercial offerings delivered through more than 30 branches Extensive geographic footprint and local knowledge with a Front Range focus Trusted customer relationships Well capitalized and liquid Willingness to lend Strong employee commitment About Us |
|
|
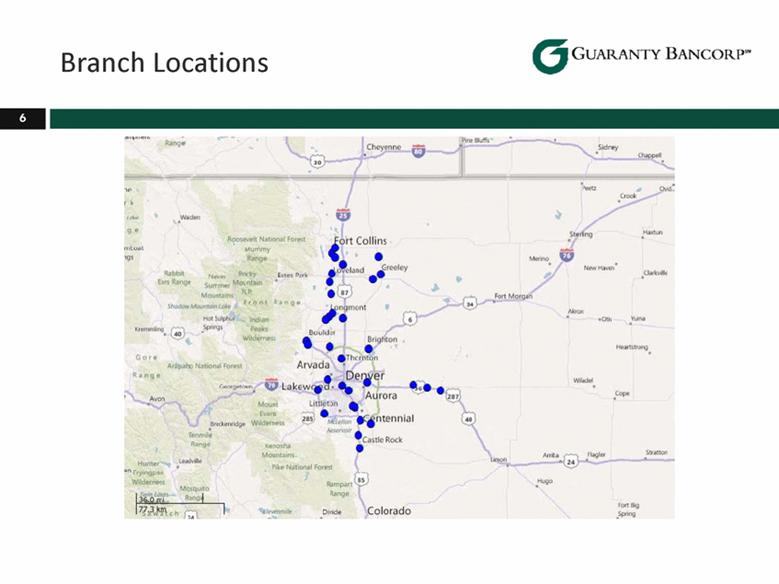
Branch Locations 6 |
|
|
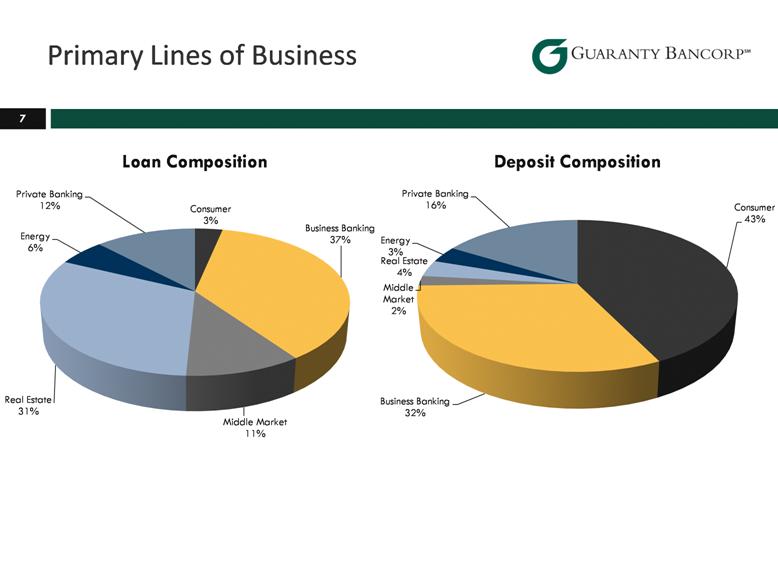
7 Primary Lines of Business |
|
|
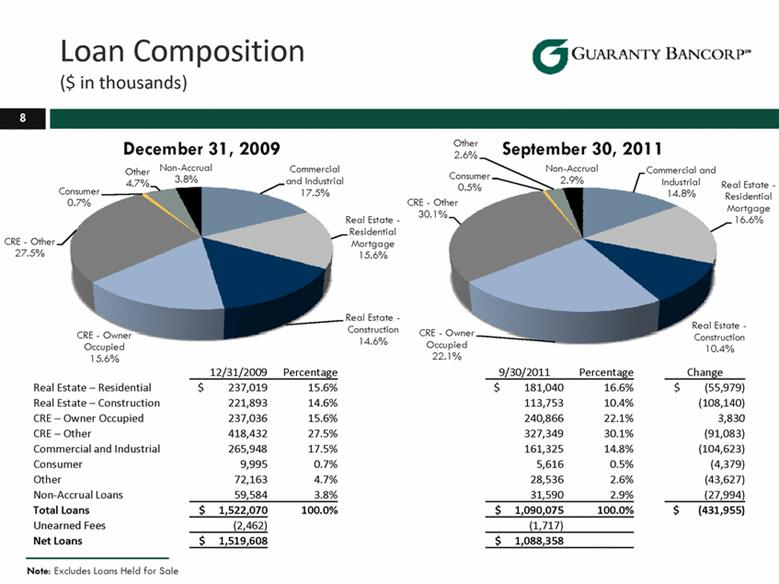
Loan Composition ($ in thousands) 8 12/31/2009 Percentage 9/30/2011 Percentage Change Real Estate – Residential $ 237,019 15.6% $ 181,040 16.6% $ (55,979) Real Estate – Construction 221,893 14.6% 113,753 10.4% (108,140) CRE – Owner Occupied 237,036 15.6% 240,866 22.1% 3,830 CRE – Other 418,432 27.5% 327,349 30.1% (91,083) Commercial and Industrial 265,948 17.5% 161,325 14.8% (104,623) Consumer 9,995 0.7% 5,616 0.5% (4,379) Other 72,163 4.7% 28,536 2.6% (43,627) Non-Accrual Loans 59,584 3.8% 31,590 2.9% (27,994) Total Loans $ 1,522,070 100.0% $ 1,090,075 100.0% $ (431,955) Unearned Fees (2,462) (1,717) Net Loans $ 1,519,608 $ 1,088,358 Note: Excludes Loans Held for Sale |
|
|
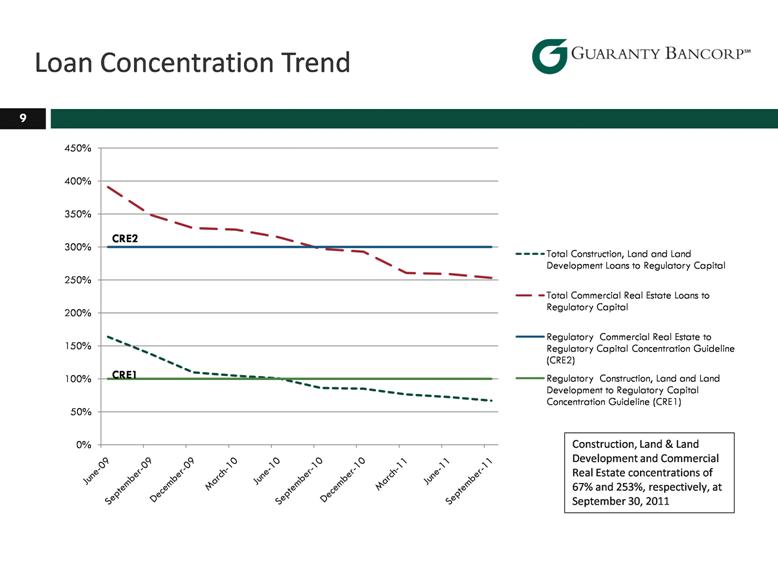
Loan Concentration Trend 9 Construction, Land & Land Development and Commercial Real Estate concentrations of 67% and 253%, respectively, at September 30, 2011 |
|
|
Loan Portfolio Activity1 ($ in thousands) 10 September 30, 2010 December 31, 2010 March 31, 2011 June 30, 2011 September 30, 2011 Loans - Beginning Balance $ 1,374,209 $ 1,289,492 $ 1,204,580 $ 1,126,083 $ 1,091,132 New Credit Extended 45,164 24,665 33,406 71,357 84,842 Net Existing Credit Advanced 23,413 34,252 18,615 22,797 15,342 Net Paydowns & Maturities (123,225) (111,852) (117,728) (117,612) (95,995) Net Loan Charge-Offs (7,469) (14,328) (2,190) (9,024) (4,114) Transfers to OREO (24,744) (3,293) (11,610) (2,156) (2,355) Transfers to Held for Sale 1,150 (14,200) - - - Loan Settlement 994 (156) 1,010 (313) (494) Loans - Ending Balance $ 1,289,492 $ 1,204,580 $ 1,126,083 $ 1,091,132 $ 1,088,358 1 Excludes Loans Held for Sale 2 Excludes changes in classified, special mention and watch list loans. $60.2 million quarterly increase in credit extended from fourth quarter 2010 to third quarter 2011 Quarter Ending |
|
|
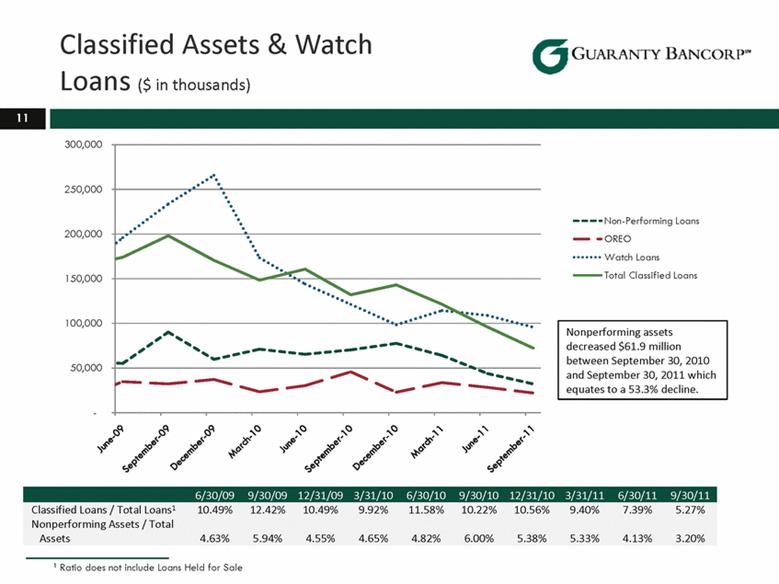
Classified Assets & Watch Loans ($ in thousands) 11 6/30/09 9/30/09 12/31/09 3/31/10 6/30/10 9/30/10 12/31/10 3/31/11 6/30/11 9/30/11 Classified Loans / Total Loans1 10.49% 12.42% 10.49% 9.92% 11.58% 10.22% 10.56% 9.40% 7.39% 5.27% Nonperforming Assets / Total Assets 4.63% 5.94% 4.55% 4.65% 4.82% 6.00% 5.38% 5.33% 4.13% 3.20% 1 Ratio does not include Loans Held for Sale |
|
|
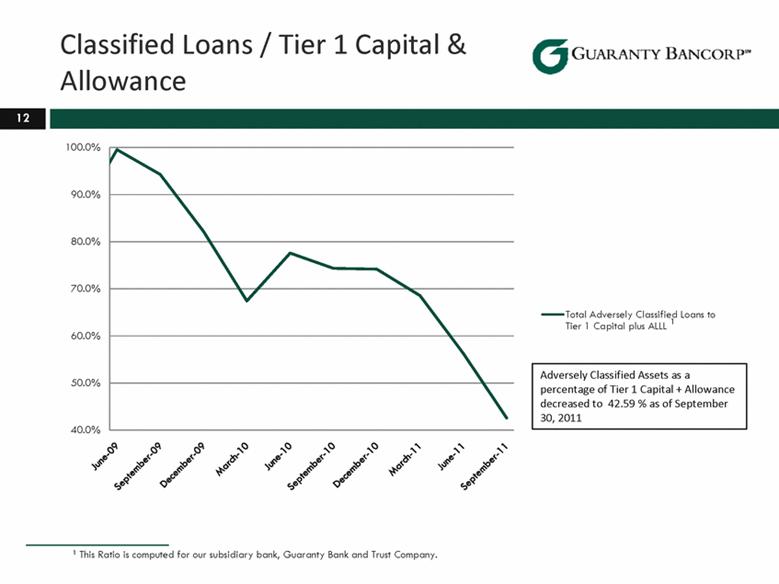
Classified Loans / Tier 1 Capital & Allowance 12 1 This Ratio is computed for our subsidiary bank, Guaranty Bank and Trust Company. Adversely Classified Assets as a percentage of Tier 1 Capital + Allowance decreased to 42.59 % as of September 30, 2011 |
|
|
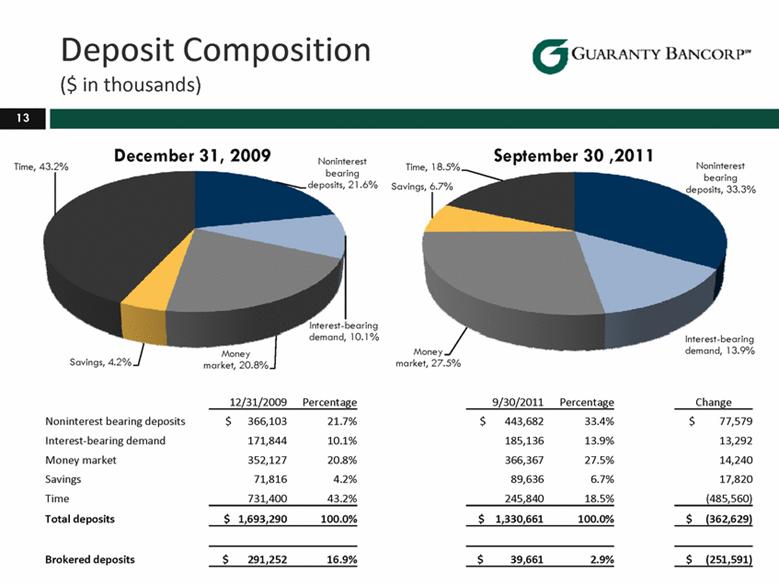
Deposit Composition ($ in thousands) 13 12/31/2009 Percentage 9/30/2011 Percentage Change Noninterest bearing deposits $ 366,103 21.7% $ 443,682 33.4% $ 77,579 Interest-bearing demand 171,844 10.1% 185,136 13.9% 13,292 Money market 352,127 20.8% 366,367 27.5% 14,240 Savings 71,816 4.2% 89,636 6.7% 17,820 Time 731,400 43.2% 245,840 18.5% (485,560) Total deposits $ 1,693,290 100.0% $ 1,330,661 100.0% $ (362,629) Brokered deposits $ 291,252 16.9% $ 39,661 2.9% $ (251,591) |
|
|
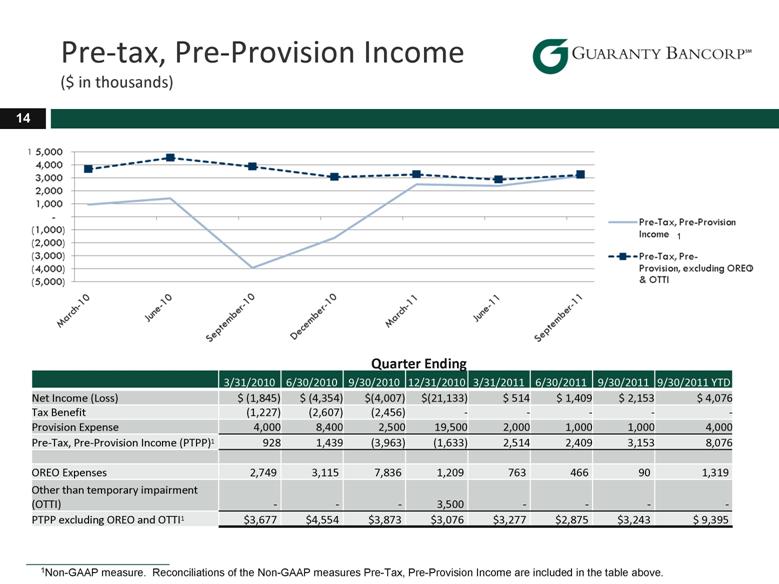
Pre-tax, Pre-Provision Income ($ in thousands) 14 3/31/2010 6/30/2010 9/30/2010 12/31/2010 3/31/2011 6/30/2011 9/30/2011 9/30/2011 YTD Net Income (Loss) $ (1,845) $ (4,354) $4,007) $(21,133) $ 514 $ 1,409 $ 2,153 $ 4,076 Tax Benefit (1,227) (2,607) (2,456) - - - - - Provision Expense 4,000 8,400 2,500 19,500 2,000 1,000 1,000 4,000 Pre-Tax, Pre-Provision Income (PTPP)1 928 1,439 (3,963) (1,633) 2,514 2,409 3,153 8,076 OREO Expenses 2,749 3,115 7,836 1,209 763 466 90 1,319 Other than temporary impairment (OTTI) - - - 3,500 - - - - PTPP excluding OREO and OTTI1 $3,677 $4,554 $3,873 $3,076 $3,277 $2,875 $3,243 $ 9,395 1Non-GAAP measure. Reconciliations of the Non-GAAP measures Pre-Tax, Pre-Provision Income are included in the table above. Quarter Ending 1 |
|
|
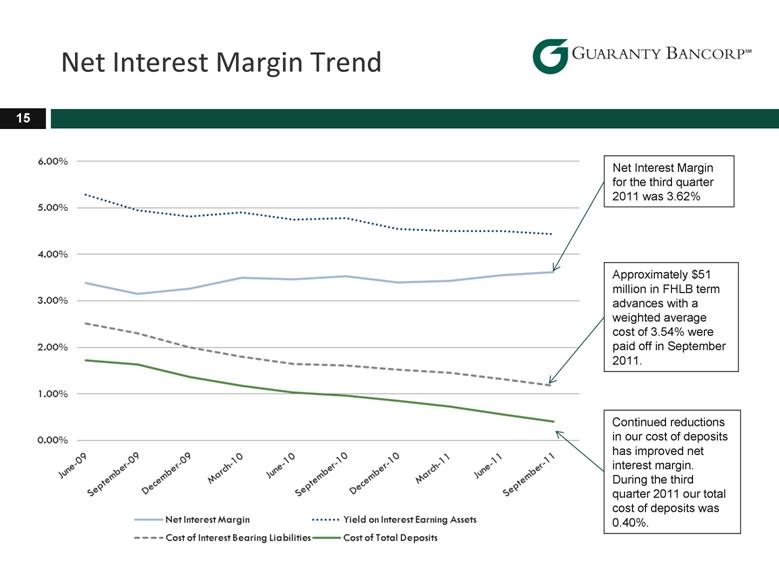
Net Interest Margin Trend 15 Approximately $51 million in FHLB term advances with a weighted average cost of 3.54% were paid off in September 2011. Net Interest Margin for the third quarter 2011 was 3.62% Continued reductions in our cost of deposits has improved net interest margin. During the third quarter 2011 our total cost of deposits was 0.40%. |
|
|
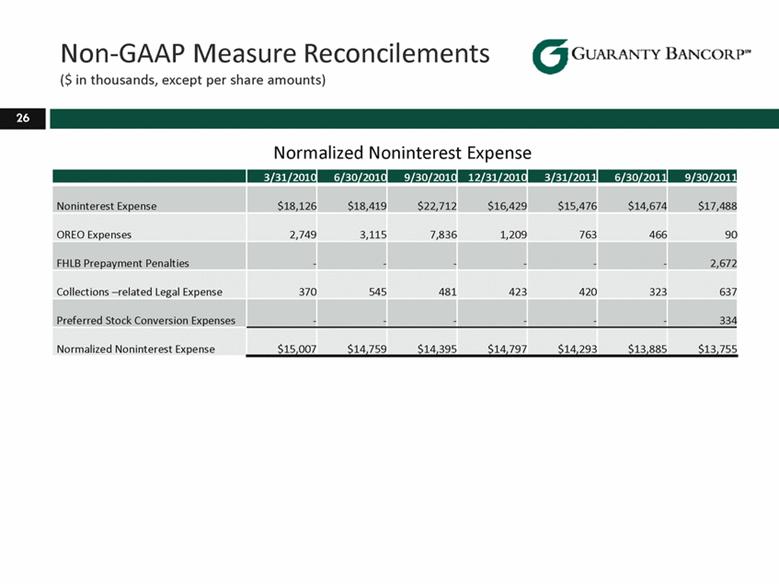
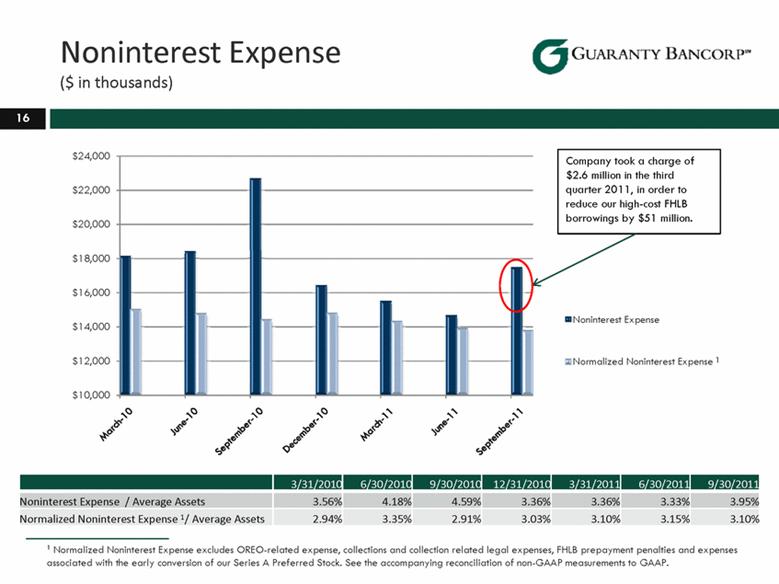
Noninterest Expense ($ in thousands) 16 3/31/2010 6/30/2010 9/30/2010 12/31/2010 3/31/2011 6/30/2011 9/30/2011 Noninterest Expense / Average Assets 3.56% 4.18% 4.59% 3.36% 3.36% 3.33% 3.95% Normalized Noninterest Expense 1/ Average Assets 2.94% 3.35% 2.91% 3.03% 3.10% 3.15% 3.10% 1 Normalized Noninterest Expense excludes OREO-related expense, collections and collection related legal expenses, FHLB prepayment penalties and expenses associated with the early conversion of our Series A Preferred Stock. See the accompanying reconciliation of non-GAAP measurements to GAAP. 1 |
|
|
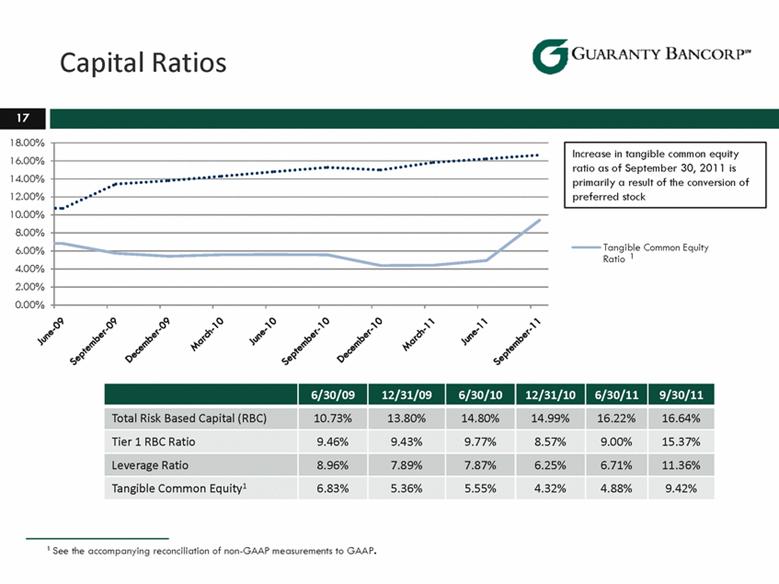
Capital Ratios 6/30/09 12/31/09 6/30/10 12/31/10 6/30/11 9/30/11 Total Risk Based Capital (RBC) 10.73% 13.80% 14.80% 14.99% 16.22% 16.64% Tier 1 RBC Ratio 9.46% 9.43% 9.77% 8.57% 9.00% 15.37% Leverage Ratio 8.96% 7.89% 7.87% 6.25% 6.71% 11.36% Tangible Common Equity1 6.83% 5.36% 5.55% 4.32% 4.88% 9.42% 17 1 See the accompanying reconciliation of non-GAAP measurements to GAAP. Increase in tangible common equity ratio as of September 30, 2011 is primarily a result of the conversion of preferred stock 1 |
|
|
Colorado Market Opportunity 18 |

|
|
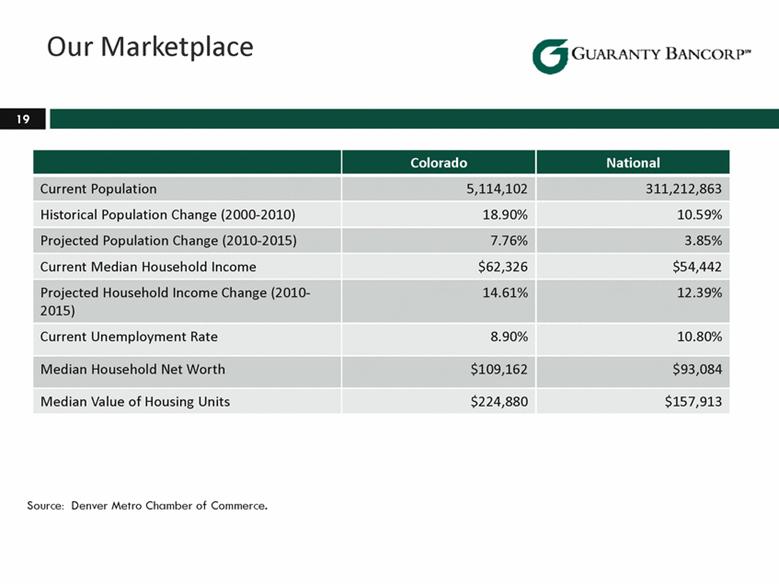
19 Our Marketplace Colorado National Current Population 5,114,102 311,212,863 Historical Population Change (2000-2010) 18.90% 10.59% Projected Population Change (2010-2015) 7.76% 3.85% Current Median Household Income $62,326 $54,442 Projected Household Income Change (2010-2015) 14.61% 12.39% Current Unemployment Rate 8.90% 10.80% Median Household Net Worth $109,162 $93,084 Median Value of Housing Units $224,880 $157,913 Source: Denver Metro Chamber of Commerce. |
|
|
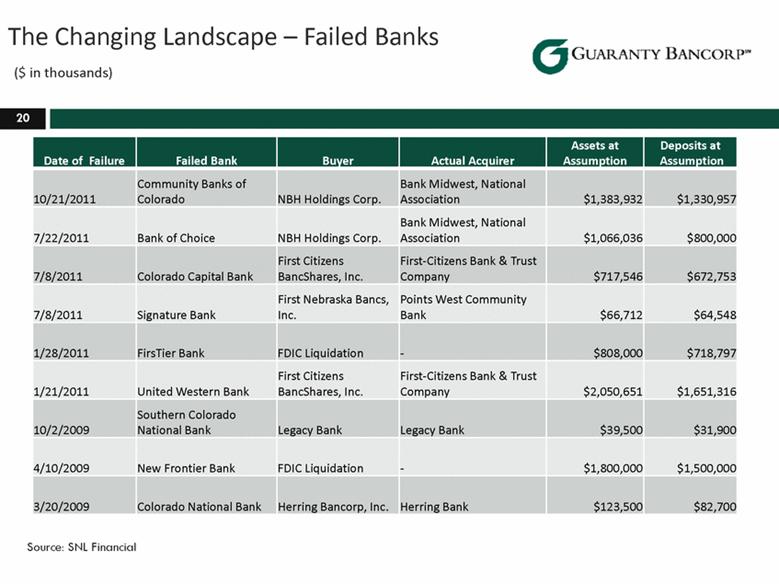
20 Date of Failure Failed Bank Buyer Actual Acquirer Assets at Assumption Deposits at Assumption 10/21/2011 Community Banks of Colorado NBH Holdings Corp. Bank Midwest, National Association $1,383,932 $1,330,957 7/22/2011 Bank of Choice NBH Holdings Corp. Bank Midwest, National Association $1,066,036 $800,000 7/8/2011 Colorado Capital Bank First Citizens BancShares, Inc. First-Citizens Bank & Trust Company $717,546 $672,753 7/8/2011 Signature Bank First Nebraska Bancs, Inc. Points West Community Bank $66,712 $64,548 1/28/2011 FirsTier Bank FDIC Liquidation - $808,000 $718,797 1/21/2011 United Western Bank First Citizens BancShares, Inc. First-Citizens Bank & Trust Company $2,050,651 $1,651,316 10/2/2009 Southern Colorado National Bank Legacy Bank Legacy Bank $39,500 $31,900 4/10/2009 New Frontier Bank FDIC Liquidation - $1,800,000 $1,500,000 3/20/2009 Colorado National Bank Herring Bancorp, Inc. Herring Bank $123,500 $82,700 The Changing Landscape – Failed Banks ($ in thousands) Source: SNL Financial |
|
|
21 Business Climate Metro Denver ranks ninth and Fort Collins ranks fifth among the 50 “Best Places for Business” in 2011 – Forbes, 2011 Colorado is No. 5 America’s Top States for Business, ranking highly for workforce, access to capital, business friendliness and quality of life – CNBC, 2011 Colorado ranks second in Small Business Innovative Research (SBIR) grants, third in venture capital investments per $1,000 for State GDP, and fourth in the number of new companies per 1,000 employees – Toward a More Competitive Colorado , Sixth Edition 2010 Denver is the No. 1 city where people want to live – Pew Research Center, 2009 Colorado is the second-most highly educated state – U.S. Census Bureau, American Community Survey, 2010 Denver International Airport is the fifth-busiest U.S. airport and is the 10th busiest in the world – Federal Aviation Administration, 2010 FasTracks is the largest simultaneous construction of a mass transit system in U.S. History – American Public Transportation Association |
|
|
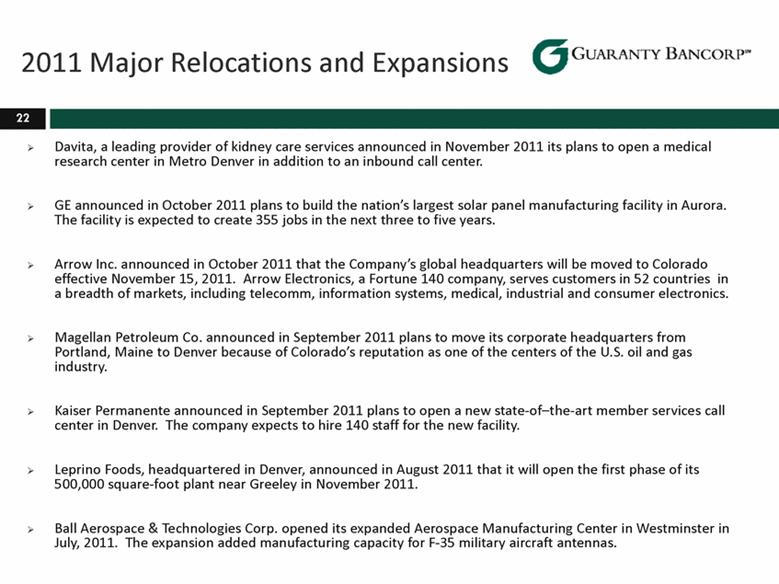
2011 Major Relocations and Expansions 22 Davita, a leading provider of kidney care services announced in November 2011 its plans to open a medical research center in Metro Denver in addition to an inbound call center. GE announced in October 2011 plans to build the nation’s largest solar panel manufacturing facility in Aurora. The facility is expected to create 355 jobs in the next three to five years. Arrow Inc. announced in October 2011 that the Company’s global headquarters will be moved to Colorado effective November 15, 2011. Arrow Electronics, a Fortune 140 company, serves customers in 52 countries in a breadth of markets, including telecomm, information systems, medical, industrial and consumer electronics. Magellan Petroleum Co. announced in September 2011 plans to move its corporate headquarters from Portland, Maine to Denver because of Colorado’s reputation as one of the centers of the U.S. oil and gas industry. Kaiser Permanente announced in September 2011 plans to open a new state-of–the-art member services call center in Denver. The company expects to hire 140 staff for the new facility. Leprino Foods, headquartered in Denver, announced in August 2011 that it will open the first phase of its 500,000 square-foot plant near Greeley in November 2011. Ball Aerospace & Technologies Corp. opened its expanded Aerospace Manufacturing Center in Westminster in July, 2011. The expansion added manufacturing capacity for F-35 military aircraft antennas. |
|
|
23 Major Colorado Industries Education – Five major universities Communication and Technology Oil and Gas Aerospace Health Care Hospitality and Food Services Breweries Tourism Clean Technology Agriculture Financial Services |

|
|
Reconciliations of Non-GAAP Measures 24 |
|
|
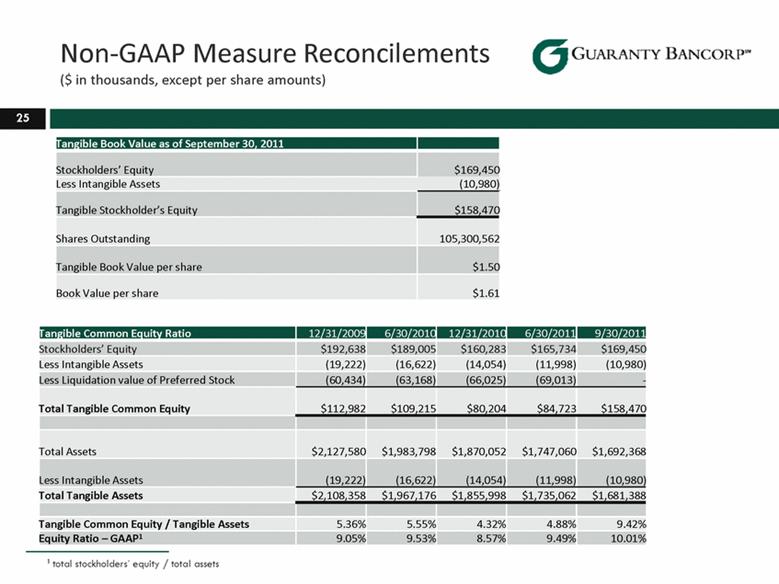
Non-GAAP Measure Reconcilements ($ in thousands, except per share amounts) 25 Tangible Book Value as of September 30, 2011 Stockholders’ Equity $169,450 Less Intangible Assets (10,980) Tangible Stockholder’s Equity $158,470 Shares Outstanding 105,300,562 Tangible Book Value per share $1.50 Book Value per share $1.61 Tangible Common Equity Ratio 12/31/2009 6/30/2010 12/31/2010 6/30/2011 9/30/2011 Stockholders’ Equity $192,638 $189,005 $160,283 $165,734 $169,450 Less Intangible Assets (19,222) (16,622) (14,054) (11,998) (10,980) Less Liquidation value of Preferred Stock (60,434) (63,168) (66,025) (69,013) - Total Tangible Common Equity $112,982 $109,215 $80,204 $84,723 $158,470 Total Assets $2,127,580 $1,983,798 $1,870,052 $1,747,060 $1,692,368 Less Intangible Assets (19,222) (16,622) (14,054) (11,998) (10,980) Total Tangible Assets $2,108,358 $1,967,176 $1,855,998 $1,735,062 $1,681,388 Tangible Common Equity / Tangible Assets 5.36% 5.55% 4.32% 4.88% 9.42% Equity Ratio – GAAP1 9.05% 9.53% 8.57% 9.49% 10.01% 1 total stockholders’ equity / total assets |
|
|
26 3/31/2010 6/30/2010 9/30/2010 12/31/2010 3/31/2011 6/30/2011 9/30/2011 Noninterest Expense $18,126 $18,419 $22,712 $16,429 $15,476 $14,674 $17,488 OREO Expenses 2,749 3,115 7,836 1,209 763 466 90 FHLB Prepayment Penalties - - - - - - 2,672 Collections –related Legal Expense 370 545 481 423 420 323 637 Preferred Stock Conversion Expenses - - - - - - 334 Normalized Noninterest Expense $15,007 $14,759 $14,395 $14,797 $14,293 $13,885 $13,755 Non-GAAP Measure Reconcilements ($ in thousands, except per share amounts) Normalized Noninterest Expense |