Attached files
| file | filename |
|---|---|
| 8-K - 8-K - DEERE & CO | a11-30221_18k.htm |
| EX-99.2 - EX-99.2 - DEERE & CO | a11-30221_1ex99d2.htm |
| EX-99.1 - EX-99.1 - DEERE & CO | a11-30221_1ex99d1.htm |

|
|
| 4th Quarter 2011 Earnings Conference Call 2 Safe Harbor Statement & Disclosures The earnings call and accompanying material include forward-looking comments and information concerning the company’s projections, plans and objectives for the future, including estimates and assumptions with respect to economic, political, technological, weather, market acceptance and other factors that impact our businesses and customers. They also may include financial measures that are not in conformance with accounting principles generally accepted in the United States of America (GAAP). Words such as “forecast,” “projection,” “outlook,” “prospects,” “expected,” “estimated,” “will,” “plan,” “anticipate,” “intend,” “believe,” or other similar words or phrases often identify forward-looking statements. Actual results may differ materially from those projected in these forward-looking statements based on a number of factors and uncertainties. Additional information concerning factors that could cause actual results to differ materially is contained in the company’s most recent Form 8-K and periodic report filed with the U.S. Securities and Exchange Commission, and is incorporated by reference herein. Investors should refer to and consider the incorporated information on risks and uncertainties in addition to the information presented here. Investors should consider non-GAAP financial measures in addition to, and not as a substitute for, financial measures prepared in accordance with GAAP. The company, except as required by law, undertakes no obligation to update or revise its forward-looking statements whether as a result of new developments or otherwise. The call and accompanying materials are not an offer to sell or a solicitation of offers to buy any of the company’s securities. 27 |
|
|
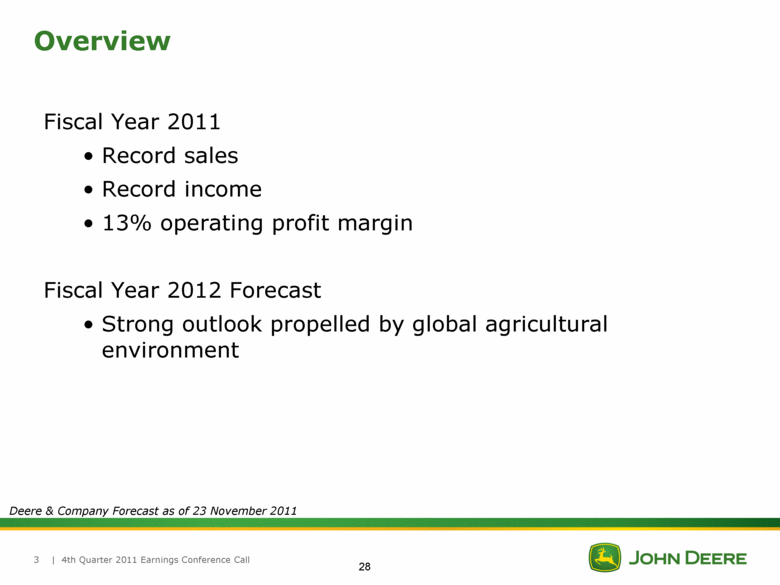
| 4th Quarter 2011 Earnings Conference Call 3 Overview Fiscal Year 2011 Record sales Record income 13% operating profit margin Fiscal Year 2012 Forecast Strong outlook propelled by global agricultural environment Deere & Company Forecast as of 23 November 2011 28 |
|
|
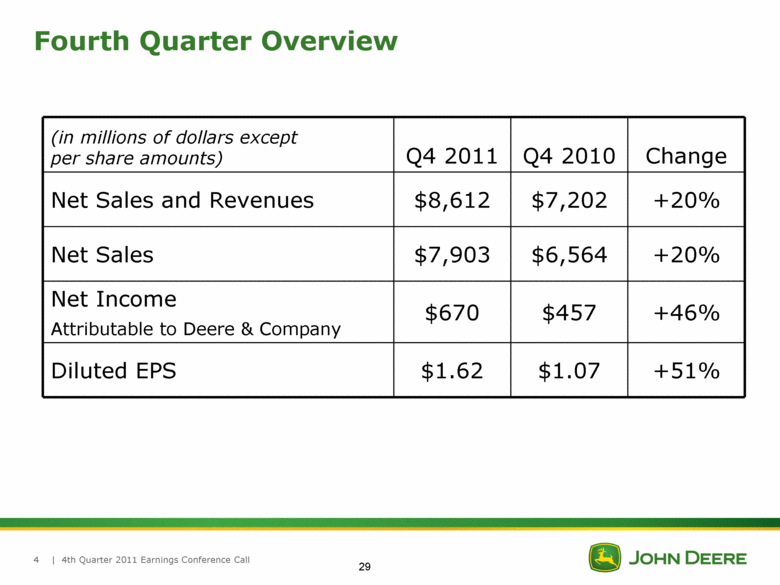
| 4th Quarter 2011 Earnings Conference Call 4 Fourth Quarter Overview (in millions of dollars except per share amounts) Q4 2011 Q4 2010 Change Net Sales and Revenues $8,612 $7,202 +20% Net Sales $7,903 $6,564 +20% Net Income Attributable to Deere & Company $670 $457 +46% Diluted EPS $1.62 $1.07 +51% 29 |
|
|
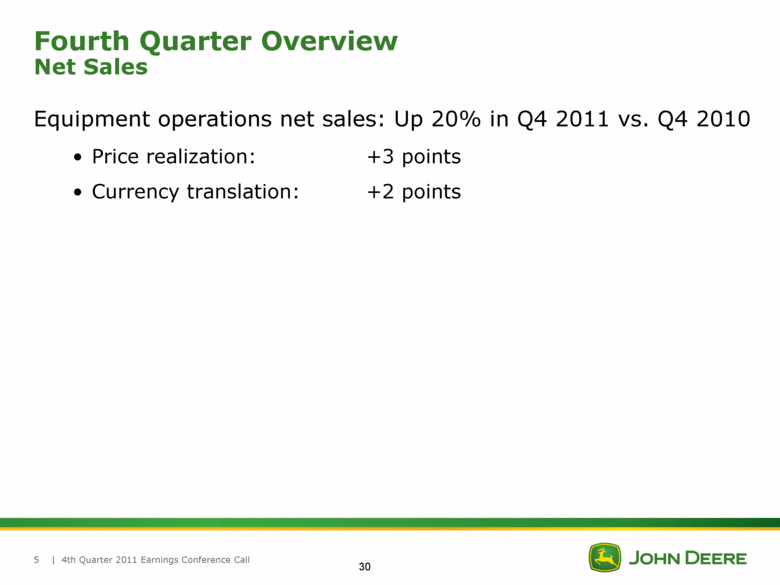
| 4th Quarter 2011 Earnings Conference Call 5 Fourth Quarter Overview Net Sales Equipment operations net sales: Up 20% in Q4 2011 vs. Q4 2010 Price realization: +3 points Currency translation: +2 points 30 |
|
|
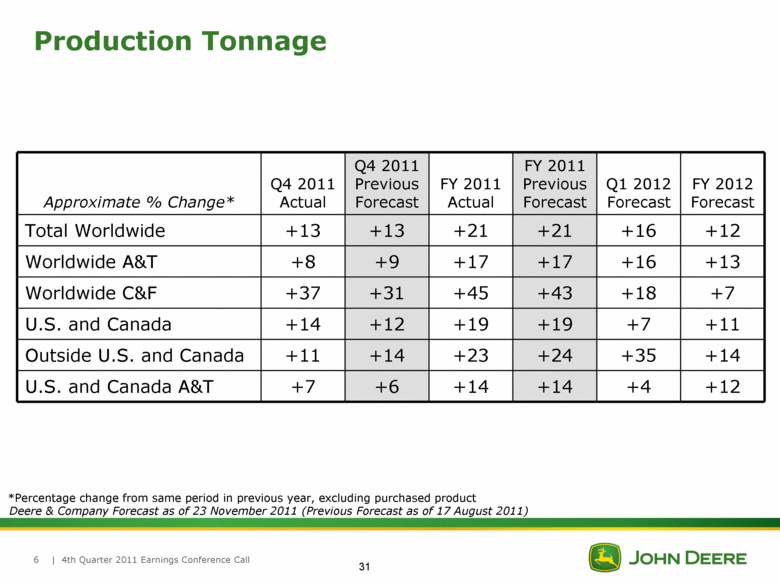
| 4th Quarter 2011 Earnings Conference Call 6 Production Tonnage *Percentage change from same period in previous year, excluding purchased product Deere & Company Forecast as of 23 November 2011 (Previous Forecast as of 17 August 2011) Approximate % Change* Q4 2011 Actual Q4 2011 Previous Forecast FY 2011 Actual FY 2011 Previous Forecast Q1 2012 Forecast FY 2012 Forecast Total Worldwide +13 +13 +21 +21 +16 +12 Worldwide A&T +8 +9 +17 +17 +16 +13 Worldwide C&F +37 +31 +45 +43 +18 +7 U.S. and Canada +14 +12 +19 +19 +7 +11 Outside U.S. and Canada +11 +14 +23 +24 +35 +14 U.S. and Canada A&T +7 +6 +14 +14 +4 +12 31 |
|
|
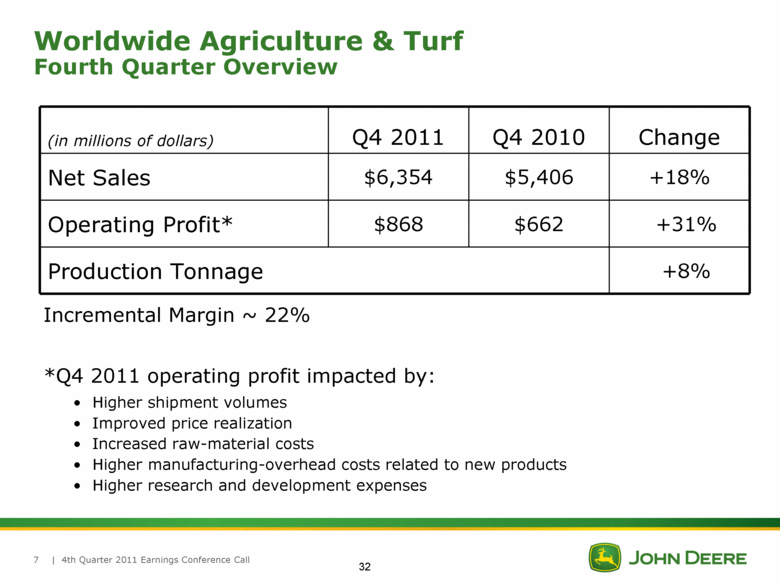
| 4th Quarter 2011 Earnings Conference Call 7 Worldwide Agriculture & Turf Fourth Quarter Overview (in millions of dollars) Q4 2011 Q4 2010 Change Net Sales $6,354 $5,406 +18% Operating Profit* $868 $662 +31% Production Tonnage +8% Incremental Margin ~ 22% *Q4 2011 operating profit impacted by: Higher shipment volumes Improved price realization Increased raw-material costs Higher manufacturing-overhead costs related to new products Higher research and development expenses 32 |
|
|
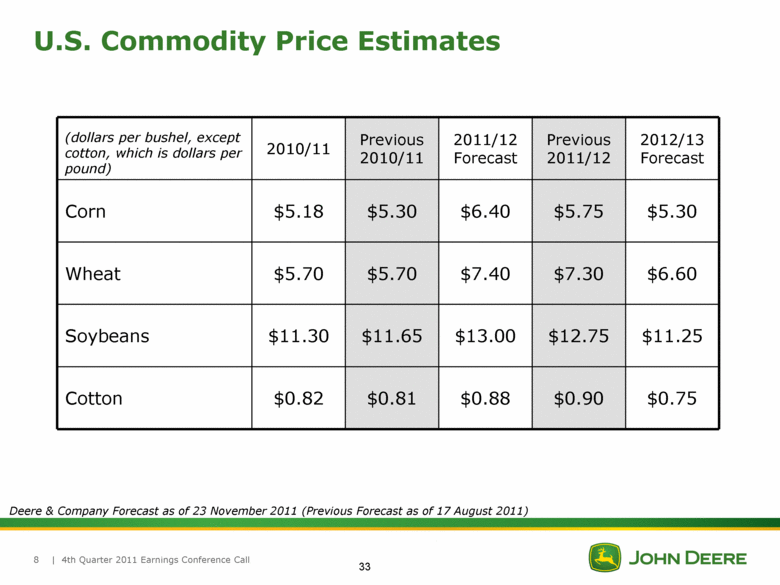
| 4th Quarter 2011 Earnings Conference Call 8 U.S. Commodity Price Estimates Deere & Company Forecast as of 23 November 2011 (Previous Forecast as of 17 August 2011) (dollars per bushel, except cotton, which is dollars per pound) 2010/11 Previous 2010/11 2011/12 Forecast Previous 2011/12 2012/13 Forecast Corn $5.18 $5.30 $6.40 $5.75 $5.30 Wheat $5.70 $5.70 $7.40 $7.30 $6.60 Soybeans $11.30 $11.65 $13.00 $12.75 $11.25 Cotton $0.82 $0.81 $0.88 $0.90 $0.75 33 |
|
|
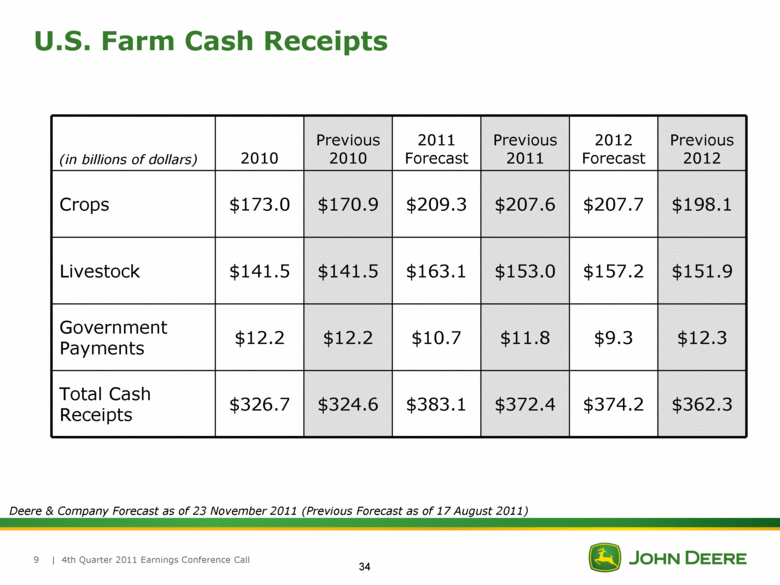
| 4th Quarter 2011 Earnings Conference Call 9 U.S. Farm Cash Receipts Deere & Company Forecast as of 23 November 2011 (Previous Forecast as of 17 August 2011) (in billions of dollars) 2010 Previous 2010 2011 Forecast Previous 2011 2012 Forecast Previous 2012 Crops $173.0 $170.9 $209.3 $207.6 $207.7 $198.1 Livestock $141.5 $141.5 $163.1 $153.0 $157.2 $151.9 Government Payments $12.2 $12.2 $10.7 $11.8 $9.3 $12.3 Total Cash Receipts $326.7 $324.6 $383.1 $372.4 $374.2 $362.3 34 |
|
|
| 4th Quarter 2011 Earnings Conference Call 10 Deere & Company Forecast as of 23 November 2011 Economic Update EU 27 Farm income projected stable in 2012 at high 2011 levels Grain, beef, and milk prices remain at attractive levels Pork prices increasing Demand for agricultural machinery expected to be stable Low levels of used equipment Sovereign debt and fiscal issues create potential downside economic risk and consumer caution Common Agricultural Policy proposed budget 2014-2020 frozen at 2007-2013 nominal levels. Rules generally known eliminating uncertainty. 35 |

|
|
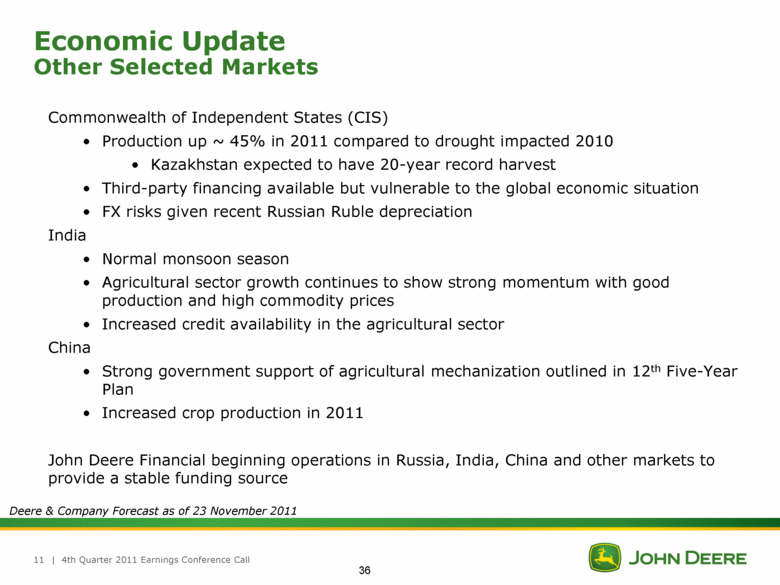
| 4th Quarter 2011 Earnings Conference Call 11 Deere & Company Forecast as of 23 November 2011 Commonwealth of Independent States (CIS) Production up ~ 45% in 2011 compared to drought impacted 2010 Kazakhstan expected to have 20-year record harvest Third-party financing available but vulnerable to the global economic situation FX risks given recent Russian Ruble depreciation India Normal monsoon season Agricultural sector growth continues to show strong momentum with good production and high commodity prices Increased credit availability in the agricultural sector China Strong government support of agricultural mechanization outlined in 12th Five-Year Plan Increased crop production in 2011 John Deere Financial beginning operations in Russia, India, China and other markets to provide a stable funding source Economic Update Other Selected Markets 36 |
|
|
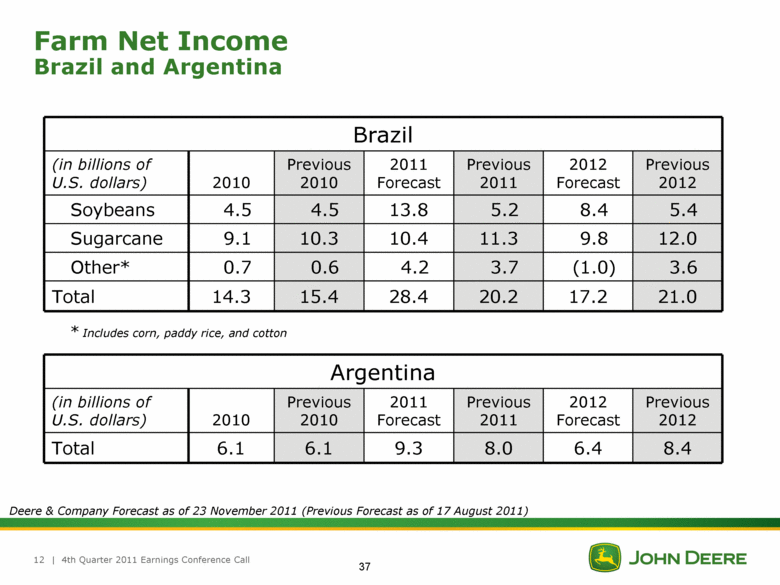
| 4th Quarter 2011 Earnings Conference Call 12 Farm Net Income Brazil and Argentina Brazil (in billions of U.S. dollars) 2010 Previous 2010 2011 Forecast Previous 2011 2012 Forecast Previous 2012 Soybeans 4.5 4.5 13.8 5.2 8.4 5.4 Sugarcane 9.1 10.3 10.4 11.3 9.8 12.0 Other* 0.7 0.6 4.2 3.7 (1.0) 3.6 Total 14.3 15.4 28.4 20.2 17.2 21.0 Argentina (in billions of U.S. dollars) 2010 Previous 2010 2011 Forecast Previous 2011 2012 Forecast Previous 2012 Total 6.1 6.1 9.3 8.0 6.4 8.4 * Includes corn, paddy rice, and cotton Deere & Company Forecast as of 23 November 2011 (Previous Forecast as of 17 August 2011) 37 |
|
|
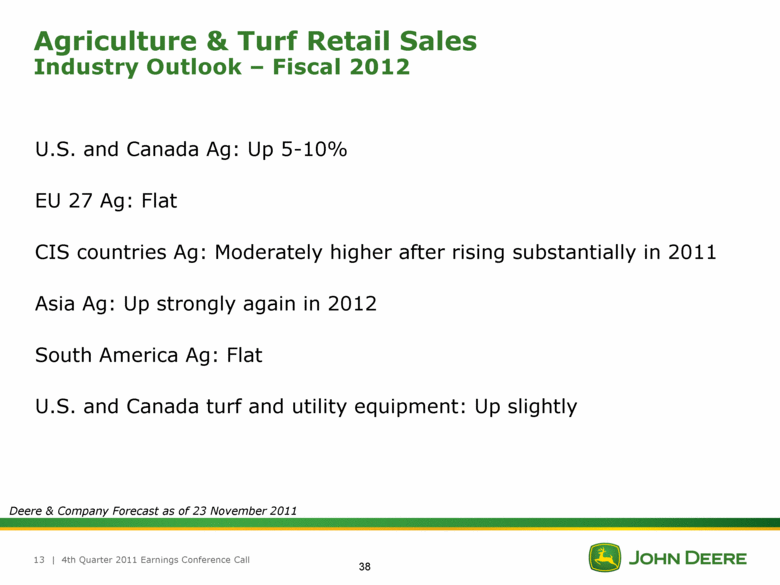
| 4th Quarter 2011 Earnings Conference Call 13 Agriculture & Turf Retail Sales Industry Outlook – Fiscal 2012 U.S. and Canada Ag: Up 5-10% EU 27 Ag: Flat CIS countries Ag: Moderately higher after rising substantially in 2011 Asia Ag: Up strongly again in 2012 South America Ag: Flat U.S. and Canada turf and utility equipment: Up slightly Deere & Company Forecast as of 23 November 2011 38 |
|
|
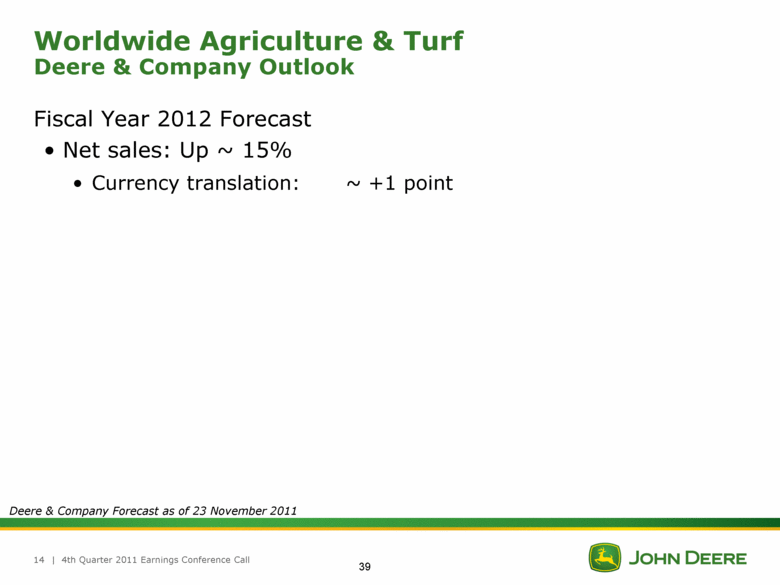
| 4th Quarter 2011 Earnings Conference Call 14 Worldwide Agriculture & Turf Deere & Company Outlook Fiscal Year 2012 Forecast Net sales: Up ~ 15% Currency translation: ~ +1 point Deere & Company Forecast as of 23 November 2011 39 |
|
|
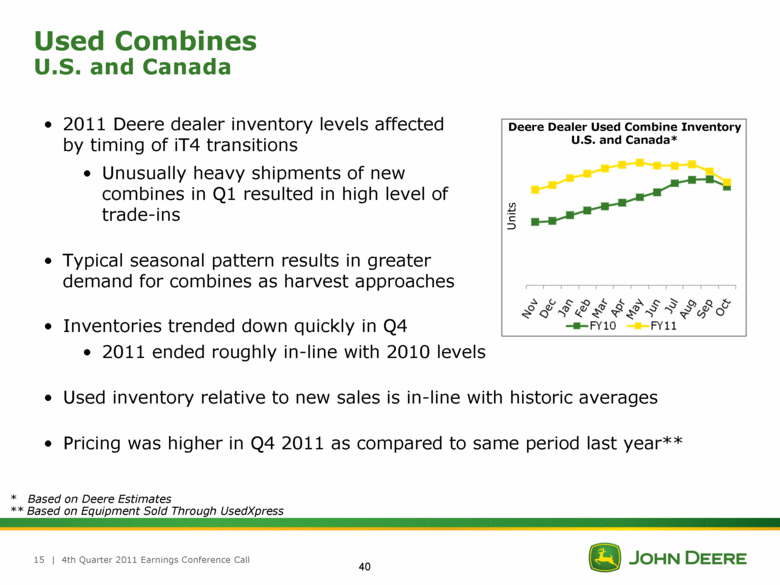
15 | 4th Quarter 2011 Earnings Conference Call * Based on Deere Estimates ** Based on Equipment Sold Through UsedXpress Used Combines U.S. and Canada 2011 Deere dealer inventory levels affected by timing of iT4 transitions Unusually heavy shipments of new combines in Q1 resulted in high level of trade-ins Typical seasonal pattern results in greater demand for combines as harvest approaches Inventories trended down quickly in Q4 2011 ended roughly in-line with 2010 levels Used inventory relative to new sales is in-line with historic averages Pricing was higher in Q4 2011 as compared to same period last year** Units Deere Dealer Used Combine Inventory U.S. and Canada* 40 |
|
|
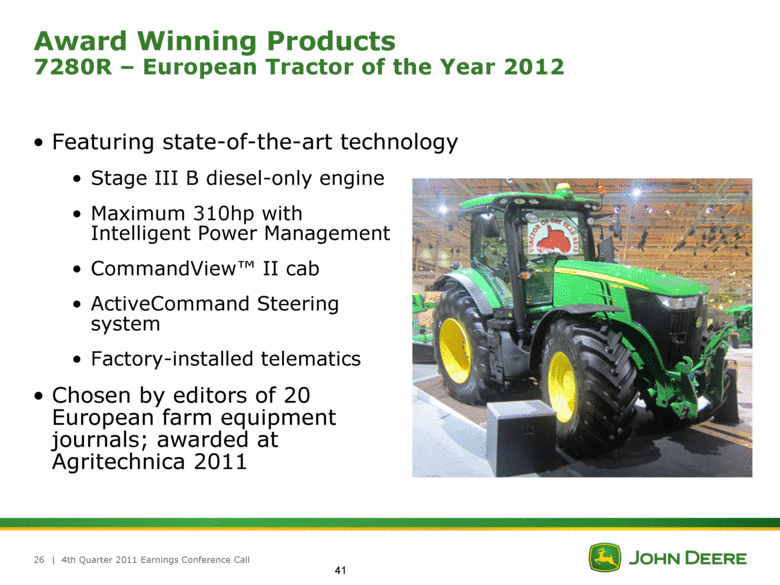
Award Winning Products 7280R – European Tractor of the Year 2012 | 4th Quarter 2011 Earnings Conference Call 16 Featuring state-of-the-art technology Stage III B diesel-only engine Maximum 310hp with Intelligent Power Management CommandView™ II cab ActiveCommand Steering system Factory-installed telematics Chosen by editors of 20 European farm equipment journals; awarded at Agritechnica 2011 41 |
|
|
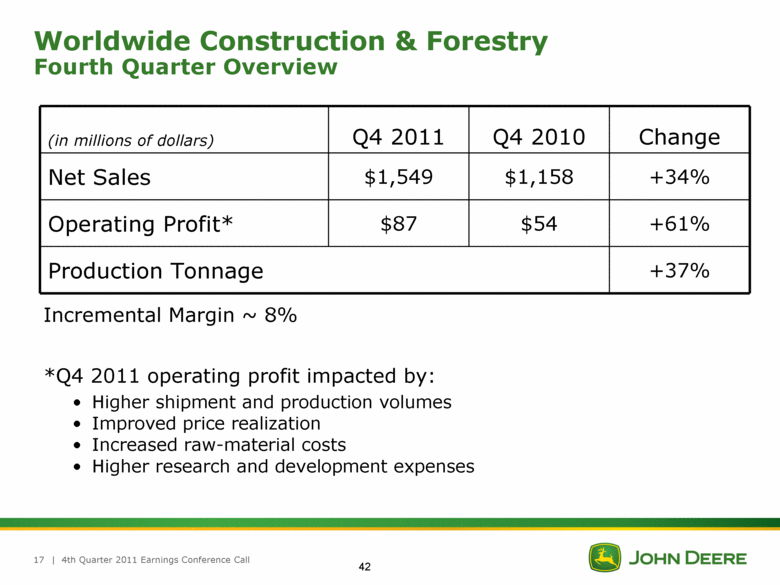
| 4th Quarter 2011 Earnings Conference Call 17 Worldwide Construction & Forestry Fourth Quarter Overview (in millions of dollars) Q4 2011 Q4 2010 Change Net Sales $1,549 $1,158 +34% Operating Profit* $87 $54 +61% Production Tonnage +37% Incremental Margin ~ 8% *Q4 2011 operating profit impacted by: Higher shipment and production volumes Improved price realization Increased raw-material costs Higher research and development expenses 42 |
|
|
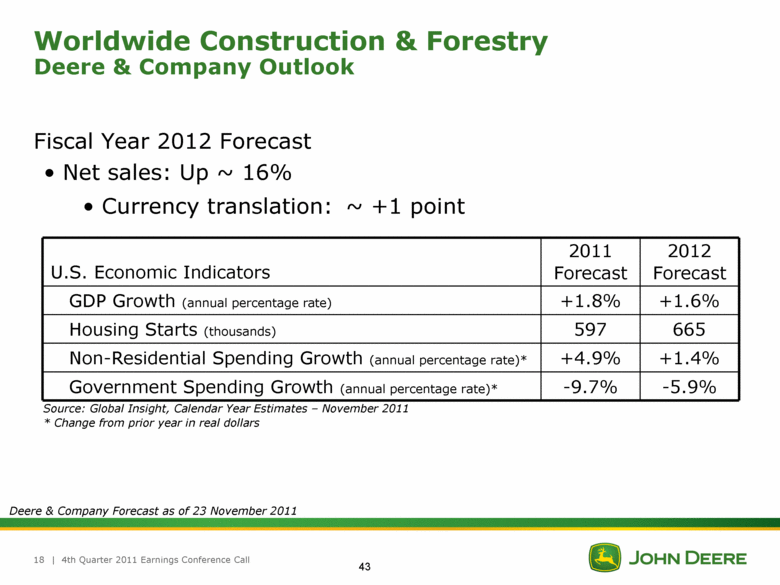
U.S. Economic Indicators 2011 Forecast 2012 Forecast GDP Growth (annual percentage rate) +1.8% +1.6% Housing Starts (thousands) 597 665 Non-Residential Spending Growth (annual percentage rate)* +4.9% +1.4% Government Spending Growth (annual percentage rate)* -9.7% -5.9% | 4th Quarter 2011 Earnings Conference Call 18 Worldwide Construction & Forestry Deere & Company Outlook Source: Global Insight, Calendar Year Estimates – November 2011 * Change from prior year in real dollars Fiscal Year 2012 Forecast Net sales: Up ~ 16% Currency translation: ~ +1 point Deere & Company Forecast as of 23 November 2011 43 |
|
|
Growing in Brazil Construction Equipment | 4th Quarter 2011 Earnings Conference Call 19 Two new factories in Indaiatuba, São Paulo State ~ $180 million total investment; Deere’s portion ~ $124 million Comprehensive line-up of construction equipment Will meet domestic content requirements for FINAME financing Construction of facilities expected to begin in early 2012; production in late 2013 Workforce could exceed 600 employees Solely owned Deere factory Backhoe and four-wheel-drive loaders Partner with Hitachi Construction Machinery Co. Excavators Deere & Company Forecast as of 23 November 2011 44 |

|
|
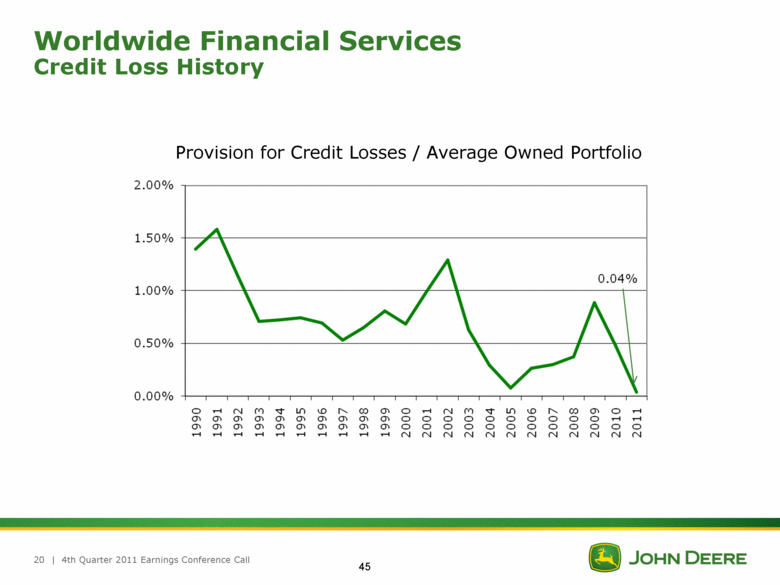
| 4th Quarter 2011 Earnings Conference Call 20 Worldwide Financial Services Credit Loss History Provision for Credit Losses / Average Owned Portfolio 45 |
|
|
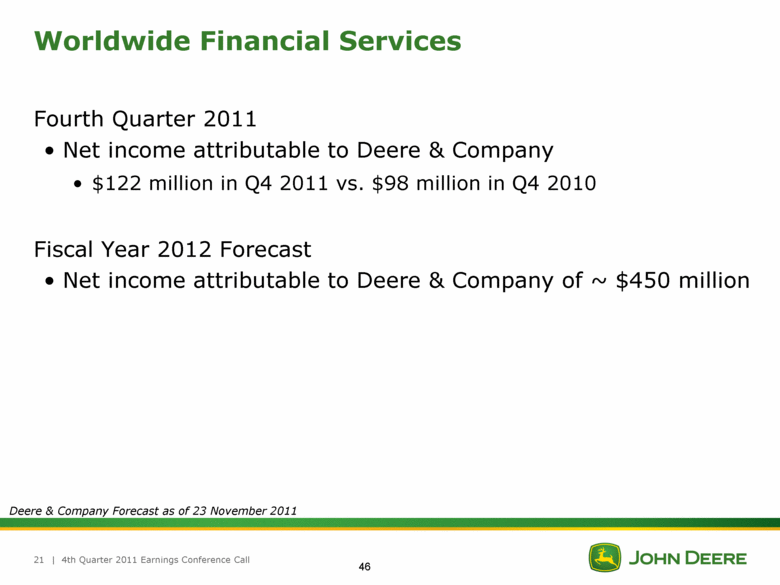
| 4th Quarter 2011 Earnings Conference Call 21 Worldwide Financial Services Fourth Quarter 2011 Net income attributable to Deere & Company $122 million in Q4 2011 vs. $98 million in Q4 2010 Fiscal Year 2012 Forecast Net income attributable to Deere & Company of ~ $450 million Deere & Company Forecast as of 23 November 2011 46 |
|
|
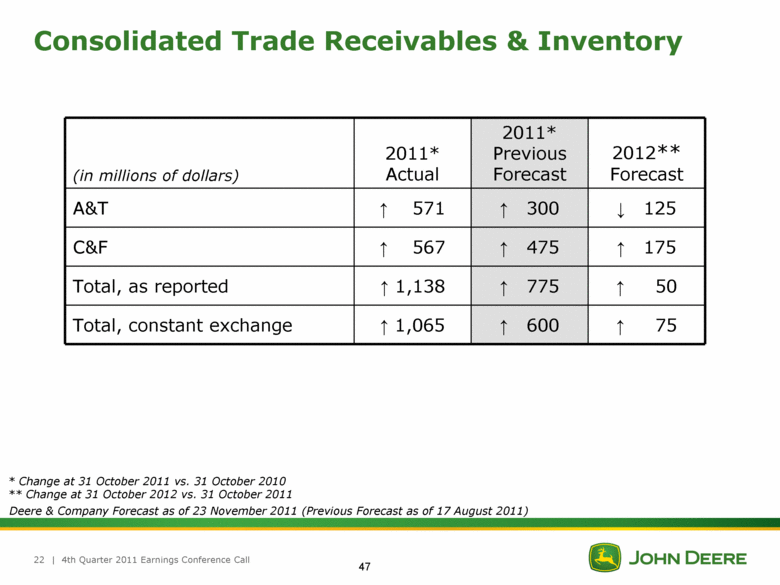
| 4th Quarter 2011 Earnings Conference Call 22 Consolidated Trade Receivables & Inventory (in millions of dollars) 2011* Actual 2011* Previous Forecast 2012** Forecast A&T 571 300 125 C&F 567 475 175 Total, as reported 1,138 775 50 Total, constant exchange 1,065 600 75 * Change at 31 October 2011 vs. 31 October 2010 ** Change at 31 October 2012 vs. 31 October 2011 Deere & Company Forecast as of 23 November 2011 (Previous Forecast as of 17 August 2011) 47 |
|
|
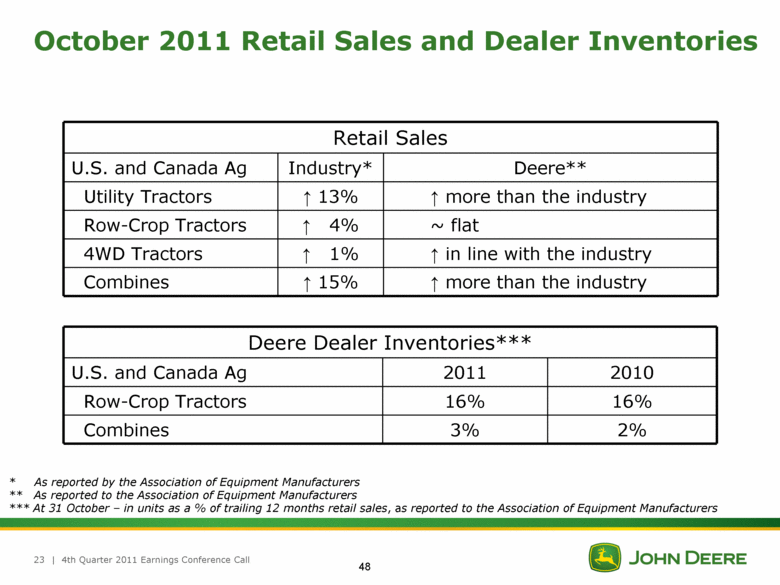
| 4th Quarter 2011 Earnings Conference Call 23 Retail Sales U.S. and Canada Ag Industry* Deere** Utility Tractors 13% more than the industry Row-Crop Tractors 4% ~ flat 4WD Tractors 1% in line with the industry Combines 15% more than the industry October 2011 Retail Sales and Dealer Inventories * As reported by the Association of Equipment Manufacturers ** As reported to the Association of Equipment Manufacturers *** At 31 October – in units as a % of trailing 12 months retail sales, as reported to the Association of Equipment Manufacturers Deere Dealer Inventories*** U.S. and Canada Ag 2011 2010 Row-Crop Tractors 16% 16% Combines 3% 2% 48 |
|
|
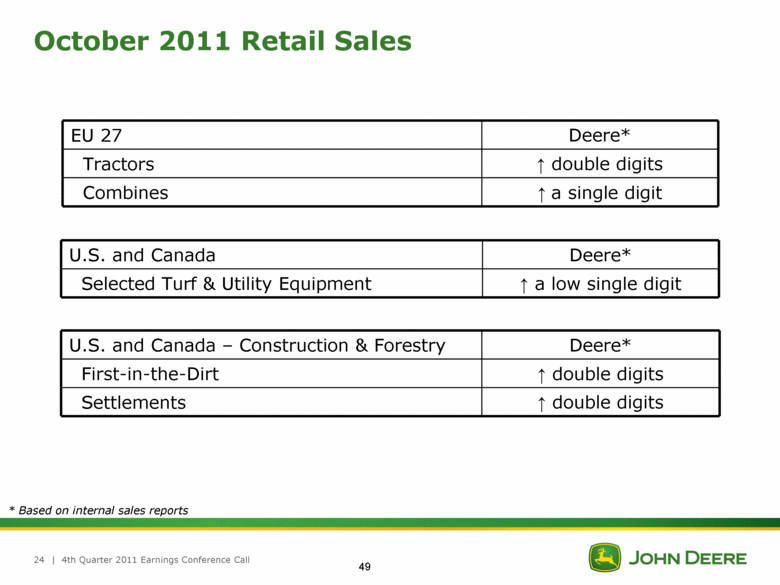
| 4th Quarter 2011 Earnings Conference Call 24 October 2011 Retail Sales EU 27 Deere* Tractors double digits Combines a single digit U.S. and Canada Deere* Selected Turf & Utility Equipment a low single digit * Based on internal sales reports U.S. and Canada – Construction & Forestry Deere* First-in-the-Dirt double digits Settlements double digits 49 |
|
|
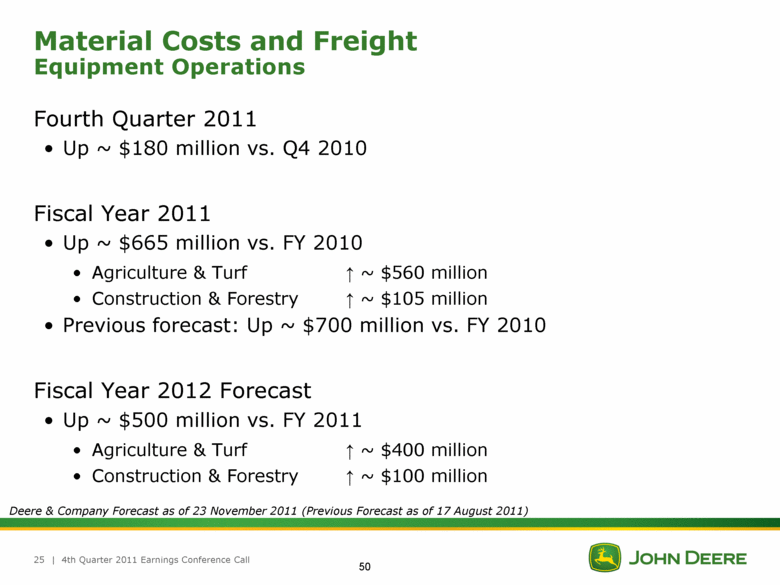
| 4th Quarter 2011 Earnings Conference Call 25 Material Costs and Freight Equipment Operations Fourth Quarter 2011 Up ~ $180 million vs. Q4 2010 Fiscal Year 2011 Up ~ $665 million vs. FY 2010 Agriculture & Turf ~ $560 million Construction & Forestry ~ $105 million Previous forecast: Up ~ $700 million vs. FY 2010 Fiscal Year 2012 Forecast Up ~ $500 million vs. FY 2011 Agriculture & Turf ~ $400 million Construction & Forestry ~ $100 million Deere & Company Forecast as of 23 November 2011 (Previous Forecast as of 17 August 2011) 50 |
|
|
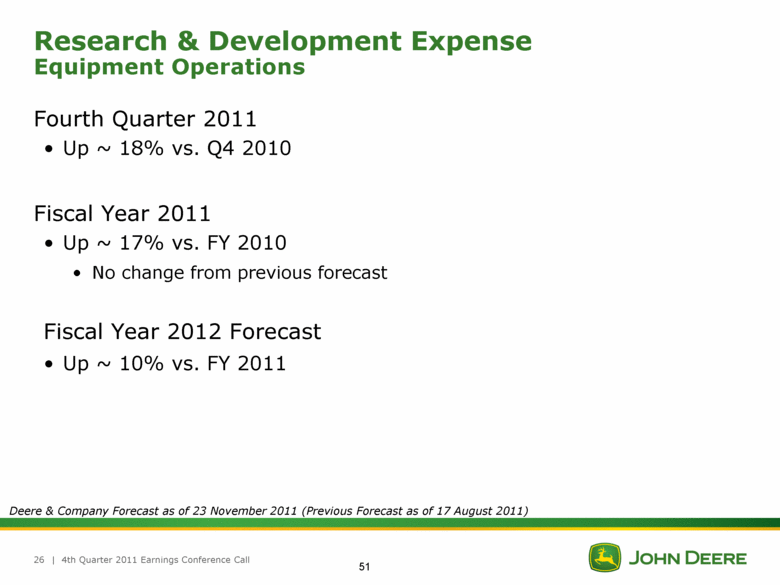
| 4th Quarter 2011 Earnings Conference Call 26 Research & Development Expense Equipment Operations Fourth Quarter 2011 Up ~ 18% vs. Q4 2010 Fiscal Year 2011 Up ~ 17% vs. FY 2010 No change from previous forecast Fiscal Year 2012 Forecast Up ~ 10% vs. FY 2011 Deere & Company Forecast as of 23 November 2011 (Previous Forecast as of 17 August 2011) 51 |
|
|
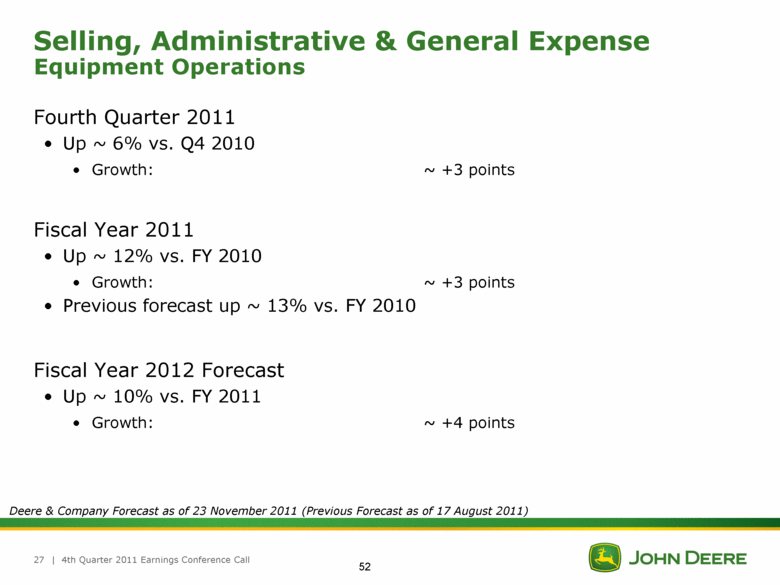
| 4th Quarter 2011 Earnings Conference Call 27 Selling, Administrative & General Expense Equipment Operations Fourth Quarter 2011 Up ~ 6% vs. Q4 2010 Growth: ~ +3 points Fiscal Year 2011 Up ~ 12% vs. FY 2010 Growth: ~ +3 points Previous forecast up ~ 13% vs. FY 2010 Fiscal Year 2012 Forecast Up ~ 10% vs. FY 2011 Growth: ~ +4 points Deere & Company Forecast as of 23 November 2011 (Previous Forecast as of 17 August 2011) 52 |
|
|
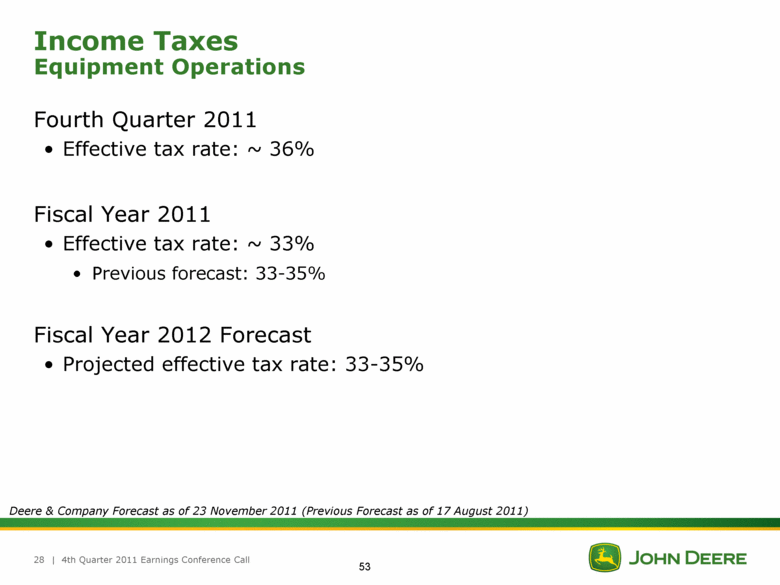
| 4th Quarter 2011 Earnings Conference Call 28 Income Taxes Equipment Operations Fourth Quarter 2011 Effective tax rate: ~ 36% Fiscal Year 2011 Effective tax rate: ~ 33% Previous forecast: 33-35% Fiscal Year 2012 Forecast Projected effective tax rate: 33-35% Deere & Company Forecast as of 23 November 2011 (Previous Forecast as of 17 August 2011) 53 |
|
|
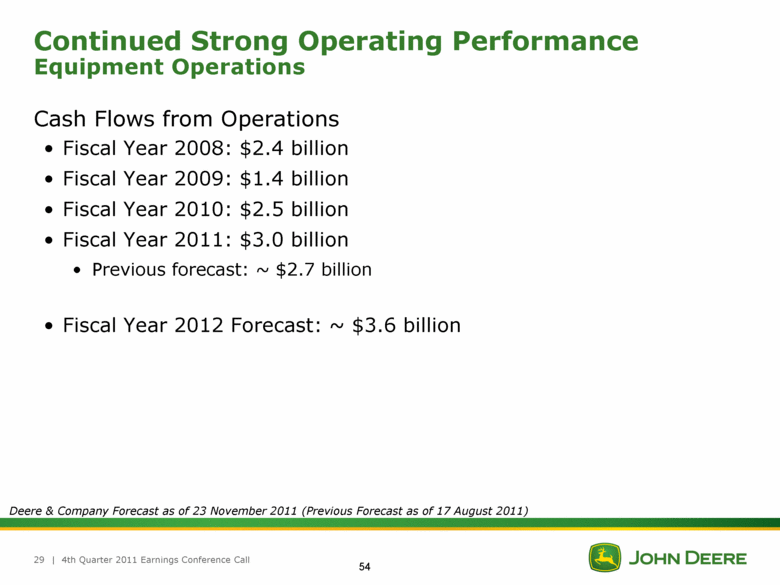
| 4th Quarter 2011 Earnings Conference Call 29 Continued Strong Operating Performance Equipment Operations Cash Flows from Operations Fiscal Year 2008: $2.4 billion Fiscal Year 2009: $1.4 billion Fiscal Year 2010: $2.5 billion Fiscal Year 2011: $3.0 billion Previous forecast: ~ $2.7 billion Fiscal Year 2012 Forecast: ~ $3.6 billion Deere & Company Forecast as of 23 November 2011 (Previous Forecast as of 17 August 2011) 54 |
|
|
| 4th Quarter 2011 Earnings Conference Call 30 Other Information Equipment Operations Fiscal Year 2011 Capital Expenditures: ~ $1.1 billion No change from previous forecast Depreciation and Amortization: ~ $590 million Previous forecast ~ $600 million Pension/OPEB Contributions: ~ $120 million Previous forecast ~ $125 million Deere & Company Previous Forecast as of 17 August 2011 55 |

|
|
| 4th Quarter 2011 Earnings Conference Call 31 Other Information Equipment Operations Fiscal Year 2012 Forecast Capital Expenditures: $1.2 - $1.3 billion Depreciation and Amortization: ~ $650 million Pension/OPEB Contributions: ~ $450 million Deere & Company Forecast as of 23 November 2011 56 |

|
|
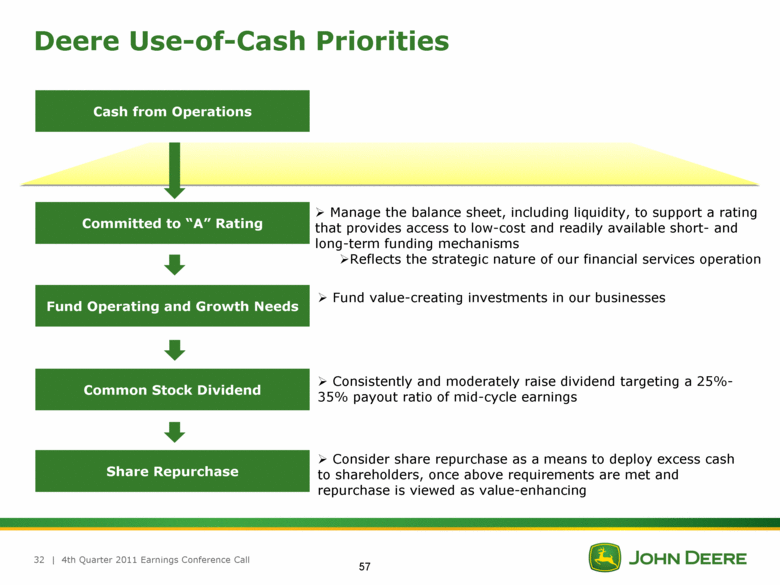
Deere Use-of-Cash Priorities | 4th Quarter 2011 Earnings Conference Call 32 Manage the balance sheet, including liquidity, to support a rating that provides access to low-cost and readily available short- and long-term funding mechanisms Reflects the strategic nature of our financial services operation Committed to “A” Rating Cash from Operations Fund Operating and Growth Needs Common Stock Dividend Share Repurchase Fund value-creating investments in our businesses Consistently and moderately raise dividend targeting a 25%-35% payout ratio of mid-cycle earnings Consider share repurchase as a means to deploy excess cash to shareholders, once above requirements are met and repurchase is viewed as value-enhancing 57 |
|
|
| 4th Quarter 2011 Earnings Conference Call 33 Worldwide Financial Services 2012 Unsecured Term Debt Maturities* * Maturities as of 31 October 2011 1Q 58 |

|
|
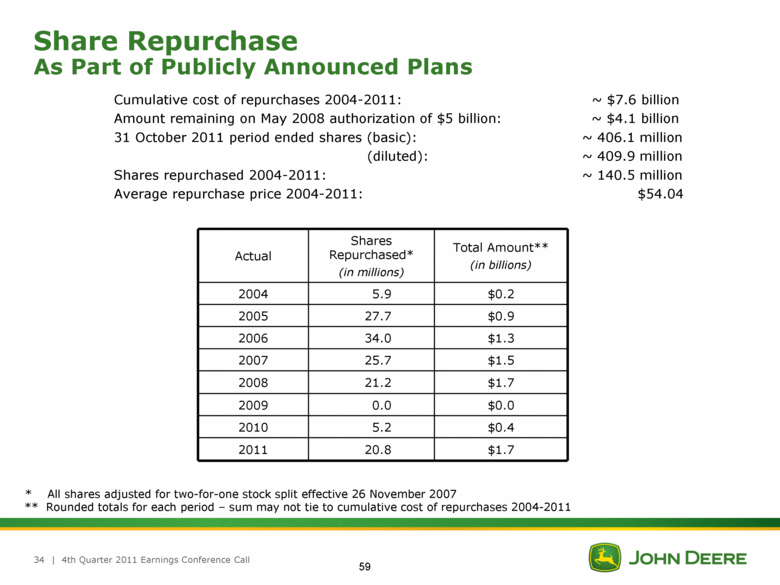
| 4th Quarter 2011 Earnings Conference Call 34 Share Repurchase As Part of Publicly Announced Plans Actual Shares Repurchased* (in millions) Total Amount** (in billions) 2004 5.9 $0.2 2005 27.7 $0.9 2006 34.0 $1.3 2007 25.7 $1.5 2008 21.2 $1.7 2009 0.0 $0.0 2010 5.2 $0.4 2011 20.8 $1.7 Cumulative cost of repurchases 2004-2011: ~ $7.6 billion Amount remaining on May 2008 authorization of $5 billion: ~ $4.1 billion 31 October 2011 period ended shares (basic): ~ 406.1 million (diluted): ~ 409.9 million Shares repurchased 2004-2011: ~ 140.5 million Average repurchase price 2004-2011: $54.04 * All shares adjusted for two-for-one stock split effective 26 November 2007 ** Rounded totals for each period – sum may not tie to cumulative cost of repurchases 2004-2011 59 |
|
|
| 4th Quarter 2011 Earnings Conference Call 35 Sources and Uses of Cash Fiscal 2004–2011 Equipment Operations (1) Other includes proceeds from maturities and sales of marketable securities and purchases of marketable securities and reconciliation for non-cash items including excess tax benefits from share-based compensation and the effect of exchange rates on cash and cash equivalents Source: Deere & Company SEC filings ~58% of cash from operations returned to shareholders (1) $3,188 60 |

|
|
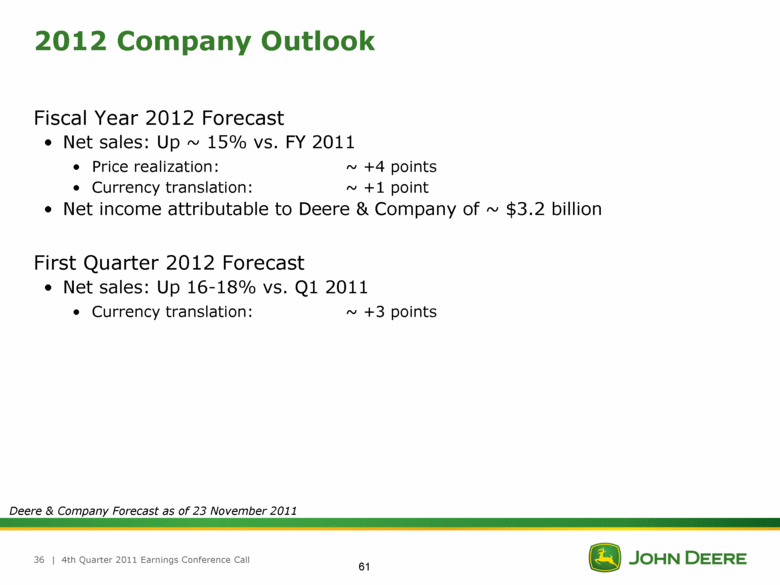
| 4th Quarter 2011 Earnings Conference Call 36 2012 Company Outlook Fiscal Year 2012 Forecast Net sales: Up ~ 15% vs. FY 2011 Price realization: ~ +4 points Currency translation: ~ +1 point Net income attributable to Deere & Company of ~ $3.2 billion First Quarter 2012 Forecast Net sales: Up 16-18% vs. Q1 2011 Currency translation: ~ +3 points Deere & Company Forecast as of 23 November 2011 61 |
|
|
| 4th Quarter 2011 Earnings Conference Call 37 Appendix 62 |
|
|
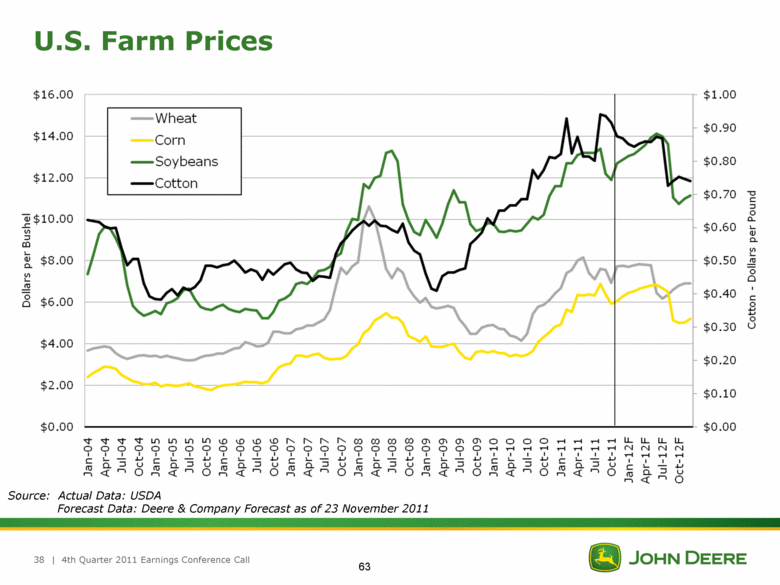
U.S. Farm Prices | 4th Quarter 2011 Earnings Conference Call 38 Source: Actual Data: USDA Forecast Data: Deere & Company Forecast as of 23 November 2011 63 |
|
|
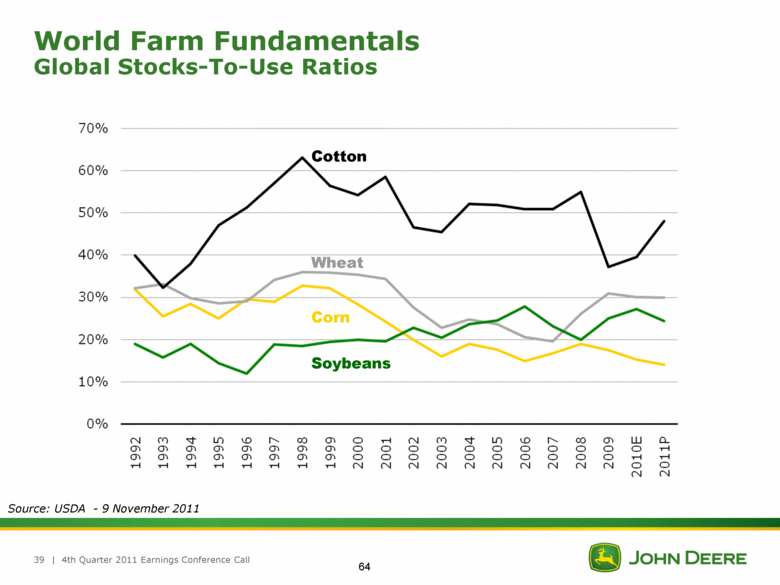
| 4th Quarter 2011 Earnings Conference Call 39 World Farm Fundamentals Global Stocks-To-Use Ratios Corn Wheat Soybeans Source: USDA - 9 November 2011 Cotton 64 |
|
|
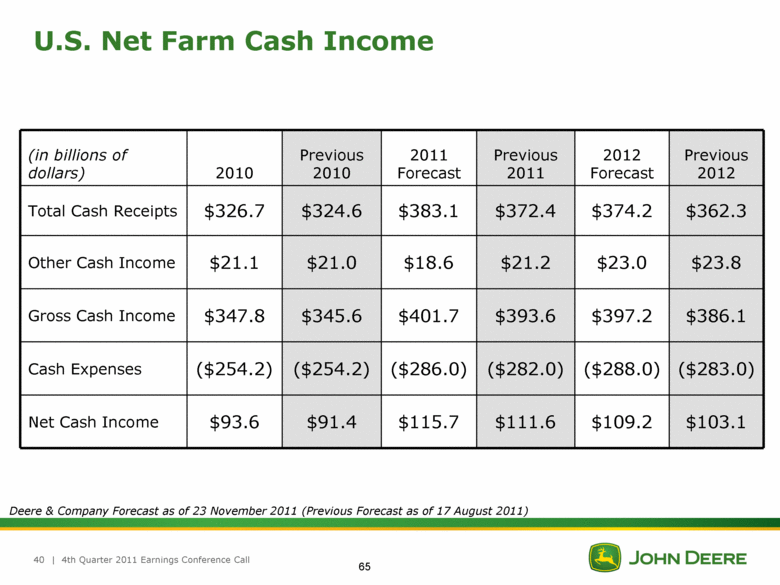
| 4th Quarter 2011 Earnings Conference Call 40 U.S. Net Farm Cash Income (in billions of dollars) 2010 Previous 2010 2011 Forecast Previous 2011 2012 Forecast Previous 2012 Total Cash Receipts $326.7 $324.6 $383.1 $372.4 $374.2 $362.3 Other Cash Income $21.1 $21.0 $18.6 $21.2 $23.0 $23.8 Gross Cash Income $347.8 $345.6 $401.7 $393.6 $397.2 $386.1 Cash Expenses ($254.2) ($254.2) ($286.0) ($282.0) ($288.0) ($283.0) Net Cash Income $93.6 $91.4 $115.7 $111.6 $109.2 $103.1 Deere & Company Forecast as of 23 November 2011 (Previous Forecast as of 17 August 2011) 65 |
|
|
Deere’s first quarter 2012 conference call is scheduled for 9:00 a.m. central time on Wednesday, February 15, 2012 66 |