Attached files
UNITED STATES SECURITIES AND EXCHANGE COMMISSION
Washington, D.C. 20549
Form 10-K
ANNUAL REPORT PURSUANT TO SECTION 13 OR 15(d)
OF THE SECURITIES EXCHANGE ACT OF 1934
For the fiscal year ended September 30, 2011
Commission file number: 001-31650
MINDSPEED TECHNOLOGIES, INC.
(Exact name of registrant as specified in its charter)
| Delaware | 01-0616769 | |
| (State of incorporation) | (I.R.S. Employer Identification No.) | |
| 4000 MacArthur Boulevard, East Tower | 92660-3095 | |
| Newport Beach, California | (Zip code) | |
| (Address of principal executive offices) | ||
Registrant’s telephone number, including area code:
(949) 579-3000
Securities registered pursuant to Section 12(b) of the Act:
| (Title of Each Class) |
(Name of Each Exchange on Which Registered) | |
| Common Stock $0.01 par value per share | The NASDAQ Stock Market LLC | |
| (including associated Preferred Share Purchase Rights) |
Securities registered pursuant to Section 12(g) of the Act:
None
Indicate by check mark if the registrant is a well-known seasoned issuer, as defined in Rule 405 of the Securities Act. Yes ¨ No þ
Indicate by check mark if the registrant is not required to file reports pursuant to Section 13 or Section 15(d) of the Act. Yes ¨ No þ
Indicate by check mark whether the registrant: (1) has filed all reports required to be filed by Section 13 or 15(d) of the Securities Exchange Act of 1934 during the preceding 12 months (or for such shorter period that the registrant was required to file such reports), and (2) has been subject to such filing requirements for the past 90 days. Yes þ No ¨
Indicate by check mark whether the registrant has submitted electronically and posted on its corporate Web site, if any, every Interactive Data File required to be submitted and posted pursuant to Rule 405 of Regulation S-T (§232.405 of this chapter) during the preceding 12 months (or for such shorter period that the registrant was required to submit and post such files). Yes þ No ¨
Indicate by check mark if disclosure of delinquent filers pursuant to Item 405 of Regulation S-K (§229.405 of this chapter) is not contained herein, and will not be contained, to the best of registrant’s knowledge, in definitive proxy or information statements incorporated by reference in Part III of this Form 10-K or any amendment to this Form 10-K. ¨
Indicate by check mark whether the registrant is a large accelerated filer, an accelerated filer, a non-accelerated filer, or a smaller reporting company. See the definitions of “large accelerated filer,” “accelerated filer” and “smaller reporting company” in Rule 12b-2 of the Exchange Act. (Check one):
| Large accelerated filer ¨ |
Accelerated filer þ |
Non-accelerated filer ¨ |
Smaller reporting company ¨ |
| (Do not check if a smaller reporting company) |
Indicate by check mark whether the registrant is a shell company (as defined in Rule 12b-2 of the Exchange Act). Yes ¨ No þ
The aggregate market value of the registrant’s voting and non-voting stock held by non-affiliates of the registrant as of the end of its most recently completed second fiscal quarter was approximately $262.5 million. Shares held by each officer and director and each person owning more than 10% of the outstanding voting and non-voting stock have been excluded from this calculation because such persons may be deemed to be affiliates of the registrant. This determination of potential affiliate status is not necessarily a conclusive determination for other purposes. Shares held include shares of which certain of such persons disclaim beneficial ownership.
The number of outstanding shares of the registrant’s Common Stock as of October 28, 2011 was 34,496,900.
Documents Incorporated by Reference
Portions of the Registrant’s Proxy Statement for the 2012 Annual Meeting of Stockholders, to be filed pursuant to Regulation 14A within 120 days after the end of the 2011 fiscal year, are incorporated by reference into Part III of this Form 10-K.
FORWARD-LOOKING STATEMENTS
This Annual Report on Form 10-K contains statements relating to Mindspeed Technologies, Inc. (including certain projections and business trends) that are “forward-looking statements” within the meaning of Section 27A of the Securities Act of 1933, as amended (the Securities Act), and Section 21E of the Securities Exchange Act of 1934, as amended (the Exchange Act), and are subject to the “safe harbor” created by those sections. All statements included in this Annual Report on Form 10-K, other than those that are purely historical, are forward-looking statements. Words such as “expect,” “believe,” “anticipate,” “could,” “target,” “project,” “intend,” “plan,” “seek,” “estimate,” “may,” and “continue,” as well as variations of such words and similar expressions, also identify forward-looking statements. Forward-looking statements in this Annual Report on Form 10-K include, without limitation, statements regarding:
| • | the ability of our relationships with network infrastructure original equipment manufacturers to facilitate early adoption of our products, enhance our ability to obtain design wins and encourage adoption of our technology in the industry; |
| • | the growth prospects for the network infrastructure equipment and communications semiconductors markets, including increased demand for network capacity, the upgrade and expansion of existing networks and the build-out of networks in developing countries; |
| • | our expectation that original equipment manufacturers will outsource more of their semiconductor component requirements to semiconductor suppliers; |
| • | our belief that the markets for semiconductor products addressing the enterprise, broadband access and metro service areas will grow at faster rates than the markets for network infrastructure equipment, in general, and our position to increase our share in those target areas; |
| • | our belief that our diverse portfolio of semiconductor solutions has positioned us to capitalize on some of the most significant trends in telecommunications spending; |
| • | our belief that we are well-situated in China and that fiber deployments are being rolled out by the country’s major telecommunications carriers; |
| • | our belief that raw materials, parts and supplies required by our foundry suppliers will remain available in the foreseeable future; |
| • | our belief that the loss or termination of any single patent, license, trade secret, know-how, trademark or copyright would not materially affect our business or financial condition; |
| • | our plans to make substantial investments in research and development and participate in the formulation of industry standards; |
| • | our belief that we can maximize our return on our research and development spending by focusing our investment in what we believe are key growth markets; |
| • | the sufficiency of our existing sources of liquidity, along with cash expected from product sales to fund our operations, research and development efforts, anticipated capital expenditures, working capital and other financing requirements, including interest payments on debt obligations, for the next 12 months; |
| • | our estimates regarding our minimum future obligations under our operating leases and our anticipated rental income; |
| • | our restructuring plans, including timing, expected workforce reductions, the expected cost savings under our restructuring plans and the uses of those savings, the timing and amount of payments, the impact on our business, the amounts of future charges to complete our restructuring plans, including any future plans to reduce operating expenses and/or increase revenue; |
| • | our intention to continue to expand our international business activities, including expansion of design and operations centers abroad, and the challenges associated with such expansion; |
2
| • | our belief that our properties are well maintained, are in good sound operating condition and contain all the equipment and facilities to operate at present levels; |
| • | our expectations regarding the cyclical nature of the semiconductor industry; and |
| • | the impact of recent accounting pronouncements and the adoption of new accounting standards. |
Our expectations, beliefs, anticipations, objectives, intentions, plans and strategies regarding the future are not guarantees of future performance and are subject to risks and uncertainties that could cause actual results, and actual events that occur, to differ materially from results contemplated by the forward-looking statement. These risks and uncertainties include, but are not limited to:
| • | worldwide political and economic uncertainties and specific conditions in the markets we address; |
| • | fluctuations in our operating results and future operating losses; |
| • | constraints in the supply of wafers and other product components from our third-party manufacturers; |
| • | fluctuations in the price of our common stock; |
| • | successful development and introduction of new products; |
| • | pricing pressures and other competitive factors; |
| • | loss of or diminished demand from one or more key customers or distributors; |
| • | cash requirements and terms and availability of financing; |
| • | the expense of and our ability to defend our intellectual property against infringement claims by others; |
| • | our ability to attract and retain qualified personnel; |
| • | doing business internationally and our ability to successfully and cost effectively establish and manage operations in foreign jurisdictions; |
| • | lengthy sales cycles; |
| • | business acquisitions and investments; |
| • | order and shipment uncertainty; |
| • | our ability to obtain design wins and develop revenue from them; |
| • | product defects and bugs; and |
| • | our ability to utilize our net operating loss carryforwards and certain other tax attributes. |
The forward-looking statements in this report are subject to additional risks and uncertainties, including those set forth in Item 1A — “Risk Factors” and those detailed from time to time in our other filings with the Securities and Exchange Commission. These forward-looking statements are made only as of the date hereof and, except as required by law, we undertake no obligation to update or revise any of them, whether as a result of new information, future events or otherwise. Mindspeed®, Mindspeed Technologies®, Comcerto® and Transcede® are registered trademarks or trademarks of Mindspeed Technologies, Inc. Other brands, names and trademarks contained in this report are the property of their respective owners.
PART I
| Item 1. | Business |
Mindspeed Technologies, Inc. (we or Mindspeed) designs, develops and sells semiconductor solutions for communications applications in the wireline and wireless network infrastructure, which includes enterprise networks, broadband access networks (fixed and mobile) and metropolitan and wide area networks. We have organized our solutions for these interrelated and rapidly converging networks into three product families:
3
communications convergence processing, high-performance analog and wide area networking communications. Our communications convergence processing products include ultra-low-power, multi-core digital signal processor system-on-chip (SoC) solutions for the fixed and mobile (3G/4G) carrier infrastructure and residential and enterprise platforms. Our high-performance analog products include high-density crosspoint switches, optical drivers, equalization and signal-conditioning solutions that solve difficult switching, timing and synchronization challenges in next-generation optical networking, enterprise storage and broadcast video transmission applications. Our wide area networking (WAN) communications portfolio helps optimize today’s circuit-switched networks that furnish much of the Internet’s underlying long-distance infrastructure.
Our products are sold to original equipment manufacturers (OEMs) for use in a variety of network infrastructure equipment, including:
| • | Communications Convergence Processing — triple-play access gateways for Voice-over-Internet protocol (VoIP) and data processing platforms; broadband customer premises equipment (CPE) gateways and other equipment that carriers use to deliver voice, data and video services to residential subscribers; Internet protocol (IP) private branch exchange (PBX) equipment and security appliances used in the enterprise and 3G/4G mobile base stations in the carrier infrastructure; |
| • | High-Performance Analog — next-generation fiber access network equipment (including passive optical networking, or PON, systems); switching and signal conditioning products supporting fiber-to-the-premise, optical transport networks (OTN), storage and server systems and broadcast video, inclusive of routers and other systems that are driving the migration to 3G high-definition (HD) transmission; and |
| • | WAN Communications — circuit-switched networking equipment that implements asynchronous transfer mode (ATM) and T1/E1 and T3/E3 communications protocols. |
Our customers include Alcatel-Lucent, Cisco Systems, Inc., Huawei Technologies Co. Ltd., Hitachi Ltd., LM Ericsson Telephone Company, Mitsubishi Electric Corporation, Nokia Siemens Networks and Zhongxing Telecom Equipment Corp.
We believe the breadth of our product portfolio, combined with more than three decades of experience in semiconductor hardware, software and communications systems engineering, provides us with a competitive advantage. We have proven expertise in signal, packet and transmission processing technologies, which are critical core competencies for successfully defining, designing and implementing advanced semiconductor products for next-generation network infrastructure equipment. We have cultivated and continue to initiate and foster close relationships with leading network infrastructure OEMs to understand emerging markets, technologies and standards. We focus our research and development efforts on applications in the segments of the telecommunications network which we believe offer the most attractive growth prospects. Our business is fabless, which means we outsource all of our manufacturing needs, and we do not own or operate any semiconductor manufacturing facilities. We believe being fabless allows us to minimize operating infrastructure and capital expenditures, maintain operational flexibility and focus our resources on the design, development and marketing of our products.
Mindspeed was originally incorporated in Delaware in 2001 as a wholly owned subsidiary of Conexant Systems, Inc. On June 27, 2003, Conexant completed the distribution to Conexant stockholders of all outstanding shares of common stock of Mindspeed. Prior to the distribution, Conexant transferred to us the assets and liabilities of its Mindspeed business, including the stock of certain subsidiaries, and certain other assets and liabilities, which were allocated to us under the distribution agreement entered into between us and Conexant. Also, prior to the distribution, Conexant contributed cash to our company in an amount such that at the time of the distribution our cash balance was $100.0 million. We issued to Conexant a warrant to purchase approximately 6.1 million shares of our common stock at a price of $16.74 per share, as adjusted, exercisable for a period of ten years after the distribution. Following the distribution, we began operations as an independent, publicly held company. Our common stock trades on the Nasdaq Global Market under the ticker symbol “MSPD.”
4
Industry Overview
Communications semiconductor products are a critical part of network infrastructure equipment. Network infrastructure OEMs require advanced communications semiconductor products — such as low-power, multi-core digital signal processor (DSP) SoC solutions, as well as switching and signal timing and conditioning solutions — that are highly optimized for the equipment employed by their customers. We seek to provide semiconductor products that enable network infrastructure OEMs to meet the needs of their service provider and enterprise customers in terms of system performance, functionality and time-to-market.
Addressed Markets
Our semiconductor products are primarily focused on network infrastructure equipment applications in three areas of the broadly defined communications network: enterprise networks, broadband access service areas, including wireless and wireline infrastructure networks, and metropolitan and wide area networks. The type and complexity of network infrastructure equipment used in these network areas continues to expand, driven by the need for the processing, transmission and switching of digital voice, data and video traffic over multiple communication media, at numerous transmission data rates and employing different protocols.
Enterprise networks include equipment that enables voice and data communications and access to outside networks, and is deployed primarily in the offices of commercial enterprises, including specialized commercial segments, such as broadcast video production, which have demanding network requirements. An enterprise network may be comprised of many local area networks, as well as client workstations, centralized database management systems, storage area networks (SANs) and other components. In enterprise networks, communications semiconductors facilitate the processing and transmission of voice, data and video traffic in converged IP networks that are replacing the traditional separate telephone, data and video conferencing networks. Typical network infrastructure equipment found in enterprise networks that use our products include voice and media gateways, IP private branch exchanges, SAN routers, director-class switches and emerging enterprise-class wireless base station systems for enhanced mobile enterprise service delivery. In addition, a major trend in the broadcast video segment of the enterprise networking market is the switch from analog to digital television transmission and the conversion from standard-definition television services to high-definition television (HDTV) services featuring more detailed images and digital surround sound. We offer a family of broadcast-video products optimized for high-speed HDTV routing and production switcher applications.
Broadband Access service areas of the telecommunications network refer to the “last mile” of a telecommunications or cable service provider’s physical network (including copper, fiber optic or wireless transmission), including network infrastructure equipment that connects end-users (typically located at a business or residence) with metropolitan and wide area networks. For this portion of the network, infrastructure equipment requires semiconductors that enable reliable, high-speed connectivity capable of aggregating or disaggregating and transporting multiple forms of voice, data and video traffic. In addition, communications semiconductors must accommodate multiple transmission standards and communications protocols to provide a bridge between dissimilar access networks; for example, connecting wireless base station equipment to a wireline network, and enabling the computationally complex processing that is required in order for carriers to meet cellular data service demands with limited available spectrum. Typical network infrastructure equipment found at the edge of the broadband access service area that use our products include optical node units, optical line terminals, remote access concentrators, digital subscriber line (DSL) access multiplexers, broadband customer premises equipment gateways, mixed-media gateways, wireless base stations, digital loop carrier equipment and media converters.
Metropolitan and Wide Area Networks refer to the portion of a service provider’s physical network that enables high-speed communications within a city or a larger regional area, including inexpensive mobile backhaul services for wireless communications carriers. In addition, this portion of the network provides the communications link between broadband access service areas and the fiber optic-based, wide area network. For metro equipment applications, our communications semiconductors provide transmission and processing capabilities, as well as information segmentation and classification, and routing and switching functionality, to support high-speed traffic from multiple sources employing different transmission standards and communications
5
protocols. These functions require signal conversion, signal processing and packet processing expertise to support the design and development of highly integrated mixed-signal devices combining analog and digital functions with communications protocols and application software. Typical network infrastructure equipment found in metro service areas that use our products includes add-drop multiplexers, switches, high-speed routers, digital cross-connect systems, optical edge devices and multiservice provisioning platforms.
The telecommunications network, including the Internet, has evolved into a complex, hybrid series of converging digital and optical networks that connect individuals and businesses globally. These new higher-bandwidth, data-centric networks integrate voice, data and video traffic, operate over both wired and wireless media, link existing voice and data networks and cross traditional enterprise, broadband access, metro and long haul service area boundaries. Network infrastructure OEMs are designing faster, more intelligent and more complex equipment to satisfy the needs of service providers as they continue to expand their network coverage and service offerings while upgrading and connecting or integrating existing networks of disparate types. In this demanding environment, we believe network infrastructure OEMs select as their strategic partners communications semiconductor suppliers who can deliver advanced products that provide increased functionality, lower total system cost and support for a variety of communications media, operating speeds and protocols.
The Mindspeed Approach
We believe the breadth of our product portfolio, combined with our expertise in low-power semiconductor hardware and software and communications systems engineering, provide us with a competitive advantage in designing and selling our products to leading network infrastructure OEMs.
We have proven expertise in signal, packet and transmission processing technologies. Signal processing involves both signal conversion and digital signal processing techniques that convert and compress voice, data and video between analog and digital representations. Packet processing involves bundling or segmenting information traffic using standard protocols such as IP or ATM and enables sharing of transmission bandwidth across a given communication medium. Transmission processing involves the transport and receipt of voice, data and video traffic across copper wire and optical fiber communications media.
These core technology competencies are critical for developing semiconductor networking solutions that enable the processing, transmission and switching of high-speed voice, data and video traffic, employing multiple communications protocols, across disparate communications networks. Our core technology competencies are the foundation for developing our:
| • | low-power semiconductor device architectures, including mixed-signal devices and application-specific multi-core SoC solutions that combine core central processing units, digital signal processors and programmable hardware-accelerated protocol engines plus analog signal processing capabilities; |
| • | highly optimized signal processing algorithms and communications protocols, which we implement in semiconductor devices, including echo-cancellation, wideband voice and advanced video technologies; |
| • | critical software drivers and application software to perform signal, packet and transmission processing tasks, plus programming tools, which customers can use to add their own proprietary value to designs based on our SoCs; |
| • | integration, transmission and receiving of multi-gigabit serial data streams over optical and copper media to solve difficult system challenges in synchronous optical network (SONET), OTN, dense wavelength division multiplexing (DWDM) telecommunications equipment, broadcast video systems, and enterprise storage, networking and computing applications; and |
| • | traditional transmission components for the public switched telephone network (PSTN) which continues to provide the underlying long-distance backbone for today’s Internet infrastructure. |
6
Increasing Demand for Communications Semiconductors
We believe the market for network infrastructure equipment in general, and for communications semiconductors in particular, offers attractive long-term growth prospects for several reasons:
| • | We anticipate that demand for network capacity will continue to increase, driven by: |
| • | Internet user growth; |
| • | higher network utilization rates as carriers seek to maximize the return on the capital and operational investments in their network infrastructure; and |
| • | growing consumer and business demand for VoIP and other bandwidth-intensive services and applications, such as wireless data transfer and video/multimedia content delivery. |
| • | We believe that incumbent telecommunications carriers, integrated communication service providers and cable multiple service operators worldwide will continue to upgrade and expand legacy portions of their networks to accommodate new service offerings and to reduce operating costs. This upgrade and expansion cycle, along with the development of new, next-generation networks, requires the development of a variety of new equipment created from advanced semiconductor solutions. |
| • | In certain countries, we expect that service providers will continue the build-out of telecommunication networks, many of which were previously government owned and are now often taking the lead on new technology deployment, ahead of more established regions in terms of creating high-growth market opportunities for the latest advances. |
| • | We also believe that many technologies developed to solve high-speed optical networking challenges also apply to challenges in other portions of the network infrastructure. For instance, high-speed backplanes for DWDM equipment have sophisticated timing and signal-conditioning requirements that are similar to those required in enterprise storage and broadcast video transmission applications. In both cases, advanced silicon is a critical enabler for system designs. |
Moreover, we expect that network infrastructure OEMs will outsource more of their semiconductor component requirements to semiconductor suppliers, allowing the OEMs to reduce their operating cost structure by shifting their focus and investment from internal application specific integrated circuit semiconductor design and development to more strategic systems development.
Strategy
Our objective is to grow our business profitably and to become the leading supplier of semiconductor networking solutions to leading global network infrastructure OEMs in key enterprise, broadband access and metro service area market segments. To achieve this objective, we are pursuing the following strategies:
Focus on Increasing Share in Growth Applications
We have established strong market positions for our products in the enterprise, broadband access (fixed and mobile) and metro service areas of the telecommunications network. We believe the markets for semiconductor products that address these applications will grow at faster rates than the markets for network infrastructure equipment, in general. This key attribute is expected to make the enterprise, broadband access and metro service areas the most attractive markets for the foreseeable future. We believe that our three core technology competencies, coupled with focused investments in product development, will position us to increase our share in those target areas.
Expand Strategic Relationships with Industry-Leading Global Network Infrastructure OEMs and Maximize Design Win Share
We identify and selectively establish strategic relationships with market leaders in the network infrastructure equipment industry to develop next-generation products and, in some cases, customized solutions
7
for their specific needs. We have an extensive history of working closely with our customers’ research and development groups and marketing teams to understand emerging markets, technologies and standards, and we invest our product development resources in those areas. We believe our close relationships with leading network infrastructure OEMs facilitate early adoption of our semiconductor products during development of their system-level products, enhance our ability to obtain design wins from those customers and encourage adoption of our technology throughout the industry.
In North America, we have cultivated close relationships with leading network infrastructure OEMs, including Cisco Systems, Inc. and Genband, Inc. Abroad, we have established close relationships with market leaders such as Huawei Technologies Co., Ltd., and Zhongxing Telecom Equipment Corp. in the Asia-Pacific region and Alcatel-Lucent, Nokia Siemens Networks and LM Ericsson Telephone Company in Europe.
Capitalize on the Breadth of Our Product and Intellectual Property Portfolio
We build on the breadth of our product portfolio of physical-layer devices, together with our signal and packet processing devices and communications software expertise, to increase our share of the silicon content in our customers’ products. We offer a range of complementary products that are optimized to work with each other and provide our customers with complete information receipt, processing and transmission functions. These complementary products allow infrastructure OEMs to source components that provide proven interoperability from a single semiconductor supplier, rather than requiring OEMs to combine and coordinate individual components from multiple vendors.
In addition, we offer highly integrated products, such as our family of Comcerto packet processors that provide our customers with a complete hardware and software solution in a single device. These integrated products perform functions typically requiring multiple discrete components and software, and combine the programmability of alternative general-purpose DSP solutions with the superior performance and power efficiency of a multi-processor solution with selected application-specific fixed-function acceleration. Our multi-core SoC expertise is also becoming increasingly important as network infrastructure equipment requires more and more computational complexity to solve difficult multi-layered signal processing challenges. To enable the integration of more and more processing cores into SoC devices, we have developed proprietary intellectual property for managing large arrays of DSPs, including task-scheduling technology that has been field-proven and steadily enhanced through several generations of triple-play edge gateways used for complex packet-processing applications.
We believe that this strategy of offering both complementary and integrated products increases product performance, speeds time-to-market and lowers the total system cost for our customers. The breadth of our product portfolio also provides a competitive advantage for serving network convergence applications such as multiprotocol wireless-to-wireline connectivity. These applications generally require a combination of processing, transmission or switching functionality to move high-speed voice and data traffic using multiple communications protocols across disparate communications networks.
Through our efforts in building a large product portfolio, we have developed and we maintain a broad intellectual property portfolio consisting of sophisticated algorithms and other specialized technology, such as the advanced echo-cancellation techniques that have been used in voice ports of carrier telecommunications equipment that our products have enabled. We periodically enter into strategic arrangements to leverage our portfolio by licensing or selling our intellectual property.
Additionally, we have aligned with key strategic partners to collaborate on advanced multi-core SoC architectures that we believe are critical for next-generation, ultra-low-power communications processing solutions. For instance, our work with ARM Holdings plc has resulted in 12 generations of power-efficiency advances, initially for carrier-class convergence processors and more recently for triple-play home-gateway platforms, as well as for our Transcede products. Power efficiency is becoming increasingly important as our customers adopt a variety of energy-efficiency initiatives, including the European Union energy-consumption guidelines for broadband equipment.
8
Provide Outstanding Technical Support and Customer Service
We provide broad-based technical and product design support to our customers through three dedicated teams: field application engineers, product application engineers and technical marketing personnel. We believe that comprehensive service and support are critical to shortening our customers’ design cycles and maintaining a long-term competitive position within the network infrastructure equipment market. Outstanding customer service and support are important competitive factors for semiconductor component suppliers like us seeking to be the preferred suppliers to leading network infrastructure OEMs.
Products
We provide network infrastructure OEMs with a broad portfolio of advanced semiconductor networking solutions. Our products can be classified into three focused product families: communications convergence processing products, high-performance analog products and WAN communications products. These three product families are found in a variety of networking equipment designed to process, transmit and switch voice, data and video traffic between, and within, the different segments of the communications network.
Communications Convergence Processing Products
Our software-configurable communications convergence processing products serve as bridges for transporting video, voice, fax and modem transmissions between circuit-switched and packet-based fixed and mobile networks, and across network boundaries. Our DSP device architecture combines the performance of a digital-signal processor core with the flexibility of a microcontroller core to support our extensive suite of voice compression techniques, echo cancellers and communications protocols. These products process and translate voice and data and perform various management and reporting functions. They compress the signals to minimize bandwidth consumption and modify or add communications protocols to accommodate transport of the signals across a variety of different networks. Supported services include video and VoIP, Voice-over-ATM (VoATM) and Voice-over-DSL services, as well as wireline-to-wireless connectivity.
Our communications convergence processing products include the eighth-generation Comcerto family for fiber-access service delivery, and our Transcede family of 3G/4G base station baseband processors that extend our proven multi-core processing expertise into the mobile infrastructure.
Our Comcerto family of packet processors includes a full range of software-compatible solutions that enable OEMs to provide scalable systems with customized features for carrier, enterprise and customer premise applications. The high-density members of this family, the Comcerto 5000, 900, 700 and 600 series processors and related software, provide a complete SoC solution for carrier-class video and Voice-over-packet (VoP) applications. All are targeted for use in media gateways designed to bridge wireless, wireline and enterprise networks.
The Comcerto 100 series broadband services processor is designed to support secure triple-play (voice, video and data) networks for residential and small office/home office markets. The Comcerto 100 series processor integrates high-performance security processing, packet processing and quality of service (QoS) capabilities for next-generation broadband customer premises equipment enabling service providers to deliver sophisticated multi-media content to their subscribers.
The Comcerto 300, 500 and 800 series solutions are designed for access and enterprise voice and data processing applications. The Comcerto 300 series is targeted at VoIP integration in lower density access platforms, such as multi-dwelling units (MDUs), digital subscriber line access multiplexer (DSLAM) equipment and multi-service access nodes (MSANs), and are widely deployed in passive optical network/fiber-to-the-building (PON/FTTB) applications. The Comcerto 500 series is a silicon “PBX-on-a-chip” which supports all required voice processing functionality for up to 128 channels, including encryption. The Comcerto 800 series enables a new class of “office-in-a-box” systems by combining a high-quality VoP subsystem with a high-performance routing and virtual private network (VPN) engine. The Comcerto 800 series integrates voice processing, packet processing and encryption functionality into a single device for the rapidly
9
growing market for VoP enterprise networks. This product is targeted for use in enterprise voice gateways, PBXs and integrated access devices.
The Comcerto 1000 series of low-power embedded packet processers address a wide variety of applications ranging from high-end VoIP enabled home gateways and small-to-midsized business high performance security appliances to Ethernet powered 802.11n enterprise access points. The Comcerto 1000 series of processors delivers scalability, high-performance packet handling capabilities, increased VPN and secure sockets layer (SSL) throughput and industry leading QoS hardware features.
Our Transcede family extends our multi-core processor to deliver highly integrated baseband solutions for 3G/4G base stations. Transcede is designed to meet the huge increase in base station diversity and computational complexity caused by the mobile Internet’s migration from a voice- to data-centric mobile network. Transcede is designed to enable the development of a wide range of equipment, from picocells and enterprise femtocells serving a relatively small number of subscribers to microcells and macrocells serving hundreds or thousands of subscribers. Demand for this diverse set of platforms is being driven by the need for carriers to offload mobile data traffic and bridge today’s 3G coverage and performance gaps, while paving the way for next-generation 4G and long-term evolution (LTE) networks.
The Transcede family includes the T4000, whose processor cores run at 600 MHz, with less than 12 watt power consumption, and the T4020, which features 750 MHz processor cores and typical power consumption less than 15 watts. These devices enable 64-user “picocell on a chip,” delivering three sectors of LTE processing in a single device, while still providing substantial processing headroom so manufacturers can deploy their own value-added features as part of an overall Transcede-based solution. The Transcede family also includes the Transcede 3000, which is designed for small-cell 3G and 4G base stations supporting up to 32 users. Mindspeed also offers the T4005 for 3G/4G macrocell developers who want to combine Transcede’s high-performance Layer One (L1) physical-layer (PHY) processing capabilities with an existing Layer Two (L2) media access control (MAC) processing solution. All other Transcede processors combine L1 PHY and L2 MAC functionality on the same device to deliver the lowest possible system latency.
High-Performance Analog Products
Our high-performance analog transmission devices and switching products support storage area network, fiber-to-the-premise, OTN and broadcast video typically operating at data transmission rates between 155 megabits per second (Mbps) and 10 gigabits per second (Gbps). Our transmission products include laser drivers, transimpedance amplifiers, post amplifiers, clock and data recovery circuits, signal conditioners, serializers/deserializers, video reclockers, cable drivers and line equalizers. These products serve as the connection between a fiber optic or coaxial cable component interface and the remainder of the electrical subsystem in various network equipment and perform a variety of functions, including:
| • | converting incoming optical signals from fiber optic cables to electrical signals for processing and transport over a wireline medium and vice-versa; |
| • | conditioning the signal to remove unwanted noise; |
| • | combining lower speed signals from multiple parallel paths into higher speed serial paths, and vice-versa, for bandwidth economy; and |
| • | amplifying and equalizing weaker signals as they pass through a particular system’s equipment, media or network. |
Our switching products include a family of high-speed crosspoint switches capable of switching traffic beyond 8 Gbps within various types of network switching equipment. These crosspoint switches direct, or transfer, a large number of high-speed data input streams, regardless of traffic type, to different connection trunks for rerouting the information to new destination points in the network. Crosspoint switches are often used to provide redundant traffic paths in networking equipment to protect against the loss of critical data from spurious network outages or failures that may occur from time to time. Target equipment applications for our switching
10
products include OTN systems, add-drop multiplexers, high-density IP switches and storage-area routers. In addition, we offer crosspoint switches optimized for standard and high-definition broadcast video routing and production switching applications.
WAN Communications Products
Our WAN communications products include transmission solutions and high-performance ATM/multi-protocol label switching (MPLS) network processors that facilitate the aggregation, processing and transport of voice and data traffic over copper wire or fiber optic cable to access metropolitan and long-haul networks.
Our high-performance ATM/MPLS network processors, and T1/E1, T3/E3 and SONET carrier devices are designed for use in a variety of equipment including digital loop carriers, DSL access multiplexers, add-drop multiplexers, switches, high-speed routers, digital cross-connect systems, optical edge devices, multiservice provisioning platforms, voice gateways, wireless backhaul and wireless base station controllers.
Customers
We market and sell our semiconductor networking solutions directly to leading network infrastructure OEMs. We also sell our products indirectly through electronic component distributors and third-party electronic manufacturing service providers, which manufacture products incorporating our semiconductor networking solutions for OEMs. Sales to distributors accounted for approximately 60% of our revenue for fiscal 2011. For fiscal 2011, distributor Alltek Technology Corporation accounted for 23% of our net revenue and distributor Avnet, Inc. accounted for 19% of our net revenue.
Our top direct OEM customer for fiscal 2011 was Zhongxing Telecom Equipment Corp. (ZTE), who accounted for 9% of our net revenue. Huawei Technologies Co. Ltd. was also a significant direct OEM customer and accounted for a total of 7% of our net revenue. We believe that our significant indirect network infrastructure OEM customers for fiscal 2011 also included Mitsubishi Electric Corporation, Oki Electric Industry Co., Ltd and Alcatel-Lucent.
Our customer base is widely dispersed geographically. Revenue derived from customers located in the Americas region was 21%, in the Europe region was 8% and in the Asia-Pacific region was 71% of our total revenue for fiscal 2011. We believe a portion of the products we sell to OEMs and third-party manufacturing service providers in the Asia-Pacific region is ultimately shipped to end-markets in the Americas and Europe. See Item 8 “Financial Statements and Supplementary Data,” including Note 3 and Note 17 of Notes to Consolidated Financial Statements for additional information on customers and geographic areas.
Sales, Marketing and Technical Support
We have a worldwide sales, marketing and technical support organization that is currently comprised of 87 employees located in three domestic and eight international sales locations. Our marketing, sales and field applications engineering teams, augmented by 12 electronic component distributors and three sales representative organizations, focus on marketing and selling semiconductor networking solutions to worldwide network infrastructure OEMs.
We maintain close working relationships with our customers throughout their lengthy product development cycle. Our customers may need six months or longer to test and evaluate our products and an additional six months or longer to begin volume production of network infrastructure equipment that incorporates our products. During this process, we provide broad-based technical and product design support to our customers through our field application engineers, product application engineers and technical marketing personnel. We believe that providing comprehensive product service and support is critical to shortening our customers’ design cycles and maintaining a competitive position in the network infrastructure equipment market.
Operations and Manufacturing
We are a fabless company, which means we do not own or operate foundries for wafer fabrication or facilities for device assembly and final test of our products. Instead, we outsource wafer fabrication, assembly
11
and testing of our semiconductor products to independent, third-party contractors. We use mainstream digital complementary metal-oxide semiconductor (CMOS) process technology for the majority of our products; we rely on specialty processes for the remainder of our products. Taiwan Semiconductor Manufacturing Co., Ltd. (TSMC) is our principal foundry supplier of CMOS wafers and die and produces some of our specialty process products. We use several other suppliers for wafers used in older products. We believe that the raw materials, parts and supplies required by our foundry suppliers are generally available at present and will remain available in the foreseeable future.
Semiconductor wafers are usually shipped to third-party contractors for device assembly and packaging where the wafers are cut into individual die, packaged and tested before final shipment to customers. We use Amkor Technology, Inc., Advanced Semiconductor Engineering, Inc. (ASE) and other third-party contractors, located in the Asia-Pacific region, Europe and California, to satisfy a variety of assembly and packaging technology and product testing requirements associated with the back-end portion of the manufacturing process.
We qualify each of our foundry and back-end process providers. This qualification process consists of a detailed technical review of process performance, design rules, process models, tools and support, as well as analysis of the subcontractor’s quality system and manufacturing capability. We also participate in quality and reliability monitoring through each stage of the production cycle by reviewing electrical and parametric data from our wafer foundry and back-end providers. We closely monitor wafer foundry production for overall quality, reliability and yield levels.
Competition
The communications semiconductor industry in general, and the markets in which we compete in particular, are intensely competitive. We compete worldwide with a number of United States (U.S.) and international suppliers that are both larger and smaller than us in terms of resources and market share. We expect intense competition to continue.
Our principal competitors are Cavium Networks Inc., Freescale Semiconductor, Inc., Gennum Corporation, Maxim Integrated Products, Inc., PMC-Sierra, Inc., Texas Instruments Inc. and Vitesse Semiconductor Corporation.
We believe that the principal competitive factors for semiconductor suppliers in each of our served markets are:
| • | time-to-market; |
| • | product quality, reliability and performance; |
| • | customer support; |
| • | price and total system cost; |
| • | new product innovation; |
| • | compliance with industry standards; |
| • | design wins; |
| • | market acceptance of our, or our competitors’ products; |
| • | production efficiencies; and |
| • | general economic conditions. |
While we believe that we compete favorably with respect to each of these factors, many of our current and potential competitors have certain advantages over us, including:
| • | stronger financial position and liquidity; |
12
| • | longer, or stronger, presence in key markets; |
| • | greater name recognition; |
| • | more secure supply chain; |
| • | lower cost alternatives to our products; |
| • | access to larger customer bases; and |
| • | significantly greater sales and marketing, manufacturing, distribution, technical and other resources. |
As a result, these competitors may be able to devote greater resources to the development, promotion and sale of their products than we can. Our competitors may also be able to adapt more quickly to new or emerging technologies and changes in customer requirements or may be more able to respond to the cyclical fluctuations or downturns that affect the semiconductor industry from time to time. If we are not successful in assuring our customers of our financial stability, our OEM customers may choose semiconductor suppliers whom they believe have a stronger financial position or liquidity, which may materially adversely affect our business.
Backlog
Our sales are made primarily pursuant to standard purchase orders for delivery of products. Because industry practice allows customers to cancel orders with limited advance notice to us prior to shipment, we believe that backlog as of any particular date is not a reliable indicator of our future revenue levels.
Research and Development
We have significant research, development, engineering and product design capabilities. We currently have 363 employees engaged in research and development activities. On research and development activities, we spent approximately $59.2 million in fiscal 2011, $51.4 million in fiscal 2010 and $50.7 million in fiscal 2009. We perform research and product development activities at our headquarters in Newport Beach, California and at 13 design centers. In order to enhance the cost-effectiveness of our operations, we have increasingly sought to shift portions of our research and development operations to regions with lower cost structures than that available in the United States. Our design centers are strategically located to take advantage of key technical and engineering talent. Our success depends to a substantial degree upon our ability to timely develop and introduce new products and enhancements to our existing products that meet changing customer requirements and emerging industry standards. We have made and plan to make substantial investments in research and development and to participate in the formulation of industry standards. In addition, we actively collaborate with technology leaders to define and develop next-generation technologies.
Intellectual Property
Our success and future revenue growth depend, in part, on the intellectual property that we own and develop, including patents, licenses, trade secrets, know-how, trademarks and copyrights, and on our ability to protect our intellectual property. We continuously review our patent portfolio to maximize its value to us, abandoning or selling inapplicable or less useful patents and filing new patents important to our product roadmap. Our patent portfolio may be used to avoid, defend or settle any potential litigation with respect to various technologies contained in our products. The portfolio may also provide negotiating leverage in attempts to cross-license patents or technologies with third parties. We may also seek to leverage our patent portfolio by licensing or selling our patents or other intellectual property. We rely primarily on patent, copyright, trademark and trade secret laws, as well as employee and third-party nondisclosure and confidentiality agreements and other methods to protect our proprietary technologies and processes. In connection with our participation in the development of various industry standards, we may be required to reasonably license certain of our patents to other parties, including competitors that develop products based upon the adopted industry standards. We have also entered into agreements with certain of our customers and granted these customers the right to use our proprietary technology in the event that we file for bankruptcy protection or take other equivalent actions. While
13
in the aggregate our intellectual property is important to our operations, we do not believe that any single patent, license, trade secret, know-how, trademark or copyright is considered of such importance that its loss or termination would materially affect our business or financial condition.
Employees
We currently have 541 full-time employees, approximately 378 of whom are engineers. Our employees are not covered by any collective bargaining agreements and we have not experienced a work stoppage in the past eight years since our inception. We believe our future success will depend in large part on our ability to continue to attract, motivate, develop and retain highly skilled and dedicated technical, marketing and management personnel.
Cyclicality
The semiconductor industry is highly cyclical and is characterized by constant and rapid technological change, rapid product obsolescence and price erosion, evolving technical standards, short product life cycles and wide fluctuations in product supply and demand. From time to time, these and other factors, together with changes in general economic conditions, cause significant upturns and downturns in the industry, and in our business in particular.
In addition, our operating results are subject to substantial quarterly and annual fluctuations due to a number of factors, such as demand for network infrastructure equipment, the timing of receipt, reduction or cancellation of significant orders, fluctuations in the levels of component inventories held by our customers, the gain or loss of significant customers, market acceptance of our products and our customers’ products, our ability to timely develop, introduce and market new products and technologies, the availability and cost of products from our suppliers, new product and technology introductions by competitors, intellectual property disputes and the timing and extent of product development costs.
Available Information
We maintain an Internet website at www.mindspeed.com. Our Annual Reports on Form 10-K, Quarterly Reports on Form 10-Q, Current Reports on Form 8-K and amendments to such reports filed or furnished pursuant to Section 13(a) or 15(d) of the Exchange Act, and other information related to our company, are available free of charge on this site as soon as reasonably practicable after such reports are filed with or furnished to the Securities and Exchange Commission (SEC). Our Code of Business Conduct and Ethics, Guidelines on Corporate Governance and Board Committee Charters are also available on our website. We will provide reasonable quantities of paper copies of filings free of charge upon request. In addition, we will provide a copy of the Board Committee Charters to stockholders upon request. No portion of our website or the information contained in or connected to the website is incorporated into this Annual Report on Form 10-K.
| Item 1A. | Risk Factors |
Our business, financial condition and operating results can be affected by a number of factors, including those listed below, any one of which could cause our actual results to vary materially from recent results or from our anticipated future results. Any of these risks could also materially and adversely affect our business, financial condition or the price of our common stock or other securities.
Our operating results may be adversely impacted by worldwide economic uncertainties and specific conditions in the markets we address, including the cyclical nature of and volatility in the semiconductor industry.
We operate in the semiconductor industry, which is cyclical and subject to rapid change and evolving industry standards. From time to time, the semiconductor industry has experienced significant downturns characterized by decreases in product demand, excess customer inventories and accelerated erosion of prices.
14
The semiconductor industry also periodically experiences increased demand and production capacity constraints, which may affect our ability to ship products. Furthermore, during challenging economic times, our customers and vendors may face issues gaining timely access to sufficient credit, which could impact their ability to make timely payments to us. As a result, we may experience growth patterns that are different than the end demand for products, particularly during periods of high volatility. Accordingly, our operating results may vary significantly as a result of the general conditions in the semiconductor industry, which could cause large fluctuations in our stock price.
We cannot predict the timing, strength or duration of any economic slowdown or the impact it will have on our customers, our vendors or us. The combination of our lengthy sales cycle coupled with challenging macroeconomic conditions could have a compound impact on our business. The impact of market volatility is not limited to revenue, but may also affect our product gross margins and other financial metrics. Any downturns in the semiconductor industry could be severe and prolonged, and any failure of the industry or wired and wireless communications markets to fully recover from downturns could seriously impact our revenue and harm our business, financial condition and results of operations.
Our operating results are subject to substantial quarterly and annual fluctuations.
We have incurred significant losses in prior periods. Our net revenue and operating results have fluctuated in the past and may fluctuate in the future and we may incur losses and negative cash flows in future periods. These fluctuations are due to a number of factors, many of which are beyond our control. These factors include, among others:
| • | changes in end-user demand for the products manufactured and sold by our customers; |
| • | the effects of competitive pricing pressures, including decreases in average selling prices of our products; |
| • | the gain or loss of significant customers; |
| • | market acceptance of our products and our customers’ products; |
| • | our ability to timely develop, introduce, market and support new products and technologies; |
| • | availability and cost of products from our suppliers; |
| • | intellectual property disputes; |
| • | the timing of receipt, reduction or cancellation of significant orders by customers; |
| • | fluctuations in the levels of component inventories held by our customers and changes in our customers’ inventory management practices; |
| • | shifts in our product mix and the effect of maturing products; |
| • | the timing and extent of product development costs; |
| • | new product and technology introductions by us or our competitors; |
| • | fluctuations in manufacturing yields; and |
| • | significant warranty claims, including those not covered by our suppliers. |
The foregoing factors are difficult to forecast, and these, as well as other factors, could materially and adversely affect our quarterly or annual operating results.
We are entirely dependent upon third parties for the manufacture of our products and are vulnerable to their capacity constraints during times of increasing demand for semiconductor products.
We are entirely dependent upon outside wafer fabrication facilities, known as foundries, for wafer fabrication services. Our principal suppliers of wafer fabrication services are TSMC and Jazz Semiconductor. We
15
are also dependent upon third parties, including Amkor and ASE, for the assembly and testing of all of our products. Under our fabless business model, our long-term revenue growth is dependent on our ability to obtain sufficient external manufacturing capacity, including wafer production capacity. Periods of upturns in the semiconductor industry may be characterized by rapid increases in demand and a shortage of capacity for wafer fabrication and assembly and test services.
The risks associated with our reliance on third parties for manufacturing services include:
| • | the lack of assured supply, potential shortages and higher prices; |
| • | the effects of disputes or litigation involving our third-party foundries; |
| • | increased lead times; |
| • | limited control over delivery schedules, manufacturing yields, production costs and product quality; and |
| • | the unavailability of, or delays in obtaining, products or access to key process technologies. |
Our standard lead time, or the time required to manufacture our products (including wafer fabrication, assembly and testing), is typically 12 to 16 weeks. During periods of manufacturing capacity shortages, the foundries and other suppliers on whom we rely may devote their limited capacity to fulfill the production requirements of other customers that are larger or better financed than we are, or who have superior contractual rights to enforce the manufacture of their products, including to the exclusion of producing our products.
Additionally, if we are required to seek alternative foundries or assembly and test service providers, we would be subject to longer lead times, indeterminate delivery schedules and increased manufacturing costs, including costs to find and qualify acceptable suppliers. For example, if we choose to use a new foundry, the qualification process may take as long as six months over the standard lead time before we can begin shipping products from the new foundry. Such delays could negatively affect our relationships with our customers.
Wafer fabrication processes are subject to obsolescence, and foundries may discontinue a wafer fabrication process used for certain of our products. In such event, we generally offer our customers a “last-time buy” program to satisfy their anticipated requirements for our products. Any unanticipated discontinuation of a wafer fabrication process on which we rely may adversely affect our revenue and our customer relationships.
The foundries and other suppliers on whom we rely may experience financial difficulties or suffer disruptions in their operations due to causes beyond our control, including deteriorations in general economic conditions, labor strikes, work stoppages, electrical power outages, fire, earthquake, flooding or other natural disasters. Certain of our suppliers’ manufacturing facilities are located near major earthquake fault lines in the Asia-Pacific region and in California. Due to cross dependencies, supply chain disruptions could negatively impact demand of our products including, for example, if our customers are unable to obtain sufficient supply of other components required for their end product. In the event of a disruption of the operations of one or more of our suppliers, we may not have an alternate source immediately available. Such an event could cause significant delays in shipments until we are able to shift the products from an affected facility or supplier to another facility or supplier. The manufacturing processes we rely on are specialized and are available from a limited number of suppliers. Alternate sources of manufacturing capacity, particularly wafer production capacity, may not be available to us on a timely basis. Even if alternate manufacturing capacity is available, we may not be able to obtain it on favorable terms, or at all. Difficulties or delays in securing an adequate supply of our products on favorable terms, or at all, could impair our ability to meet our customers’ requirements and have a material adverse effect on our operating results.
In addition, the highly complex and technologically demanding nature of semiconductor manufacturing has caused foundries to experience, from time to time, lower than anticipated manufacturing yields, particularly in connection with the introduction of new products and the installation and start-up of new process technologies. Lower than anticipated manufacturing yields may affect our ability to fulfill our customers’ demands for our products on a timely basis. Moreover, lower than anticipated manufacturing yields may adversely affect our gross margin and our results of operations.
16
The price of our common stock may fluctuate significantly.
The price of our common stock is volatile and may fluctuate significantly. There can be no assurance as to the prices at which our common stock will trade or that an active trading market in our common stock will be sustained in the future. The market price at which our common stock trades may be influenced by many factors, including:
| • | our operating and financial performance and prospects, including our ability to achieve sustained profitability; |
| • | the depth and liquidity of the market for our common stock which can impact, among other things, the volatility of our stock price and the availability of market participants to borrow shares; |
| • | investor perception of us and the industry in which we operate; |
| • | the level of research coverage of our common stock; |
| • | changes in earnings estimates or buy/sell recommendations by analysts; |
| • | the issuance and sale of additional shares of common stock; |
| • | limitations placed on our investors by our stockholders rights agreement, which is designed to protect our net operating loss carryforwards; |
| • | general financial and other market conditions; and |
| • | domestic and international economic conditions. |
In addition, public stock markets have experienced, and may in the future experience, extreme price and trading volume volatility, particularly in the technology sectors of the market. This volatility has significantly affected the market prices of securities of many technology companies for reasons frequently unrelated to or disproportionately impacted by the operating performance of these companies. These broad market fluctuations may adversely affect the market price of our common stock. If we do not meet the requirements for continued quotation on the Nasdaq Global Select Market (NASDAQ), our common stock could be delisted which would adversely affect the ability of investors to sell shares of our common stock and could otherwise adversely affect our business.
Our success depends on our ability to timely develop competitive new products and keep abreast of the rapid technological changes in our market.
Our operating results will depend largely on our ability to continue to timely introduce new and enhanced semiconductor products, as well as our ability to keep abreast of rapid technological changes in our markets. Our products could become obsolete sooner than we expect because of faster than anticipated, or unanticipated, changes in one or more of the technologies related to our products. The introduction of new technology representing a substantial advance over current technology could adversely affect demand for our existing products. Currently accepted industry standards are also subject to change, which may also contribute to the obsolescence of our products. If we are unable to develop and introduce new or enhanced products in a timely manner, our business may be adversely affected.
Successful product development and introduction depends on numerous factors, including, among others:
| • | our ability to anticipate customer and market requirements and changes in technology and industry standards; |
| • | our ability to accurately define new products; |
| • | our ability to complete development of new products, and bring our products to market, on a timely basis; |
17
| • | our ability to differentiate our products from offerings of our competitors; and |
| • | overall market acceptance of our products. |
We may not have sufficient resources to make the substantial investment in research and development in order to develop and bring to market new and enhanced products, particularly if we are required to take further cost reduction actions. Furthermore, we are required to continually evaluate expenditures for planned product development and to choose among alternative technologies based on our expectations of future market growth. We may be unable to timely develop and introduce new or enhanced products, our products may not satisfy customer requirements or achieve market acceptance, or we may be unable to anticipate new industry standards and technological changes. We also may not be able to respond successfully to new product announcements and introductions by competitors.
Research and development projects may experience unanticipated delays related to our internal design efforts. New product development also requires the production of photomask sets and the production and testing of sample devices. In the event we experience delays in obtaining these services from the wafer fabrication and assembly and test vendors on whom we rely, our product introductions may be delayed and our revenue and results of operations may be adversely affected.
We are subject to intense competition.
The communications semiconductor industry in general, and the markets in which we compete in particular, are intensely competitive. We compete worldwide with a number of U.S. and international semiconductor manufacturers that are both larger and smaller than we are in terms of resources and market share. We currently face significant competition in our markets and expect that intense price and product competition will continue. This competition has resulted, and is expected to continue to result, in declining average selling prices for our products.
Many of our current and potential competitors have certain advantages over us, including:
| • | stronger financial position and liquidity; |
| • | longer, or stronger, presence in key markets; |
| • | greater name recognition; |
| • | more secure supply chain; |
| • | lower cost alternatives to our products; |
| • | access to larger customer bases; and |
| • | significantly greater sales and marketing, manufacturing, distribution, technical and other resources. |
As a result, these competitors may be able to adapt more quickly to new or emerging technologies and changes in customer requirements or may be able to devote greater resources to the development, promotion and sale of their products than we can. Moreover, we have incurred substantial operating losses and we may in the future incur losses in future periods. We believe that financial stability of suppliers is an important consideration in our customers’ purchasing decisions. If our OEM customers perceive that we lack adequate financial stability, they may choose semiconductor suppliers that they believe have a stronger financial position or liquidity.
Current and potential competitors also have established or may establish financial or strategic relationships among themselves or with our existing or potential customers, resellers or other third parties. These relationships may affect customers’ purchasing decisions. Accordingly, it is possible that new competitors or alliances among competitors could emerge and rapidly acquire significant market share. We may not be able to compete successfully against current and potential competitors.
18
The loss of one or more key customers or distributors, or the diminished demand for our products from a key customer could significantly reduce our net revenue, gross margin and results of operations.
A relatively small number of end customers and distributors have accounted for a significant portion of our net revenue in any particular period. There has been an increasing trend toward industry consolidation in our markets in recent years, particularly among major network equipment and telecommunications companies. Industry consolidation could decrease the number of significant customers for our products thereby increasing our reliance on key customers. In addition, industry consolidation has generally led, and may continue to lead, to pricing pressures and loss of market share. We have no long-term volume purchase commitments from our key customers. One or more of our key customers or distributors may discontinue operations as a result of consolidation, financial instability, liquidation or otherwise. Reductions, delays and cancellation of orders from our key customers or the loss of one or more key customers could significantly reduce our net revenue and results of operations. We cannot assure you that our current customers will continue to place orders with us, that orders by existing customers will continue at current or historical levels or that we will be able to obtain orders from new customers.
We have substantial cash requirements to fund our operations, research and development efforts and capital expenditures. Our capital resources are limited and capital needed for our business may not be available when we need it.
Although we generated cash through operating activities in fiscal 2011 and fiscal 2010, we have used significant cash in operating activities in previous periods. Our principal sources of liquidity are our existing cash balances and cash generated from product sales. We believe that our existing cash balances, along with cash expected to be generated from product sales will be sufficient to fund our operations, research and development efforts, anticipated capital expenditures, working capital and other financing requirements, including interest payments on our debt obligations, for at least the next 12 months. However, if we incur operating losses and negative cash flows in the future, we may need to further reduce our operating costs or obtain alternate sources of financing, or both. We have completed transactions that involved the issuance of equity and the issuance or incurrence of indebtedness, including credit facilities. Even after completing these transactions, we may need additional capital in the future and may not have access to additional sources of capital on favorable terms or at all. If we raise additional funds through the issuance of equity, equity-based or debt securities, such securities may have rights, preferences or privileges senior to those of our common stock and our stockholders may experience dilution of their ownership interests. In addition, there can be no assurance that we will continue to benefit from the sale or licensing of intellectual property as we have in previous periods.
We may be subject to claims, or we may be required to defend and indemnify customers against claims, of infringement of third-party intellectual property rights or demands that we, or our customers, license third-party technology, which could result in significant expense.
The semiconductor industry is characterized by vigorous protection and pursuit of intellectual property rights. From time to time, third parties have asserted and may in the future assert patent, copyright, trademark and other intellectual property rights against technologies that are important to our business. The resolution or compromise of any litigation or other legal process to enforce such alleged third party rights, including claims arising through our contractual indemnification of our customers, or claims challenging the validity of our patents, regardless of its merit or resolution, could be costly and divert the efforts and attention of our management and technical personnel.
We may not prevail in any such litigation or other legal process or we may compromise or settle such claims because of the complex technical issues and inherent uncertainties in intellectual property disputes and the significant expense in defending such claims. If litigation or other legal process results in adverse rulings, we may be required to:
| • | pay substantial damages for past, present and future use of the infringing technology; |
| • | cease the manufacture, use or sale of infringing products; |
19
| • | discontinue the use of infringing technology; |
| • | expend significant resources to develop non-infringing technology; |
| • | pay substantial damages to our customers or end users to discontinue use or replace infringing technology with non-infringing technology; |
| • | license technology from the third party claiming infringement, which license may not be available on commercially reasonable terms, or at all; or |
| • | relinquish intellectual property rights associated with one or more of our patent claims, if such claims are held invalid or otherwise unenforceable. |
If we are not successful in protecting our intellectual property rights, it may harm our ability to compete.
We rely primarily on patent, copyright, trademark and trade secret laws, as well as employee and third-party nondisclosure and confidentiality agreements and other methods, to protect our proprietary technologies and processes. We may be required to engage in litigation to enforce or protect our intellectual property rights, which may require us to expend significant resources and to divert the efforts and attention of our management from our business operations; in particular:
| • | the steps we take to prevent misappropriation or infringement of our intellectual property may not be successful; |
| • | any existing or future patents may be challenged, invalidated or circumvented; or |
| • | the measures described above may not provide meaningful protection. |
Despite the preventive measures and precautions that we take, a third party could copy or otherwise obtain and use our technology without authorization, develop similar technology independently or design around our patents. We generally enter into confidentiality agreements with our employees, consultants and strategic partners. We also try to control access to and distribution of our technologies, documentation and other proprietary information. Despite these efforts, internal or external parties may attempt to copy, disclose, obtain or use our products, services or technology without our authorization. Also, former employees may seek employment with our business partners, customers or competitors, and the confidential nature of our proprietary information may not be maintained in the course of such future employment. Further, in some countries outside the U.S., patent protection is not available or not reliably enforced. Some countries that do allow registration of patents do not provide meaningful redress for patent violations. As a result, protecting intellectual property in those countries is difficult and competitors may sell products in those countries that have functions and features that infringe on our intellectual property.
We may not be able to attract and retain qualified personnel necessary for the design, development, sale and support of our products. Our success could be negatively affected if key personnel leave.
Our future success depends on our ability to attract, retain and motivate qualified personnel, including executive officers and other key management, technical and support personnel. As the source of our technological and product innovations, our key technical personnel represent a significant asset. The competition for such personnel can be intense in the semiconductor industry. We may not be able to attract and retain qualified management and other personnel necessary for the design, development, sale and support of our products.
In periods of poor operating performance, we have experienced, and may experience in the future, particular difficulty attracting and retaining key personnel. If we are not successful in assuring our employees of our financial stability and our prospects for success, our employees may seek other employment, which may materially and adversely affect our business. We intend to continue to expand our international business activities including expansion of design and operations centers abroad and may have difficulty attracting and maintaining
20
international employees. The loss of the services of one or more of our key employees, including Raouf Y. Halim, our chief executive officer, or certain key design and technical personnel, or our inability to attract, retain and motivate qualified personnel could have a material adverse effect on our ability to operate our business.
Some of our engineers are foreign nationals working in the U.S. under work visas. The visas permit qualified foreign nationals working in specialty occupations, such as certain categories of engineers, to reside in the U.S. during their employment. The number of new visas approved each year may be limited and may restrict our ability to hire additional qualified technical employees. In addition, immigration policies are subject to change, and these policies have generally become more stringent since the events of September 11, 2001. Any additional significant changes in immigration laws, rules or regulations may further restrict our ability to retain or hire technical personnel.
We are subject to the risks of doing business internationally.
A significant part of our strategy involves our continued pursuit of growth opportunities in a number of international markets. We market, sell, design and service our products internationally. Products shipped to international destinations, primarily in the Asia-Pacific region and Europe, were approximately 79% of our net revenue for fiscal 2011 and 77% in fiscal 2010. China is a particularly important international market for us, as approximately 38% of our revenue for fiscal 2011 came from customers in China. In addition, we have design centers, customer support centers, and rely on suppliers, located outside the U.S., including foundries and assembly and test service providers located in the Asia-Pacific region. We intend to continue to expand our international business activities and may open other design centers and customer support centers abroad. Our international sales and operations are subject to a number of risks inherent in selling and operating abroad which could adversely impact our international sales and could make our international operations more expensive. These include, but are not limited to, risks regarding:
| • | currency exchange rate fluctuations; |
| • | local economic and political conditions; |
| • | difficulties in staffing and managing foreign operations; |
| • | potential hostilities and changes in diplomatic and trade relationships; |
| • | tax laws; |
| • | natural disasters, including earthquakes or flooding; |
| • | restrictive governmental actions (such as restrictions on the transfer or repatriation of funds and trade protection measures, including export duties and quotas and customs duties and tariffs); |
| • | changes in legal or regulatory requirements; |
| • | difficulty in obtaining distribution and support; |
| • | disruptions of capital and trading markets; |
| • | acts of terrorism; |
| • | wage inflation; |
| • | accounts receivable collection and longer payment cycles; |
| • | the laws and policies of the U.S. and other countries affecting trade, foreign investment and loans and import or export licensing requirements; |
| • | existing or future environmental laws and regulations governing, among other things, air emissions, wastewater discharges, the contents of our products, the use, handling and disposal of hazardous substances and wastes, soil and groundwater contamination and employee health and safety; |
21
| • | limitations on our ability under local laws to protect our intellectual property; and |
| • | cultural differences in the conduct of business. |
Because most of our international sales are currently denominated in U.S. dollars, our products could become less competitive in international markets if the value of the U.S. dollar increases relative to foreign currencies. As we continue to shift a portion of our operations offshore, more of our expenses are incurred in currencies other than those in which we bill for the related services. An increase in the value of certain currencies, such as the Euro, Japanese yen, Ukrainian hryvnia and Indian rupee, against the U.S. dollar could increase costs of our offshore operations by increasing labor and other costs that are denominated in local currencies.
We may in the future enter into foreign currency forward exchange contracts to mitigate the risk of loss from currency exchange rate fluctuations for foreign currency commitments entered into in the ordinary course of business. We do not enter into foreign currency forward exchange contracts for other purposes. Our financial condition and results of operations could be adversely affected by currency fluctuations.
Because of the lengthy sales cycles of many of our products, we may incur significant expenses before we generate any revenue related to those products.
Our customers generally need six months or longer to test and evaluate our products and an additional six months or more to begin volume production of equipment that incorporates our products. These lengthy periods also increase the possibility that a customer may decide to cancel or change product plans, which could reduce or eliminate sales to that customer. As a result of this lengthy sales cycle, we may incur significant research and development and selling, general and administrative expenses before we generate any revenue from new products. We may never generate the anticipated revenue if our customers cancel or change their product plans as customers may increasingly do if economic conditions continue to deteriorate.
We may make business acquisitions or investments, which involve significant risk.
We may, from time to time, make acquisitions, enter into alliances or make investments in other businesses to complement our existing product offerings, augment our market coverage or enhance our technological capabilities. However, any such transactions could result in:
| • | issuances of equity securities dilutive to our existing stockholders; |
| • | substantial cash payments; |
| • | the incurrence of substantial debt and assumption of unknown liabilities; |
| • | large one-time write-offs; |
| • | amortization expenses related to intangible assets; |
| • | ability to use our net operating loss carryforwards; |
| • | the diversion of management’s attention from other business concerns; and |
| • | the potential loss of key employees, customers and suppliers of the acquired business. |
Integrating acquired organizations and their products and services may be expensive, time-consuming and a strain on our resources and our relationships with employees, customers and suppliers, and ultimately may not be successful. The benefits or synergies we may expect from the acquisition of complementary or supplementary businesses may not be realized to the extent or in the time frame we initially anticipate.
Additionally, in periods subsequent to an acquisition, we must evaluate goodwill and acquisition-related intangible assets for impairment. If such assets are found to be impaired, they will be written down to estimated fair value, with a charge against earnings.
22
Uncertainties involving the ordering and shipment of our products could adversely affect our business.
Our sales are typically made pursuant to individual purchase orders and we generally do not have long-term supply arrangements with our customers. Generally, our customers may cancel orders until 30 days prior to shipment. In addition, we sell a substantial portion of our products through distributors, some of whom have a right to return unsold products to us. Sales to distributors accounted for approximately 60% of our revenue for fiscal 2011 and 47% of our revenue for fiscal 2010.
Because of the significant lead times for wafer fabrication and assembly and test services, we routinely purchase inventory based on estimates of end-market demand for our customers’ products. End-market demand may be subject to dramatic changes and is difficult to predict. End-market demand is highly influenced by the timing and extent of carrier capital expenditures which may decrease due to general economic conditions, and uncertainty, over which we have no control. The difficulty in predicting demand may be compounded when we sell to OEMs indirectly through distributors or contract manufacturers, or both, as our forecasts of demand are then based on estimates provided by multiple parties. In addition, our customers may change their inventory practices on short notice for any reason. The cancellation or deferral of product orders, the return of previously sold products or overproduction due to the failure of anticipated orders to materialize could result in our holding excess or obsolete inventory, which could result in write-downs of inventory. Conversely, if we fail to anticipate inventory needs we may be unable to fulfill demand for our products, resulting in a loss of potential revenue.
If network infrastructure OEMs do not design our products into their equipment, we will be unable to sell those products. Moreover, a design win from a customer does not guarantee future sales to that customer.
Our products are not sold directly to the end-user but are components of other products. As a result, we rely on network infrastructure OEMs to select our products from among alternative offerings to be designed into their equipment. We may be unable to achieve these “design wins.” Without design wins from OEMs, we would be unable to sell our products. Once an OEM designs another supplier’s semiconductors into one of its product platforms, it is more difficult for us to achieve future design wins with that OEM’s product platform because changing suppliers involves significant cost, time, effort and risk for the OEM. Achieving a design win with a customer does not ensure that we will receive significant revenue from that customer, and we may be unable to convert design wins into actual sales. Even after a design win, the customer is not obligated to purchase our products and can choose at any time to stop using our products if, for example, its own products are not commercially successful.
The complexity of our products may lead to errors, defects and bugs, which could subject us to significant costs or damages and adversely affect market acceptance of our products.
Although we, our customers and our suppliers rigorously test our products, our products are complex and may contain errors, defects or bugs when first introduced or as new versions are released. We have in the past experienced, and may in the future experience, errors, defects and bugs. If any of our products contain production defects or reliability, safety, quality or compatibility problems that are significant to our customers, our reputation may be damaged and customers may be reluctant to buy our products, which could adversely affect our ability to retain existing customers and attract new customers. In addition, these defects or bugs could interrupt or delay sales of affected products to our customers, which could adversely affect our results of operations.
If defects or bugs are discovered after commencement of commercial production of a new product, we may be required to make significant expenditures of capital and other resources to resolve the problems. This could result in significant additional development costs and the diversion of technical and other resources from our other development efforts. We could also incur significant costs to repair or replace defective products, and we could be subject to claims for damages by our customers or others against us. We could also be exposed to product liability claims or indemnification claims by our customers. These costs or damages could have a material adverse effect on our financial condition and results of operations.
23
Our ability to utilize our net operating loss carryforwards and certain other tax attributes may be limited.
As of September 30, 2011, we had net operating loss carryforwards of approximately $629.4 million for federal income tax purposes. Under Section 382 of the Internal Revenue Code, if a corporation undergoes an “ownership change,” the corporation’s ability to use its pre-change net operating loss carryforwards and other pre-change tax attributes to offset its post-change income may be significantly limited. An ownership change is generally defined as a greater than 50% change in equity ownership by value over a three-year period. In August 2009, our board of directors adopted a stockholders rights agreement that is designed to help preserve our ability to utilize fully certain tax assets primarily associated with net operating loss carryforwards under Section 382 of the Internal Revenue Code. Even with this rights agreement in place, we may experience an ownership change in the future as a result of shifts in our stock ownership, including upon the issuance of our common stock, the exercise of stock options or warrants or as a result of any conversion of our convertible notes into shares of our common stock, among other things. If we were to trigger an ownership change in the future, our ability to use any net operating loss carryforwards existing at that time could be significantly limited.
Our results of operations could vary as a result of the methods, estimates and judgments we use in applying our accounting policies.
The methods, estimates and judgments we use in applying our accounting policies have a significant impact on our results of operations (see “Critical Accounting Policies and Estimates” in Part I, Item 7 of this Annual Report on Form 10-K). Such methods, estimates and judgments are, by their nature, subject to substantial risks, uncertainties and assumptions, and changes in rule making by various regulatory bodies. Factors may arise over time that lead us to change our methods, estimates and judgments. Changes in those methods, estimates and judgments could significantly affect our results of operations.
Substantial sales of the shares of our common stock issuable upon conversion of our convertible senior notes or exercise of our outstanding warrant and antidilution and other provisions in our outstanding warrant could adversely affect our stock price or our ability to raise additional financing in the public capital markets.
At September 30, 2011, we had $15.0 million aggregate principal amount of convertible senior notes outstanding. These notes are convertible at any time, at the option of the holder, into a total of approximately 3.2 million shares of common stock. The conversion of the notes and subsequent sale of a substantial number of shares of our common stock could also adversely affect demand for, and the market price of, our common stock. Each of these transactions could adversely affect our ability to raise additional financing by issuing equity or equity-based securities in the public capital markets.
A warrant is outstanding to acquire approximately 6.1 million shares of our common stock at a price of $16.74 per share, as adjusted, exercisable through June 27, 2013, representing approximately 13% of our outstanding common stock on a fully diluted basis. The warrant may be transferred or sold in whole or part at any time. If the warrant holder sells the warrant or if it or a transferee of the warrant exercises the warrant and sells a substantial number of shares of our common stock in the future, or if investors perceive that these sales may occur, the market price of our common stock could decline or market demand for our common stock could be sharply reduced.
The warrant contains antidilution provisions that provide for adjustment of the warrant’s exercise price, and the number of shares issuable under the warrant, upon the occurrence of certain events. If we issue, or are deemed to have issued, shares of our common stock, or securities convertible into our common stock, at prices below the current market price of our common stock (as defined in the warrant) at the time of the issuance of such securities, the warrant’s exercise price will be reduced and the number of shares issuable under the warrant will be increased. The amount of such adjustment if any, will be determined pursuant to a formula specified in the warrant and will depend on the number of shares issued, the offering price and the current market price of our common stock at the time of the issuance of such securities. Adjustments to the warrant pursuant to these antidilution provisions may result in significant dilution to the interests of our existing stockholders and may
24
adversely affect the market price of our common stock. The antidilution provisions may also limit our ability to obtain additional financing on terms favorable to us.
Moreover, we may not realize any cash proceeds from the exercise of the warrant. The holder of the warrant may opt for a cashless exercise of all or part of the warrant. In a cashless exercise, the holder of the warrant would make no cash payment to us, and would receive a number of shares of our common stock having an aggregate value equal to the excess of the then-current market price of the shares of our common stock issuable upon exercise of the warrant over the exercise price of the warrant. Such an issuance of common stock would be immediately dilutive to the interests of other stockholders.
Provisions in our organizational documents and stockholders rights agreements and Delaware law will make it more difficult for someone to acquire control of us.
Our restated certificate of incorporation, our amended and restated bylaws, our stockholders rights agreements and the Delaware General Corporation Law contain several provisions that would make more difficult an acquisition of control of us in a transaction not approved by our board of directors. Our restated certificate of incorporation and amended and restated bylaws include provisions such as:
| • | the division of our board of directors into three classes to be elected on a staggered basis, one class each year; |
| • | the exclusive responsibility of the board of directors to fill vacancies on the board of directors; |
| • | the ability of our board of directors to issue shares of our preferred stock in one or more series without further authorization of our stockholders; |
| • | a prohibition on stockholder action by written consent; |
| • | a requirement that stockholders provide advance notice of any stockholder nominations of directors or any proposal of new business to be considered at any meeting of stockholders; |
| • | a requirement that a supermajority vote be obtained to remove a director for cause or to amend or repeal certain provisions of our restated certificate of incorporation or amended and restated bylaws; |
| • | elimination of the right of stockholders to call a special meeting of stockholders; and |
| • | a fair price provision. |
Our stockholders rights agreements give our stockholders certain rights that would substantially increase the cost of acquiring us in a transaction not approved by our board of directors.
In addition to the stockholders rights agreements and the provisions in our restated certificate of incorporation and amended and restated bylaws, Section 203 of the Delaware General Corporation Law generally provides that a corporation shall not engage in any business combination with any interested stockholder during the three-year period following the time that such stockholder becomes an interested stockholder, unless a majority of the directors then in office approves either the business combination or the transaction that results in the stockholder becoming an interested stockholder or specified stockholder approval requirements are met.
| Item 1B. | Unresolved Staff Comments |
None.
| Item 2. | Properties |
Currently, we occupy our headquarters located in Newport Beach, California (which includes design and sales offices), 13 design centers and 11 sales locations. These facilities had an aggregate floor space of approximately 180,000 square feet, all of which is leased, consisting of approximately 97,000 square feet at our
25
headquarters, 64,000 square feet at our design centers and 23,000 square feet at our sales locations. The lease on our headquarters extends through December 2012. We may, at our option, extend the lease for an additional five-year term. We believe our properties are well maintained, are in sound operating condition and contain all the equipment and facilities to operate at present levels.
Through our design centers, we provide design engineering and product application support and after-sales service to our OEM customers. The design centers are strategically located to take advantage of key technical and engineering talent worldwide.
| Item 3. | Legal Proceedings |
We are currently not engaged in legal proceedings that require disclosure under this Item. We are, from time to time, subject to legal proceedings and claims that arise in the normal course of our business. We do not believe that the ultimate outcome of any such currently pending matters, if any, arising in the normal course of business will have a material adverse effect on our financial position, results of operations or cash flows.
PART II
| Item 5. | Market for Registrant’s Common Equity, Related Stockholder Matters and Issuer Purchases of Equity Securities |
Market Information
Our common stock is traded on the Nasdaq Global Market under the symbol “MSPD.” The following table lists the high and low closing sales price of our common stock as reported by the Nasdaq Global Market for the periods indicated.
| High | Low | |||||||
| Fiscal 2011 |
||||||||
| Quarter ended December 31, 2010 |
$ | 8.21 | $ | 5.58 | ||||
| Quarter ended April 1, 2011 |
8.70 | 6.19 | ||||||
| Quarter ended July 1, 2011 |
9.11 | 7.37 | ||||||
| Quarter ended September 30, 2011 |
8.31 | 5.07 | ||||||
| Fiscal 2010 |
||||||||
| Quarter ended January 1, 2010 |
$ | 4.94 | $ | 3.10 | ||||
| Quarter ended April 2, 2010 |
8.56 | 4.74 | ||||||
| Quarter ended July 2, 2010 |
10.71 | 6.67 | ||||||
| Quarter ended October 1, 2010 |
9.27 | 6.09 | ||||||
Recent Share Prices and Holders
The last reported sale price of our common stock on November 16, 2011 was $5.74 and there were approximately 27,316 holders of record of our common stock. However, many holders’ shares are listed under their brokerage firms’ names.
Dividend Policy
We have never paid cash dividends on our capital stock. We currently intend to retain any earnings for use in our business and do not anticipate paying cash dividends in the foreseeable future.
26
Stock Performance Graph
The following graph shows a five-year comparison of the cumulative total stockholder return on our common stock against the cumulative return of the Nasdaq U.S. Index and the Nasdaq Electronic Components Index. The graph assumes that $100 was invested on September 29, 2006, in each of our common stock, the Nasdaq U.S. Index and the Nasdaq Electronic Components Index and that all dividends were reinvested. No cash dividends have been paid or declared on our common stock. We maintain a fifty-two/fifty-three week fiscal year ending on the Friday closest to September 30.
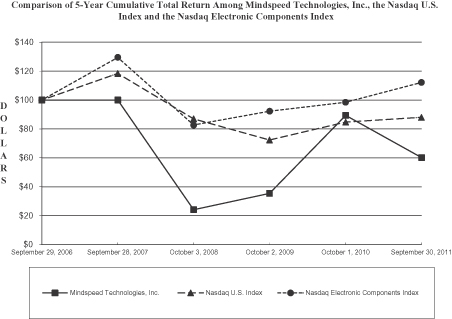
| Cumulative Total Return | ||||||||||||||||||||||||
| September 29, 2006 |
September 28, 2007 |
October 3, 2008 |
October 2, 2009 |
October 1, 2010 |
September 30, 2011 |
|||||||||||||||||||
| Mindspeed Technologies, Inc. |
$ | 100.00 | $ | 100.00 | $ | 24.05 | $ | 35.26 | $ | 89.36 | $ | 60.12 | ||||||||||||
| Nasdaq U.S. Index |
100.00 | 118.37 | 87.00 | 72.31 | 84.69 | 88.00 | ||||||||||||||||||
| Nasdaq Electronic Components Index |
100.00 | 129.63 | 82.65 | 92.31 | 98.47 | 112.25 | ||||||||||||||||||
Issuer Purchases of Equity Securities
| Total Number of Shares (or Units) Purchased(a) |
Average Price Paid per Share (or Unit) |
Total Number of Shares (or Units) Purchased as Part of Publicly Announced Plans or Programs |
Maximum Number (or Approximate Dollar Value) of Shares (or Units) that May yet be Purchased Under the Plans or Programs |
|||||||||||||
| July 2, 2011 to July 29, 2011 |
— | $ | — | — | — | |||||||||||
| July 30, 2011 to August 26, 2011 |
3,650 | $ | 6.24 | — | — | |||||||||||
| August 27, 2011 to September 30, 2011 |
5,808 | $ | 5.29 | — | — | |||||||||||
|
|
|
|
|
|||||||||||||
| 9,458 | $ | 5.66 | — | — | ||||||||||||
|
|
|
|
|
|||||||||||||
| (a) | Represents shares of our common stock withheld from, or delivered by, employees in order to satisfy applicable tax withholding obligations in connection with the vesting of restricted stock. These repurchases were not made pursuant to any publicly announced plan or program. |
27
| Item 6. | Selected Financial Data |
The selected consolidated financial data presented below should be read in conjunction with Item 7, “Management’s Discussion and Analysis of Financial Condition and Results of Operations” and our consolidated financial statements and the notes thereto appearing elsewhere in this report. Our consolidated selected financial data have been derived from our audited consolidated financial statements.
| September 30, 2011 |
October 1, 2010 |
October 2, 2009 |
October 3, 2008 |
September 28, 2007 |
||||||||||||||||
| (in thousands, except per share amounts) | ||||||||||||||||||||
| Statement of Operations Data |
||||||||||||||||||||
| Net revenue: |
||||||||||||||||||||
| Products |
$ | 159,589 | $ | 165,379 | $ | 121,552 | $ | 144,349 | $ | 125,805 | ||||||||||
| Intellectual property |
2,500 | 12,800 | 5,000 | 16,350 | 2,000 | |||||||||||||||
|
|
|
|
|
|
|
|
|
|
|
|||||||||||
| Total net revenue |
162,089 | 178,179 | 126,552 | 160,699 | 127,805 | |||||||||||||||
| Cost of goods sold (including impairments and other charges of $3,667 in fiscal 2009) |
60,292 | 59,840 | 49,981 | 47,625 | 42,334 | |||||||||||||||
|
|
|
|
|
|
|
|
|
|
|
|||||||||||
| Gross margin |
101,797 | 118,339 | 76,571 | 113,074 | 85,471 | |||||||||||||||
| Operating expenses: |
||||||||||||||||||||
| Research and development |
59,174 | 51,367 | 50,650 | 56,217 | 57,447 | |||||||||||||||
| Selling, general and administrative |
42,118 | 41,419 | 41,582 | 46,984 | 43,385 | |||||||||||||||
| Special charges(1) |
1,032 | 2,684 | 6,896 | 211 | 4,724 | |||||||||||||||
|
|
|
|
|
|
|
|
|
|
|
|||||||||||
| Total operating expenses |
102,324 | 95,470 | 99,128 | 103,412 | 105,556 | |||||||||||||||
|
|
|
|
|
|
|
|
|
|
|
|||||||||||
| Operating (loss)/income |
(527 | ) | 22,869 | (22,557 | ) | 9,662 | (20,085 | ) | ||||||||||||
| Interest expense |
(1,595 | ) | (1,817 | ) | (3,127 | ) | (5,310 | ) | (5,248 | ) | ||||||||||
| Other income, net |
1,608 | 424 | 1,052 | 544 | 522 | |||||||||||||||
|
|
|
|
|
|
|
|
|
|
|
|||||||||||
| (Loss)/income before income taxes |
(514 | ) | 21,476 | (24,632 | ) | 4,896 | (24,811 | ) | ||||||||||||
| Provision for income taxes |
241 | 406 | 482 | 611 | 111 | |||||||||||||||
|
|
|
|
|
|
|
|
|
|
|
|||||||||||
| Net (loss)/income |
$ | (755 | ) | $ | 21,070 | $ | (25,114 | ) | $ | 4,285 | $ | (24,922 | ) | |||||||
|
|
|
|
|
|
|
|
|
|
|
|||||||||||
| Net (loss)/income per share: |
||||||||||||||||||||
| Basic |
$ | (0.02 | ) | $ | 0.70 | $ | (1.04 | ) | $ | 0.19 | $ | (1.12 | ) | |||||||
| Diluted |
$ | (0.02 | ) | $ | 0.65 | $ | (1.04 | ) | $ | 0.18 | $ | (1.12 | ) | |||||||
| Shares used in computation of net (loss)/income per share: |
||||||||||||||||||||
| Basic |
32,279 | 30,260 | 24,156 | 23,046 | 22,516 | |||||||||||||||
| Diluted |
32,279 | 34,579 | 24,156 | 23,202 | 22,516 | |||||||||||||||
| September 30, 2011 |
October 1, 2010 |
October 2, 2009 |
October 3, 2008 |
September 28, 2007 |
||||||||||||||||
| (in thousands) | ||||||||||||||||||||
| Balance Sheet Data |
||||||||||||||||||||
| Cash and cash equivalents |
$ | 45,227 | $ | 43,685 | $ | 20,891 | $ | 43,033 | $ | 25,796 | ||||||||||
| Working capital |
50,346 | 53,762 | 14,223 | 50,277 | 35,814 | |||||||||||||||
| Total assets |
110,611 | 108,684 | 62,463 | 100,413 | 82,008 | |||||||||||||||
| Long-term debt |
14,216 | 13,810 | 13,415 | 40,749 | 37,308 | |||||||||||||||
| Long-term capital leases |
111 | 574 | 269 | — | — | |||||||||||||||
| Stockholders’ equity |
69,412 | 61,636 | 18,890 | 32,666 | 21,904 | |||||||||||||||
| (1) | Special charges consist of asset impairments and restructuring charges. |
28
| Item 7. | Management’s Discussion and Analysis of Financial Condition and Results of Operations |
Overview
Mindspeed Technologies, Inc. (we or Mindspeed) designs, develops and sells semiconductor solutions for communications applications in the wireline and wireless network infrastructure, which includes enterprise networks, broadband access networks (fixed and mobile) and metropolitan and wide area networks. We have organized our solutions for these interrelated and rapidly converging networks into three product families: communications convergence processing, high-performance analog and wide area networking communications. Our communications convergence processing products include ultra-low-power, multi-core digital signal processor (DSP) system-on-chip (SoC) products for the fixed and mobile (3G/4G) carrier infrastructure and residential and enterprise platforms. Our high-performance analog products include high-density crosspoint switches, optical drivers, equalization and signal-conditioning solutions that solve difficult switching, timing and synchronization challenges in next-generation optical networking, enterprise storage and broadcast video transmission applications. Our WAN communications portfolio helps optimize today’s circuit-switched networks that furnish much of the Internet’s underlying long-distance infrastructure.
Our products are sold to original equipment manufacturers (OEMs) for use in a variety of network infrastructure equipment, including:
| • | Communications Convergence Processing — triple-play access gateways for Voice-over-Internet protocol (VoIP) and data processing platforms; broadband customer premises equipment (CPE) gateways and other equipment that carriers use to deliver voice, data and video services to residential subscribers; Internet protocol (IP) private branch exchange (PBX) equipment and security appliances used in the enterprise and 3G/4G mobile base stations in the carrier infrastructure; |
| • | High-Performance Analog — next-generation fiber access network equipment (including passive optical networking, or PON, systems); switching and signal conditioning products supporting fiber-to-the-premise, optical transport networks (OTN), storage and server systems and broadcast video, inclusive of routers and other systems that are driving the migration to 3G high-definition (HD) transmission; and |
| • | WAN communications — circuit-switched networking equipment that implements asynchronous transfer mode (ATM) and T1/E1 and T3/E3 communications protocols. |
Our customers include Alcatel-Lucent, Cisco Systems, Inc., Huawei Technologies Co. Ltd., Hitachi Ltd., LM Ericsson Telephone Company, Mitsubishi Electric Corporation , Nokia Siemens Networks and Zhongxing Telecom Equipment Corp.
We report on a fifty-two/fifty-three week fiscal year ending on the Friday closest to September 30. Fiscal year 2011 comprised 52 weeks and ended on September 30, 2011. Fiscal year 2010 comprised 52 weeks and ended on October 1, 2010. Fiscal year 2009 comprised 52 weeks and ended on October 2, 2009.
Trends and Factors Affecting Our Business
Our products are components of network infrastructure equipment. As a result, we rely on network infrastructure OEMs to select our products from among alternative offerings to be designed into their equipment. These “design wins” are an integral part of the long sales cycle for our products. Our customers may need six months or longer to test and evaluate our products and an additional six months or more to begin volume production of equipment that incorporates our products. We believe our close relationships with leading network infrastructure OEMs facilitate early adoption of our products during development of their products, enhance our ability to obtain design wins and encourage adoption of our technology by the industry. We believe our diverse portfolio of semiconductor solutions has us well positioned to capitalize on some of the most significant trends in telecommunications spending, including: next generation network convergence; VoIP/fiber access deployment in developing and developed markets; 3G/4G wireless infrastructure build-out; the adoption of higher speed interconnectivity solutions; and the migration of broadcast video to HD.
29
We market and sell our semiconductor products directly to network infrastructure OEMs. We also sell our products indirectly through electronic component distributors and third-party electronic manufacturing service providers, who manufacture products incorporating our semiconductor networking solutions for OEMs. Sales to distributors accounted for approximately 60% of our revenue for fiscal 2011. Our revenue is well diversified globally, with 79% of fiscal 2011 revenue coming from outside of the Americas. We believe a portion of the products we sell to OEMs and third-party manufacturing service providers in the Asia-Pacific region is ultimately shipped to end markets in the Americas and Europe. We believe we are well-situated in China, where fiber deployments are being rolled out by the country’s major telecommunications carriers. Through our OEM customers, we are shipping into the fiber-to-the-building (FTTB) deployments of China Telecom, China Unicom and China Mobile. Approximately 38% of our revenue for fiscal 2011 was derived from customers in China.
We have significant research, development, engineering and product design capabilities. Our success depends to a substantial degree upon our ability to develop and introduce in a timely fashion new products and enhancements to our existing products that meet changing customer requirements and emerging industry standards. We have made, and plan to make, substantial investments in research and development and to participate in the formulation of industry standards. We spent approximately $59.2 million on research and development in fiscal 2011. We seek to maximize our return on our research and development spending by focusing our research and development investment in what we believe are key growth markets, including VoIP and other high-bandwidth multiservice access applications, high-performance analog applications such as optical networking and broadcast-video transmission, and wireless infrastructure solutions for base station processing. We have developed and maintain a broad intellectual property portfolio, and we may periodically enter into strategic arrangements to leverage our portfolio by licensing or selling our intellectual property.
We are dependent upon third parties for the development, manufacturing, assembly and testing of our products. Our ability to bring new products to market, to fulfill orders and to achieve long-term revenue growth is dependent upon our ability to obtain sufficient external manufacturing capacity, including wafer fabrication capacity. Periods of upturn in the semiconductor industry may be characterized by rapid increases in demand and a shortage of capacity for wafer fabrication and assembly and test services. In such periods, we may experience longer lead times or indeterminate delivery schedules, which may adversely affect our ability to fulfill orders for our products. During periods of capacity shortages for manufacturing, assembly and testing services, our primary foundries and other suppliers may devote their limited capacity to fulfill the requirements of their other customers that are larger than we are, or who have superior contractual rights to enforce manufacture of their products, including to the exclusion of producing our products. The foundries and other suppliers on whom we rely may experience financial difficulties or suffer disruptions in their operations due to causes beyond our control, including deteriorations in general economic conditions, labor strikes, work stoppages, electrical power outages, fire, earthquake, flooding or other natural disasters. We may also incur increased manufacturing costs, including costs of finding acceptable alternative foundries or assembly and test service providers. In order to achieve sustained profitability and positive cash flows from operations, we may need to further reduce operating expenses and/or increase our revenue. We have completed a series of cost reduction actions, which have improved our operating cost structure, and we will continue to perform additional actions, when necessary.
Our ability to achieve revenue growth will depend on increased demand for network infrastructure equipment that incorporates our products, which in turn depends primarily on the level of capital spending by communications service providers, the level of which may decrease due to general economic conditions and uncertainty, over which we have no control. We believe the market for network infrastructure equipment in general, and for communications semiconductors in particular, offers attractive long-term growth prospects due to increasing demand for network capacity, the continued upgrading and expansion of existing networks and the build-out of telecommunication networks in developing countries. However, the semiconductor industry is highly cyclical and is characterized by constant and rapid technological change, rapid product obsolescence and price erosion, evolving technical standards, short product life cycles and wide fluctuations in product supply and demand. In addition, there has been an increasing trend toward industry consolidation, particularly among major network equipment and telecommunications companies. Consolidation in the industry has generally led to pricing pressure and loss of market share. These factors have caused substantial fluctuations in our revenue and our results of operations in the past, and we may experience cyclical fluctuations in our business in the future.
30
Critical Accounting Policies and Estimates
The preparation of financial statements in accordance with generally accepted accounting principles (GAAP) in the United States requires us to make estimates and assumptions that affect the reported amounts of assets and liabilities and disclosure of contingent assets and liabilities at the date of the financial statements and the reported amounts of revenue and expenses during the reporting period. Among the significant estimates affecting our consolidated financial statements are those relating to inventories, stock-based compensation, revenue recognition, income taxes and impairment of long-lived assets. We regularly evaluate our estimates and assumptions based upon historical experience and various other factors that we believe to be reasonable under the circumstances, the results of which form the basis for making judgments about the carrying values of assets and liabilities that are not readily apparent from other sources. To the extent actual results differ from those estimates, our future results of operations may be affected.
Inventories — We assess the recoverability of our inventories at least quarterly through a review of inventory levels in relation to foreseeable demand (generally over 12 months). Foreseeable demand is based upon all available information, including sales backlog and forecasts, product marketing plans and product life cycles. When the inventory on hand exceeds the foreseeable demand, we write down the value of those inventories which, at the time of our review, we expect to be unable to sell. The amount of the inventory write-down is the excess of historical cost over estimated realizable value. Once established, these write-downs are considered permanent adjustments to the cost basis of the excess inventory.
Our products are used by OEMs that have designed our products into network infrastructure equipment. For many of our products, we gain these design wins through a lengthy sales cycle, which often includes providing technical support to the OEM customer. In the event of the loss of business from existing OEM customers, we may be unable to secure new customers for our existing products without first achieving new design wins. In the event that quantities of inventory on hand exceed foreseeable demand from existing OEM customers into whose products our products have been designed, we generally are unable to sell our excess inventories to others, and the estimated realizable value of such inventories to us is generally zero.
We base our assessment of the recoverability of our inventories, and the amounts of any write-downs, on currently available information and assumptions about future demand and market conditions. Demand for our products may fluctuate significantly over time, and actual demand and market conditions may be more or less favorable than those projected by management. In the event that actual demand is lower than originally projected, additional inventory write-downs may be required.
Stock-Based Compensation — We account for stock-based compensation transactions using a fair-value method and recognize the fair value of each award as an expense over the service period. The fair value of restricted stock awards is based upon the market price of our common stock at the grant date. For the majority of our awards, we estimate the fair value of stock option awards, as of the grant date, using the Black-Scholes option-pricing model. The use of the Black-Scholes model requires that we make a number of estimates, including the expected option term, the expected volatility in the price of our common stock, the risk-free rate of interest and the dividend yield on our common stock. If our expected option term and stock-price volatility assumptions were different, the resulting determination of the fair value of stock option awards could be materially different. In addition, judgment is also required in estimating the number of share-based awards that we expect will ultimately vest upon the fulfillment of service conditions (such as time-based vesting) or the achievement of specific performance conditions. If the actual number of awards that ultimately vest differs significantly from these estimates, stock-based compensation expense and our results of operations could be materially impacted. We classify compensation expense related to these awards in our consolidated statement of operations based on the department to which the recipient reports.
Revenue Recognition — We generate revenue from direct product sales, sales to distributors, maintenance contracts, development agreements and the sale and license of intellectual property. We recognize revenue when the following fundamental criteria are met: (i) persuasive evidence of an arrangement exists; (ii) delivery has occurred; (iii) our price to the customer is fixed or determinable; and (iv) collection of the sales price is reasonably assured. In instances where final acceptance of the product, system, or solution is specified by the
31
customer, revenue is deferred until all acceptance criteria have been met. Technical support services revenue is deferred and recognized ratably over the period during which the services are to be performed. Advanced services revenue is recognized upon delivery or completion of performance.
We recognize revenue on products shipped directly to customers at the time the products are shipped and title and risk of loss transfer to the customer, in accordance with the terms specified in the arrangement, and the four above mentioned revenue recognition criteria are met.
We recognize revenue on sales to distributors based on the rights granted to these distributors in our distribution agreements. We have certain distributors who have been granted return rights and receive credits for changes in selling prices to end customers, the magnitude of which is not known at the time products are shipped to the distributor. The return rights granted to these distributors consist of limited stock rotation rights, which allow them to rotate up to 10% of the products in their inventory twice a year, as well as certain product return rights if the applicable distribution agreement is terminated. These distributors also receive price concessions because they resell our products to end customers at various negotiated price points which vary by end customer, product, quantity, geography and competitive pricing environments. When a distributor’s resale is priced at a discount from the distributor’s invoice price, we credit back to the distributor a portion of the distributor’s original purchase price after the resale transaction is complete. Thus, a portion of the “Deferred income on sales to distributors” balance will be credited back to the distributor in the future. Under these agreements, we defer recognition of revenue until the products are resold by the distributor, at which time our final net sales price is fixed and the distributor’s right to return the products expires. At the time of shipment to these distributors: (i) we record a trade receivable at the invoiced selling price because there is a legally enforceable obligation from the distributor to pay us currently for product delivered; (ii) we relieve inventory for the carrying value of products shipped because legal title has passed to the distributor; and (iii) we record deferred revenue and deferred cost of inventory under the “Deferred income on sales to distributors” caption in the liability section of our consolidated balance sheets. We evaluate the deferred cost of inventory component of this account for possible impairment by considering potential obsolescence of products that might be returned to us and by considering the potential of resale prices of these products being below our cost. By reviewing deferred inventory costs in the manners discussed above, we ensure that any portion of deferred inventory costs that are not recoverable from future contractual revenue are charged to cost of sales as an expense. “Deferred income on sales to distributors” effectively represents the gross margin on sales to distributors; however, the amount of gross margin we recognize in future periods is typically less than the originally recorded deferred income as a result of negotiated price concessions. In recent years, such concessions have exceeded 30% of list price on average. For detail of this account balance, see Note 3 to our consolidated financial statements.
We recognize revenue from other distributors at the time of shipment and when title and risk of loss transfer to the distributor, in accordance with the terms specified in the arrangement, and when the four above mentioned revenue recognition criteria are met. These distributors may also be given business terms to return a portion of inventory, however they do not receive credits for changes in selling prices to end customers. At the time of shipment, product prices are fixed or determinable and the amount of future returns can be reasonably estimated and accrued.
Our products are often integrated with software that is essential to the functionality of the equipment. Additionally, we provide unspecified software upgrades and enhancements through our maintenance contracts for many of our products. Accordingly, we account for revenue in accordance with Financial Accounting Standards Board (FASB) Accounting Standards Codification (ASC) 985-605, Software Revenue Recognition, and all related interpretations. For sales of products where software is not included or is incidental to the equipment, we apply the provisions of ASC 605, Revenue Recognition, and all related interpretations.
Revenue from the sale and license of intellectual property is recognized when the above mentioned four revenue recognition criteria are met. Development revenue is recognized when services are performed and customer acceptance has been received and was not significant for any of the periods presented.
Deferred Income Taxes and Uncertain Tax Positions — We have provided a full valuation allowance against our U.S federal and state deferred tax assets. If sufficient positive evidence of our ability to generate
32
future U.S federal and/or state taxable income becomes apparent, we may be required to reduce our valuation allowance, resulting in income tax benefits in our statement of operations. We evaluate the realizability of our deferred tax assets and assess the need for a valuation allowance quarterly. We follow ASC 740, Income Taxes, for the accounting for uncertainty in income taxes recognized in an entity’s financial statements. ASC 740 prescribes a recognition threshold and measurement attributes for financial statement disclosure of tax positions taken or expected to be taken on a tax return. Under ASC 740, the impact of an uncertain income tax position on the income tax return must be recognized at the largest amount that is more likely than not to be sustained upon audit by the relevant taxing authority. An uncertain income tax position will not be recognized if it has less than a 50% likelihood of being sustained. Additionally, the new interpretations provide guidance on de-recognition, classification, interest and penalties, accounting in interim periods, disclosure and transition. The application of tax laws and regulations is subject to legal and factual interpretation, judgment and uncertainty. Tax laws and regulations themselves are subject to change as a result of changes in fiscal policy, changes in legislation, the evolution of regulations and court rulings. Therefore, the actual liability for U.S. or foreign taxes may be materially different from our estimates, which could result in the need to record additional tax liabilities or potentially reverse previously recorded tax liabilities.
Impairment of Long-Lived Assets — We regularly monitor and review long-lived assets, including fixed assets, goodwill and intangible assets, for impairment including whenever events or changes in circumstances indicate that the carrying amount of any such asset may not be recoverable. The determination of recoverability is based on an estimate of the undiscounted cash flows expected to result from the use of an asset and its eventual disposition. The estimate of cash flows is based upon, among other things, certain assumptions about expected future operating performance, growth rates and other factors. Our estimates of undiscounted cash flows may differ from actual cash flows due to, among other things, technological changes, economic conditions, changes to our business model or changes in our operating performance. If the sum of the undiscounted cash flows (excluding interest) is less than the carrying value, we recognize an impairment loss, measured as the amount by which the carrying value exceeds the fair value of the asset. See Notes 12 and 13 to our consolidated financial statements for a discussion of the impairment of certain long-lived assets.
Recent Accounting Pronouncements
In June 2011, the FASB issued guidance regarding the presentation of comprehensive income. The new standard requires the presentation of comprehensive income, the components of net income and the components of other comprehensive income either in a single continuous statement of comprehensive income or in two separate but consecutive statements. The new standard also requires presentation of adjustments for items that are reclassified from other comprehensive income to net income in the statement where the components of net income and the components of other comprehensive income are presented. The updated guidance is effective on a retrospective basis for financial statements issued for fiscal years, and interim periods within those fiscal years, beginning after December 15, 2011. We do not expect the adoption of this guidance to have a material impact on our consolidated financial statements.
In May 2011, the FASB issued additional guidance on fair value measurements that clarifies the application of existing guidance and disclosure requirements, changes certain fair value measurement principles and requires additional disclosures about fair value measurements. The updated guidance is effective on a prospective basis for financial statements issued for fiscal years, and interim periods within those fiscal years, beginning after December 15, 2011. We do not expect the adoption of this guidance to have a material impact on our consolidated financial statements.
In April 2010, the FASB reached a consensus on the Milestone Method of Revenue Recognition, which provides guidance on the criteria that should be met for determining whether the milestone method of revenue recognition is appropriate. A vendor can recognize consideration that is contingent upon the achievement of a milestone in its entirety as revenue in the period in which the milestone is achieved only if the milestone meets all criteria to be considered substantive. The updated guidance is effective on a prospective basis for milestones achieved in fiscal years, and interim periods within those years beginning on or after June 15, 2010, with early adoption permitted. The adoption of these provisions did not have a material impact on our consolidated financial statements.
33
In September 2009, the Emerging Issues Task Force reached a consensus on Accounting Standards Update, or ASU, 2009-13, Revenue Recognition (Topic 605) — Multiple-Deliverable Revenue Arrangements, or ASU 2009-13 and ASU 2009-14, Software (Topic 985) — Certain Revenue Arrangements That Include Software Elements, or ASU 2009-14. ASU 2009-13 modifies the requirements that must be met for an entity to recognize revenue from the sale of a delivered item that is part of a multiple-element arrangement when other items have not yet been delivered. ASU 2009-13 eliminates the requirement that all undelivered elements must have either: (i) vendor specific objective evidence (VSOE) of fair value; or (ii) third-party evidence (TPE) before an entity can recognize the portion of an overall arrangement consideration that is attributable to items that have already been delivered. In the absence of VSOE or TPE of the standalone selling price for one or more delivered or undelivered elements in a multiple-element arrangement, entities will be required to estimate the selling prices of those elements. Overall arrangement consideration will be allocated to each element (both delivered and undelivered items) based on their relative selling prices, regardless of whether those selling prices are evidenced by VSOE or TPE or are based on the entity’s estimated selling price. The residual method of allocating arrangement consideration has been eliminated. ASU 2009-14 modifies the software revenue recognition guidance to exclude from its scope tangible products that contain both software and non-software components that function together to deliver a product’s essential functionality. These new updates are effective for revenue arrangements entered into or materially modified in fiscal years beginning on or after June 15, 2010. The adoption of these provisions did not have a material impact on our consolidated financial statements.
Results of Operations
Net Revenue
The following table summarizes net revenue by product line for fiscal 2011 compared to fiscal 2010:
| Year Ended | ||||||||||||||||||||||||
| September
30, 2011 |
% of
Net Revenue |
October
1, 2010 |
% of
Net Revenue |
Change | ||||||||||||||||||||
| $ | % | |||||||||||||||||||||||
| (in thousands, except percentages) | ||||||||||||||||||||||||
| Communications convergence processing |
$ | 71,652 | 44 | % | $ | 66,923 | 38 | % | $ | 4,729 | 7.1 | % | ||||||||||||
| High-performance analog |
59,240 | 36 | % | 54,311 | 30 | % | 4,929 | 9.1 | % | |||||||||||||||
| WAN communications |
28,697 | 18 | % | 44,145 | 25 | % | (15,448 | ) | -35.0 | % | ||||||||||||||
|
|
|
|
|
|
|
|
|
|
|
|||||||||||||||
| Total net product revenue |
159,589 | 98 | % | 165,379 | 93 | % | (5,790 | ) | -3.5 | % | ||||||||||||||
| Intellectual property |
2,500 | 2 | % | 12,800 | 7 | % | (10,300 | ) | -80.5 | % | ||||||||||||||
|
|
|
|
|
|
|
|
|
|
|
|||||||||||||||
| Net revenue |
$ | 162,089 | 100 | % | $ | 178,179 | 100 | % | $ | (16,090 | ) | -9.0 | % | |||||||||||
|
|
|
|
|
|
|
|
|
|
|
|||||||||||||||
The decrease in our net revenue for fiscal 2011 compared to fiscal 2010 mainly reflects lower sales volumes in our WAN communications products and lower revenue from the sale of intellectual property. These decreases were partially offset by higher sales volume in our communications convergence processing products and our high- performance analog products. Net revenue from our WAN communications products decreased in fiscal 2011 compared to fiscal 2010 due to a slowdown in demand at several large customers, particularly in ATM-based systems. WAN communications products represent a legacy business for us, as we have shifted almost all of our research and development investment into our two growth businesses of communications convergence processing products and high-performance analog products. Net revenue from intellectual property licensing and sales decreased in fiscal 2011 compared to fiscal 2010 due to a decline in intellectual property sales in fiscal 2011. Net revenue from our communications convergence processing products increased in fiscal 2011 when compared to fiscal 2010, due to an increase in shipments of CPE products, which are used in broadband CPE gateways and other equipment that service providers are deploying in order to deliver voice, data and video services to residential subscribers. Within communications convergence processing, we also experienced an increase in shipments for FTTB deployments, particularly to customers in China. Net revenue from high-performance analog products increased in fiscal 2011 when compared to fiscal 2010, primarily due to increased demand for physical media devices, which are primarily used in equipment for fiber-to-the-premise deployments.
34
The following table summarizes net revenue by product line for fiscal 2010 compared to fiscal 2009:
| Year Ended | ||||||||||||||||||||||||
| October
1, 2010 |
% of
Net Revenue |
October
2, 2009 |
% of
Net Revenue |
Change | ||||||||||||||||||||
| $ | % | |||||||||||||||||||||||
| (in thousands, except percentages) | ||||||||||||||||||||||||
| Communications convergence processing |
$ | 66,923 | 38 | % | $ | 49,452 | 39 | % | $ | 17,471 | 35.3 | % | ||||||||||||
| High-performance analog |
54,311 | 30 | % | 39,084 | 31 | % | 15,227 | 39.0 | % | |||||||||||||||
| WAN communications |
44,145 | 25 | % | 33,016 | 26 | % | 11,129 | 33.7 | % | |||||||||||||||
|
|
|
|
|
|
|
|
|
|
|
|||||||||||||||
| Total net product revenue |
165,379 | 93 | % | 121,552 | 96 | % | 43,827 | 36.1 | % | |||||||||||||||
| Intellectual property |
12,800 | 7 | % | 5,000 | 4 | % | 7,800 | 156.0 | % | |||||||||||||||
|
|
|
|
|
|
|
|
|
|
|
|||||||||||||||
| Net revenue |
$ | 178,179 | 100 | % | $ | 126,552 | 100 | % | $ | 51,627 | 40.8 | % | ||||||||||||
|
|
|
|
|
|
|
|
|
|
|
|||||||||||||||
For fiscal 2010, the increase in our net revenue compared to fiscal 2009 primarily reflects higher sales volume in all three of our product families, as well as an increase in the sales and licensing of our intellectual property. Net revenue from our communications convergence processing products increased in fiscal 2010 compared to fiscal 2009, mainly reflecting an increase in shipments of our CPE products, which are used in broadband home gateways and other equipment used by service providers in fiber-to-the-home deployments in order to deliver voice, data and video services to residential subscribers. Within communications convergence processing, we also experienced an increase in shipments for FTTB deployments, particularly to customers in China. Net revenue from our high-performance analog products increased when comparing fiscal 2010 to fiscal 2009 due primarily to increased demand for crosspoint switches primarily related to strength in the optical transport market and broadcast video market, and increased demand for our physical media devices as we expanded into the gigabit passive optical networking (GPON) market. Net revenue from our WAN communications products increased mainly reflecting an increase in shipments of our network processor products and our carrier Ethernet products in fiscal 2010. Net revenue from intellectual property licensing and sales increased in fiscal 2010 compared to fiscal 2009, due to the sale of certain intellectual property in two significant transactions in the fourth quarter of fiscal 2010.
Gross Margin
Gross margin represents net revenue less cost of goods sold. As a fabless semiconductor company, we use third parties (including Taiwan Semiconductor Manufacturing Co., Ltd., Amkor Technology, Inc. and Advanced Semiconductor Engineering, Inc.) for wafer fabrication and assembly and test services. Our cost of goods sold consists predominantly of: purchased finished wafers; assembly and test services; royalty and other intellectual property costs; labor and overhead costs associated with product procurement; amortization of the cost of mask sets purchased; and sustaining engineering expenses pertaining to products sold.
The following table presents gross margin for fiscal 2011 compared to fiscal 2010:
| Year Ended | ||||||||||||||||||||||||
| September
30, 2011 |
% of
Net Revenue |
October
1, 2010 |
% of
Net Revenue |
Change | ||||||||||||||||||||
| $ | % | |||||||||||||||||||||||
| (in thousands, except percentages) | ||||||||||||||||||||||||
| Gross margin |
$ | 101,797 | 63 | % | $ | 118,339 | 66 | % | $ | (16,542 | ) | -14.0 | % | |||||||||||
|
|
|
|
|
|
|
|
|
|
|
|
|
|||||||||||||
Our gross margin for fiscal 2011 decreased from fiscal 2010, principally reflecting a $5.8 million decrease in product sales and a $10.3 million decrease in intellectual property revenue in fiscal 2011. The decrease in our gross margin as a percent of net revenue for fiscal 2011 compared to fiscal 2010 was primarily due to a decrease in the sale of intellectual property, which had little associated cost, as well as a change in product mix.
35
The following table presents gross margin for fiscal 2010 compared to fiscal 2009:
| Year Ended | ||||||||||||||||||||||||
| October
1, 2010 |
% of
Net Revenue |
October
2, 2009 |
% of
Net Revenue |
Change | ||||||||||||||||||||
| $ | % | |||||||||||||||||||||||
| (in thousands, except percentages) | ||||||||||||||||||||||||
| Gross margin |
$ | 118,339 | 66 | % | $ | 76,571 | 61 | % | $ | 41,768 | 54.5 | % | ||||||||||||
|
|
|
|
|
|
|
|
|
|
|
|||||||||||||||
Our gross margin for fiscal 2010 increased from fiscal 2009, principally reflecting an increase in both product and intellectual property revenue in fiscal 2010, as well as the effect of asset impairment charges recorded in the second quarter of fiscal 2009. Our fiscal 2010 product sales increased $43.8 million, or 36%, compared to fiscal 2009 and our sale or licensing of intellectual property increased $7.8 million, or 156%. The increase in our gross margin as a percent of net revenue for fiscal 2010 compared to fiscal 2009 was primarily due to the effect of asset impairment charges incurred in fiscal 2009 and increased sales of higher margin intellectual property in fiscal 2010.
Research and Development
Our research and development (R&D) expenses consist principally of direct personnel costs, photomasks, electronic design automation tools and pre-production evaluation and test costs.
The following table presents details of research and development expense for fiscal 2011 compared to fiscal 2010:
| Year Ended | ||||||||||||||||||||||||
| September
30, 2011 |
% of
Net Revenue |
October
1, 2010 |
% of
Net Revenue |
Change | ||||||||||||||||||||
| $ | % | |||||||||||||||||||||||
| (in thousands, except percentages) | ||||||||||||||||||||||||
| Personnel-related costs |
$ | 35,992 | $ | 32,170 | $ | 3,822 | 11.9 | % | ||||||||||||||||
| Stock-based compensation |
1,783 | 1,004 | 779 | 77.6 | % | |||||||||||||||||||
| Design and development costs |
12,299 | 9,689 | 2,610 | 26.9 | % | |||||||||||||||||||
| Facilities |
5,605 | 5,928 | (323 | ) | -5.4 | % | ||||||||||||||||||
| Depreciation |
2,015 | 1,299 | 716 | 55.1 | % | |||||||||||||||||||
| Other |
1,480 | 1,277 | 203 | 15.9 | % | |||||||||||||||||||
|
|
|
|
|
|
|
|||||||||||||||||||
| Research and development |
$ | 59,174 | 37 | % | $ | 51,367 | 29 | % | $ | 7,807 | 15.2 | % | ||||||||||||
|
|
|
|
|
|
|
|
|
|
|
|||||||||||||||
The increase in R&D expenses for fiscal 2011 compared to fiscal 2010 was primarily driven by increased investment in our next generation products in both the wireless and enterprise markets that resulted in an: increase in design and development costs, including engineering tools, contracted engineering services and depreciation on engineering equipment; and increase in personnel costs, including stock-based compensation, as a result of increased headcount.
The following table presents details of research and development expense for fiscal 2010 compared to fiscal 2009:
| Year Ended | ||||||||||||||||||||||||
| October
1, 2010 |
% of
Net Revenue |
October
2, 2009 |
% of
Net Revenue |
Change | ||||||||||||||||||||
| $ | % | |||||||||||||||||||||||
| (in thousands, except percentages) | ||||||||||||||||||||||||
| Personnel-related costs |
$ | 32,170 | $ | 30,653 | $ | 1,517 | 4.9 | % | ||||||||||||||||
| Stock-based compensation |
1,004 | 765 | 239 | 31.2 | % | |||||||||||||||||||
| Design and development costs |
9,689 | 9,914 | (225 | ) | -2.3 | % | ||||||||||||||||||
| Facilities |
5,928 | 6,827 | (899 | ) | -13.2 | % | ||||||||||||||||||
| Depreciation |
1,299 | 1,224 | 75 | 6.1 | % | |||||||||||||||||||
| Other |
1,277 | 1,267 | 10 | 0.8 | % | |||||||||||||||||||
|
|
|
|
|
|
|
|||||||||||||||||||
| Research and development |
$ | 51,367 | 29 | % | $ | 50,650 | 40 | % | $ | 717 | 1.4 | % | ||||||||||||
|
|
|
|
|
|
|
|
|
|
|
|||||||||||||||
36
The increase in R&D expenses for fiscal 2010 compared to fiscal 2009 was primarily driven by an increase in compensation and personnel-related costs, including stock-based compensation expense. This increase was due to both a management bonus accrual in accordance with our fiscal 2010 cash bonus plan, as well as an increase in headcount within our communications convergence processing and high-performance analog groups. This increase was partially offset by a decrease in the cost of our facilities, which was mainly the result of entering into a new corporate headquarters lease at a more favorable rental rate than we had previously.
Selling, General and Administrative
Our selling, general and administrative (SG&A) expenses include personnel costs, independent sales representative commissions and product marketing, applications engineering and other marketing costs. Our SG&A expenses also include costs of corporate functions, including accounting, finance, legal, human resources, information systems and communications.
The following table presents details of selling, general and administrative expense for fiscal 2011 compared to fiscal 2010:
| Year Ended | ||||||||||||||||||||||||
| September
30, 2011 |
% of
Net Revenue |
October
1, 2010 |
% of
Net Revenue |
Change | ||||||||||||||||||||
| $ | % | |||||||||||||||||||||||
| (in thousands, except percentages) | ||||||||||||||||||||||||
| Personnel-related costs |
$ | 25,635 | $ | 26,756 | $ | (1,121 | ) | -4.2 | % | |||||||||||||||
| Stock-based compensation |
4,046 | 3,076 | 970 | 31.5 | % | |||||||||||||||||||
| Professional fees and outside services |
4,207 | 3,948 | 259 | 6.6 | % | |||||||||||||||||||
| Facilities |
3,285 | 3,420 | (135 | ) | -3.9 | % | ||||||||||||||||||
| Depreciation |
671 | 549 | 122 | 22.2 | % | |||||||||||||||||||
| Other |
4,274 | 3,670 | 604 | 16.5 | % | |||||||||||||||||||
|
|
|
|
|
|
|
|||||||||||||||||||
| Selling, general and administrative |
$ | 42,118 | 26 | % | $ | 41,419 | 23 | % | $ | 699 | 1.7 | % | ||||||||||||
|
|
|
|
|
|
|
|
|
|
|
|||||||||||||||
The increase in our SG&A expenses in fiscal 2011 compared to fiscal 2010 was primarily driven by an increase in stock-based compensation expense and other expenses, including primarily business taxes and our provision for bad debt. These increases were partially offset by a decrease in personnel-related costs resulting from headcount reductions associated with our most recent restructuring, as well as a decrease in our accrual for management’s bonus.
The following table presents details of selling, general and administrative expense for fiscal 2010 compared to fiscal 2009:
| Year Ended | ||||||||||||||||||||||||
| October
1, 2010 |
% of
Net Revenue |
October
2, 2009 |
% of
Net Revenue |
Change | ||||||||||||||||||||
| $ | % | |||||||||||||||||||||||
| (in thousands, except percentages) | ||||||||||||||||||||||||
| Personnel-related costs |
$ | 26,756 | $ | 27,171 | $ | (415 | ) | -1.5 | % | |||||||||||||||
| Stock-based compensation |
3,076 | 1,825 | 1,251 | 68.5 | % | |||||||||||||||||||
| Professional fees and outside services |
3,948 | 4,176 | (228 | ) | -5.5 | % | ||||||||||||||||||
| Facilities |
3,420 | 4,017 | (597 | ) | -14.9 | % | ||||||||||||||||||
| Depreciation |
549 | 565 | (16 | ) | -2.8 | % | ||||||||||||||||||
| Other |
3,670 | 3,828 | (158 | ) | -4.1 | % | ||||||||||||||||||
|
|
|
|
|
|
|
|||||||||||||||||||
| Selling, general and administrative |
$ | 41,419 | 23 | % | $ | 41,582 | 33 | % | $ | (163 | ) | -0.4 | % | |||||||||||
|
|
|
|
|
|
|
|
|
|
|
|||||||||||||||
The decrease in our SG&A expenses in fiscal 2010 compared to fiscal 2009 was primarily due to a decrease in the cost of our facilities, which was primarily due to our entering into a new corporate headquarters lease at a more favorable rental rate than we had previously. In addition, the decrease in SG&A in fiscal 2010 as compared to fiscal 2009 was due to a decrease in the cost of our professional fees and insurance. These decreases in SG&A
37
expenses were mostly offset by an increase in compensation, including stock-based compensation expense. The increase in compensation, including stock-based compensation expense, reflected a decrease in costs resulting from headcount reductions associated with our restructuring activities, which was more than offset by an increase in compensation expense related to a management bonus accrual in accordance with our fiscal 2010 cash bonus plan, as well as an increase in stock compensation expense.
Special Charges
Special charges consisted of the following:
| Year Ended | ||||||||||||
| September 30, 2011 |
October 1, 2010 |
October 2, 2009 |
||||||||||
| (in thousands) | ||||||||||||
| Asset impairments |
$ | — | $ | 828 | $ | 2,865 | ||||||
| Restructuring charges |
1,032 | 1,856 | 4,031 | |||||||||
| Total special charges |
$ | 1,032 | $ | 2,684 | $ | 6,896 | ||||||
Asset Impairments
During fiscal 2011, we did not record any asset impairment charges.
During fiscal 2010, we recorded asset impairment charges of $828,000. These impairment charges consisted of property and equipment that we determined to abandon or scrap.
During fiscal 2009, we recorded asset impairment charges of $2.9 million. Included in this amount were asset impairment charges of approximately $500,000 related to software and property and equipment that we determined to abandon or scrap, as well as asset impairment charges of $2.4 million to write-down the carrying value of goodwill related to our acquisition of certain assets of Ample Communications. In the second quarter of fiscal 2009, our Ample Communications reporting unit experienced a severe decline in sales and profitability due to a significant decline in demand that we believe was a result of the downturn in global economic conditions, as well as a bankruptcy filed by the reporting unit’s most significant customer. The drop in market demand resulted in significant declines in unit sales. Due to these market and economic conditions, our Ample Communications reporting unit experienced a significant decline in market value. As a result, we concluded that there were sufficient factual circumstances for interim impairment analyses. Accordingly, in the second quarter of fiscal 2009, we performed a goodwill impairment assessment. Based on the results of our assessment of goodwill for impairment, we determined that the carrying value of the Ample Communications reporting unit exceeded its estimated fair value. Therefore, we performed a second step of the impairment test to estimate the implied fair value of goodwill. The required analysis indicated that there would be no remaining implied value attributable to goodwill in the Ample Communications reporting unit and we impaired the entire goodwill balance of $2.4 million.
We continually monitor and review long-lived assets, including fixed assets and intangible assets, for possible impairment. Future impairment tests may result in significant write-downs of the value of our assets.
Restructuring Charges
We have from time to time, and may in the future, commit to restructuring plans to help manage our costs or to help implement strategic initiatives, among other reasons.
Mindspeed Fourth Quarter of Fiscal 2011 Restructuring Plan — In the fourth quarter of fiscal 2011, we committed to the implementation of a restructuring plan. The plan consisted primarily of a targeted headcount reduction in our selling, general and administrative functions and WAN business unit. The restructuring plan was substantially completed during the fourth quarter of fiscal 2011. We incurred $1.1 million of charges related to severance costs for the affected employees.
38
Activity and liability balances related to our fourth quarter of fiscal 2011 restructuring plan through September 30, 2011 were as follows:
| Workforce Reductions |
||||
| (in thousands) | ||||
| Charges to costs and expenses |
$ | 1,091 | ||
| Cash payments |
(189 | ) | ||
|
|
|
|||
| Restructuring balance, September 30, 2011 |
$ | 902 | ||
|
|
|
|||
Mindspeed Fourth Quarter of Fiscal 2010 Restructuring Plan — In the fourth quarter of fiscal 2010, we committed to the implementation of a restructuring plan. The plan consisted primarily of a targeted headcount reduction in its WAN product family and selling, general and administrative functions. The restructuring plan was substantially completed during the fiscal fourth quarter of 2010. Of the $1.3 million in charges incurred, $966,000 related to severance costs for affected employees and $311,000 related to abandoned technology.
Activity and liability balances related to our fourth quarter of fiscal 2010 through September 30, 2011 were as follows:
| Workforce Reductions |
Facility and Other |
Total | ||||||||||
| (in thousands) | ||||||||||||
| Charges to costs and expenses |
$ | 966 | $ | 311 | $ | 1,277 | ||||||
| Cash payments |
(265 | ) | — | (265 | ) | |||||||
| Non-cash asset write-downs |
— | (311 | ) | (311 | ) | |||||||
|
|
|
|
|
|
|
|||||||
| Restructuring balance, October 1, 2010 |
$ | 701 | $ | — | $ | 701 | ||||||
|
|
|
|
|
|
|
|||||||
| Cash payments |
(618 | ) | — | (618 | ) | |||||||
| Non-cash credits |
(41 | ) | — | (41 | ) | |||||||
|
|
|
|
|
|
|
|||||||
| Restructuring balance, September 30, 2011 |
$ | 42 | $ | — | $ | 42 | ||||||
|
|
|
|
|
|
|
|||||||
The remaining accrued restructuring balance principally represents employee severance benefits. We expect to pay these remaining obligations in the first quarter of fiscal 2012.
Mindspeed Fiscal 2009 Restructuring Plans — In fiscal 2009, we implemented two restructuring plans to improve our operating structure. These restructuring plans included workforce reductions, closure of facilities and reductions in areas of selling, general and administrative and WAN communications spending.
At October 1, 2010, the total remaining accrued restructuring balance under these plans was $20,000. During the first quarter of fiscal 2011, any amounts left to be paid under these plans were paid and any remaining accrued amounts were reversed. At September 30, 2011, there was no remaining accrued restructuring balance related to these plans.
Interest Expense
The following tables present interest expense for fiscal 2011 compared to fiscal 2010 and fiscal 2010 compared to fiscal 2009:
| Year Ended | ||||||||||||||||||||||||
| September 30, 2011 |
% of
Net Revenue |
October 1, 2010 |
% of
Net Revenue |
Change | ||||||||||||||||||||
| $ | % | |||||||||||||||||||||||
| (in thousands, except percentages) | ||||||||||||||||||||||||
| Interest expense |
$ | 1,595 | 1 | % | $ | 1,817 | 1 | % | $ | (222 | ) | -12.2 | % | |||||||||||
|
|
|
|
|
|
|
|
|
|
|
|
|
|||||||||||||
39
| Year Ended | ||||||||||||||||||||||||
| October
1, 2010 |
% of
Net Revenue |
October
2, 2009 |
% of
Net Revenue |
Change | ||||||||||||||||||||
| $ | % | |||||||||||||||||||||||
| (in thousands, except percentages) | ||||||||||||||||||||||||
| Interest expense |
$ | 1,817 | 1 | % | $ | 3,127 | 2 | % | $ | (1,310 | ) | -41.9 | % | |||||||||||
|
|
|
|
|
|
|
|
|
|
|
|
|
|||||||||||||
Interest expense for fiscal 2011, 2010 and 2009 primarily represented interest on our convertible senior notes issued in December 2004 and July 2008. The decline in our interest expense charge from fiscal 2009 through fiscal 2011 corresponded to the decrease in our overall debt balance during that period. In November 2009, we repaid the remaining $10.5 million due under our 3.75% convertible senior notes, thereby decreasing our interest expense related to these notes for the remainder of fiscal 2010. In October 2008, we repurchased $20.5 million aggregate principal amount of our 3.75% convertible senior notes, thereby decreasing our interest expense related to these notes for the remainder of fiscal 2009. As a result of adopting ASC 470-20 on October 3, 2009, we have separately accounted for the liability and equity components of our convertible senior notes, retrospectively, which resulted in recognizing interest expense based on the entity’s borrowing rate at the time of issuance for similar unsecured senior debt without an equity conversion feature. Pre-tax non-cash interest expense attributable to the adoption was $406,000 in fiscal 2011, $546,000 in fiscal 2010 and $1.5 million in fiscal 2009. See Note 6 to our consolidated financial statements for additional information on the adoption of ASC 470-20.
Other Income, Net
The following table presents other income, net, for fiscal 2011 compared to fiscal 2010:
| Year Ended | ||||||||||||||||||||||||
| September
30, 2011 |
% of
Net Revenue |
October 1, 2010 |
% of
Net Revenue |
Change | ||||||||||||||||||||
| $ | % | |||||||||||||||||||||||
| (in thousands, except percentages) | ||||||||||||||||||||||||
| Other Income, Net |
$ | 1,608 | 1 | % | $ | 424 | 0 | % | $ | 1,184 | 279.2 | % | ||||||||||||
|
|
|
|
|
|
|
|
|
|
|
|
|
|||||||||||||
Other income, net, principally consisted of interest income, income from reimbursable foreign R&D incentives, foreign exchange gains and losses and other non-operating gains and losses, including gains/losses on debt extinguishments. The increase in other income, net, in fiscal 2011 compared to fiscal 2010 principally reflected $1.7 million in reimbursable foreign research and development credits recorded in other income in fiscal 2011. This increase in other income was partially offset by approximately $80,000 in net foreign exchange losses recorded in fiscal 2011 compared to $430,000 in net foreign exchange gains recorded in fiscal 2010.
| Year Ended | ||||||||||||||||||||||||
| October
1, 2010 |
% of
Net Revenue |
October
2, 2009 |
% of
Net Revenue |
Change | ||||||||||||||||||||
| $ | % | |||||||||||||||||||||||
| (in thousands, except percentages) | ||||||||||||||||||||||||
| Other Income, Net |
$ | 424 | 0 | % | $ | 1,052 | 1 | % | $ | (628 | ) | -59.7 | % | |||||||||||
|
|
|
|
|
|
|
|
|
|
|
|
|
|||||||||||||
The decrease in other income, net, in fiscal 2010 compared to fiscal 2009 principally reflected the $1.1 million gain we recorded in connection with the extinguishment of $20.5 million aggregate principal amount of our 3.75% convertible senior notes for cash of $17.3 million in fiscal 2009. See Note 6 to our consolidated financial statements for additional information on the adoption of ASC 470-20. This decrease in other income, net, was partially offset by approximately $430,000 in net foreign exchange gains recorded in fiscal 2010 compared to net foreign exchange loss of $217,000 in fiscal 2009.
40
Provision for Income Taxes
The following tables present provision for income taxes for fiscal 2011 compared to fiscal 2010 and fiscal 2010 compared to fiscal 2009:
| Year Ended | ||||||||||||||||||||||||
| September
30, 2011 |
% of
Net Revenue |
October
1, 2010 |
% of
Net Revenue |
Change | ||||||||||||||||||||
| $ | % | |||||||||||||||||||||||
| (in thousands, except percentages) | ||||||||||||||||||||||||
| Provision for income taxes |
$ | 241 | 0 | % | $ | 406 | 0 | % | $ | (165 | ) | -40.6 | % | |||||||||||
|
|
|
|
|
|
|
|
|
|
|
|
|
|||||||||||||
| Year Ended | ||||||||||||||||||||||||
| October
1, 2010 |
% of
Net Revenue |
October
2, 2009 |
% of
Net Revenue |
Change | ||||||||||||||||||||
| $ | % | |||||||||||||||||||||||
| (in thousands, except percentages) | ||||||||||||||||||||||||
| Provision for income taxes |
$ | 406 | 0 | % | $ | 482 | 0 | % | $ | (76 | ) | -15.8 | % | |||||||||||
|
|
|
|
|
|
|
|
|
|
|
|
|
|||||||||||||
Our provision for income taxes for fiscal 2011 and 2009 principally consisted of income taxes incurred by our foreign subsidiaries. Our provision for income taxes for fiscal 2010 principally consisted of income tax due on operating income generated in the U.S. A substantial portion of this operating income was offset by previously generated net operating losses, thereby reducing the effective tax rate on U.S. earnings.
As of September 30, 2011, we had a valuation allowance of $249.1 million against our U.S. federal and state deferred tax assets (which reduces their carrying value to zero) because we continue to believe that it is unlikely that we will realize these deferred tax assets through the reduction of future income tax payments. We have considered both positive and negative evidence in reaching this determination and placed considerable weight upon the cumulative losses over the past three year period. As of September 30, 2011, we had U.S. federal net operating loss carryforwards of approximately $629.4 million, including the net operating loss carryforwards we retained in the distribution. We can provide no assurances that we will be able to retain or fully utilize such net operating loss carryforwards, or that such net operating loss carryforwards will not be significantly limited in the future.
Liquidity and Capital Resources
Our principal sources of liquidity are our existing cash and cash equivalent balances and cash generated from product sales.
In order to achieve and sustain profitability and sustain positive cash flows from operations, we may need to further reduce operating expenses and/or increase revenue. We have completed a series of cost reduction actions, which have improved our operating expense structure, and we will continue to perform additional actions, if necessary. In addition, we may commit to additional restructurings to help implement strategic initiatives. These restructurings and other cost saving measures alone may not allow us to achieve and sustain profitability. Our ability to maintain, or increase, current revenue levels to achieve and sustain profitability will depend on demand for network infrastructure equipment that incorporates our products, which in turn depends primarily on the level of capital spending by communications service providers and enterprises, the level of which may decrease due to general economic conditions, and uncertainty, over which we have no control. We may be unable to maintain, or increase current revenue levels or sustain past and future expense reductions in subsequent periods. We may not be able to achieve and sustain profitability.
We believe that our existing cash balances, along with cash expected to be generated from product sales, will be sufficient to fund our operations, research and development efforts, anticipated capital expenditures, working capital and other financing requirements, including interest payments on debt obligations, for the next 12 months. In November 2009, we repaid the $10.5 million outstanding balance of our 3.75% senior convertible notes, and we have no other principal payments on currently outstanding debt due in the next 12 months. From time to time, we may acquire our debt securities through privately negotiated transactions, tender offers, exchange offers (for new debt or other securities), redemptions or otherwise, upon such terms and at such prices
41
as we may determine appropriate. We will need to continue a focused program of capital expenditures to meet our research and development and corporate requirements. We may also consider acquisition opportunities to extend our technology portfolio and design expertise and to expand our product offerings. In order to fund capital expenditures, increase our working capital or complete any acquisitions, we may seek to obtain additional debt or equity financing. We may also need to seek to obtain additional debt or equity financing if we experience downturns or cyclical fluctuations in our business that are more severe or longer than anticipated or if we fail to achieve anticipated revenue and expense levels. However, we cannot assure you that such financing will be available to us on favorable terms, or at all, particularly in light of recent economic conditions in the capital markets.
The following tables present details of our working capital and cash and cash equivalents:
| Year Ended | ||||||||||||||||
| September
30, 2011 |
October
1, 2010 |
Change | ||||||||||||||
| $ | % | |||||||||||||||
| (in thousands, except percentages) | ||||||||||||||||
| Working capital |
$ | 50,346 | $ | 53,762 | $ | (3,416 | ) | -6.4 | % | |||||||
|
|
|
|
|
|
|
|
|
|||||||||
| Cash and cash equivalents |
$ | 45,227 | $ | 43,685 | $ | 1,542 | 3.5 | % | ||||||||
|
|
|
|
|
|
|
|
|
|||||||||
| Year Ended | ||||||||||||||||
| October
1, 2010 |
October
2, 2009 |
Change | ||||||||||||||
| $ | % | |||||||||||||||
| (in thousands, except percentages) | ||||||||||||||||
| Working capital |
$ | 53,762 | $ | 14,223 | $ | 39,539 | 278.0 | % | ||||||||
|
|
|
|
|
|
|
|
|
|||||||||
| Cash and cash equivalents |
$ | 43,685 | $ | 20,891 | $ | 22,794 | 109.1 | % | ||||||||
|
|
|
|
|
|
|
|
|
|||||||||
Cash and cash equivalents increased as a result of cash provided by operating activities and financing activities, which was mostly offset by cash used in investing activities.
The following table presents the major components of the consolidated statements of cash flows:
| Year Ended | ||||||||||||
| September 30, 2011 |
October 1, 2010 |
October 2, 2009 |
||||||||||
| (in thousands) | ||||||||||||
| Net cash provided by/(used in): |
||||||||||||
| Net (loss)/income |
$ | (755 | ) | $ | 21,070 | $ | (25,114 | ) | ||||
| Non-cash operating expenses, net |
16,486 | 14,667 | 19,483 | |||||||||
| Changes in assets and liabilities: |
||||||||||||
| Receivables |
12,263 | (17,986 | ) | 6,903 | ||||||||
| Inventories |
(5,179 | ) | (800 | ) | 4,628 | |||||||
| Other assets, net |
1,600 | (538 | ) | 438 | ||||||||
| Accounts payable |
(3,533 | ) | 1,430 | (5,069 | ) | |||||||
| Deferred income on sales to distributors |
147 | 2,595 | (2,265 | ) | ||||||||
| Restructuring charges |
(809 | ) | (1,283 | ) | (3,391 | ) | ||||||
| Accrued compensation and benefits |
(2,082 | ) | 3,596 | (1,092 | ) | |||||||
| Accrued expenses and other current liabilities |
(346 | ) | 1,489 | (287 | ) | |||||||
| Other liabilities, net |
377 | (406 | ) | 381 | ||||||||
|
|
|
|
|
|
|
|||||||
| Net cash provided by/(used in) operating activities |
18,169 | 23,834 | (5,385 | ) | ||||||||
| Net cash used in investing activities |
(18,548 | ) | (8,027 | ) | (8,058 | ) | ||||||
| Net cash provided by/(used in) financing activities |
2,017 | 6,960 | (8,629 | ) | ||||||||
| Effect of foreign currency exchange rates on cash |
(96 | ) | 27 | (70 | ) | |||||||
|
|
|
|
|
|
|
|||||||
| Net increase/(decrease) in cash and cash equivalents |
$ | 1,542 | $ | 22,794 | $ | (22,142 | ) | |||||
|
|
|
|
|
|
|
|||||||
42
Operating Activities
Operating activities provided cash for fiscal 2011 due to net non-cash operating expenses and net cash provided by changes in operating assets and liabilities, which were partially offset by our net loss. Significant non-cash operating expenses included stock-based compensation expense, depreciation and amortization and amortization of licensed and purchased intangibles. The changes in operating assets and liabilities that had a significant impact on cash provided by operating activities included a significant decrease in receivables due to the timing of product shipments and cash receipts. Our net days sales outstanding decreased from 41 days in the fourth quarter of fiscal 2010 to 30 days in the fourth quarter of fiscal 2011. This cash inflow was partially offset by outflows resulting from an increase in inventories resulting from an acceleration of our ordering of certain raw materials in an effort to ensure supply on these items in light of the impact that the Japan natural disasters could have had on production, a decrease in accrued compensation and benefits mainly due to the fiscal 2010 management bonus that was paid in early fiscal 2011 and a decrease in accounts payable due to reduced levels of inventory purchases and the timing of vendor payments.
Operating activities provided cash for fiscal 2010 due to net income and net non-cash operating expenses, offset by net cash used by changes in operating assets and liabilities. Significant non-cash operating expenses included depreciation and amortization, stock-based compensation, restructuring charges, inventory provisions and amortization of licensed and purchased intangibles. The changes in operating assets and liabilities that had a significant impact on cash provided by operating activities included an increase in accounts receivable, which was partially offset due to various factors, including an increase in sales volume in fiscal 2010 compared to fiscal 2009, the timing of sales and the timing of collections. Our net days sales outstanding increased from 20 days in the fourth quarter of fiscal 2009 to 41 days in the fourth quarter of fiscal 2010. In addition, restructuring related payments made during fiscal 2010 were significantly lower than payments made in fiscal 2009. Partially offsetting the increase in accounts receivable and decrease in restructuring related payments was an increase in accrued expenses and other current liabilities, due to our fiscal 2010 management bonus accrual, as well as the timing of vendor payments. In addition, deferred income on shipments to distributors increased due to an increase in inventory being held by our distributors.
Operating activities used cash for fiscal 2009 due to net loss and net non-cash operating expenses. Significant non-cash operating expenses, which included depreciation and amortization, asset impairments, restructuring charges, stock-based compensation and amortization of debt discount on convertible debt, were partially offset by a gain on debt retirement. The changes in operating assets and liabilities that had a significant impact on cash used in operating activities included a decrease in accounts receivable, which was due to both the timing of sales and the timing of collections. Our net days sales outstanding decreased from 36 days in the fourth quarter of fiscal 2008 to 20 days in the fourth quarter of fiscal 2009. In addition, our inventory balance decreased during 2009 due to our focused efforts in decreasing our inventory on hand and increasing our inventory turns. Mostly offsetting the decrease in accounts receivable and inventory was a decrease in accounts payable, due to reduced levels of inventory purchases and the timing of vendor payments. In addition, deferred income on shipments to distributors decreased because of a decrease in inventory being held by our distributors.
Investing Activities
Investing activities used cash for fiscal 2011 due to the purchase of property, plant and equipment of $8.0 million and payments under licensed and purchased intangibles of $10.4 million.
Investing activities used cash for fiscal 2010 due to the purchase of property, plant and equipment of $6.2 million and payments under licensed and purchased intangibles of $1.8 million.
Investing activities used cash for fiscal 2009 due to the purchase of property, plant and equipment of $4.6 million and payments under licensed and purchased intangibles of $3.5 million.
43
Financing Activities
Financing activities provided cash for fiscal 2011 due to $2.9 million in proceeds from equity compensation programs, partially offset by $415,000 in payments made related to shares of our common stock withheld from, or delivered by, employees in order to satisfy applicable tax withholding obligations in connection with the vesting of restricted stock and $482,000 in payments made on capital lease obligations.
Financing activities provided cash for fiscal 2010 due primarily to three significant items. In the first quarter of fiscal 2010, we used cash when we paid $10.5 million to retire the remaining principal amount of our 3.75% convertible senior notes, which matured in November 2009. Offsetting this use of cash was $17.0 million in net proceeds we received from the sale of approximately 2.5 million shares of our common stock in an offering that was completed in the second quarter of fiscal 2010. We also generated cash from financing activities of $1.6 million in proceeds received in conjunction with the exercise of stock options in fiscal 2010.
Financing activities used cash in fiscal 2009 due to $17.3 million paid in the first quarter of fiscal 2009 to retire $20.5 million in principal amount of our 3.75% convertible senior notes due in November 2009 and to approximately $300,000 of debt issuance costs related to both our revolving credit facility and the issuance of our 6.50% convertible senior notes due in 2013. Partially offsetting these uses of cash was $8.9 million in net proceeds we received from the sale of 4.8 million shares of our common stock in an offering that was completed in the fourth quarter of fiscal 2009.
Convertible Senior Notes
3.75% Convertible Senior Notes due 2009
In December 2004, we sold an aggregate principal amount of $46.0 million in 3.75% convertible senior notes due in November 2009 for net proceeds (after discounts and commissions) of approximately $43.9 million. Through the end of fiscal 2009, we repurchased or exchanged $35.5 million of aggregate principal amount of this debt. During the first quarter of fiscal 2010, our 3.75% convertible senior notes matured and the remaining balance of $10.5 million was repaid.
6.50% Convertible Senior Notes due 2013
We issued the convertible senior notes due in August 2013 pursuant to an indenture, dated as of August 1, 2008, between us and Wells Fargo Bank, N.A., as trustee.
The convertible senior notes are unsecured senior indebtedness and bear interest at a rate of 6.50% per annum. Interest is payable on February 1 and August 1 of each year, commencing on February 1, 2009. The notes mature on August 1, 2013. At maturity, we will be required to repay the outstanding principal amount of the notes. At September 30, 2011, $15.0 million in aggregate principal amount of our 6.50% convertible senior notes were outstanding.
The 6.50% convertible senior notes are convertible at the option of the holders, at any time on or prior to maturity, into shares of our common stock at a conversion rate equal to approximately $4.74 per share of common stock, which is subject to adjustment in certain circumstances. Upon conversion of the notes, we generally have the right to deliver to the holders thereof, at our option: (i) cash; (ii) shares of our common stock; or (iii) a combination thereof. The initial conversion price of the notes will be adjusted to reflect stock dividends, stock splits, issuances of rights to purchase shares of our common stock, and upon other events. If we undergo certain fundamental changes prior to maturity of the notes, the holders thereof will have the right, at their option, to require us to repurchase for cash some or all of their 6.50% convertible senior notes at a repurchase price equal to 100% of the principal amount of the notes being repurchased, plus accrued and unpaid interest (including additional interest, if any) to, but not including, the repurchase date, or convert the notes into shares of our common stock and, under certain circumstances, receive additional shares of our common stock in the amount provided in the indenture.
44
For financial accounting purposes, our contingent obligation to issue additional shares or make additional cash payment upon conversion following a fundamental change is an “embedded derivative.” At September 30, 2011, the liability under the fundamental change adjustment has been recorded at its estimated fair value and is not significant.
If there is an event of default under the 6.50% convertible senior notes, the principal of and premium, if any, on all the notes and the interest accrued thereon may be declared immediately due and payable, subject to certain conditions set forth in the indenture. An event of default under the indenture will occur if we: (i) are delinquent in making certain payments due under the notes; (ii) fail to deliver shares of common stock or cash upon conversion of the notes; (iii) fail to deliver certain required notices under the notes; (iv) fail, following notice, to cure a breach of a covenant under the notes or the indenture; (v) incur certain events of default with respect to other indebtedness; or (vi) are subject to certain bankruptcy proceedings or orders. If we fail to deliver certain SEC reports to the trustee in a timely manner as required by the indenture: (x) the interest rate applicable to the notes during the delinquency will be increased by 0.25% or 0.50%, as applicable (depending on the duration of the delinquency); and (y) if the required reports are not delivered to the trustee within 180 days after their due date under the indenture, a holder of the notes will generally have the right, subject to certain limitations, to require us to repurchase all or any portion of the notes then held by such holder.
Our adoption of ASC 470-20 changed the accounting for these 6.50% convertible senior notes and the related deferred financing costs. Prior to the issuance of this accounting standard, we reported the notes at their principal amount of $15.0 million in long-term debt and capitalized debt issuance costs amounting to approximately $900,000. Upon adoption of ASC 470-20, we adjusted the accounting for the 6.50% convertible senior notes and the deferred financing costs for all prior periods since initial issuance of the debt in August 2008. We recorded a discount on the convertible senior notes in the amount of $2.0 million as of the date of issuance, which will be amortized over the five year period from August 2008 through August 2013. See Note 6 to our consolidated financial statements for further information on this adoption.
Contractual Obligations
The following table summarizes the future payments we are required to make under contractual obligations as of September 30, 2011:
| Payments Due by Period | ||||||||||||||||||||
| Contractual Obligations |
Total | <1 Year | 1-3 Years | 3-5 Years | >5 Years | |||||||||||||||
| (in thousands) | ||||||||||||||||||||
| Long-term debt |
$ | 15,000 | $ | — | $ | 15,000 | $ | — | $ | — | ||||||||||
| Interest expense on long-term debt |
1,950 | 975 | 975 | — | — | |||||||||||||||
| Operating leases |
10,203 | 4,365 | 3,855 | 1,992 | — | |||||||||||||||
| Purchase obligations |
15,026 | 13,834 | 1,192 | — | — | |||||||||||||||
| Employee severance |
989 | 989 | — | — | — | |||||||||||||||
| Capital leases |
570 | 459 | 111 | — | — | |||||||||||||||
| FIN 48 liability |
577 | 76 | 96 | — | 405 | |||||||||||||||
|
|
|
|
|
|
|
|
|
|
|
|||||||||||
| Total |
$ | 44,315 | $ | 20,689 | $ | 21,229 | $ | 1,992 | $ | 405 | ||||||||||
|
|
|
|
|
|
|
|
|
|
|
|||||||||||
Long-term debt consists of $15.0 million of convertible senior notes that bear interest at a rate of 6.50%, payable semiannually in arrears each February 1 and August 1, and mature on August 1, 2013.
In March 2010, we entered into a lease agreement with the owner of our headquarters in Newport Beach, California with a term beginning in June 2010 and extending through December 2012. We may, at our option, extend the lease for an additional five-year term. Rent payable under the lease is approximately $2.1 million annually, including operating expenses associated with the leased property. We estimate our minimum future obligation under the lease at approximately $2.7 million over the remaining lease term.
We lease our other facilities and certain equipment under non-cancelable operating leases. The leases expire at various dates through fiscal 2016 and contain various provisions for rental adjustments, including, in certain cases, adjustments based on increases in the Consumer Price Index. The leases generally contain renewal
45
provisions for varying periods of time. Although we have entered into non-cancelable subleases with anticipated rental income totaling $11,000 and extending to various dates through fiscal 2013, we have not reduced the amount of our contractual obligations under the related operating leases to take into account the anticipated rental income.
Purchase obligations are comprised of commitments to purchase design tools and software for use in product development, which will be spent through fiscal 2013. We have not included open purchase orders for inventory or other expenses issued in the normal course of business in the purchase obligations shown above.
Capital leases consist of equipment purchased under capital lease with payments due through May 2013.
In addition to the obligations included in the table above, we have a $960,000 liability related to post-retirement benefits for employees at four of our international locations. The timing of the related payments is not known.
Off-Balance Sheet Arrangements
We have made guarantees and indemnities, under which we may be required to make payments to a guaranteed or indemnified party, in relation to certain transactions. In connection with the distribution to Conexant stockholders of all outstanding shares of common stock of Mindspeed, we generally assumed responsibility for all contingent liabilities and then-current and future litigation against Conexant or its subsidiaries related to our business. In connection with certain facility leases, we have indemnified our lessors for certain claims arising from the facility or the lease. We indemnify our directors and officers to the maximum extent permitted under the laws of the State of Delaware. The duration of the guarantees and indemnities varies, and in many cases is indefinite. The majority of our guarantees and indemnities do not provide for any limitation of the maximum potential future payments we could be obligated to make. We have not recorded any liability for these guarantees and indemnities in the accompanying consolidated balance sheets.
| Item 7A. | Quantitative and Qualitative Disclosures About Market Risk |
We do not use derivative instruments for speculative or investment purposes.
Interest Rate Risk
Our cash and cash equivalents are not subject to significant interest rate risk. As of September 30, 2011, the carrying value of our cash and cash equivalents approximated fair value.
At September 30, 2011, our debt consisted of long-term convertible senior notes. Our convertible senior notes bear interest at a fixed rate of 6.50%. Consequently, our results of operations and cash flows are not subject to any significant interest rate risk relating to our convertible senior notes. The fair value of the debt could increase or decrease if interest rates decreases or increase, respectively, and that could impact our ability and cost to negotiate a settlement of such notes prior to maturity.
Foreign Exchange Risk
We transact business in various foreign currencies and we face foreign exchange risk on assets and liabilities that are denominated in foreign currencies. Currently, our foreign exchange risks are not hedged; however, from time to time, we may utilize foreign currency forward exchange contracts to hedge a portion of our exposure to foreign exchange risk.
These hedging transactions are intended to offset the gains and losses we experience on foreign currency transactions with gains and losses on the forward contracts, so as to mitigate our overall risk of foreign exchange gains and losses. We do not enter into forward contracts for speculative or trading purposes. At September 30, 2011, we held no foreign currency forward exchange contracts. Based on our overall currency rate exposure at September 30, 2011, a 10% change in currency rates would not have a material effect on our consolidated financial position, results of operations or cash flows.
46
| Item 8. | Financial Statements and Supplementary Data |
MINDSPEED TECHNOLOGIES, INC.
CONSOLIDATED BALANCE SHEETS
(in thousands, except par value)
| September 30, 2011 |
October 1, 2010 |
|||||||
| ASSETS | ||||||||
| Current Assets |
||||||||
| Cash and cash equivalents |
$ | 45,227 | $ | 43,685 | ||||
| Receivables, net of allowance for doubtful accounts of $376 at September 30, 2011 and $189 at October 1, 2010 |
13,393 | 25,678 | ||||||
| Inventories |
14,216 | 10,205 | ||||||
| Deferred tax assets, net |
— | 2,264 | ||||||
| Prepaid expenses and other current assets |
3,067 | 3,035 | ||||||
|
|
|
|
|
|||||
| Total current assets |
75,903 | 84,867 | ||||||
| Property, plant and equipment, net |
15,369 | 12,700 | ||||||
| Licensed and purchased intangibles, net |
17,357 | 9,887 | ||||||
| Other assets |
1,982 | 1,230 | ||||||
|
|
|
|
|
|||||
| Total assets |
$ | 110,611 | $ | 108,684 | ||||
|
|
|
|
|
|||||
| LIABILITIES AND STOCKHOLDERS’ EQUITY | ||||||||
| Current Liabilities |
||||||||
| Accounts payable |
$ | 5,532 | $ | 9,303 | ||||
| Accrued compensation and benefits |
7,292 | 9,336 | ||||||
| Accrued income taxes |
690 | 1,503 | ||||||
| Deferred income on sales to distributors |
5,346 | 5,199 | ||||||
| Deferred revenue |
653 | 658 | ||||||
| Restructuring |
944 | 710 | ||||||
| Other current liabilities |
5,100 | 4,396 | ||||||
|
|
|
|
|
|||||
| Total current liabilities |
25,557 | 31,105 | ||||||
| Convertible senior notes — long term |
14,216 | 13,810 | ||||||
| Other liabilities |
1,426 | 2,133 | ||||||
|
|
|
|
|
|||||
| Total liabilities |
41,199 | 47,048 | ||||||
|
|
|
|
|
|||||
| Commitments, contingencies and guarantees (Notes 7, 8 and 9) |
— | — | ||||||
| Stockholders’ Equity |
||||||||
| Preferred stock, $0.01 par value: 25,000 shares authorized; no shares issued or outstanding |
— | — | ||||||
| Common stock, $0.01 par value, 100,000 shares authorized; 34,515 (September 30, 2011) and 32,220 (October 1, 2010) issued and outstanding shares |
345 | 322 | ||||||
| Additional paid-in capital |
326,863 | 318,468 | ||||||
| Accumulated deficit |
(257,756 | ) | (257,001 | ) | ||||
| Accumulated other comprehensive loss |
(40 | ) | (153 | ) | ||||
|
|
|
|
|
|||||
| Total stockholders’ equity |
69,412 | 61,636 | ||||||
|
|
|
|
|
|||||
| Total liabilities and stockholders’ equity |
$ | 110,611 | $ | 108,684 | ||||
|
|
|
|
|
|||||
See accompanying notes to consolidated financial statements.
47
MINDSPEED TECHNOLOGIES, INC.
CONSOLIDATED STATEMENTS OF OPERATIONS
(in thousands, except per share amounts)
| September 30, 2011 |
October 1, 2010 |
October 2, 2009 |
||||||||||
| Net revenue: |
||||||||||||
| Products |
$ | 159,589 | $ | 165,379 | $ | 121,552 | ||||||
| Intellectual property |
2,500 | 12,800 | 5,000 | |||||||||
|
|
|
|
|
|
|
|||||||
| Total net revenue |
162,089 | 178,179 | 126,552 | |||||||||
| Cost of goods sold |
60,292 | 59,840 | 49,981 | |||||||||
|
|
|
|
|
|
|
|||||||
| Gross margin |
101,797 | 118,339 | 76,571 | |||||||||
|
|
|
|
|
|
|
|||||||
| Operating expenses: |
||||||||||||
| Research and development |
59,174 | 51,367 | 50,650 | |||||||||
| Selling, general and administrative |
42,118 | 41,419 | 41,582 | |||||||||
| Special charges |
1,032 | 2,684 | 6,896 | |||||||||
|
|
|
|
|
|
|
|||||||
| Total operating expenses |
102,324 | 95,470 | 99,128 | |||||||||
|
|
|
|
|
|
|
|||||||
| Operating (loss)/income |
(527 | ) | 22,869 | (22,557 | ) | |||||||
| Interest expense |
(1,595 | ) | (1,817 | ) | (3,127 | ) | ||||||
| Other income, net |
1,608 | 424 | 1,052 | |||||||||
|
|
|
|
|
|
|
|||||||
| (Loss)/income before income taxes |
(514 | ) | 21,476 | (24,632 | ) | |||||||
| Provision for income taxes |
241 | 406 | 482 | |||||||||
|
|
|
|
|
|
|
|||||||
| Net (loss)/income |
$ | (755 | ) | $ | 21,070 | $ | (25,114 | ) | ||||
|
|
|
|
|
|
|
|||||||
| Net (loss)/income per share: |
||||||||||||
| Basic |
$ | (0.02 | ) | $ | 0.70 | $ | (1.04 | ) | ||||
| Diluted |
$ | (0.02 | ) | $ | 0.65 | $ | (1.04 | ) | ||||
| Weighted-average number of shares used in per share computation: |
||||||||||||
| Basic |
32,279 | 30,260 | 24,156 | |||||||||
| Diluted |
32,279 | 34,579 | 24,156 | |||||||||
See accompanying notes to consolidated financial statements.
48
MINDSPEED TECHNOLOGIES, INC.
CONSOLIDATED STATEMENTS OF CASH FLOWS
(in thousands)
| September 30, 2011 |
October 1, 2010 |
October 2, 2009 |
||||||||||
| Cash Flows From Operating Activities |
||||||||||||
| Net (loss)/income |
$ | (755 | ) | $ | 21,070 | $ | (25,114 | ) | ||||
| Adjustments required to reconcile net (loss)/ income to net cash provided by operating activities: |
||||||||||||
| Depreciation and amortization |
5,423 | 4,796 | 5,219 | |||||||||
| Amortization of license agreements |
2,303 | 1,497 | 887 | |||||||||
| Asset impairments |
— | 828 | 5,498 | |||||||||
| Restructuring charges |
1,032 | 1,856 | 4,031 | |||||||||
| Stock-based compensation |
5,919 | 4,239 | 2,675 | |||||||||
| Provision for bad debts |
187 | 45 | (11 | ) | ||||||||
| Inventory provision |
1,168 | 1,497 | 657 | |||||||||
| Deferred income tax |
44 | (847 | ) | — | ||||||||
| Gain on debt retirement |
— | — | (1,121 | ) | ||||||||
| Amortization of debt discount on convertible debt |
245 | 546 | 1,463 | |||||||||
| Other non-cash items, net |
165 | 210 | 185 | |||||||||
| Changes in assets and liabilities: |
||||||||||||
| Receivables |
12,263 | (17,986 | ) | 6,903 | ||||||||
| Inventories |
(5,179 | ) | (800 | ) | 4,628 | |||||||
| Other assets, net |
1,600 | (538 | ) | 438 | ||||||||
| Accounts payable |
(3,533 | ) | 1,430 | (5,069 | ) | |||||||
| Deferred income on sales to distributors |
147 | 2,595 | (2,265 | ) | ||||||||
| Restructuring charges |
(809 | ) | (1,283 | ) | (3,391 | ) | ||||||
| Accrued compensation and benefits |
(2,082 | ) | 3,596 | (1,092 | ) | |||||||
| Accrued expenses and other current liabilities |
(346 | ) | 1,489 | (287 | ) | |||||||
| Other liabilities, net |
377 | (406 | ) | 381 | ||||||||
|
|
|
|
|
|
|
|||||||
| Net cash provided by/(used in) operating activities |
18,169 | 23,834 | (5,385 | ) | ||||||||
|
|
|
|
|
|
|
|||||||
| Cash Flows From Investing Activities |
||||||||||||
| Purchases of property, plant and equipment |
(8,008 | ) | (6,179 | ) | (4,583 | ) | ||||||
| Payments under license agreements |
(10,440 | ) | (1,848 | ) | (3,475 | ) | ||||||
| Net cash paid for acquired companies |
(100 | ) | — | — | ||||||||
|
|
|
|
|
|
|
|||||||
| Net cash used in investing activities |
(18,548 | ) | (8,027 | ) | (8,058 | ) | ||||||
|
|
|
|
|
|
|
|||||||
| Cash Flows From Financing Activities |
||||||||||||
| Gross proceeds from sale of equity |
— | 18,300 | 9,738 | |||||||||
| Offering costs from sale of equity |
— | (1,307 | ) | (791 | ) | |||||||
| Extinguishment of convertible debt |
— | (10,500 | ) | (17,320 | ) | |||||||
| Payments made on capital lease obligations |
(482 | ) | (470 | ) | — | |||||||
| Borrowings under line of credit |
— | 7,000 | — | |||||||||
| Payments made on borrowings under line of credit |
— | (7,000 | ) | — | ||||||||
| Debt issuance costs |
— | — | (256 | ) | ||||||||
| Repurchase of restricted stock for income tax withholding |
(415 | ) | (627 | ) | — | |||||||
| Proceeds from equity compensation programs |
2,914 | 1,564 | — | |||||||||
|
|
|
|
|
|
|
|||||||
| Net cash provided by/(used in) financing activities |
2,017 | 6,960 | (8,629 | ) | ||||||||
|
|
|
|
|
|
|
|||||||
| Effect of foreign currency exchange rates on cash |
(96 | ) | 27 | (70 | ) | |||||||
|
|
|
|
|
|
|
|||||||
| Net increase/(decrease) in cash and cash equivalents |
1,542 | 22,794 | (22,142 | ) | ||||||||
| Cash and cash equivalents at beginning of period |
43,685 | 20,891 | 43,033 | |||||||||
|
|
|
|
|
|
|
|||||||
| Cash and cash equivalents at end of period |
$ | 45,227 | $ | 43,685 | $ | 20,891 | ||||||
|
|
|
|
|
|
|
|||||||
See accompanying notes to consolidated financial statements.
49
MINDSPEED TECHNOLOGIES, INC.
CONSOLIDATED STATEMENTS OF STOCKHOLDERS’ EQUITY AND
COMPREHENSIVE (LOSS)/GAIN
(in thousands)
| Common Stock | Additional Paid-in Capital |
Accumulated Deficit |
Accumulated Other Comprehensive (Loss)/Gain |
Total Shareholders’ Equity |
||||||||||||||||||||
| Shares | Amount | |||||||||||||||||||||||
| Balance at October 3, 2008 |
23,852 | 239 | 284,901 | (252,957 | ) | 483 | 32,666 | |||||||||||||||||
| Net loss |
— | — | — | (25,114 | ) | — | (25,114 | ) | ||||||||||||||||
| Currency translation adjustments |
— | — | — | — | (143 | ) | (143 | ) | ||||||||||||||||
|
|
|
|||||||||||||||||||||||
| Comprehensive loss |
(25,257 | ) | ||||||||||||||||||||||
| Sale of equity, net of offering costs |
4,750 | 47 | 8,806 | — | — | 8,853 | ||||||||||||||||||
| Issuance of common stock from the exercise of stock options |
195 | 2 | (1 | ) | — | — | 1 | |||||||||||||||||
| Common stock repurchased and retired |
(41 | ) | — | (49 | ) | — | — | (49 | ) | |||||||||||||||
| Compensation expense related to employee stock plans |
— | — | 2,676 | — | — | 2,676 | ||||||||||||||||||
|
|
|
|
|
|
|
|
|
|
|
|
|
|||||||||||||
| Balance at October 2, 2009 |
28,756 | 288 | 296,333 | (278,071 | ) | 340 | 18,890 | |||||||||||||||||
| Net income |
— | — | — | 21,070 | — | 21,070 | ||||||||||||||||||
| Currency translation adjustments |
— | — | — | — | (493 | ) | (493 | ) | ||||||||||||||||
|
|
|
|||||||||||||||||||||||
| Comprehensive income |
20,577 | |||||||||||||||||||||||
| Sale of equity, net of offering costs |
2,524 | 25 | 16,968 | — | — | 16,993 | ||||||||||||||||||
| Issuance of common stock from the exercise of stock options |
1,024 | 10 | 1,554 | — | — | 1,564 | ||||||||||||||||||
| Common stock repurchased and retired |
(84 | ) | (1 | ) | (626 | ) | — | — | (627 | ) | ||||||||||||||
| Compensation expense related to employee stock plans |
— | — | 4,239 | — | — | 4,239 | ||||||||||||||||||
|
|
|
|
|
|
|
|
|
|
|
|
|
|||||||||||||
| Balance at October 1, 2010 |
32,220 | 322 | 318,468 | (257,001 | ) | (153 | ) | 61,636 | ||||||||||||||||
| Net loss |
— | — | — | (755 | ) | — | (755 | ) | ||||||||||||||||
| Currency translation adjustments |
— | — | — | — | 113 | 113 | ||||||||||||||||||
|
|
|
|||||||||||||||||||||||
| Comprehensive loss |
— | — | — | — | — | (642 | ) | |||||||||||||||||
| Issuance of common stock from the exercise of stock options |
2,356 | 23 | 2,891 | — | — | 2,914 | ||||||||||||||||||
| Common stock repurchased and retired |
(61 | ) | — | (415 | ) | — | — | (415 | ) | |||||||||||||||
| Compensation expense related to employee stock plans |
— | — | 5,919 | — | — | 5,919 | ||||||||||||||||||
|
|
|
|
|
|
|
|
|
|
|
|
|
|||||||||||||
| Balance at September 30, 2011 |
34,515 | 345 | 326,863 | (257,756 | ) | (40 | ) | 69,412 | ||||||||||||||||
|
|
|
|
|
|
|
|
|
|
|
|
|
|||||||||||||
See accompanying notes to consolidated financial statements.
50
MINDSPEED TECHNOLOGIES, INC.
NOTES TO CONSOLIDATED FINANCIAL STATEMENTS
1. The Company
Mindspeed Technologies, Inc. (Mindspeed or the Company) designs, develops and sells semiconductor solutions for communications applications in the wireline and wireless network infrastructure, which includes enterprise networks, broadband access networks (fixed and mobile) and metropolitan and wide area networks. On June 27, 2003, Conexant Systems, Inc. (Conexant) completed the distribution (the Distribution) to Conexant stockholders of all 18,066,689 outstanding shares of common stock of its wholly owned subsidiary, Mindspeed. Prior to the Distribution, Conexant transferred to Mindspeed the assets and liabilities of the Mindspeed business, including the stock of certain subsidiaries, and certain other assets and liabilities which were allocated to Mindspeed under the Distribution Agreement entered into between Conexant and Mindspeed. Also prior to the Distribution, Conexant contributed to Mindspeed cash in an amount such that at the time of the distribution Mindspeed’s cash balance was $100.0 million. Mindspeed issued to Conexant a warrant to purchase approximately 6.1 million shares of Mindspeed common stock at a price of $16.74 per share, as adjusted, exercisable for a period beginning one year and ending ten years after the Distribution. Following the Distribution, Mindspeed began operations as an independent, publicly held company.
2. Summary of Significant Accounting Policies
Basis of Presentation — The consolidated financial statements, prepared in accordance with generally accepted accounting principles in the United States of America, include the accounts of Mindspeed and each of its subsidiaries. All intercompany accounts and transactions among Mindspeed and its subsidiaries have been eliminated in consolidation.
Fiscal Periods — The Company maintains a fifty-two/fifty-three week fiscal year ending on the Friday closest to September 30. Fiscal year 2011 comprised 52 weeks and ended on September 30, 2011. Fiscal year 2010 comprised 52 weeks and ended on October 1, 2010. Fiscal year 2009 comprised 52 weeks and ended on October 2, 2009.
Use of Estimates — The preparation of financial statements in conformity with generally accepted accounting principles requires management to make estimates and assumptions that affect the reported amounts of assets and liabilities and disclosure of contingent assets and liabilities at the date of the financial statements and the reported amounts of revenue and expenses during the reporting period. Among the significant estimates affecting the Company’s consolidated financial statements are those relating to revenue recognition, inventories, allowances for doubtful accounts, impairment of long-lived assets, stock-based compensation and income taxes. Management regularly evaluates its estimates and assumptions based upon historical experience and various other factors that the Company believes to be reasonable under the circumstances, the results of which form the basis for making judgments about the carrying values of assets and liabilities that are not readily apparent from other sources. To the extent actual results differ from those estimates, the Company’s future results of operations may be affected.
Revenue Recognition — The Company generates revenue from direct product sales, sales to distributors, maintenance contracts, development agreements and the sale and license of intellectual property. The Company recognizes revenue when the following fundamental criteria are met: (i) persuasive evidence of an arrangement exists; (ii) delivery has occurred; (iii) the price to the customer is fixed or determinable; and (iv) collection of the sales price is reasonably assured. In instances where final acceptance of the product, system or solution is specified by the customer, revenue is deferred until all acceptance criteria have been met. Technical support services revenue is deferred and recognized ratably over the period during which the services are to be performed. Advanced services revenue is recognized upon delivery or completion of performance.
Revenue is recognized on products shipped directly to customers at the time the products are shipped and title and risk of loss transfer to the customer, in accordance with the terms specified in the arrangement, and the four above mentioned revenue recognition criteria are met.
51
MINDSPEED TECHNOLOGIES, INC.
NOTES TO CONSOLIDATED FINANCIAL STATEMENTS — (Continued)
Revenue is recognized on sales to distributors based on the rights granted to these distributors in the distribution agreements. The Company has certain distributors who have been granted return rights and receive credits for changes in selling prices to end customers, the magnitude of which is not known at the time products are shipped to the distributor. The return rights granted to these distributors consist of limited stock rotation rights, which allow them to rotate up to 10% of the products in their inventory twice a year, as well as certain product return rights if the applicable distribution agreement is terminated. These distributors also receive price concessions because they resell the Company’s products to end customers at various negotiated price points which vary by end customer, product, quantity, geography and competitive pricing environments. When a distributor’s resale is priced at a discount from the distributor’s invoice price, the Company credits back to the distributor a portion of the distributor’s original purchase price after the resale transaction is complete. Thus, a portion of the “Deferred income on sales to distributors” balance will be credited back to the distributor in the future. Under these agreements, recognition of revenue is deferred until the products are resold by the distributor, at which time the Company’s final net sales price is fixed and the distributor’s right to return the products expires. At the time of shipment to these distributors: (i) a trade receivable at the invoiced selling price is recorded because there is a legally enforceable obligation from the distributor to pay the Company currently for product delivered; (ii) inventory is relieved for the carrying value of products shipped because legal title has passed to the distributor; and (iii) deferred revenue and deferred cost of inventory are recorded under the “Deferred income on sales to distributors” caption in the liability section of the Company’s consolidated balance sheets. The Company evaluates the deferred cost of inventory component of this account for possible impairment by considering potential obsolescence of products that might be returned and by considering the potential of resale prices of these products being below the Company’s cost. By reviewing deferred inventory costs in the manner discussed above, the Company ensures that any portion of deferred inventory costs that are not recoverable from future contractual revenue are charged to cost of sales as an expense. “Deferred income on sales to distributors” effectively represents the gross margin on sales to distributors; however, the amount of gross margin that is recognized in future periods is typically less than the originally recorded deferred income as a result of negotiated price concessions. In recent years, such concessions have exceeded 30% of list price on average. See Note 3 for detail of this account balance.
Revenue from other distributors is recognized at the time of shipment and when title and risk of loss transfer to the distributor, in accordance with the terms specified in the arrangement, and when the four above mentioned revenue recognition criteria are met. These distributors may also be given business terms to return a portion of inventory, however they do not receive credits for changes in selling prices to end customers. At the time of shipment, product prices are fixed and determinable and the amount of future returns can be reasonably estimated and accrued.
The Company’s semiconductor products are often integrated with software that is essential to the functionality of the semiconductor products. Additionally, the Company provides unspecified software upgrades and enhancements through its maintenance contracts for many of its products. Accordingly, the Company accounts for revenue in accordance with FASB Accounting Standards Codification 985-605, Software Revenue Recognition, or ASC 985-605, and all related interpretations. For sales of products where software is incidental to the equipment, the Company applies the provisions of Accounting Standards Codification 605, Revenue Recognition, or ASC 605, and all related interpretations.
Revenue from the sale and license of intellectual property is recognized when the above mentioned four revenue recognition criteria are met. Development revenue is recognized when services are performed and customer acceptance has been received and was not significant for any of the periods presented.
Cash and Cash Equivalents — The Company considers all highly liquid investments with original maturities of three months or less from the date of purchase to be cash equivalents. The carrying amounts of cash and cash equivalents approximate their fair values.
52
MINDSPEED TECHNOLOGIES, INC.
NOTES TO CONSOLIDATED FINANCIAL STATEMENTS — (Continued)
Inventories — Inventories are stated at the lower of cost or market. Cost is computed using the average cost method on a currently adjusted standard basis (which approximates actual cost on a first-in, first-out basis); market is based upon estimated net realizable value. The valuation of inventories at the lower of cost or market requires the use of estimates as to the amounts of current inventories that will be sold. These estimates are dependent on the Company’s assessment of current and expected orders from its customers, and orders generally are subject to cancellation with limited advance notice prior to shipment.
Property, Plant and Equipment — Property, plant and equipment is stated at historical cost. Depreciation is based on estimated useful lives (principally ten years for furniture and fixtures; three to five years for machinery and equipment and photomasks; three years for computer software; and the shorter of the remaining terms of the leases or the estimated economic useful lives of the improvements for land and leasehold improvements). Significant renewals and betterments are capitalized and replaced units are written off. Maintenance and repairs are charged to expense.
License Agreements — License agreements consist mainly of licenses of intellectual property that the Company uses in certain of its products. These licensed assets are amortized on a straight-line basis over the estimated production life cycle of each respective product, usually ranging from three to five years beginning upon the first shipment.
Impairment of Long-Lived Assets — The Company continually monitors events or changes in circumstances that could indicate that the carrying amount of long-lived assets to be held and used, including intangible assets, may not be recoverable. The determination of recoverability is based on an estimate of undiscounted future cash flows resulting from the use of the asset and its eventual disposition. When impairment is indicated for a long-lived asset, the amount of impairment loss is the excess of net book value over fair value. Long-lived assets to be disposed of are reported at the lower of carrying amount or fair value less costs to sell. See Notes 12 and 13 for a discussion of the impairment of certain long-lived assets.
Foreign Currency Translation and Remeasurement — The Company’s foreign operations are subject to exchange rate fluctuations and foreign currency transaction costs. The functional currency of substantially all of the Company’s foreign subsidiaries is the local currency. Assets and liabilities denominated in foreign functional currencies are translated into U.S. dollars at the rates of exchange in effect at the balance sheet dates and income and expense items are translated at the average exchange rates prevailing during the period. The resulting foreign currency translation adjustments are accumulated as a component of other comprehensive income. For one of the Company’s foreign subsidiaries, the functional currency is the U.S. dollar. Inventories, property, plant and equipment, cost of goods sold and depreciation for those operations are remeasured from foreign currencies into U.S. dollars at historical exchange rates; other accounts are translated at current exchange rates. Gains and losses resulting from those remeasurements are included in earnings. Gains and losses resulting from foreign currency transactions are recognized currently in earnings.
Research and Development — Research and development costs, other than software development costs, are expensed as incurred.
Product Warranties — The Company’s products typically carry a warranty for periods of up to five years. The Company establishes reserves for estimated product warranty costs in the period the related revenue is recognized, based on historical experience and any known product warranty issues. Product warranty costs and related reserves are not significant in any of the periods presented.
Stock-Based Compensation — The Company accounts for all stock-based compensation transactions using a fair-value method and recognizes the fair value of each award as an expense over the service period. The fair value of restricted stock awards is based upon the market price of the Company’s common stock at the grant date. The Company estimates the fair value of stock options granted using the Black-Scholes option-pricing model. The use of the Black-Scholes model requires a number of estimates, including the expected option term,
53
MINDSPEED TECHNOLOGIES, INC.
NOTES TO CONSOLIDATED FINANCIAL STATEMENTS — (Continued)
the expected volatility in the price of the Company’s common stock, the risk-free rate of interest and the dividend yield on the Company’s common stock. Judgment is required in estimating the number of share-based awards that the Company expects will ultimately vest upon the fulfillment of service conditions (such as time-based vesting) or the achievement of specific performance conditions. The financial statements include amounts that are based on the Company’s best estimates and judgments. The Company classifies compensation expense related to these awards in the consolidated statement of operations based on the department to which the recipient reports.
Business Segments — The Company operates a single business segment which designs, develops and sells semiconductor solutions for communications applications in the wireline and wireless network infrastructure, which includes enterprise networks, broadband access networks (fixed and mobile) and metropolitan and wide area networks. The Company’s Chief Executive Officer is considered to be its chief operating decision maker.
Fair Value Measurements — The Company applies the provisions of Accounting Standards Codification 820, Fair Value Measurements and Disclosures, or ASC 820, in measuring the fair value of financial assets and financial liabilities and for non-financial assets and non-financial liabilities that the Company recognizes or discloses at fair value on a recurring basis (at least annually). ASC 820 defines fair value, establishes a framework for measuring fair value, and expands disclosures about fair value measurements. This pronouncement does not require any new fair value measurements, but provides guidance on how to measure fair value by providing a fair value hierarchy used to classify the source of the information. See Note 5 for more information.
Other Income, Net — Other income, net, consists of interest income, income from reimbursable foreign research and development incentives, foreign exchange gains and losses and other non-operating gains and losses, including gains/losses on debt extinguishments.
Income Taxes — The provision for income taxes is determined in accordance with Accounting Standards Codification 740, Income Taxes, or ASC 740. Deferred tax assets and liabilities are determined based on the temporary differences between the financial reporting and tax bases of assets and liabilities, applying enacted statutory tax rates in effect for the year in which the differences are expected to reverse. A valuation allowance is recorded when it is more likely than not that some or all of the deferred tax assets will not be realized.
The Company uses a two-step approach to recognizing and measuring uncertain tax positions accounted for in accordance with ASC 740. The first step is to evaluate the tax position for recognition by determining if the weight of available evidence indicates that it is more likely than not that the position will be sustained on audit, including resolution of related appeals or litigation processes, if any. The second step is to measure the tax benefit as the largest amount that is more than 50% likely of being realized upon settlement. The Company will classify the liability for unrecognized tax benefits as current to the extent that the Company anticipates payment (or receipt) of cash within one year. The Company recognizes interest and penalties related to unrecognized tax benefits in the tax provision.
Per Share Information — Basic net (loss)/income per share is computed by dividing net (loss)/income by the weighted average number of shares outstanding. In computing diluted net (loss)/income per share, the weighted average number of shares outstanding is adjusted to additionally reflect the effect of potentially dilutive securities such as stock options, warrants, convertible senior notes, shares to be issued under the Company’s employee stock purchase plan and unvested restricted stock units. The dilutive effect of stock options, warrants, unvested restricted stock units and shares to be issued under the employee stock purchase plan is computed under the provision of ASC 718, Compensation — Stock Compensation, using the treasury stock method. Under ASC 718, the Company is also required to add back the after-tax amount to net income of interest recognized, as well as the weighted average common share equivalents associated with the conversion of its convertible senior notes for all periods in which the securities were determined to be dilutive to the number of shares outstanding to be used in the calculation of diluted net (loss)/income per share.
54
MINDSPEED TECHNOLOGIES, INC.
NOTES TO CONSOLIDATED FINANCIAL STATEMENTS — (Continued)
Concentrations — Financial instruments that potentially subject the Company to a concentration of credit risk consist principally of cash and cash equivalents and trade accounts receivable. Cash and cash equivalents consist of demand deposits and money market funds maintained with several financial institutions. Deposits held with banks may exceed the amount of insurance provided on such deposits. Generally, these deposits may be redeemed upon demand and are maintained with high credit quality financial institutions and therefore have minimal credit risk. The Company’s trade accounts receivable primarily are derived from sales to manufacturers of network infrastructure equipment and electronic component distributors. Management believes that credit risks on trade accounts receivable are moderated by the diversity of its customers and geographic sales areas. The Company performs ongoing credit evaluations of its customers’ financial condition.
Comprehensive Income/(Loss) — Accumulated other comprehensive income/(loss) consists of foreign currency translation adjustments. Foreign currency translation adjustments are not presented net of any tax effect as the Company does not expect to incur any tax liability or realize any benefit related thereto.
Recent Accounting Standards — In June 2011, the FASB issued guidance regarding the presentation of comprehensive income. The new standard requires the presentation of comprehensive income, the components of net income and the components of other comprehensive income either in a single continuous statement of comprehensive income or in two separate but consecutive statements. The new standard also requires presentation of adjustments for items that are reclassified from other comprehensive income to net income in the statement where the components of net income and the components of other comprehensive income are presented. The updated guidance is effective on a retrospective basis for financial statements issued for fiscal years, and interim periods within those fiscal years, beginning after December 15, 2011. The Company does not expect the adoption of this guidance to have a material impact on its consolidated financial statements.
In May 2011, the FASB issued additional guidance on fair value measurements that clarifies the application of existing guidance and disclosure requirements, changes certain fair value measurement principles and requires additional disclosures about fair value measurements. The updated guidance is effective on a prospective basis for financial statements issued for fiscal years, and interim periods within those fiscal years, beginning after December 15, 2011. The Company does not expect the adoption of this guidance to have a material impact on its consolidated financial statements.
In April 2010, the FASB reached a consensus on the Milestone Method of Revenue Recognition, which provides guidance on the criteria that should be met for determining whether the milestone method of revenue recognition is appropriate. A vendor can recognize consideration that is contingent upon the achievement of a milestone in its entirety as revenue in the period in which the milestone is achieved only if the milestone meets all criteria to be considered substantive. The updated guidance is effective on a prospective basis for milestones achieved in fiscal years, and interim periods within those years beginning on or after June 15, 2010, with early adoption permitted. The adoption of these provisions did not have a material impact on the Company’s consolidated financial statements.
In September 2009, the Emerging Issues Task Force reached a consensus on Accounting Standards Update, or ASU, 2009-13, Revenue Recognition (Topic 605) — Multiple-Deliverable Revenue Arrangements, or ASU 2009-13, and ASU 2009-14, Software (Topic 985) — Certain Revenue Arrangements That Include Software Elements, or ASU 2009-14. ASU 2009-13 modifies the requirements that must be met for an entity to recognize revenue from the sale of a delivered item that is part of a multiple-element arrangement when other items have not yet been delivered. ASU 2009-13 eliminates the requirement that all undelivered elements must have either: (i) vendor specific objective evidence (VSOE) of fair value; or (ii) third-party evidence (TPE) before an entity can recognize the portion of an overall arrangement consideration that is attributable to items that already have been delivered. In the absence of VSOE or TPE of the standalone selling price for one or more delivered or undelivered elements in a multiple-element arrangement, entities will be required to estimate the selling prices of those elements. Overall arrangement consideration will be allocated to each element (both delivered and
55
MINDSPEED TECHNOLOGIES, INC.
NOTES TO CONSOLIDATED FINANCIAL STATEMENTS — (Continued)
undelivered items) based on their relative selling prices, regardless of whether those selling prices are evidenced by VSOE or TPE or are based on the entity’s estimated selling price. The residual method of allocating arrangement consideration has been eliminated. ASU 2009-14 modifies the software revenue recognition guidance to exclude from its scope tangible products that contain both software and non-software components that function together to deliver a product’s essential functionality. These new updates are effective for revenue arrangements entered into or materially modified in fiscal years beginning on or after June 15, 2010. The adoption of these provisions did not have a material impact on the Company’s consolidated financial statements.
3. Supplemental Financial Statement Data
Inventories
Inventories at fiscal year ends consisted of the following:
| September 30, 2011 |
October 1, 2010 |
|||||||
| (in thousands) | ||||||||
| Work-in-process |
$ | 6,200 | $ | 4,681 | ||||
| Finished goods |
8,016 | 5,524 | ||||||
|
|
|
|
|
|||||
| Inventories |
$ | 14,216 | $ | 10,205 | ||||
|
|
|
|
|
|||||
The Company assesses the recoverability of inventories through an ongoing review of inventory levels in relation to sales backlog and forecasts, product marketing plans and product life cycles. When the inventory on hand exceeds the foreseeable demand, the value of inventory that, at the time of the review, is not expected to be sold is written down. The amount of the write-down is the excess of historical cost over estimated realizable value. Once established, these write-downs are considered permanent adjustments to the cost basis of the excess inventory.
The assessment of the recoverability of inventories, and the amounts of any write-downs, are based on currently available information and assumptions about future demand (generally over 12 months) and market conditions. Demand for the Company’s products may fluctuate significantly over time, and actual demand and market conditions may be more or less favorable than those projected by management. In the event that actual demand is lower than originally projected, additional inventory write-downs may be required.
The Company may retain and make available for sale some or all of the inventories which have been written down. In the event that actual demand is higher than originally projected, the Company may be able to sell a portion of these inventories in the future. The Company generally scraps inventories which have been written down and are identified as obsolete.
Property, Plant and Equipment, Net
Property, plant and equipment, net, at fiscal year ends consisted of the following:
| September 30, 2011 |
October 1, 2010 |
|||||||
| (in thousands) | ||||||||
| Machinery and equipment |
$ | 79,340 | $ | 78,347 | ||||
| Leasehold improvements |
4,963 | 3,775 | ||||||
|
|
|
|
|
|||||
| 84,303 | 82,122 | |||||||
| Accumulated depreciation and amortization |
(68,934 | ) | (69,422 | ) | ||||
|
|
|
|
|
|||||
| Propert, plant and equipment, net |
$ | 15,369 | $ | 12,700 | ||||
|
|
|
|
|
|||||
56
MINDSPEED TECHNOLOGIES, INC.
NOTES TO CONSOLIDATED FINANCIAL STATEMENTS — (Continued)
Licensed and Purchased Intangibles, Net
Licensed and purchased intangibles, net, consists mainly of licenses of intellectual property. The Company expects to record amortization of its licensed and purchased intangibles as follows:
| Fiscal Year | ||||||||||||||||
| 2012 | 2013 | 2014 | 2015 | |||||||||||||
| (in thousands) | ||||||||||||||||
| Amortization expense |
$ | 2,274 | $ | 1,852 | $ | 1,050 | $ | 477 | ||||||||
|
|
|
|
|
|
|
|
|
|||||||||
The weighted average remaining life of the Company’s licensed and purchased intangibles as of September 30, 2011 was 33 months.
Deferred Income on Sales to Distributors
Deferred income on sales to distributors at fiscal year ends consisted of the following:
| September 30, 2011 |
October 1, 2010 |
|||||||
| (in thousands) | ||||||||
| Deferred revenue on shipments to distributors |
$ | 5,798 | $ | 5,674 | ||||
| Deferred cost of goods sold on shipments to distributors |
(502 | ) | (528 | ) | ||||
| Reserves |
50 | 53 | ||||||
|
|
|
|
|
|||||
| Deferred income on sales to distributors |
$ | 5,346 | $ | 5,199 | ||||
|
|
|
|
|
|||||
Other Liabilities
Other liabilities at fiscal year ends consisted of the following:
| September 30, 2011 |
October 1, 2010 |
|||||||
| (in thousands) | ||||||||
| Current |
||||||||
| Deferred rent |
$ | 617 | $ | 1,075 | ||||
| Capital lease obligations |
459 | 478 | ||||||
| Royalties |
429 | 426 | ||||||
| Licensed intangibles |
1,446 | 1,302 | ||||||
| Other |
2,149 | 1,115 | ||||||
|
|
|
|
|
|||||
| Total other current liabilities |
$ | 5,100 | $ | 4,396 | ||||
|
|
|
|
|
|||||
| Long-term |
||||||||
| Capital lease obligations |
$ | 111 | $ | 574 | ||||
| Licensed intangibles |
305 | 952 | ||||||
| Other |
1,010 | 607 | ||||||
|
|
|
|
|
|||||
| Total other liabilities |
$ | 1,426 | $ | 2,133 | ||||
|
|
|
|
|
|||||
57
MINDSPEED TECHNOLOGIES, INC.
NOTES TO CONSOLIDATED FINANCIAL STATEMENTS — (Continued)
Computation of Net (Loss)/Income per Share
The following table presents the computation of net (loss)/income per share:
| Year Ended | ||||||||||||
| September 30, 2011 |
October 1, 2010 |
October 2, 2009 |
||||||||||
| (in thousands, except per share amounts) | ||||||||||||
| Net (loss)/income per share — basic |
||||||||||||
| Net (loss)/income |
$ | (755 | ) | $ | 21,070 | $ | (25,114 | ) | ||||
| Basic weighted average common shares outstanding |
32,279 | 30,260 | 24,156 | |||||||||
|
|
|
|
|
|
|
|||||||
| Net (loss)/income per share — basic |
$ | (0.02 | ) | $ | 0.70 | $ | (1.04 | ) | ||||
|
|
|
|
|
|
|
|||||||
| Net (loss)/income per share — diluted |
||||||||||||
| Net (loss)/income |
$ | (755 | ) | $ | 21,070 | $ | (25,114 | ) | ||||
| Add: Interest expense on convertible notes, net of tax |
— | 1,508 | — | |||||||||
|
|
|
|
|
|
|
|||||||
| Net (loss)/income, adjusted |
$ | (755 | ) | $ | 22,578 | $ | (25,114 | ) | ||||
|
|
|
|
|
|
|
|||||||
| Basic weighted average common shares outstanding |
32,279 | 30,260 | 24,156 | |||||||||
| Effect of dilutive securities: |
||||||||||||
| Convertible senior notes |
— | 3,165 | — | |||||||||
| Dilutive stock awards |
— | 1,154 | — | |||||||||
|
|
|
|
|
|
|
|||||||
| Diluted weighted average common shares outstanding |
32,279 | 34,579 | 24,156 | |||||||||
|
|
|
|
|
|
|
|||||||
| Net (loss)/income per share — diluted |
$ | (0.02 | ) | $ | 0.65 | $ | (1.04 | ) | ||||
|
|
|
|
|
|
|
|||||||
Because the Company incurred a net loss in fiscal 2011, the potential dilutive effect of the Company’s outstanding stock options, warrants, employee stock purchase plan rights and securities issuable pursuant to contingent stock agreements was not included in the computation of diluted loss per share because these securities were antidilutive.
Stock options, warrants and securities issuable pursuant to contingent stock agreements to purchase approximately 11.7 million shares as of October 1, 2010 were outstanding, but not included in the computation of diluted earnings per share for the fiscal year ended October 1, 2010 because the effect would have been antidilutive.
Because the Company incurred a net loss in fiscal 2009, the potential dilutive effect of the Company’s outstanding stock options, stock warrants and convertible senior notes was not included in the computation of diluted loss per share because these securities were antidilutive.
58
MINDSPEED TECHNOLOGIES, INC.
NOTES TO CONSOLIDATED FINANCIAL STATEMENTS — (Continued)
Supplemental Cash Flow Information
| Year Ended | ||||||||||||
| September 30, 2011 |
October 1, 2010 |
October 2, 2009 |
||||||||||
| (in thousands) | ||||||||||||
| Interest paid |
$ | 975 | $ | 1,206 | $ | 1,724 | ||||||
| Income taxes paid, net of refunds received |
751 | 7 | 576 | |||||||||
| Non-cash investing activities consisted of the following: |
||||||||||||
| Purchase of property and equipment through capital leasing arrangements |
$ | — | $ | 1,096 | $ | — | ||||||
| Purchase of property and equipment on account |
531 | 307 | — | |||||||||
| License of intellectual property on account |
3,184 | 3,936 | — | |||||||||
Customer Concentrations
The following direct customers accounted for 10% or more of net revenue in the periods presented:
| Year Ended | ||||||||||||
| September 30, 2011 |
October 1, 2010 |
October 2, 2009 |
||||||||||
| Customer A |
23 | % | 15 | % | 14 | % | ||||||
| Customer B |
19 | % | 15 | % | 16 | % | ||||||
| Customer C |
9 | % | 10 | % | 12 | % | ||||||
| Customer D |
7 | % | 7 | % | 13 | % | ||||||
The following direct customers accounted for 10% or more of total accounts receivable at each period end:
| September 30, 2011 |
October 1, 2010 |
|||||||
| Customer B |
28 | % | 25 | % | ||||
| Customer C |
9 | % | 12 | % | ||||
59
MINDSPEED TECHNOLOGIES, INC.
NOTES TO CONSOLIDATED FINANCIAL STATEMENTS — (Continued)
4. Income Taxes
The components of the provision for income taxes were as follows:
| Year Ended | ||||||||||||
| September 30, 2011 |
October 1, 2010 |
October 2, 2009 |
||||||||||
| (in thousands) | ||||||||||||
| Current: |
||||||||||||
| Foreign |
$ | (2,200 | ) | $ | 734 | $ | 1,147 | |||||
| State and local |
6 | 356 | 22 | |||||||||
|
|
|
|
|
|
|
|||||||
| Total current |
(2,194 | ) | 1,090 | 1,169 | ||||||||
|
|
|
|
|
|
|
|||||||
| Deferred: |
||||||||||||
| Foreign |
2,435 | (684 | ) | (687 | ) | |||||||
| State and local |
— | — | — | |||||||||
|
|
|
|
|
|
|
|||||||
| Total deferred |
2,435 | (684 | ) | (687 | ) | |||||||
|
|
|
|
|
|
|
|||||||
| $ | 241 | $ | 406 | $ | 482 | |||||||
|
|
|
|
|
|
|
|||||||
A reconciliation of income taxes computed at the U.S. federal statutory income tax rate to the provision for income taxes on continuing operations follows:
| Year Ended | ||||||||||||
| September 30, 2011 |
October 1, 2010 |
October 2, 2009 |
||||||||||
| (in thousands) | ||||||||||||
| U.S. federal statutory tax at 35% |
$ | (180 | ) | $ | 7,516 | $ | (8,621 | ) | ||||
| State taxes, net of federal effect |
4 | 306 | (704 | ) | ||||||||
| Foreign income taxes in excess of U.S. |
112 | (159 | ) | 298 | ||||||||
| Valuation allowance |
(135 | ) | (7,220 | ) | 9,779 | |||||||
| Other |
440 | (37 | ) | (270 | ) | |||||||
|
|
|
|
|
|
|
|||||||
| Provision for income taxes |
$ | 241 | $ | 406 | $ | 482 | ||||||
|
|
|
|
|
|
|
|||||||
(Loss)/income before income taxes consisted of the following components:
| Year Ended | ||||||||||||
| September 30, 2011 |
October 1, 2010 |
October 2, 2009 |
||||||||||
| (in thousands) | ||||||||||||
| United States |
$ | (870 | ) | $ | 20,877 | $ | (25,098 | ) | ||||
| Foreign |
356 | 599 | 466 | |||||||||
|
|
|
|
|
|
|
|||||||
| $ | (514 | ) | $ | 21,476 | $ | (24,632 | ) | |||||
|
|
|
|
|
|
|
|||||||
60
MINDSPEED TECHNOLOGIES, INC.
NOTES TO CONSOLIDATED FINANCIAL STATEMENTS — (Continued)
Deferred income tax assets and liabilities at fiscal year-ends consisted of the tax effects of temporary differences related to the following:
| Year Ended | ||||||||
| September 30, 2011 |
October 1, 2010 |
|||||||
| (in thousands) | ||||||||
| Deferred tax assets: |
||||||||
| Inventories |
$ | 8,285 | $ | 9,418 | ||||
| Deferred revenue |
2,130 | 2,105 | ||||||
| Accrued compensation and benefits |
1,100 | 1,509 | ||||||
| Product returns and allowances |
649 | 562 | ||||||
| Net operating losses |
234,534 | 233,227 | ||||||
| Stock options |
4,016 | 3,364 | ||||||
| Foreign deferred taxes |
50 | 2,484 | ||||||
| Property, plant and equipment |
1,468 | 1,635 | ||||||
| Amortization |
1,741 | 1,912 | ||||||
| Other |
1,156 | 1,957 | ||||||
| Valuation allowance |
(249,085 | ) | (249,220 | ) | ||||
|
|
|
|
|
|||||
| Total deferred tax assets |
6,044 | 8,953 | ||||||
|
|
|
|
|
|||||
| Deferred tax liabilities: |
||||||||
| Deferred state taxes |
5,994 | 5,998 | ||||||
| Other |
— | 471 | ||||||
|
|
|
|
|
|||||
| Total deferred tax liabilities |
5,994 | 6,469 | ||||||
|
|
|
|
|
|||||
| Net deferred tax assets |
$ | 50 | $ | 2,484 | ||||
|
|
|
|
|
|||||
Based upon the Company’s history of operating losses, management determined that it is more likely than not that the U.S. federal and state deferred tax assets as of September 30, 2011 and October 1, 2010 will not be realized through the reduction of future income tax payments. Consequently, the Company has established a valuation allowance for its net U.S. federal and state deferred tax assets as of those dates. The Company’s foreign deferred tax assets are expected to be realized through a reduction of future tax payments, therefore no valuation allowance has been established for these deferred tax assets.
As of September 30, 2011, Mindspeed had U.S. federal net operating loss carryforwards of approximately $629.4 million, which expire at various dates through 2030, and aggregate state net operating loss carryforwards of approximately $164.2 million, which expire at various dates through 2030. Sections 382 and 383 of the Internal Revenue Code of 1986, as amended, provide for limitations on the utilization of net operating loss and research and development credit carryforwards if the Company were to undergo an ownership change, as defined in Section 382.
The deferred tax assets as of September 30, 2011 included a deferred tax asset of $10.2 million representing net operating losses arising from the exercise of stock options by Mindspeed employees. To the extent the Company realizes any tax benefit for the net operating losses attributable to the stock option exercises, such amount would be credited directly to stockholders’ equity.
The Company has not provided for U.S. taxes or foreign withholding taxes on approximately $3.7 million of undistributed earnings from its foreign subsidiaries because such earnings are to be reinvested indefinitely. If these earnings were distributed, foreign tax credits may become available under current law to reduce the resulting U.S. income tax liability.
61
MINDSPEED TECHNOLOGIES, INC.
NOTES TO CONSOLIDATED FINANCIAL STATEMENTS — (Continued)
On July 13, 2006, the FASB issued interpretations that clarify the accounting for uncertainty in income taxes recognized in an entity’s financial statements in accordance with Accounting Standards Codification 740, Income Taxes, and prescribe a recognition threshold and measurement attributes for financial statement disclosure of tax positions taken or expected to be taken on a tax return. Under the new interpretations, the impact of an uncertain income tax position on the income tax return must be recognized at the largest amount that is more likely than not to be sustained upon audit by the relevant taxing authority. An uncertain income tax position will not be recognized if it has less than a 50% likelihood of being sustained. Additionally, the new interpretations provide guidance on de-recognition, classification, interest and penalties, accounting in interim periods, disclosure and transition. The new interpretations are effective for fiscal years beginning after December 15, 2006.
The Company adopted these interpretations on September 29, 2007. As a result of the adoption and recognition of the cumulative effect of adoption of a new accounting principle, the Company recorded a $202,000 decrease in the liability for unrecognized income tax benefits, with an offsetting decrease in accumulated deficit. As of September 29, 2007 the Company had approximately $28.9 million of total unrecognized tax benefits. Of this total, $474,000 represents the amount of unrecognized tax benefits that, if recognized, would favorably affect the effective tax rate. The remaining $28.4 million of unrecognized tax benefits, if recognized, would have no impact on the effective tax rate and would be recorded as an increase to the Company’s deferred tax assets with a related increase in the valuation allowance. However, to the extent that any portion of such benefit is recognized at the time a valuation allowance no longer exists, such benefit would favorably affect the effective tax rate.
The Company recognizes interest and penalties related to unrecognized tax benefits in the tax provision. As of September 29, 2007, the Company had no liability for the payment of interest and penalties. The liability for the payment of interest and penalties did not change as of September 30, 2011.
A reconciliation of the beginning and ending amount of unrecognized tax benefits is as follows:
| Total | ||||
| (in thousands) | ||||
| Balance as of October 1, 2010 |
$ | 41,860 | ||
| Increase in tax positions for current year |
2,191 | |||
|
|
|
|||
| Balance as of September 30, 2011 |
$ | 44,051 | ||
|
|
|
|||
The Company has not recognized a deferred tax asset for potential Federal and state research and development credits because it believes no amounts are more likely than not to be sustained upon audit by the relevant tax authority. To date, the Company has not performed a formal study of potential research and development credits. If, at any time in the future, the Company determines it appropriate to conduct a formal study of potential research and development credits, completion of a study may have an effect on the Company’s estimate of this unrealized tax benefit.
The unrecognized tax benefits of $44.1 million at September 30, 2011 included $0.6 million of tax benefits that, if recognized, would reduce the Company’s annual effective tax rate. The remaining $43.5 million of unrecognized tax benefits, if recognized, would have no impact on the effective tax rate and be recorded as an increase to the Company’s deferred tax assets with a related increase in the valuation allowance. However, to the extent that any portion of such benefit is recognized at the time a valuation allowance no longer exists, such benefit would favorably affect the effective tax rate. The Company does not anticipate that unrecognized tax benefits will significantly increase or decrease within 12 months of September 30, 2011.
The Company is currently open to audit under the federal and state statute of limitations by the taxing authorities for the years ended September 30, 2007 to 2011, as well as in the Company’s foreign jurisdictions.
62
MINDSPEED TECHNOLOGIES, INC.
NOTES TO CONSOLIDATED FINANCIAL STATEMENTS — (Continued)
5. Fair Value Measurements
On October 4, 2008, the Company adopted certain provisions under ASC 820, Fair Value Measurements and Disclosures, for financial assets and financial liabilities and for non-financial assets and non-financial liabilities that we recognize or disclose at fair value on a recurring basis (at least annually). As of the date of adoption, these included cash equivalents and convertible senior notes.
ASC 820 defines fair value as the price that would be received from the sale of an asset or paid to transfer a liability (an exit price) in the principal or most advantageous market for the asset or liability in an orderly transaction between market participants on the measurement date. ASC 820 establishes a three-level hierarchy for disclosure that is based on the extent and level of judgment used to estimate the fair value of assets and liabilities.
| • | Level 1 uses unadjusted quoted prices that are available in active markets for identical assets or liabilities. The Company’s Level 1 assets include investments in money market funds. |
| • | Level 2 uses inputs other than quoted prices included in Level 1 that are either directly or indirectly observable through correlation with market data. These include quoted prices for similar assets or liabilities in active markets; quoted prices for identical or similar assets or liabilities in markets that are not active; and inputs to valuation models or other pricing methodologies that do not require significant judgment because the inputs used in the model, such as interest rates and volatility, can be corroborated by readily observable market data. |
| • | Level 3 uses one or more significant inputs that are unobservable and supported by little or no market activity, and reflect the use of significant management judgment. Level 3 assets and liabilities include those whose fair value measurements are determined using pricing models, discounted cash flow methodologies or similar valuation techniques and significant management judgment or estimation. The Company does not have any assets or liabilities that are valued using inputs identified under a Level 3 hierarchy. |
The following table represents financial assets that the Company measured at fair value in accordance with ASC 825, Financial Instruments. The Company has classified these assets in accordance with the fair value hierarchy set forth in ASC 820:
| September 30, 2011 | October 1, 2010 | |||||||||||||||
| Quoted Prices in Active markets for Identical Instruments (Level 1) |
Total Fair Value |
Quoted Prices in Active markets for Identical Instruments (Level 1) |
Total Fair Value |
|||||||||||||
| (in thousands) | ||||||||||||||||
| Assets: |
||||||||||||||||
| Money market fund |
$ | 10,517 | $ | 10,517 | $ | 16,007 | $ | 16,007 | ||||||||
| Government money market fund |
— | — | 5,504 | 5,504 | ||||||||||||
|
|
|
|
|
|
|
|
|
|||||||||
| Total cash equivalents |
$ | 10,517 | $ | 10,517 | $ | 21,511 | $ | 21,511 | ||||||||
|
|
|
|
|
|
|
|
|
|||||||||
63
MINDSPEED TECHNOLOGIES, INC.
NOTES TO CONSOLIDATED FINANCIAL STATEMENTS — (Continued)
6. Revolving Credit Facility and Convertible Senior Notes
Revolving Credit Facility
On September 30, 2008, the Company entered into a loan and security agreement with Silicon Valley Bank (SVB). Under the loan and security agreement, SVB agreed to provide the Company with a three-year revolving credit line of up to $15.0 million, subject to availability against certain eligible accounts receivable, for the purposes of: (i) working capital; (ii) funding its general business requirements; and (iii) repaying or repurchasing its 3.75% convertible senior notes due in November 2009. In April 2010, the Company amended the loan and security agreement and reduced the maximum amount available under the revolving credit line from $15.0 million to $5.0 million. This amendment was initiated in order to reduce fees due under the agreement. The indebtedness of the Company to SVB under the loan and security agreement is guaranteed by three domestic subsidiaries of the Company and secured by substantially all of the domestic assets of the Company and such subsidiaries, other than intellectual property.
Any indebtedness under the loan and security agreement bears interest at a variable rate ranging from prime plus 0.25% to a maximum rate of prime plus 1.25%, as determined in accordance with the interest rate grid set forth in the loan and security agreement. The loan and security agreement contains affirmative and negative covenants which, among other things, require the Company to maintain a minimum tangible net worth and to deliver to SVB specified financial information, including annual, quarterly and monthly financial information, and limit the Company’s ability to (or, in certain circumstances, to permit any subsidiaries to), subject to certain exceptions and limitations: (i) merge with or acquire other companies; (ii) create liens on its property; (iii) incur debt obligations; (iv) enter into transactions with affiliates, except on an arm’s length basis; (v) dispose of property; and (vi) issue dividends or make distributions.
The Company was in compliance with all required covenants and had no outstanding borrowings under the credit facility with SVB as of the September 30, 2011 expiration date of the credit facility.
3.75% Convertible Senior Notes due 2009
In December 2004, the Company sold $46.0 million aggregate principal amount of 3.75% convertible senior notes due 2009 for net proceeds (after discounts and commissions) of approximately $43.9 million. The notes were senior unsecured obligations of the Company, ranking equal in right of payment with all future unsecured indebtedness. The convertible senior notes had an interest rate of 3.75%, payable semiannually in arrears each May 18 and November 18. The notes were due November 18, 2009.
In July 2008, $15.0 million of the 3.75% convertible senior notes were exchanged as discussed below. In October 2008, the Company repurchased $20.5 million aggregate principal amount of the notes due in November 2009, for $17.3 million in cash. The repurchases occurred in two separate transactions on October 16 and October 23, 2008. During the first quarter of fiscal 2010, the 3.75% convertible senior notes matured and the remaining balance of $10.5 million was repaid.
6.50% Convertible Senior Notes due 2013
On July 30, 2008, the Company entered into separate exchange agreements with certain holders of its 3.75% convertible senior notes, pursuant to which holders of an aggregate of $15.0 million of the notes agreed to exchange their notes for $15.0 million in aggregate principal amount of a new series of 6.50% convertible senior notes due 2013 (the “Exchange Offer”). The Exchange Offer closed on August 1, 2008. The Company paid at the closing an aggregate of approximately $100,000 in accrued and unpaid interest on the 3.75% convertible senior notes that were exchanged for the 6.50% convertible senior notes, as well as approximately $900,000 in transaction fees.
64
MINDSPEED TECHNOLOGIES, INC.
NOTES TO CONSOLIDATED FINANCIAL STATEMENTS — (Continued)
The Company issued the convertible senior notes due in August 2013 pursuant to an indenture, dated as of August 1, 2008, between it and Wells Fargo Bank, N.A., as trustee.
The convertible senior notes are unsecured senior indebtedness and bear interest at a rate of 6.50% per annum. Interest is payable on February 1 and August 1 of each year, commencing on February 1, 2009. The notes mature on August 1, 2013. At maturity, the Company will be required to repay the outstanding principal of the notes. As of September 30, 2011, $15.0 million in aggregate principal amount of the Company’s 6.50% convertible senior notes were outstanding.
The 6.50% convertible senior notes are convertible at the option of the holders, at any time on or prior to maturity, into shares of the Company’s common stock at a conversion rate equal to approximately $4.74 per share of common stock, which is subject to adjustment in certain circumstances. Upon conversion of the notes, the Company generally has the right to deliver to the holders thereof, at the Company’s option: (i) cash; (ii) shares of the Company’s common stock; or (iii) a combination thereof. The initial conversion price of the 6.50% convertible senior notes will be adjusted to reflect stock dividends, stock splits, issuances of rights to purchase shares of the Company’s common stock, and upon other events. If the Company undergoes certain fundamental changes prior to maturity of the notes, the holders thereof will have the right, at their option, to require it to repurchase for cash some or all of their 6.50% convertible senior notes at a repurchase price equal to 100% of the principal amount of the notes being repurchased, plus accrued and unpaid interest (including additional interest, if any) to, but not including, the repurchase date, or convert the notes into shares of its common stock and, under certain circumstances, receive additional shares of its common stock in the amount provided in the indenture.
For financial accounting purposes, the Company’s contingent obligation to issue additional shares or make additional cash payment upon conversion following a fundamental change is an “embedded derivative.” As of September 30, 2011, the liability under the fundamental change adjustment has been recorded at its estimated fair value and is not significant.
If there is an event of default under the notes, the principal of and premium, if any, on all the notes and the interest accrued thereon may be declared immediately due and payable, subject to certain conditions set forth in the indenture. An event of default under the indenture will occur if the Company: (i) is delinquent in making certain payments due under the notes; (ii) fails to deliver shares of common stock or cash upon conversion of the notes; (iii) fails to deliver certain required notices under the notes; (iv) fails, following notice, to cure a breach of a covenant under the notes or the indenture; (v) incurs certain events of default with respect to other indebtedness; or (vi) is subject to certain bankruptcy proceedings or orders. If the Company fails to deliver certain SEC reports to the trustee in a timely manner as required by the indenture, (x) the interest rate applicable to the notes during the delinquency will be increased by 0.25% or 0.50%, as applicable (depending on the duration of the delinquency), and (y) if the required reports are not delivered to the trustee within 180 days after their due date under the indenture, a holder of the notes will generally have the right, subject to certain limitations, to require the Company to repurchase all or any portion of the notes then held by such holder. As of September 30, 2011, the Company is in compliance with these covenants.
As of September 30, 2011, the carrying value, representing the amortized value allocated to the instrument upon adoption of ASC 470-20, as discussed below, of the 6.50% convertible senior notes was $14.2 million, which consisted of the principal amount of $15.0 million, less an unamortized debt discount of $800,000. The estimated fair value of these notes as of September 30, 2011 was approximately $18.8 million. Key assumptions used in the calculation of this fair value include a volatility of 64.0%, based on the implied volatility of a Mindspeed publicly traded call option, a debt discount rate of 7.0%, and discount for lack of marketability of 10%.
65
MINDSPEED TECHNOLOGIES, INC.
NOTES TO CONSOLIDATED FINANCIAL STATEMENTS — (Continued)
Impact of Adoption of New Accounting Standard
ASC 470-20, the new accounting standard for convertible debt that may be settled in cash upon conversion, changed the accounting for the Company’s convertible notes and the related debt issuance costs. Prior to the issuance of this accounting standard, the Company reported the 3.75% convertible senior notes at their principal amount of $46.0 million, less an original issuance discount of $2.1 million, in long-term debt and capitalized debt issuance costs amounting to approximately $400,000. Upon adoption of the new accounting standard as of October 3, 2009, the Company adjusted the accounting for these convertible notes and the related deferred financing costs for all prior periods since their initial issuance. The Company determined that the estimated fair value of debt instruments similar to its 3.75% convertible senior notes, without the conversion feature, was $28.4 million at the time of issuance. The resulting $17.6 million discount on the debt was amortized through interest expense over the period from December 2004 through November 2009, which represented the expected life of the debt. The equity component, recorded as additional paid-in capital, was $15.6 million as of the date of issuance, which represents the difference between the proceeds from issuance of the 3.75% senior convertible notes and the fair value of the debt as of the date of issuance. Additionally, the Company reclassified approximately $146,000 of the deferred financing costs to equity as equity issuance costs, which will not be amortized to the statement of operations.
On July 30, 2008, the Company completed the Exchange Offer. Prior to the issuance of ASC 470-20, the Company reported the 6.50% convertible senior notes at their principal amount of $15.0 million in long-term debt and capitalized debt issuance costs amounting to approximately $900,000. Upon adoption of the new accounting standard as of October 3, 2009, the Company also adjusted the accounting for these convertible notes and the related deferred financing costs for all prior periods since their initial issuance. The Company determined that the estimated fair value of debt instruments similar to its 6.50% convertible senior notes, without the conversion feature, was $13.0 million at the time of issuance. The resulting $2.0 million discount on the debt will be amortized through interest expense over the period from August 2008 through August 2013, which represents the expected life of the debt. In conjunction with the exchange, the Company recorded a gain of approximately $200,000 representing the difference between the fair value of the debt component of the newly issued instrument and the book value of the old debt instrument, less unamortized issuance costs. The carrying amount of the equity component upon the Exchange Offer was $2.0 million; however, there was no net change to additional paid-in capital.
In October 2008, the Company repurchased $20.5 million aggregate principal amount of its 3.75% convertible senior notes due in November 2009, for cash of $17.3 million. The repurchases occurred in two separate transactions on October 16 and October 23, 2008. In accordance with ASC 470-20, the Company recorded a gain of $1.1 million related to these repurchases. The gain was calculated as the difference between the fair value of the liability component of the notes immediately before settlement, and the book value of the notes net of unamortized debt issuance costs. To measure the fair value of the repurchased notes as of the settlement dates, the Company calculated an implied interest rate of approximately 17% using Level 2 observable inputs. See Note 5 for information regarding Level 2 observable inputs. This rate was applied to the repurchased portion of the notes using the same present value technique used in the valuation performed as of the issuance date. No value was allocated to the equity component of the instrument at the time of these extinguishments.
66
MINDSPEED TECHNOLOGIES, INC.
NOTES TO CONSOLIDATED FINANCIAL STATEMENTS — (Continued)
The following table sets forth balance sheet information related to the 6.50% convertible senior notes:
| September 30, 2011 |
October 1, 2010 |
|||||||
| (in thousands) | ||||||||
| Principal value of the liability component |
$ | 15,000 | $ | 15,000 | ||||
| Unamortized value of the liability component |
784 | 1,190 | ||||||
|
|
|
|
|
|||||
| Net carrying value of the liability component |
$ | 14,216 | $ | 13,810 | ||||
|
|
|
|
|
|||||
The following table sets forth interest expense information related to the 6.50% convertible senior notes:
| Year Ended | ||||||||||||
| September 30, 2011 |
October 1, 2010 |
October 2, 2009 |
||||||||||
| (in thousands) | ||||||||||||
| Interest expense — coupon |
$ | 975 | $ | 975 | $ | 975 | ||||||
| Interest expense — debt discount amortization |
406 | 395 | 383 | |||||||||
|
|
|
|
|
|
|
|||||||
| Total |
$ | 1,381 | $ | 1,370 | $ | 1,358 | ||||||
|
|
|
|
|
|
|
|||||||
| Effective interest rate on the liability for the period |
9.21 | % | 9.13 | % | 9.05 | % | ||||||
|
|
|
|
|
|
|
|||||||
The following table sets forth interest expense information related to the 3.75% convertible senior notes:
| Year Ended | ||||||||||||
| September 30, 2011 |
October 1, 2010 |
October 2, 2009 |
||||||||||
| (in thousands) | ||||||||||||
| Interest expense — coupon |
$ | — | $ | 48 | $ | 432 | ||||||
| Interest expense — debt discount amortization |
— | 151 | 1,080 | |||||||||
|
|
|
|
|
|
|
|||||||
| Total |
$ | — | $ | 199 | $ | 1,512 | ||||||
|
|
|
|
|
|
|
|||||||
| Effective yearly interest rate on the liability component for the period |
— | 14.68 | % | 13.20 | % | |||||||
|
|
|
|
|
|
|
|||||||
The estimated amortization expense for the debt discount related to the 6.50% convertible senior notes through the remaining expected life is as follows:
| Fiscal Year | ||||||||
| 2012 | 2013 | |||||||
| (in thousands) | ||||||||
| Estimated debt discount amortization expense |
$ | 418 | $ | 366 | ||||
7. Commitments
In March 2010, the Company entered into a lease agreement with the owner of its headquarters in Newport Beach, California with a term beginning in June 2010 and extending through December 2012. The Company may, at its option, extend the lease for an additional five-year term. Rent payable under the lease is approximately $2.1 million annually, including operating expenses associated with the leased property. The Company estimates its minimum future obligation under the lease at approximately $2.7 million over the remaining lease term.
The Company leases its other facilities and certain equipment under non-cancelable operating leases. The leases expire at various dates through fiscal 2016 and contain various provisions for rental adjustments including, in certain cases, adjustments based on increases in the Consumer Price Index. The leases generally contain renewal provisions for varying periods of time.
67
MINDSPEED TECHNOLOGIES, INC.
NOTES TO CONSOLIDATED FINANCIAL STATEMENTS — (Continued)
As of September 30, 2011, the Company’s minimum future obligations under operating leases were as follows:
| Fiscal Year |
(in thousands) | |||
| 2012 |
$ | 4,356 | ||
| 2013 |
2,373 | |||
| 2014 |
1,482 | |||
| 2015 |
1,507 | |||
| 2016 |
485 | |||
|
|
|
|||
| Total minimum future lease payments |
$ | 10,203 | ||
|
|
|
|||
Purchase obligations are comprised of commitments to purchase design tools and software for use in product development, which will be spent through fiscal 2013. Amounts due under purchase obligations as of September 30, 2011 were approximately as follows:
| Fiscal Year |
(in thousands) | |||
| 2012 |
$ | 13,834 | ||
| 2013 |
1,192 | |||
|
|
|
|||
| Total |
$ | 15,026 | ||
|
|
|
|||
8. Contingencies
Various lawsuits, claims and proceedings have been or may be instituted or asserted against the Company, including those pertaining to product liability, intellectual property, environmental, safety and health and employment matters. As is common in the industry, the Company currently has in effect a number of agreements in which it has agreed to defend, indemnify and hold harmless certain of its suppliers and customers from damages and costs which may arise from the infringement by the Company’s products of third-party patents, trademarks or other proprietary rights. The Company has never incurred significant costs to defend lawsuits or settle claims related to these indemnification agreements.
The outcome of litigation cannot be predicted with certainty and some lawsuits, claims or proceedings may be determined unfavorably against the Company. Many intellectual property disputes have a risk of injunctive relief, and there can be no assurance that the Company will be able to license a third party’s intellectual property. Injunctive relief could have a material adverse effect on the financial condition or results of operations of the Company. Unless specifically noted below, during the period presented, we have not: recorded any accrual for loss contingencies associated with the legal proceedings described below; determined that an unfavorable outcome is probable or reasonably possible; or determined that the amount or range of any possible loss is reasonably estimable. Based on its evaluation of matters which are pending or asserted, while there can be no assurance, management of the Company believes the disposition of such matters will not have a material adverse effect on the financial condition or results of operations of the Company.
In June 2011, the Company was notified by a customer, with whom there is an indemnification agreement, that it had settled an outstanding patent infringement claim against the customer that it asserts relates to products purchased from the Company. The customer requested that the Company contribute approximately $1.3 million to the settlement, representing its estimate of the Company’s pro rata share of the settlement and related legal fees. The Company has notified the customer that it believes the indemnification agreement does not apply to the contribution sought by the customer, and the Company intends to vigorously defend this position.
68
MINDSPEED TECHNOLOGIES, INC.
NOTES TO CONSOLIDATED FINANCIAL STATEMENTS — (Continued)
9. Guarantees
The Company has made guarantees and indemnities, under which it may be required to make payments to a guaranteed or indemnified party, in relation to certain transactions. In connection with the Distribution, the Company generally assumed responsibility for all contingent liabilities and then-current and future litigation against Conexant or its subsidiaries related to Mindspeed. In connection with the sales of its products, the Company provides intellectual property indemnities to its customers. In connection with certain facility leases, the Company has indemnified its lessors for certain claims arising from the facility or the lease. The Company indemnifies its directors and officers to the maximum extent permitted under the laws of the State of Delaware. The duration of the guarantees and indemnities varies, and in many cases is indefinite. The guarantees and indemnities to customers in connection with product sales generally are subject to limits based upon the amount of the related product sales. Some customer guarantees and indemnities, and the majority of other guarantees and indemnities, do not provide for any limitation of the maximum potential future payments the Company could be obligated to make. The Company has not recorded any liability for these guarantees and indemnities in the accompanying consolidated balance sheets.
10. Capital Stock
The Company’s authorized capital consists of 100.0 million shares of common stock, par value $0.01 per share, and 25.0 million shares of preferred stock, par value $0.01 per share, of which 2.5 million shares are designated as Series A Junior Participating Preferred Stock (Series A Junior Preferred Stock) and 3.5 million shares are designated as Series B Junior Participating Preferred Stock (Series B Junior Preferred Stock).
The Company has a preferred share purchase rights plan to protect stockholders’ rights in the event of a proposed takeover of the Company. Pursuant to the preferred share purchase right (a Right) attached to each share of common stock, the holder may, in certain takeover-related circumstances, become entitled to purchase from the Company 5/100th of a share of Series A Junior Preferred Stock at a price of $20, subject to adjustment. Also, in certain takeover-related circumstances, each Right (other than those held by an acquiring person) will generally be exercisable for shares of the Company’s common stock or stock of the acquiring person having a then-current market value of twice the exercise price. In certain events, each Right may be exchanged by the Company for one share of common stock or 5/100th of a share of Series A Junior Preferred Stock. The Rights expire on June 26, 2013, unless earlier exchanged or redeemed at a redemption price of $0.01 per Right, subject to adjustment.
The Company also has a Section 382 Rights Agreement intended to protect the Company’s net operating loss carryforwards (NOLs) to reduce potential future federal income tax obligations. However, if the Company were to experience an “Ownership Change,” as defined in Section 382 of the Internal Revenue Code, its ability to use the NOLs will be significantly limited, and the timing of the usage of the NOLs could be significantly limited, which could therefore significantly impair the value of that asset. Pursuant to each preferred share purchase right under the Section 382 Rights Agreement, attached to each share of common stock, the holder may, upon an “Ownership Change” and subject to certain other conditions, become entitled to purchase from the Company a unit consisting of 1/100th of a share of Series B Junior Preferred Stock at a price of $15 per unit, subject to adjustment. Each unit of Series B Junior Preferred Stock has a minimum preferential quarterly dividend of $0.01 per unit (or any higher per share dividend declared on the common stock), a liquidation preference equal to $1.00 per unit and the per share amount paid in respect of each share of common stock and the right to one vote, voting together with common stock. The preferred share purchase rights under the Section 382 Rights Agreement expire on August 9, 2012, unless earlier redeemed or exchanged, or Section 382 of the Internal Revenue Code is repealed.
69
MINDSPEED TECHNOLOGIES, INC.
NOTES TO CONSOLIDATED FINANCIAL STATEMENTS — (Continued)
Warrants
In the Distribution, Mindspeed issued to Conexant a warrant to purchase six million shares of Mindspeed common stock at a price of $17.04 per share, exercisable through June 27, 2013. The $89.0 million fair value of the warrant (estimated by management at the time of the Distribution using the Black-Scholes option-pricing model) was recorded as a return of capital to Conexant. As of September 30, 2011, the entire warrant remains outstanding.
The warrant held by Conexant contains antidilution provisions that provide for adjustment of the warrant’s exercise price, and the number of shares issuable under the warrant, upon the occurrence of certain events. In the event that the Company issues, or is deemed to have issued, shares of its common stock, or securities convertible into its common stock, at prices below the current market price of its common stock (as defined in the warrant) at the time of the issuance of such securities, the warrant’s exercise price will be reduced and the number of shares issuable under the warrant will be increased. The amount of such adjustment, if any, will be determined pursuant to a formula specified in the warrant and will depend on the number of shares issued, the offering price and the current market price of the common stock at the time of the issuance of such securities. In August 2009, the Company issued and sold 4.8 million shares of its common stock at a public offering price of $2.05 per share which was below the current market price of the Company’s stock. Due to these antidilution provisions, the number of shares related to this warrant was adjusted to represent the right to purchase approximately 6.1 million and the price was adjusted to $16.74 per share.
11. Stock-Based Compensation
Effective October 1, 2005, the Company adopted standards under Accounting Standards Codification 718, Compensation — Stock Compensation, or ASC 718, using the “modified prospective application.” The Company elected the transition method related to accounting for the tax effects of share-based payment awards to employees. ASC 718 requires that the Company account for all stock-based compensation transactions using a fair-value method and recognize the fair value of each award as an expense over the service period. As required by ASC 718, the Company’s stock-based compensation expense for fiscal 2011, fiscal 2010 and fiscal 2009 includes the fair value of new awards, modified awards and any unvested awards. The fair value of restricted stock awards is based upon the market price of the Company’s common stock at the grant date. The Company estimates the fair value of stock option awards, as of the grant date, using the Black-Scholes option-pricing model. The fair value of each award is recognized on a straight-line basis over the vesting or service period.
Stock-based compensation awards generally vest over time and require continued service to the Company and, in some cases, require the achievement of specified performance conditions. The amount of compensation expense recognized is based upon the number of equity awards that are ultimately expected to vest. The Company estimates forfeiture rates of 10% to 12.5% depending on the characteristics of the award.
As a result of the Company’s history of operating losses and of the uncertainty regarding future operating results, no income tax benefits have been recognized for any U.S. federal and state operating losses — including those related to stock-based compensation expense. The Company does not expect to recognize any income tax benefits relating to its operating losses until it determines that such tax benefits are more likely than not to be realized.
70
MINDSPEED TECHNOLOGIES, INC.
NOTES TO CONSOLIDATED FINANCIAL STATEMENTS — (Continued)
The fair value of stock options awarded was estimated at the date of grant using the Black-Scholes option-pricing model. The following table summarizes the weighted-average assumptions used and the resulting fair value of options granted:
| Year Ended | ||||||||||||
| September 30, 2011 |
October 1, 2010 |
October 2, 2009 |
||||||||||
| Weighted-average assumptions: |
||||||||||||
| Expected option life |
2.9 years | 2.8 years | 2.8 years | |||||||||
| Risk-free interest rate |
0.8 | % | 1.3 | % | 1.4 | % | ||||||
| Expected volatility |
97 | % | 95 | % | 87 | % | ||||||
| Dividend yield |
— | — | — | |||||||||
| Weighted-average grant date fair value per share |
$ | 4.51 | $ | 3.23 | $ | 1.08 | ||||||
The expected option term was estimated at issuance based upon historical experience and management’s expectation of exercise behavior. The expected volatility of the Company’s stock price is based upon the historical daily changes in the price of the Company’s common stock. The risk-free interest rate is based upon the current yield on U.S. Treasury securities having a term similar to the expected option term. Dividend yield is estimated at zero because the Company does not anticipate paying dividends in the foreseeable future.
The fair value of employee stock purchase plan rights was estimated at the offering date using the Black-Scholes option-pricing model. The following table summarizes the weighted-average assumptions used and the resulting fair value of plan rights offered:
| Year Ended | ||||||||||||
| September 30, 2011 |
October 1, 2010 |
October 2, 2009 |
||||||||||
| Weighted-average assumptions: |
||||||||||||
| Expected life |
0.5 years | 0.5 years | — | |||||||||
| Risk-free interest rate |
0.16 | % | 0.23 | % | — | |||||||
| Expected volatility |
61 | % | 70 | % | — | |||||||
| Dividend yield |
— | — | — | |||||||||
| Weighted-average grant date fair value per share |
$ | 2.65 | $ | 3.00 | $ | — | ||||||
The expected life of the plan rights was based upon the length of the offering periods. The risk-free interest rate was based upon the current yield on U.S. Treasury securities having a term similar to the expected life. The expected volatility was based upon the historical daily changes in the price of the Company’s common stock. Dividend yield is estimated at zero because the Company does not anticipate paying dividends in the foreseeable future.
Stock-based compensation expense related to employee stock options and restricted stock under ASC 718 was allocated as follows:
| Year Ended | ||||||||||||
| September 30, 2011 |
October 1, 2010 |
October 2, 2009 |
||||||||||
| (in thousands) | ||||||||||||
| Cost of goods sold |
228 | 159 | 85 | |||||||||
| Research and development |
1,728 | 1,004 | 765 | |||||||||
| Selling, general and administrative |
3,963 | 3,076 | 1,825 | |||||||||
|
|
|
|
|
|
|
|||||||
| Total stock-based compensation |
$ | 5,919 | $ | 4,239 | $ | 2,675 | ||||||
|
|
|
|
|
|
|
|||||||
71
MINDSPEED TECHNOLOGIES, INC.
NOTES TO CONSOLIDATED FINANCIAL STATEMENTS — (Continued)
Stock Compensation Plans
The Company has two principal stock incentive plans: the 2003 Long-Term Incentives Plan and the Directors Stock Plan. The 2003 Long-Term Incentives Plan provides for the grant of stock options, unrestricted stock, restricted stock, restricted stock units and other stock-based awards to officers and employees of the Company. The Directors Stock Plan provides for the grant of stock options, restricted stock units and other stock-based awards to the Company’s non-employee directors. In April 2011, the stockholders of the Company approved a plan amendment, which included an increase in the authorized number of shares reserved for issuance under the 2003 Long-Term Incentives Plan to approximately 9.7 million shares. As of September 30, 2011, an aggregate of 1.7 million shares of the Company’s common stock were available for issuance under these plans.
The Company also has a 2003 Stock Option Plan, under which stock options were issued in connection with the Distribution. In the Distribution, each holder of a Conexant stock option (other than options held by persons in certain foreign locations) received an option to purchase a number of shares of Mindspeed common stock. The number of shares subject to, and the exercise prices of, the outstanding Conexant options and the Mindspeed options were adjusted so that the aggregate intrinsic value of the options was equal to the intrinsic value of the Conexant option immediately prior to the Distribution and the ratio of the exercise price per share to the market value per share of each option was the same immediately before and after the Distribution. As a result of such option adjustments, Mindspeed issued options to purchase an aggregate of approximately 6.1 million shares at a price of $16.74 per share, as adjusted, of its common stock to holders of Conexant stock options (including Mindspeed employees) under the 2003 Stock Option Plan. There are no shares available for new stock option awards under the 2003 Stock Option Plan. However, any shares subject to the unexercised portion of any terminated, forfeited or cancelled option are available for future option grants only in connection with an offer to exchange outstanding options for new options.
At the Company’s annual meeting of stockholders held on March 10, 2010, the Company’s stockholders approved an employee stock purchase plan and the reservation of 500,000 shares for issuance under the plan. The purpose of the employee stock purchase plan is to provide eligible employees with the opportunity to purchase shares of the Company’s common stock through payroll deductions at a discount from the then current market price. The purchase price per share at which common stock is purchased on the participant’s behalf for each offering period is equal to the lower of: (i) 85% of the fair market value per share of common stock on the date of commencement of such offering period; and (ii) 85% of the fair market value per share of common stock on the last day of such offering period. Under the plan, eligible employees may authorize payroll deductions of up to 10% of eligible compensation for the purchase of common stock during each semi-annual purchase period. The employee stock purchase plan, and the right of participants to make purchases thereunder, is intended to qualify under the provisions of Sections 421 and 423 of the Internal Revenue Code. The third offering period under this plan began during the third quarter of fiscal 2011 and will end in the first quarter of fiscal 2012.
From time to time, the Company may issue, and has previously issued stock based awards outside of these plans pursuant to stand-alone agreements and in accordance with NASDAQ Listing Rule 5635(c).
Stock Option Awards
Prior to fiscal 2006, stock-based compensation consisted principally of stock options. Eligible employees received grants of stock options at the time of hire, and the Company made broad-based stock option grants covering substantially all employees annually. Stock option awards have exercise prices not less than the market price of the common stock at the grant date and a contractual term of eight or ten years, and are subject to time-based vesting (generally over four years). On April 10, 2009, the Company offered current eligible employees of Mindspeed and its subsidiaries the right to exchange certain unexercised options to purchase shares of the Company’s common stock. The offer period on the exchange program ended on May 15, 2009, at which time the Company exchanged 754,000 previously issued stock options for 250,000 new stock options with an exercise
72
MINDSPEED TECHNOLOGIES, INC.
NOTES TO CONSOLIDATED FINANCIAL STATEMENTS — (Continued)
price of $1.70, the market price of the Company’s common stock on that date. The Company has chosen to account for this transaction under the bifurcated approach whereby the remaining unamortized expense of the exchanged awards is recognized over the original award period. The Company recorded an insignificant amount of incremental compensation expense in conjunction with this exchange.
The following table summarizes stock option activity under all plans:
| Number of Shares |
Weighted- Average Exercise Price |
Weighted- Average Remaining Contractual Term |
Aggregate Intrinsic Value |
|||||||||||||
| (in thousands) | (in thousands) | |||||||||||||||
| Outstanding at October 3, 2008 |
3,528 | $ | 10.50 | 3.7 years | $ | — | ||||||||||
|
|
|
|||||||||||||||
| Exercisable at October 3, 2008 |
2,704 | $ | 11.59 | 2.6 years | $ | — | ||||||||||
|
|
|
|||||||||||||||
| Granted |
1,294 | 1.98 | ||||||||||||||
| Exercised |
— | — | ||||||||||||||
| Forfeited or expired |
(1,694 | ) | 11.40 | |||||||||||||
| Outstanding at October 2, 2009 |
3,128 | $ | 6.48 | 4.9 years | $ | — | ||||||||||
|
|
|
|||||||||||||||
| Exercisable at October 2, 2009 |
1,461 | $ | 10.84 | 2.8 years | $ | — | ||||||||||
|
|
|
|||||||||||||||
| Granted |
592 | 5.49 | ||||||||||||||
| Exercised |
(479 | ) | 3.38 | $ | 2,530 | |||||||||||
| Forfeited or expired |
(341 | ) | 9.73 | |||||||||||||
|
|
|
|||||||||||||||
| Outstanding at October 1, 2010 |
2,900 | $ | 6.41 | 4.8 years | $ | 8,515 | ||||||||||
|
|
|
|||||||||||||||
| Exercisable at October 1, 2010 |
1,509 | $ | 9.00 | 3.2 years | $ | 2,666 | ||||||||||
|
|
|
|||||||||||||||
| Granted |
871 | 7.58 | ||||||||||||||
| Exercised |
(461 | ) | 2.97 | |||||||||||||
| Forfeited or expired |
(722 | ) | 8.18 | |||||||||||||
|
|
|
|||||||||||||||
| Outstanding at September 30, 2011 |
2,588 | $ | 6.93 | 5.4 years | $ | 2,624 | ||||||||||
|
|
|
|||||||||||||||
| Exercisable at September 30, 2011 |
1,309 | $ | 7.69 | 3.6 years | $ | 1,654 | ||||||||||
|
|
|
|||||||||||||||
| Vesting Condition |
Remaining Unrecognized Compensation Cost |
Remaining Years to Vest |
||||||
| (in thousands) | ||||||||
| Service based |
$ | 3,733 | 1.4 | |||||
|
|
|
|
|
|||||
73
MINDSPEED TECHNOLOGIES, INC.
NOTES TO CONSOLIDATED FINANCIAL STATEMENTS — (Continued)
The following table summarizes all options to purchase Mindspeed common stock outstanding at September 30, 2011:
| Outstanding | Exercisable | |||||||||||||||||||
| Range of Exercise Prices |
Number of Shares |
Average Remaining Contractual Life (Years) |
Weighted- Average Exercise Price |
Number of Shares |
Weighted- Average Exercise Price |
|||||||||||||||
| (in thousands) | (in thousands) | |||||||||||||||||||
| $ 0.75 - $ 2.31 |
$ | 669 | 5.0 | $ | 1.98 | 427 | $ | 2.00 | ||||||||||||
| 2.88 - 4.85 |
437 | 5.3 | 4.14 | 266 | 4.12 | |||||||||||||||
| 5.07 - 8.50 |
595 | 7.9 | 7.09 | 66 | 7.49 | |||||||||||||||
| 8.53 - 12.70 |
704 | 4.6 | 10.10 | 367 | 11.32 | |||||||||||||||
| 13.26 - 47.50 |
183 | 1.8 | 18.97 | 183 | 18.97 | |||||||||||||||
|
|
|
|
|
|||||||||||||||||
| 0.75 - 47.50 |
$ | 2,588 | 6.9 | $ | 7.69 | 1,309 | $ | 5.36 | ||||||||||||
|
|
|
|
|
|||||||||||||||||
Stock Awards
The Company’s stock incentive plans also provide for awards of restricted and unrestricted shares of common stock and other stock-based incentive awards and from time to time the Company has used stock awards for incentive or retention purposes.
Restricted stock awards have time-based vesting and/or performance conditions and are generally subject to forfeiture if employment terminates prior to the end of the service period or if the prescribed performance criteria are not met. Restricted stock awards are valued at the grant date based upon the market price of the Company’s common stock and the fair value of each award is charged to expense over the service period. Many of the Company’s restricted stock awards are intended to provide performance emphasis and incentive compensation through vesting tied to each employee’s performance against individual goals, as well as to improvements in the Company’s operating performance. The actual amounts of expense will depend on the number of awards that ultimately vest upon the satisfaction of the related performance and service conditions.
On March 10, 2010, the Company granted awards of 190,000 shares of unrestricted stock to certain executive officers of the Company, with vesting subject to satisfaction of specific market and performance conditions. These awards begin to vest on the date when the average of the closing price of the Company’s common stock over a consecutive 20-day trading period reaches certain minimum amounts. On each vesting trigger date, 8.33% of the shares of common stock underlying these awards will vest for each completed three month period from the grant date to the vesting trigger date. An additional 8.33% of the shares of common stock underlying these awards will vest on each three month anniversary date of the vesting trigger date. If the vesting trigger price is not achieved prior to the three year anniversary date of the grant date, these awards will be forfeited. These unrestricted stock awards were valued using the Monte Carlo simulation model, which estimates value based on the probability of vesting achievement.
74
MINDSPEED TECHNOLOGIES, INC.
NOTES TO CONSOLIDATED FINANCIAL STATEMENTS — (Continued)
The fair value of each stock award is charged to expense over the service period. The following table summarizes restricted stock award activity:
| Number of Shares |
Weighted- Average Grant Date Fair Value |
Fair Value of Shares Vested |
||||||||||
| (in thousands) | (in thousands) | |||||||||||
| Nonvested shares at October 3, 2008 |
682 | $ | 6.69 | |||||||||
|
|
|
|||||||||||
| Granted |
211 | 1.86 | ||||||||||
| Vested |
(472 | ) | 6.61 | $ | 598 | |||||||
| Forfeited |
(50 | ) | 7.02 | |||||||||
|
|
|
|||||||||||
| Nonvested shares at October 2, 2009 |
371 | $ | 4.50 | |||||||||
|
|
|
|||||||||||
| Granted |
740 | 6.60 | ||||||||||
| Vested |
(418 | ) | 4.77 | $ | 2,875 | |||||||
| Forfeited |
(13 | ) | 3.13 | |||||||||
|
|
|
|||||||||||
| Nonvested shares at October 1, 2010 |
680 | $ | 6.64 | |||||||||
|
|
|
|||||||||||
| Granted |
1,856 | 7.86 | ||||||||||
| Vested |
(270 | ) | 5.50 | $ | 1,898 | |||||||
| Forfeited |
(211 | ) | 7.35 | |||||||||
|
|
|
|||||||||||
| Outstanding at September 30, 2011 |
2,055 | $ | 7.74 | |||||||||
|
|
|
|||||||||||
| Vesting Condition |
Remaining Unrecognized Compensation Cost |
Remaining Years to Vest |
||||||||
| (in thousands) | ||||||||||
| Service based |
$ | 12,256 | 2.6 | |||||||
| Market based |
687 | 0.8 | ||||||||
|
|
|
|||||||||
| Stock awards |
$ | 12,943 | ||||||||
|
|
|
|||||||||
12. Asset Impairments and Other Charges
There were no asset impairments included within cost of goods sold for the fiscal years ended September 30, 2011 and October 1, 2010. Included within cost of goods sold for the fiscal year ended October 2, 2009 are asset impairments and other charges totaling $3.7 million. These charges include a $2.4 million write-down of the carrying value of developed technology related to the Company’s acquisition of certain assets of Ample Communications, Inc., which occurred in the fourth quarter of fiscal 2007. Management evaluated the recoverability of the assets related to Ample Communications to determine whether their value was impaired, based upon the future cash flows expected to be generated by the associated products over the remainder of their life cycles. Because the estimated undiscounted cash flows were less than the carrying value of the related assets, management determined that such assets were impaired. The Company recorded an impairment charge equal to the full book value of the assets by comparing the estimated fair value of the asset to their carrying value. The fair value was determined by computing the present value of the expected future cash flows using a discount rate of 20%, which management believes is commensurate with the underlying risks associated with the projected cash flows. Management believes the assumptions used in the discounted cash flow model represent a reasonable estimate of the fair value of the assets.
75
MINDSPEED TECHNOLOGIES, INC.
NOTES TO CONSOLIDATED FINANCIAL STATEMENTS — (Continued)
In addition, in the fiscal year ended October 2, 2009, asset impairments and other charges within cost of goods sold includes a $1.1 million write-down of Ample Communications related inventory due to a decrease in demand for these products. The Company assesses the recoverability of its inventories at least quarterly through a review of inventory levels in relation to foreseeable demand (generally over 12 months). Foreseeable demand is based upon all available information, including sales backlog and forecasts, product marketing plans and product life cycles. When the inventory on hand exceeds the foreseeable demand, the Company writes down the value of those inventories which, at the time of its review, the Company expects to be unable to sell. The amount of the inventory write-down is the excess of historical cost over estimated realizable value (generally zero). Once established, these write-downs are considered permanent adjustments to the cost basis of the excess inventory.
Also, in the fiscal year ended October 2, 2009, the Company recorded other asset impairments within cost of goods sold totaling approximately $300,000 associated with manufacturing related property and equipment that the Company determined to abandon or scrap.
13. Special Charges
Special charges consisted of the following:
| Year Ended | ||||||||||||
| September 30, 2011 |
October 1, 2010 |
October 2, 2009 |
||||||||||
| (in thousands) | ||||||||||||
| Asset impairments |
$ | — | $ | 828 | $ | 2,865 | ||||||
| Restructuring charges |
1,032 | 1,856 | 4,031 | |||||||||
|
|
|
|
|
|
|
|||||||
| Total special charges |
$ | 1,032 | $ | 2,684 | $ | 6,896 | ||||||
|
|
|
|
|
|
|
|||||||
Asset Impairments
During fiscal 2011, the Company did not record any asset impairment charges.
During fiscal 2010, the Company recorded asset impairment charges of $828,000. These impairment charges consisted of property and equipment that the Company determined to abandon or scrap.
During fiscal 2009, the Company recorded asset impairment charges of $2.9 million. Included in this amount were asset impairment charges of approximately $500,000 related to software and property and equipment that the Company determined to abandon or scrap, as well as asset impairment charges of $2.4 million to write-down the carrying value of goodwill related to the Company’s acquisition of certain assets of Ample Communications. In the second quarter of fiscal 2009, the Ample Communications reporting unit experienced a severe decline in sales and profitability due to a significant decline in demand that the Company believes was a result of the downturn in global economic conditions, as well as a bankruptcy filed by the reporting unit’s most significant customer. The drop in market demand resulted in significant declines in unit sales. Due to these market and economic conditions, the Ample Communications reporting unit experienced a significant decline in market value. As a result, the Company concluded that there were sufficient factual circumstances for interim impairment analyses. Accordingly, in the second quarter of fiscal 2009, the Company performed a goodwill impairment assessment. Based on the results of its assessment of goodwill for impairment, the Company determined that the carrying value of the Ample Communications reporting unit exceeded its estimated fair value. Therefore, the Company performed a second step of the impairment test to estimate the implied fair value of goodwill. The required analysis indicated that there would be no remaining implied value attributable to goodwill in the Ample Communications reporting unit and the Company impaired the entire goodwill balance of $2.4 million.
76
MINDSPEED TECHNOLOGIES, INC.
NOTES TO CONSOLIDATED FINANCIAL STATEMENTS — (Continued)
Restructuring Charges
The Company has from time to time, and may in the future, commit to restructuring plans to help manage the costs of the Company or to help implement strategic initiatives, among other reasons.
Mindspeed Fourth Quarter of Fiscal 2011 Restructuring Plan — In the fourth quarter of fiscal 2011, the Company committed to the implementation of a restructuring plan. The plan consisted primarily of a targeted headcount reduction in the Company’s selling, general and administrative functions and Wide Area Networking (WAN) business unit. The restructuring plan was substantially completed during the fourth quarter of fiscal 2011. The Company incurred $1.1 million of charges related to severance costs for the affected employees.
Activity and liability balances related to the Company’s fourth quarter of fiscal 2011 restructuring plan were as follows:
| Workforce Reductions |
||||
| (in thousands) | ||||
| Charges to costs and expenses |
$ | 1,091 | ||
| Cash payments |
(189 | ) | ||
|
|
|
|||
| Restructuring balance, September 30, 2011 |
$ | 902 | ||
|
|
|
|||
Mindspeed Fourth Quarter of Fiscal 2010 Restructuring Plan — In the fourth quarter of fiscal 2010, the Company committed to the implementation of a restructuring plan. The plan consisted primarily of a targeted headcount reduction in its WAN product family and selling, general and administrative functions. The restructuring plan was substantially completed during the fiscal fourth quarter of 2010. Of the $1.3 million in charges incurred, $966,000 related to severance costs for affected employees and $311,000 related to abandoned technology.
Activity and liability balances related to the Company’s fourth quarter of fiscal 2010 restructuring plan from October 1, 2010 through September 30, 2011 were as follows:
| Workforce Reductions |
Facility and Other |
Total | ||||||||||
| (in thousands) | ||||||||||||
| Charges to costs and expenses |
$ | 966 | $ | 311 | $ | 1,277 | ||||||
| Cash payments |
(265 | ) | — | (265 | ) | |||||||
| Non-cash asset write-downs |
— | (311 | ) | (311 | ) | |||||||
|
|
|
|
|
|
|
|||||||
| Restructuring balance, October 1, 2010 |
$ | 701 | $ | — | $ | 701 | ||||||
|
|
|
|
|
|
|
|||||||
| Cash payments |
(618 | ) | — | (618 | ) | |||||||
| Non-cash credits |
(41 | ) | — | (41 | ) | |||||||
|
|
|
|
|
|
|
|||||||
| Restructuring balance, September 30, 2011 |
$ | 42 | $ | — | $ | 42 | ||||||
|
|
|
|
|
|
|
|||||||
The remaining accrued restructuring balance principally represents employee severance benefits. The Company expects to pay these remaining obligations in the first quarter of fiscal 2012.
Mindspeed Fiscal 2009 Restructuring Plans — In fiscal 2009, the Company implemented two restructuring plans to improve its operating structure. These restructuring plans included workforce reductions, closure of facilities and reductions in areas of selling, general and administrative and WAN communications spending.
At October 1, 2010, the total remaining accrued restructuring balance under these plans was $20,000. During the first quarter of fiscal 2011, any amounts left to be paid under these plans were paid and any remaining accrued amounts were reversed. At September 30, 2011, there was no remaining accrued restructuring balance related to these plans.
77
MINDSPEED TECHNOLOGIES, INC.
NOTES TO CONSOLIDATED FINANCIAL STATEMENTS — (Continued)
14. Employee Benefit Plans
The Company sponsors a 401(k) retirement savings plan for its eligible employees. At its discretion, the Company matches a portion of employee contributions and can fund the matching contribution in shares of its common stock or in cash. In fiscal 2011, fiscal 2010 and fiscal 2009, the Company contributed $1.2 million in cash each fiscal year, which was used to buy shares of the Company’s common stock to fund the matching contributions. The Company recognized expenses under the retirement savings plans of $1.2 million each of fiscal years 2011, fiscal 2010 and fiscal 2009.
15. Related Party Transactions
For the fiscal years ending October 1, 2010 and October 2, 2009, rent and operating expenses related to the Company’s corporate headquarters in Newport Beach, California and paid to Conexant were $3.8 million and $5.2 million, respectively. In June 2010, the Company paid Conexant $100,000 to settle a contract dispute related to its corporate headquarters. On June 26, 2010, the Company’s sublease of its corporate headquarters from Conexant expired. The Company’s new lease is not with a related party.
In June 2011, the Company entered into an agreement to license certain intellectual property from a related party. The licensor is a related party because one of the Company’s directors also serves as a director of the licensor. Pursuant to terms of the license agreement, the Company will pay an aggregate of $6.0 million upon the completion of certain milestones, including the delivery of licensed intellectual property. In addition, the Company is obligated to pay royalties not to exceed an additional $2.5 million for products sold that include the licensed intellectual property. During fiscal 2011, the Company paid $875,000 in related license fees.
16. Acquisition
In April 2011, the Company completed the acquisition of substantially all of the assets of privately held IPG Communications, Inc., a software developer that specialized in advanced signal processing technologies for wideband code division multiple access, for $500,000 cash consideration. The purchase price was primarily allocated to the assigned intellectual property and is included in licensed and purchased intangibles on the accompanying balance sheet at September 30, 2011.
17. Segment and Other Information
The Company operates a single operating segment which designs, develops and sells semiconductor networking solutions for communications applications in enterprise networks, broadband access networks (fixed and mobile) and metropolitan and wide area networks, as well as sells related intellectual property. Revenue by product line was as follows:
| Year Ended | ||||||||||||
| September 30, 2011 |
October 1, 2010 |
October 2, 2009 |
||||||||||
| (in thousands) | ||||||||||||
| Communications convergence processing |
$ | 71,652 | $ | 66,923 | $ | 49,452 | ||||||
| High-performance analog |
59,240 | 54,311 | 39,084 | |||||||||
| WAN communications |
28,697 | 44,145 | 33,016 | |||||||||
| Intellectual property |
2,500 | 12,800 | 5,000 | |||||||||
|
|
|
|
|
|
|
|||||||
| Net revenue |
$ | 162,089 | $ | 178,179 | $ | 126,552 | ||||||
|
|
|
|
|
|
|
|||||||
78
MINDSPEED TECHNOLOGIES, INC.
NOTES TO CONSOLIDATED FINANCIAL STATEMENTS — (Continued)
Revenue by geographic area is presented based upon the country of destination. Revenue by geographic area was as follows:
| Year Ended | ||||||||||||
| September 30, 2011 |
October 1, 2010 |
October 2, 2009 |
||||||||||
| (in thousands) | ||||||||||||
| United States |
$ | 30,355 | $ | 41,083 | $ | 30,571 | ||||||
| Other Americas |
3,495 | 4,213 | 6,531 | |||||||||
|
|
|
|
|
|
|
|||||||
| Total Americas |
33,850 | 45,296 | 37,102 | |||||||||
| Malaysia |
7,116 | 8,936 | 6,949 | |||||||||
| Singapore |
5,921 | 13,582 | 4,306 | |||||||||
| Taiwan |
11,927 | 16,868 | 3,699 | |||||||||
| China |
60,847 | 54,730 | 52,266 | |||||||||
| Japan |
17,879 | 14,386 | 4,257 | |||||||||
| Other Asia-Pacific |
11,805 | 11,532 | 5,788 | |||||||||
|
|
|
|
|
|
|
|||||||
| Total Asia-Pacific |
115,495 | 120,034 | 77,265 | |||||||||
| Europe, Middle East and Africa |
12,744 | 12,849 | 12,185 | |||||||||
|
|
|
|
|
|
|
|||||||
| $ | 162,089 | $ | 178,179 | $ | 126,552 | |||||||
|
|
|
|
|
|
|
|||||||
No other foreign country or region represented 10% or more of net revenue for any of the periods presented. The Company believes a substantial portion of the products sold to original equipment manufacturers and third-party manufacturing service providers in the Asia-Pacific region are ultimately shipped to end-markets in the Americas and Europe.
Long-lived assets consist of property, plant and equipment, license agreements and other long-term assets. Long-lived assets by geographic area at fiscal year-ends were as follows:
| September 30, 2011 |
October 1, 2010 |
|||||||
| (in thousands) | ||||||||
| United States |
$ | 30,128 | $ | 20,405 | ||||
| Other Americas |
29 | — | ||||||
| Europe, Middle East and Africa |
2,244 | 1,230 | ||||||
| Asia-Pacific |
2,307 | 2,182 | ||||||
|
|
|
|
|
|||||
| $ | 34,708 | $ | 23,817 | |||||
|
|
|
|
|
|||||
79
MINDSPEED TECHNOLOGIES, INC.
NOTES TO CONSOLIDATED FINANCIAL STATEMENTS — (Continued)
18. Quarterly Financial Data (unaudited)
| Total
Net Revenue |
Gross Margin |
Operating (Loss)/ Income |
(Loss)/ Income Before Income Taxes |
Net (Loss)/ Income |
Share | |||||||||||||||||||||||
| Basic | Diluted | |||||||||||||||||||||||||||
| (in thousands, except per share amounts) | ||||||||||||||||||||||||||||
| Fiscal Year Ended September 30, 2011 |
||||||||||||||||||||||||||||
| Fourth quarter |
$ | 40,777 | $ | 25,016 | $ | (2,477 | ) | $ | (2,456 | ) | $ | (2,159 | ) | $ | (0.07 | ) | $ | (0.07 | ) | |||||||||
| Third quarter |
42,216 | 26,249 | 138 | 668 | (1) | 464 | 0.01 | 0.01 | ||||||||||||||||||||
| Second quarter |
38,553 | 24,270 | (334 | ) | (624 | )(1) | (759 | ) | (0.02 | ) | (0.02 | ) | ||||||||||||||||
| First quarter |
40,543 | 26,262 | 2,146 | 1,898 | (1) | 1,699 | 0.05 | 0.05 | ||||||||||||||||||||
| Fiscal Year Ended October 1, 2010 |
||||||||||||||||||||||||||||
| Fourth quarter |
57,649 | 41,076 | 13,966 | 13,467 | 13,227 | (2) | 0.38 | 0.42 | ||||||||||||||||||||
| Third quarter |
43,281 | 27,780 | 5,043 | 4,970 | 4,864 | 0.15 | 0.15 | |||||||||||||||||||||
| Second quarter |
40,253 | 25,920 | 3,379 | 3,181 | 3,139 | 0.10 | 0.11 | |||||||||||||||||||||
| First quarter |
$ | 37,026 | $ | 23,563 | $ | 481 | $ | (144 | ) | $ | (160 | ) | $ | (0.01 | ) | $ | (0.01 | ) | ||||||||||
| (1) | Amounts previously reported have been adjusted to reclassify the benefit of $150,000 (first quarter of fiscal 2011), $150,000 (second quarter of fiscal 2011) and $1.0 million (third quarter of fiscal 2011) of refundable tax credits from provision for income taxes to other income, net. |
| (2) | Includes asset impairment and restructuring charges of $2.0 million and net income related to the sale of intellectual property totaling $9.9 million. |
80
REPORT OF INDEPENDENT REGISTERED PUBLIC ACCOUNTING FIRM
To the Board of Directors and Stockholders of
Mindspeed Technologies, Inc.:
We have audited the accompanying consolidated balance sheets of Mindspeed Technologies, Inc. and subsidiaries (the “Company”) as of September 30, 2011 and October 1, 2010, and the related consolidated statements of operations, stockholders’ equity and comprehensive (loss)/gain, and cash flows for each of the three years in the period ended September 30, 2011. Our audits also included the financial statement schedule listed in the Index at Item 15(a)(2). We also have audited the Company’s internal control over financial reporting as of September 30, 2011, based on the criteria established in Internal Control — Integrated Framework issued by the Committee of Sponsoring Organizations of the Treadway Commission. The Company’s management is responsible for these financial statements and the financial statement schedule, for maintaining effective internal control over financial reporting, and for its assessment of the effectiveness of internal control over financial reporting, included in the accompanying Management’s Report on Internal Control over Financial Reporting. Our responsibility is to express an opinion on these financial statements and the financial statement schedule and an opinion on the Company’s internal control over financial reporting based on our audits.
We conducted our audits in accordance with the standards of the Public Company Accounting Oversight Board (United States). Those standards require that we plan and perform the audit to obtain reasonable assurance about whether the financial statements are free of material misstatement and whether effective internal control over financial reporting was maintained in all material respects. Our audits of the financial statements included examining, on a test basis, evidence supporting the amounts and disclosures in the financial statements, assessing the accounting principles used and significant estimates made by management, and evaluating the overall financial statement presentation. Our audit of internal control over financial reporting included obtaining an understanding of internal control over financial reporting, assessing the risk that a material weakness exists, and testing and evaluating the design and operating effectiveness of internal control based on the assessed risk. Our audits also included performing such other procedures as we considered necessary in the circumstances. We believe that our audits provide a reasonable basis for our opinions.
A company’s internal control over financial reporting is a process designed by, or under the supervision of, the company’s principal executive and principal financial officers, or persons performing similar functions, and effected by the company’s board of directors, management, and other personnel to provide reasonable assurance regarding the reliability of financial reporting and the preparation of financial statements for external purposes in accordance with generally accepted accounting principles. A company’s internal control over financial reporting includes those policies and procedures that (1) pertain to the maintenance of records that, in reasonable detail, accurately and fairly reflect the transactions and dispositions of the assets of the company; (2) provide reasonable assurance that transactions are recorded as necessary to permit preparation of financial statements in accordance with generally accepted accounting principles, and that receipts and expenditures of the company are being made only in accordance with authorizations of management and directors of the company; and (3) provide reasonable assurance regarding prevention or timely detection of unauthorized acquisition, use, or disposition of the company’s assets that could have a material effect on the financial statements.
Because of the inherent limitations of internal control over financial reporting, including the possibility of collusion or improper management override of controls, material misstatements due to error or fraud may not be prevented or detected on a timely basis. Also, projections of any evaluation of the effectiveness of the internal control over financial reporting to future periods are subject to the risk that the controls may become inadequate because of changes in conditions, or that the degree of compliance with the policies or procedures may deteriorate.
In our opinion, the consolidated financial statements referred to above present fairly, in all material respects, the financial position of Mindspeed Technologies, Inc. and subsidiaries as of September 30, 2011 and October 1, 2010, and the results of their operations and their cash flows for each of the three years in the period ended September 30, 2011, in conformity with accounting principles generally accepted in the United States of America. Also, in our opinion, such financial statement schedule, when considered in relation to the basic
81
consolidated financial statements taken as a whole, presents fairly, in all material respects, the information set forth therein. Also, in our opinion, the Company maintained, in all material respects, effective internal control over financial reporting as of September 30, 2011, based on the criteria established in Internal Control — Integrated Framework issued by the Committee of Sponsoring Organizations of the Treadway Commission.
As discussed in Note 6 to the consolidated financial statements, the consolidated financial statements for the year ended October 2, 2009 have been retrospectively adjusted for the October 3, 2009 adoption of Accounting Standards Codification Subtopic 470-20 Accounting for Convertible Debt Instruments That May Be Settled in Cash Upon Conversion (Including Partial Cash Settlement).
DELOITTE & TOUCHE LLP
Costa Mesa, CA
November 18, 2011
82
| Item 9. | Changes in and Disagreements with Accountants on Accounting and Financial Disclosure |
None.
| Item 9A. | Controls and Procedures |
Disclosure Controls and Procedures
Under the supervision and with the participation of our management, including our Chief Executive Officer and our Chief Financial Officer, we have evaluated the effectiveness of the design and operation of our disclosure controls and procedures as of September 30, 2011. Disclosure controls and procedures are defined under Rule 13a-15(e) promulgated under the Securities Exchange Act of 1934, as amended, as controls and other procedures that are designed to ensure that information required to be disclosed by us in the reports that we file or submit under the Exchange Act is recorded, processed, summarized and reported within required time periods, and that such information is accumulated and communicated to our management, including our Chief Executive Officer and Chief Financial Officer, as appropriate, to allow for timely decisions regarding required disclosure. Based upon that evaluation, our Chief Executive Officer and our Chief Financial Officer have concluded that, as of September 30, 2011 these disclosure controls and procedures were effective.
Management’s Report on Internal Control over Financial Reporting
Our management is responsible for establishing and maintaining adequate internal control over our financial reporting. Internal control over financial reporting is a process to provide reasonable assurance regarding the reliability of our financial reporting for external purposes in accordance with generally accepted accounting principles. Internal control over financial reporting includes policies and procedures that: (i) pertain to maintaining records that in reasonable detail accurately and fairly reflect our transactions; (ii) provide reasonable assurance that transactions are recorded as necessary for preparation of our financial statements and that receipts and expenditures of company assets are made in accordance with management and board authorization; and (iii) provide reasonable assurance that unauthorized acquisition, use or disposition of company assets that could have a material effect on our financial statements would be prevented or detected on a timely basis. Because of its inherent limitations, internal control over financial reporting is not intended to provide absolute assurance that a misstatement of our financial statements would be prevented or detected.
There were no changes in our internal control over financial reporting during the fiscal quarter ended September 30, 2011 that have materially affected, or are reasonably likely to materially affect, our internal control over financial reporting.
Our management evaluated the effectiveness of our internal control over financial reporting based on the framework in Internal Control — Integrated Framework issued by the Committee of Sponsoring Organizations of the Treadway Commission. Based upon that evaluation, management concluded that the company’s internal control over financial reporting was effective as of September 30, 2011. The Company’s effectiveness of internal control over financial reporting as of September 30, 2011 has been audited by Deloitte & Touche LLP, an independent registered public accounting firm, and Deloitte & Touche has issued a report on the Company’s internal control over financial reporting.
| Item 9B. | Other Information |
2012 Annual Meeting of Stockholders
Our 2012 annual meeting of stockholders will be held at our headquarters, located at 4000 MacArthur Blvd., East Tower, Newport Beach, California 92660, on Tuesday, January 31, 2012 at 2:00 p.m., Pacific Time.
In accordance with our bylaws and Rule 14a-5(f) under the Exchange Act, we will consider stockholder proposals and director nominations to be brought before our 2012 annual meeting of stockholders to have been submitted in a timely fashion if such proposals are received by us at our principal offices between November 18, 2011 and November 28, 2011. The deadline for stockholder proposals and director nominations for inclusion in our proxy statement submitted pursuant to Rule 14a-8 under the Exchange Act remains unchanged.
83
PART III
Certain information required by Part III is omitted from this Annual Report and is incorporated herein by reference to the Company’s definitive Proxy Statement for the 2012 Annual Meeting of Stockholders (the Proxy Statement) to be filed with the SEC.
| Item 10. | Directors, Executive Officers and Corporate Governance |
The information required by this Item is incorporated herein by reference from the sections entitled “Board of Directors — Election of Directors,” “Executive Officers,” “Board of Directors — Board Governance Matters” and “Other Matters — Section 16(a) Beneficial Ownership Reporting Compliance” in the Proxy Statement.
We have adopted a code of ethics entitled “Code of Business Conduct and Ethics,” that applies to all employees, including our executive officers and directors. A copy of the Code of Business Conduct and Ethics is posted on our website (www.mindspeed.com). In addition, we will provide to any person without charge a copy of the Code of Business Conduct and Ethics upon written request to our secretary at the address listed on the cover page of this Annual Report on Form 10-K. We intend to disclose future amendments to certain provisions of our Code of Business Conduct and Ethics, or waivers of such provisions granted to executive officers and directors, on our web site within four business days following the date of such amendment or waivers.
| Item 11. | Executive Compensation |
The information required by this Item is incorporated herein by reference to the sections entitled “Executive Officer and Director Compensation,” “Board of Directors — Compensation Committee Interlocks and Insider Participation,” and “Compensation Committee Report” in the Proxy Statement.
| Item 12. | Security Ownership of Certain Beneficial Owners and Management and Related Stockholder Matters |
The information required by this Item is incorporated herein by reference to the sections entitled “Security Ownership of Certain Beneficial Owners and Management” and “Equity Compensation Plan Information” in the Proxy Statement.
| Item 13. | Certain Relationships and Related Transactions, and Director Independence |
The information required by this Item is incorporated by reference to the sections entitled “Certain Relationships and Related Transactions” and “Board of Directors — Board Governance Matters” in the Proxy Statement.
| Item 14. | Principal Accounting Fees and Services |
The information required by this Item is incorporated herein by reference to the section entitled “Principal Accounting Fees and Services” in the Proxy Statement.
84
PART IV
| Item 15. | Exhibits and Financial Statement Schedules |
(a)(1) Financial Statements
The following consolidated financial statements of the Company for the three fiscal years ended September 30, 2011 are included herewith:
Consolidated Balance Sheets, Consolidated Statements of Operations, Consolidated Statements of Cash Flows, Consolidated Statements of Stockholders’ Equity and Comprehensive Loss, Notes to Consolidated Financial Statements, and Report of Independent Registered Public Accounting Firm
(2) Supplemental Schedules
Schedule II — Valuation and Qualifying Accounts
All other schedules have been omitted because the required information is not present in amounts sufficient to require submission of the schedule, or because the required information is included in the consolidated financial statements or notes thereto.
(3) Exhibits
| 3.1 | Restated Certificate of Incorporation of the Registrant, filed as Exhibit 4.1 to the Registrant’s Registration Statement on Form S-3 (Registration Statement No. 333-106146), is incorporated herein by reference. | |
| 3.2 | Certificate of Amendment to the Restated Certificate of Incorporation of the Registrant, filed as Exhibit 3.1 to the Registrant’s Current Report on Form 8-K filed on July 1, 2008, is incorporated herein by reference (SEC File No. 001-31650). | |
| 3.3 | Certificate of Designation of Series B Junior Participating Preferred Stock, filed as Exhibit 3.1 to the Registrant’s Current Report on Form 8-K filed on August 10, 2009, is incorporated herein by reference (SEC File No. 001-31650). | |
| 3.4 | Amended and Restated Bylaws of the Registrant, filed as Exhibit 3.1 to the Registrant’s Current Report on Form 8-K filed on May 27, 2011, is incorporated herein by reference (SEC File No. 001-31650). | |
| 4.1 | Specimen certificate for the Registrant’s Common Stock, par value $.01 per share, filed as Exhibit 4.1 to the Registrant’s Quarterly Report on Form 10-Q for the fiscal quarter ended June 27, 2008, is incorporated herein by reference (SEC File No. 001-31650). | |
| 4.2 | Rights Agreement dated as of June 26, 2003, by and between the Registrant and Mellon Investor Services LLC, as Rights Agent, filed as Exhibit 4.1 to the Registrant’s Current Report on Form 8-K filed on July 1, 2003, is incorporated herein by reference (SEC File No. 001-31650). | |
| 4.3 | First Amendment to Rights Agreement, dated as of December 6, 2004, by and between the Registrant and Mellon Investor Services LLC, filed as Exhibit 4.4 to the Registrant’s Current Report on Form 8-K filed on December 8, 2004, is incorporated herein by reference (SEC File No. 001-31650). | |
| 4.4 | Second Amendment to Rights Agreement, dated as of June 16, 2008, by and between the Registrant and Mellon Investor Services LLC, filed as Exhibit 4.1 to the Registrant’s Current Report on Form 8-K filed on June 18, 2008, is incorporated herein by reference (SEC File No. 000-50499). | |
| 4.5 | Section 382 Rights Agreement, dated as of August 9, 2009, between the Registrant and Mellon Investor Services LLC, filed as Exhibit 4.1 to the Registrant’s Current Report on Form 8-K filed on August 10, 2009, is incorporated herein by reference (SEC File No. 001-31650). | |
| 4.6 | Common Stock Purchase Warrant dated June 27, 2003, filed as Exhibit 4.5 to the Registrant’s Registration Statement on Form S-3, is incorporated herein by reference (Registration Statement No. 333-109523). |
85
| 4.7 | Registration Rights Agreement dated as of June 27, 2003, by and between the Registrant and Conexant Systems, Inc., filed as Exhibit 4.6 to the Registrant’s Registration Statement on Form S-3 (Registration Statement No. 333-109523), is incorporated herein by reference. | |
| 4.8 | Indenture, dated as of August 1, 2008, between the Registrant and Wells Fargo Bank, N.A., filed as Exhibit 4.1 to the Registrant’s Current Report on Form 8-K filed on August 4, 2008, is incorporated herein by reference (SEC File No. 001-31650). | |
| 4.9 | Form of 6.50% Convertible Senior Notes due 2013, attached as Exhibit A to the Indenture (Exhibit 4.8 hereto), is incorporated herein by reference. | |
| 10.1 | Distribution Agreement dated as of June 27, 2003, by and between Conexant Systems, Inc. and the Registrant, filed as Exhibit 2.1 to the Registrant’s Current Report on Form 8-K filed on July 1, 2003, is incorporated herein by reference (SEC File No. 001-31650). | |
| 10.2 | Employee Matters Agreement dated as of June 27, 2003, by and between Conexant Systems, Inc. and the Registrant, filed as Exhibit 2.2 to the Registrant’s Current Report on Form 8-K filed on July 1, 2003, is incorporated herein by reference (SEC File No. 001-31650). | |
| 10.3 | Amendment No. 1 to Employee Matters Agreement dated as of June 27, 2003, by and between Conexant Systems, Inc. and the Registrant, dated January 13, 2005, filed as Exhibit 10.3 to the Registrant’s Annual Report on Form 10-K for the fiscal year ended September 30, 2005, is incorporated herein by reference (SEC File No. 000-50499). | |
| 10.4 | Amendment No. 2 to Employee Matters Agreement dated as of June 27, 2003, by and between Conexant Systems, Inc. and the Registrant, dated July 1, 2005, filed as Exhibit 10.4 to the Registrant’s Annual Report on Form 10-K for the fiscal year ended September 30, 2005, is incorporated herein by reference (SEC File No. 000-50499). | |
| 10.5 | Amendment No. 3 to Employee Matters Agreement dated as of June 27, 2003, by and between Conexant Systems, Inc. and the Registrant, dated January 9, 2006, filed as Exhibit 10.2 to the Registrant’s Quarterly Report on Form 10-Q for the fiscal quarter ended December 31, 2005, is incorporated herein by reference (SEC File No. 000-50499). | |
| 10.6 | Tax Allocation Agreement dated as of June 27, 2003, by and between Conexant Systems, Inc. and the Registrant, filed as Exhibit 2.3 to the Registrant’s Current Report on Form 8-K filed on July 1, 2003, is incorporated herein by reference (SEC File No. 001-31650). | |
| 10.7 | Lease, dated March 23, 2010, by and between the Registrant and 4000 MacArthur L.P., filed as Exhibit 10.5 to the Registrant’s Quarterly Report on Form 10-Q for the quarter ended April 2, 2010, is incorporated herein by reference (SEC File No. 001-31650). | |
| 10.8 | First Amendment to Lease, dated as of September 10, 2010, by and between the Registrant and 4000 MacArthur L.P., filed as Exhibit 10.11 to the Registrant’s Annual Report on Form 10-K for the fiscal year ended October 1, 2010, is incorporated herein by reference (SEC File No. 001-31650). | |
| 10.9 | Second Amendment to Lease, dated as of January 25, 2011, by and between the Registrant and 4000 MacArthur L.P., filed as Exhibit 10.3 to the Registrant’s Quarterly Report on Form 10-Q for the fiscal quarter ended April 1, 2011, is incorporated herein by reference (SEC File No. 001-31650). | |
| *10.10 | Form of Employment Agreement of the Registrant, filed as Exhibit 10.9 to the Registrant’s Annual Report on Form 10-K for the fiscal year ended October 3, 2008, is incorporated herein by reference (SEC File No. 001-31650). | |
| *10.11 | Schedule identifying parties to and terms of agreements with the Registrant substantially identical to the form of Employment Agreement filed as Exhibit 10.10 hereto. | |
| *10.12 | Form of Employment Agreement of the Registrant, filed as Exhibit 10.5 to the Registrant’s Quarterly Report on Form 10-Q for the fiscal quarter ended July 3, 2009, is incorporated herein by reference (SEC File No. 001-31650). | |
| *10.13 | Schedule identifying parties to and terms of agreements with the Registrant substantially identical to the form of Employment Agreement filed as Exhibit 10.12 hereto. |
86
| *10.14 | Form of Indemnification Agreement entered into between the Registrant and each of its Executive Officers and Directors, filed as Exhibit 10.1 to the Registrant’s Current Report on Form 8-K filed on May 27, 2011, is incorporated herein by reference (SEC File No. 001-31650). | |
| *10.15 | Mindspeed Technologies, Inc. 2003 Stock Option Plan, as amended and restated, filed as Exhibit 10.7 to the Registrant’s Quarterly Report on Form 10-Q for the fiscal quarter ended June 27, 2008, is incorporated herein by reference (SEC File No. 001-31650). | |
| *10.16 | Mindspeed Technologies, Inc. 2003 Long-Term Incentives Plan, as amended and restated, filed as Exhibit 10.1 to the Registrant’s Current Report on Form 8-K filed on April 8, 2011, is incorporated herein by reference (SEC File No. 001-31650). | |
| *10.17 | Form of Stock Option Award under the Mindspeed Technologies, Inc. 2003 Long-Term Incentives Plan, filed as Exhibit 10.4 to the Registrant’s Quarterly Report on Form 10-Q for the fiscal quarter ended July 1, 2005, is incorporated herein by reference (SEC File No. 000-50499). | |
| *10.18 | Stock Option Terms and Conditions under the Mindspeed Technologies, Inc. 2003 Long-Term Incentives Plan, filed as Exhibit 10.3 to the Registrant’s Quarterly Report on Form 10-Q for the fiscal quarter ended April 3, 2009, is incorporated herein by reference (SEC File No. 001-31650). | |
| *10.19 | Form of Restricted Stock Award under the Mindspeed Technologies, Inc. 2003 Long-Term Incentives Plan, filed as Exhibit 10.6 to the Registrant’s Quarterly Report on Form 10-Q for the fiscal quarter ended July 1, 2005, is incorporated herein by reference (SEC File No. 000-50499). | |
| *10.20 | Restricted Stock Terms and Conditions under the Mindspeed Technologies, Inc. 2003 Long-Term Incentives Plan, filed as Exhibit 10.19 to the Registrant’s Annual Report on Form 10-K for the fiscal year ended October 1, 2004, is incorporated herein by reference (SEC File No. 001-31650). | |
| *10.21 | Form of Restricted Stock Unit Award under the Mindspeed Technologies, Inc. 2003 Long-Term Incentives Plan, filed as Exhibit 10.20 to the Registrant’s Annual Report on Form 10-K for the fiscal year ended October 3, 2008, is incorporated herein by reference (SEC File No. 001-31650). | |
| *10.22 | Restricted Stock Unit Terms and Conditions under the Mindspeed Technologies, Inc. 2003 Long-Term Incentives Plan, filed as Exhibit 10.21 to the Registrant’s Annual Report on Form 10-K for the fiscal year ended October 3, 2008, is incorporated herein by reference (SEC File No. 001-31650). | |
| *10.23 | Form of Unrestricted Stock Award under the Mindspeed Technologies, Inc. 2003 Long-Term Incentives Plan, filed as Exhibit 10.4 to the Registrant’s Current Report on Form 8-K filed on March 15, 2010, is incorporated herein by reference (SEC File No. 001-31650). | |
| *10.24 | Unrestricted Stock Terms and Conditions under the Mindspeed Technologies, Inc. 2003 Long-Term Incentives Plan, filed as Exhibit 10.3 to the Registrant’s Current Report on Form 8-K filed on March 15, 2010, is incorporated herein by reference (SEC File No. 001-31650). | |
| *10.25 | Mindspeed Technologies, Inc. Employee Stock Purchase Plan, filed as Exhibit 10.2 to the Registrant’s Current Report on Form 8-K filed on March 15, 2010, is incorporated herein by reference (SEC File No. 001-31650). | |
| *10.26 | Form of Grant Letter and Mindspeed Technologies, Inc. Non-Qualified Stock Option Award Agreement, filed as Exhibit 4.12 to the Registrant’s Registration Statement on Form S-8, is incorporated herein by reference (Registration Statement No. 333-165875). | |
| *10.27 | Form of Grant Letter and Mindspeed Technologies, Inc. Restricted Stock Award Agreement, filed as Exhibit 4.13 to the Registrant’s Registration Statement on Form S-8, is incorporated herein by reference (Registration Statement No. 333-165875). | |
| *10.28 | Mindspeed Technologies, Inc. Directors Stock Plan, as amended and restated, filed as Exhibit 10.31 to the Registrant’s Annual Report on Form 10-K for the fiscal year ended October 1, 2010, is incorporated herein by reference (SEC File No. 001-31650). | |
| *10.29 | Form of Stock Option Award under the Mindspeed Technologies, Inc. Directors Stock Plan, filed as Exhibit 10.7 to the Registrant’s Quarterly Report on Form 10-Q for the fiscal quarter ended July 1, 2005, is incorporated herein by reference (SEC File No. 000-50499). |
87
| *10.30 | Stock Option Terms and Conditions under the Mindspeed Technologies, Inc. Directors Stock Plan, filed as Exhibit 10.33 to the Registrant’s Annual Report on Form 10-K for the fiscal year ended October 1, 2010, is incorporated herein by reference (SEC File No. 001-31650). | |
| *10.31 | Form of Restricted Shares Award under the Mindspeed Technologies, Inc. Directors Stock Plan, filed as Exhibit 10.1 to the Registrant’s Quarterly Report on Form 10-Q for the fiscal quarter ended March 31, 2006, is incorporated herein by reference (SEC File No. 000-50499). | |
| *10.32 | Restricted Shares Terms and Conditions under the Mindspeed Technologies, Inc. Directors Stock Plan, filed as Exhibit 10.2 to the Registrant’s Quarterly Report on Form 10-Q for the fiscal quarter ended March 31, 2006, is incorporated herein by reference (SEC File No. 000-50499). | |
| *10.33 | Form of Restricted Stock Unit Award under the Mindspeed Technologies, Inc. Directors Stock Plan, filed as Exhibit 10.2 to the Registrant’s Current Report on Form 8-K filed on April 11, 2008, is incorporated herein by reference (SEC File No. 000-50499). | |
| *10.34 | Restricted Stock Unit Terms and Conditions under the Mindspeed Technologies, Inc. Directors Stock Plan, filed as Exhibit 10.37 to the Registrant’s Annual Report on Form 10-K for the fiscal year ended October 1, 2010, is incorporated herein by reference (SEC File No. 001-31650). | |
| *10.35 | Summary of Director Compensation Arrangements, filed as Exhibit 10.38 to the Registrant’s Annual Report on Form 10-K for the fiscal year ended October 1, 2010, is incorporated by herein reference (SEC File No. 001-31650). | |
| *10.36 | Summary of Senior Vice President, Worldwide Sales, Cash Bonus Arrangement, filed as Exhibit 10.7 to the Registrant’s Quarterly Report on Form 10-Q for the fiscal quarter ended July 1, 2011, is incorporated herein by reference (SEC File No. 001-31650). | |
| *10.37 | Summary of Mindspeed Technologies, Inc. Fiscal Year 2011 Cash Bonus Plan, as set forth in the Registrant’s Current Report on Form 8-K filed on January 27, 2011, is incorporated herein by reference (SEC File No. 001-31650). | |
| *+10.38 | Confidential Severance and General Release Agreement, effective August 13, 2010, by and between the Registrant and Ron Cates, filed as Exhibit 10.44 to the Registrant’s Annual Report on Form 10-K for the fiscal year ended October 1, 2010, is incorporated herein by reference (SEC File No. 001-31650). | |
| *10.39 | Mindspeed Technologies, Inc. Indemnification Agreement, dated May 6, 2011, by and between Kristen M. Schmidt and the Registrant filed as Exhibit 10.1 to the Registrant’s Current Report on Form 8-K filed May 18, 2011, is incorporated herein by reference (SEC File No. 001-31650). | |
| *+10.40 | Confidential Severance and General Release Agreement effective May 21, 2011, by and between the Registrant and Anil Mankar, filed as Exhibit 10.4 to the Registrant’s Quarterly Report on Form 10-Q for the fiscal quarter ended July 1, 2011, is incorporated herein by reference (SEC File No. 001-31650). | |
| *10.41 | Termination Agreement effective May 6, 2011, by and between the Registrant and Bret W. Johnsen, filed as Exhibit 10.8 to the Registrant’s Quarterly Report on Form 10-Q for the fiscal quarter ended July 1, 2011, is incorporated herein by reference (SEC File No. 001-31650). | |
| 10.42 | Standstill and Voting Agreement, effective as of January 5, 2011, by and between the Registrant, Artis Capital Management, L.P., and certain other direct and beneficial holders of the Registrant’s Common Stock, filed as Exhibit 10.1 to the Registrant’s Current Report on Form 8-K filed on January 10, 2011, is incorporated herein by reference (SEC File No. 001-31650). | |
| 12.1 | Statement re: Computation of Ratios. | |
| 21 | List of subsidiaries of the Registrant. | |
| 23 | Consent of independent registered public accounting firm. | |
| 24 | Power of attorney, authorizing certain persons to sign this Annual Report on Form 10-K on behalf of certain directors and officers of the Registrant. | |
| 31.1 | Certification of Chief Executive Officer Pursuant to Section 302 of the Sarbanes-Oxley Act of 2002. |
88
| 31.2 | Certification of Chief Financial Officer Pursuant to Section 302 of the Sarbanes-Oxley Act of 2002. | |
| 32.1 | Certification of Chief Executive Officer Pursuant to Section 906 of the Sarbanes-Oxley Act of 2002. | |
| 32.2 | Certification of Chief Financial Officer Pursuant to Section 906 of the Sarbanes-Oxley Act of 2002. | |
| 101.INS** | XBRL Instance Document | |
| 101.SCH** | XBRL Taxonomy Extension Schema Document | |
| 101.CAL** | XBRL Taxonomy Extension Calculation Linkbase Document | |
| 101.DEF** | XBRL Taxonomy Extension Definition Linkbase | |
| 101.LAB** | XBRL Taxonomy Extension Label Linkbase Document | |
| 101.PRE** | XBRL Taxonomy Extension Presentation Linkbase Document | |
| * | Management contract or compensatory plan or arrangement. |
| + | Certain confidential portions of this exhibit have been omitted pursuant to a grant of confidential treatment. Omitted portions have been filed separately with the SEC. |
| ** | Pursuant to applicable securities laws and regulations, we are deemed to have complied with the reporting obligation relating to the submission of interactive data files in such exhibits and are not subject to liability under any anti-fraud provisions of the federal securities laws as long as we have made a good faith attempt to comply with the submission requirements and promptly amend the interactive data files after becoming aware that the interactive data files fail to comply with the submission requirements. Users of this data are advised that, pursuant to Rule 406T, these interactive data files are deemed not filed and otherwise are not subject to liability. |
(b) Exhibits
See subsection (a) (3) above.
(c) Financial Statement Schedules
The financial statement schedule for Mindspeed Technologies, Inc. is set forth in (a) (2) of Item 15 above.
89
SIGNATURES
Pursuant to the requirements of Section 13 or 15(d) of the Securities Exchange Act of 1934, the registrant has duly caused this Annual Report on Form 10-K to be signed on its behalf by the undersigned, thereunto duly authorized, in the City of Newport Beach, State of California, on this 18th day of November, 2011.
| MINDSPEED TECHNOLOGIES, INC. | ||
| By: |
/s/ RAOUF Y. HALIM | |
| Raouf Y. Halim | ||
| Chief Executive Officer | ||
Pursuant to the requirements of the Securities Exchange Act of 1934, this report has been signed below on the 18th day of November, 2011, by the following persons on behalf of the registrant and in the capacities indicated:
| Signature |
Title | |
| /S/ RAOUF Y. HALIM Raouf Y. Halim |
Chief Executive Officer and Director (Principal Executive Officer) | |
| /S/ STEPHEN N. ANANIAS Stephen N. Ananias |
Senior Vice President and Chief Financial Officer (Principal Financial and Accounting Officer) | |
| /S/ DWIGHT W. DECKER* Dwight W. Decker |
Chairman of the Board of Directors | |
| /S/ ROBERT J. CONRAD* Robert J. Conrad* |
Director | |
| /S/ MICHAEL T. HAYASHI* Michael T. Hayashi* |
Director | |
| /S/ MING LOUIE* Ming Louie |
Director | |
| /S/ THOMAS A. MADDEN* Thomas A. Madden |
Director | |
| /S/ JERRE L. STEAD* Jerre L. Stead* |
Director | |
| *By: | /S/ RAOUF Y. HALIM | |
| Raouf Y. Halim, | ||
| Attorney-in-Fact** | ||
| ** | By authority of the power of attorney filed as Exhibit 24 hereto. |
90
SCHEDULE II
VALUATION AND QUALIFYING ACCOUNTS
| Description |
Balance at Beginning of Year |
Additions Charged to Costs and Expenses |
Deductions(1) | Balance at End of Year |
||||||||||||
| (In thousands) | ||||||||||||||||
| Year ended September 30, 2011: |
||||||||||||||||
| Allowance for doubtful accounts |
$ | 189 | $ | 187 | $ | — | $ | 376 | ||||||||
| Reserve for sales returns and allowances |
1,240 | 163 | (127 | ) | 1,276 | |||||||||||
| Year ended October 1, 2010: |
||||||||||||||||
| Allowance for doubtful accounts |
$ | 144 | $ | 45 | $ | — | $ | 189 | ||||||||
| Reserve for sales returns and allowances |
1,168 | 252 | (180 | ) | 1,240 | |||||||||||
| Year ended October 2, 2009: |
||||||||||||||||
| Allowance for doubtful accounts |
$ | 342 | $ | (11 | ) | $ | (187 | ) | $ | 144 | ||||||
| Reserve for sales returns and allowances |
1,555 | 417 | (804 | ) | 1,168 | |||||||||||
| (1) | Deductions in the allowance for doubtful accounts reflect amounts written off. |
91
EXHIBIT INDEX
| 10.11 | Schedule identifying parties to and terms of agreement with the Registrant substantially identical to the Form of Employment Agreement filed as Exhibit 10.10 hereto. | |
| 10.13 | Schedule identifying parties to and terms of agreements with the Registrant substantially identical to the form of Employment Agreement filed as Exhibit 10.12 hereto. | |
| 12.1 | Statement re: Computation of Ratios. | |
| 21 | List of subsidiaries of the Registrant. | |
| 23 | Consent of independent registered public accounting firm. | |
| 24 | Power of attorney, authorizing certain persons to sign this Annual Report on Form 10-K on behalf of certain directors and officers of the Registrant. | |
| 31.1 | Certification of Chief Executive Officer Pursuant to Section 302 of the Sarbanes-Oxley Act of 2002. | |
| 31.2 | Certification of Chief Financial Officer Pursuant to Section 302 of the Sarbanes-Oxley Act of 2002. | |
| 32.1 | Certification of Chief Executive Officer Pursuant to Section 906 of the Sarbanes-Oxley Act of 2002. | |
| 32.2 | Certification of Chief Financial Officer Pursuant to Section 906 of the Sarbanes-Oxley Act of 2002. | |
| 101.INS** | XBRL Instance Document | |
| 101.SCH** | XBRL Taxonomy Extension Schema Document | |
| 101.CAL** | XBRL Taxonomy Extension Calculation Linkbase Document | |
| 101.DEF** | XBRL Taxonomy Extension Definition Linkbase | |
| 101.LAB** | XBRL Taxonomy Extension Label Linkbase Document | |
| 101.PRE** | XBRL Taxonomy Extension Presentation Linkbase Document | |
| ** | Pursuant to applicable securities laws and regulations, we are deemed to have complied with the reporting obligation relating to the submission of interactive data files in such exhibits and are not subject to liability under any anti-fraud provisions of the federal securities laws as long as we have made a good faith attempt to comply with the submission requirements and promptly amend the interactive data files after becoming aware that the interactive data files fail to comply with the submission requirements. Users of this data are advised that, pursuant to Rule 406T, these interactive data files are deemed not filed and otherwise are not subject to liability. |
92