Attached files
| file | filename |
|---|---|
| 8-K - ESSEX PROPERTY TRUST INC 8-K 11-16-2011 - ESSEX PROPERTY TRUST, INC. | form8k.htm |
Exhibit 99.1
Reveal (formerly Millenium at Warner Center) - Los Angeles, CA
2011 NAREIT REIT World
November 15-17, 2011
At IPO, Essex owned 16 multifamily properties (4,410 units); currently, Essex has ownership
in 155 apartment communities (32,076 units)
in 155 apartment communities (32,076 units)
§ Multifamily REIT dedicated to supply-constrained markets
- Formed in 1971
- Initial Public Offering in June 1994
• IPO stock price was $19.50 a share
• Today the stock trades around $134 per share
§ Highest total return of any REIT since IPO - 1,834% (Source: SNL Financial)
§ Cumulative Dividend paid in excess of $50 per share since IPO
§ Consistent operating philosophy through numerous market cycles
- Research-based strategy
- Rigorous underwriting leveraging real-time platform operating data
- Total return driven
§ Experienced management team - top executives have worked together for an average
tenure of 18+ years
2
About Essex Property Trust

20-34 Year Olds - Lost Fewer Jobs in 2008 -2009, recovering faster
Echo Boomers will Drive Demand with Higher Propensity to Rent
* Through September 2011
Sources: Marcus & Millichap Research Services, BLS
Multifamily Fundamental Drivers
* Source: Green Street Advisors

Major Decline in For-Sale Housing Supply
New Home Sales and Recessions
4
Easy Financing Converted
Renters to Homeowners
Residential Supply Distortion

§ West Coast recovered later, implying rent growth has greater
upside potential
§ Better than average job growth prospects, especially in
technology related industries
§ Most desirable locations due to quality of life
§ New supply remains muted, <1% annual addition to residential
stock in Essex markets
§ Demographic tailwinds of retirees and 'echo boomers‘
expected to increase renter demand
Essex expects market rents for its portfolio to increase 28% over the next 5
years.
years.
Economic Assumptions
§ Moderate U.S. GDP Growth 2.8% annual average
§ Moderate U.S. Job Growth 1.7% annual average
§ 3.5% CPI Growth
Why Essex is Maintaining the West Coast Focus?
5

Drivers of strong continued demand in Essex markets
§ California and Washington combined are the 6th largest economy in the world
§ 52% of Venture Capital spending is in our markets - key driver of growth industries & jobs
§ Incoming Echo Boomers (64 million) & quality of life factors favor the West Coast
§ Higher percentage of educated workers
The West Coast is Well-Positioned
6

California Population Trends on the Rebound
California Job Growth now outpacing US Trend
Drivers of Renter Demand - Population & Jobs
|
Source: US Census
|
|
Source: BLS
|
7

September 2009**
Most state economies are doing poorly (red = declining)
West Coast economies are recovering
The West Coast Recovery is Underway
8
Snapshots of FRB of Philadelphia Coincident Index*
* The FRB of Philadelphia publishes its monthly coincident index as an indicator of the economic health of each state
**Represents 3 month change in index
September 2011**

September Y-Y Job Growth: Selected Metros by % Growth
(000’s)
9
|
Source: BLS
|
§ Tech/ Energy based markets are leading the way
§ Positive growth spreading across the country
Strong MSA Job Growth in Essex Portfolio
Job Growth: 1.6 million jobs created in U.S. and 130,000 in Essex markets

10
Education Data for Essex Counties & State/U.S. Data
§ Essex’s tech markets have a significantly higher percentage of college
educated workers.
§ These markets should continue to lead job growth
§ Concentrated in the highest skilled California counties
|
Source: U.S. Census
|
Essex Attracts Higher Wage Renters
Job Growth by Level of Education
§ BLS Household survey indicates the number of employed up 1.24 million Year-
over-Year for September 2011 of which 978,000 were in the group Age
over-Year for September 2011 of which 978,000 were in the group Age
25+ with a College degree.

11
§ High Single-Family Prices Restrict Homeownership
§ Despite the fall in home prices since 2008, prices remain high in
supply-constrained markets
|
Source: National Association of Realtors, Dataquick, Essex
|
Homeownership is not Affordable

12
Conclusions:
§ Single family supply is low everywhere currently
§ When single family supply recovers, we expect a sharp rebound in the
non-constrained markets
§ The supply constrained coastal rental markets will have less
competition from for-sale as compared to 2003 - 2007
|
Source: U.S. Census
|
Essex Supply Risk Low

Class ‘B’ Vacancy Rates are Low in Supply- Constrained Markets
Vacancy Rate Spread by Class (selected metros)
13
* All vacancies as of 2Q 2011
Sources: Marcus & Millichap Research Services, Reis
Superior Class ‘B’ Occupancy in Essex Markets

§ To Grow FFO/share consistent with NAV Growth
§ Focus on delivering growth from operations platform
§ Target acquisitions generating (at least an) unlevered return of 9%
§ Target development generating at least 10% unlevered returns and
for unfunded commitments to represent 5-7% of total capital
§ Target redevelopment generating unlevered returns of 8-10%
§ Actively upgrade the portfolio through investment and property
sales (up to 20% of portfolio identified as being potentially for sale
over the next several years.)
Essex Intermediate Goals
14

Total Return Since IPO
*Total Return as of June 7, 1994 to November 8, 2011
Performance Record
15
Top 10 REITs by Total Return*
|
1
|
Essex Property Trust, Inc.
|
1,834
|
|
2
|
Public Storage
|
1,616
|
|
3
|
Taubman Centers, Inc.
|
1,549
|
|
4
|
AvalonBay Communities, Inc.
|
1,489
|
|
5
|
Realty Income Corporation
|
1,439
|
|
6
|
Simon Property Group, Inc.
|
1,206
|
|
7
|
Tanger Factory Outlet Centers
|
1,175
|
|
8
|
First REIT of New Jersey
|
1,132
|
|
9
|
Vornado Realty Trust
|
1,041
|
|
10
|
EastGroup Properties, Inc.
|
1,033
|

Seattle Market Review
Average Rent
as a % of
Median Household Income
(in 000’s)
Job Growth
vs.
Total Residential Supply
(% change)
Actual Job Growth by Sector:
Sept. ‘11 vs. Sept. ‘10
Source: Essex, U.S. Census, BLS
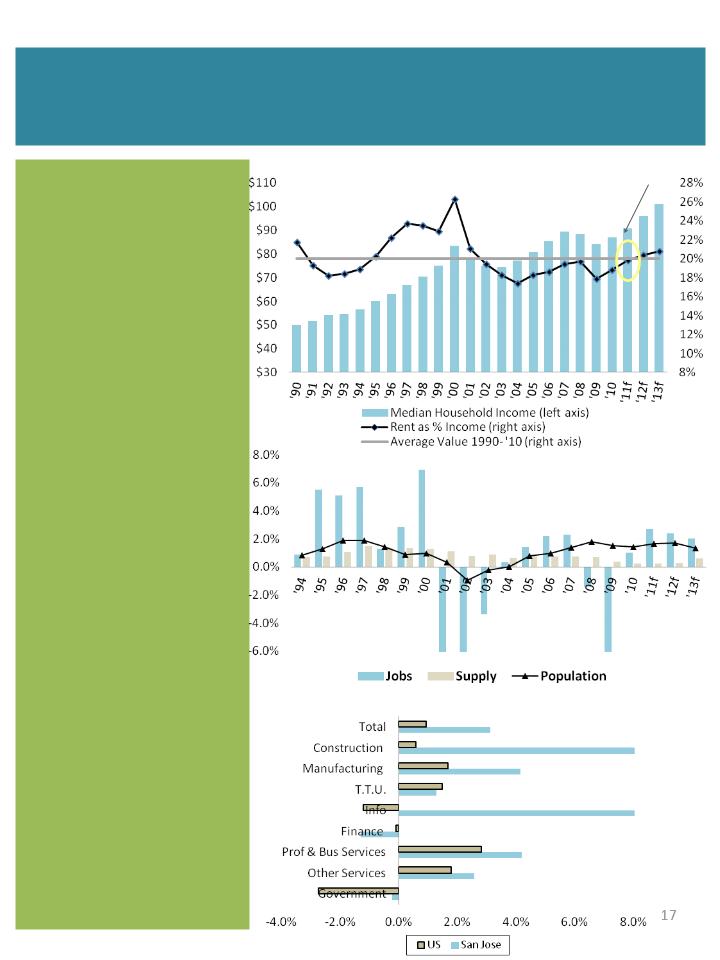
Northern California Market Review
(San Jose MSA Example)
Average Rent
as a % of
Median Household Income
(in 000’s)
Job Growth
vs.
Total Residential Supply
(% change)
Actual Job Growth by Sector:
Sept. ‘11 vs. Sept. ‘10
Gap = 3% of
current rents
current rents
Source: Essex, U.S. Census, BLS

Southern California Market Review
(Los Angeles MSA Example)
Average Rent
as a % of
Median Household Income
(in 000’s)
Job Growth
vs.
Total Residential Supply
(% change)
Actual Job Growth by Sector:
Sept. ‘11 vs. Sept. ‘10
Gap = 9.6% of
current rents
current rents
Source: Essex, U.S. Census, BLS
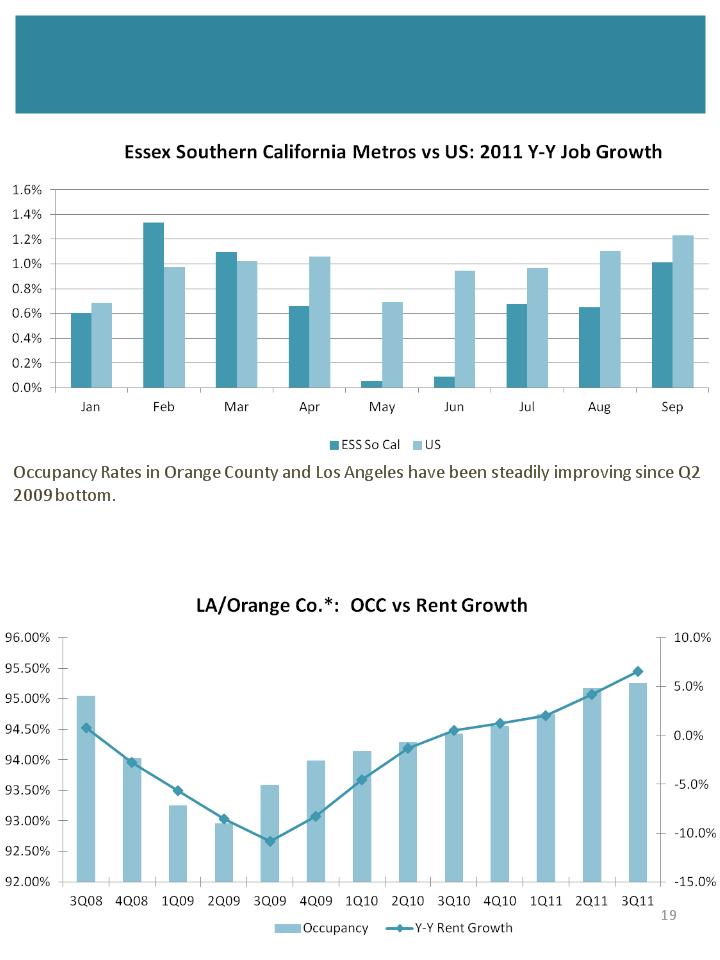
Southern California Market Review
Occupancy breaks through 95% for both markets for the first time since q4 2007.
Essex believes with occupancy rates above 95% pricing power shifts to the landlord
|
Source: BLS
|
|
Source: Axiometrics
|
|
*LA/Orange Numerical Average
|

Multiple Investment Platforms
§ Development
- Upgrading the portfolio
- Over the past 25-years, we have delivered over 8,500 units through our
development program
§ Acquisitions
- Accelerating portfolio growth
- Improving cash flows and total per share returns
- Targeting markets with high rent growth potential
- Since 2010, Essex has acquired $1.5 billion of high quality and well-located
properties
§ Redevelopment
- Repositioning the portfolio and augmenting internal growth
- Capitalizing on the strategy of owning Class B quality assets in “A” locations
§ Co-Investments & Preferred Equity Investments
- Diversifying capital sources
- Enhancing risk adjusted returns
- Moderating portfolio volatility
20

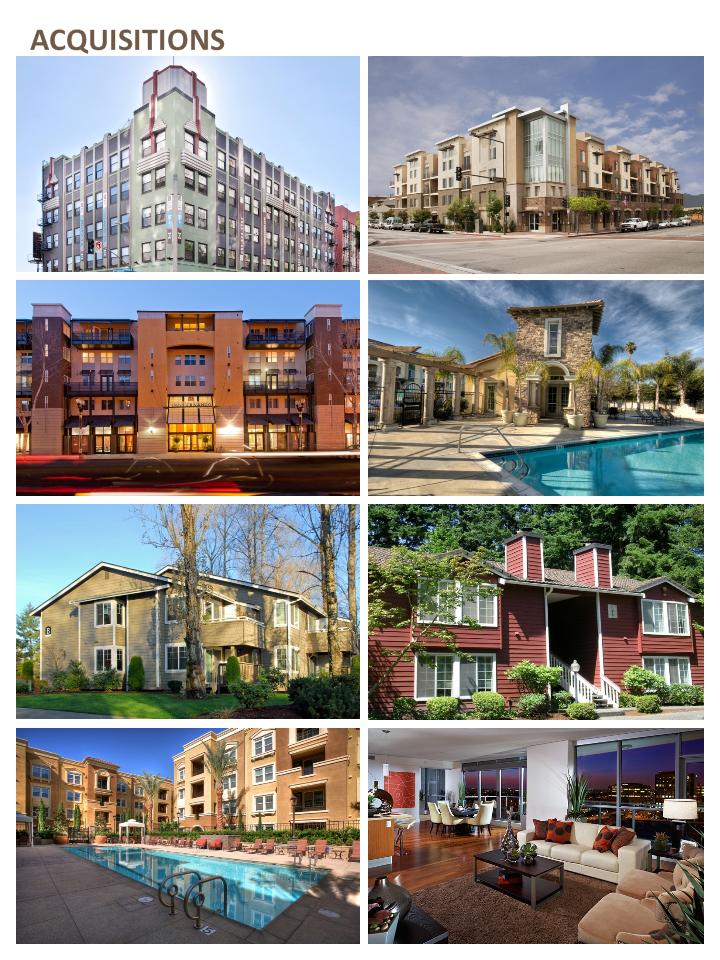
INVESTMENT ACTIVITY
Since January 2010, Essex has acquired or committed to develop $1.5 billion in new investments
|
1
|
Corbella (169 units)
|
$23.8
|
$1,045
|
|
2
|
Elevation (157 units)
|
$22.4
|
$1,141
|
|
3
|
Courtyard off Main (109 units)
|
$30.1
|
$1,601
|
|
4
|
Joule (295 units)
|
$85.4
|
$1,548
|
|
5
|
The Bernard (63 units)
|
$15.0
|
$1,335
|
|
6
|
Redmond Hill (882 units)
|
$151.3
|
$1,136
|
|
7
|
Queen Anne (275 units)
|
$79.1
|
-
|
|
8
|
Fourth & U (171 units)
|
$62.3
|
$1,676
|
|
9
|
Family Tree (121 units)
|
$31.6
|
$1,580
|
|
10
|
The Commons (264 units)
|
$45.2
|
$1,320
|
|
11
|
101 San Fernando (323 units)
|
$65.4
|
$1,690
|
|
12
|
Bella Villagio (231 units)
|
$58.4
|
$1,746
|
|
13
|
Via (284 units)
|
$112.0
|
$2,215
|
|
14
|
Cadence Phase I (280 units)
|
$98.6
|
-
|
|
15
|
West Dublin (309 units)
|
$94.5
|
-
|
Seattle Area
Northern
California
California
Southern
California
California
21
1
2
3
4
5
6
8
9
10
11
12
13
14
15
16
17
18
19
20
21
22
23
24
25
26
Acquisitions
Development
Preferred Equity Investments/ Co-investments
Cost
(in millions)
Avg.
Rent
7
Cost
(in millions)
Avg.
Rent
Cost
(in millions)
Avg.
Rent
|
16
|
Arbors at Parc Rose (373 units)
|
$92.0
|
$1,723
|
|
17
|
Muse (152 units)
|
$41.6
|
$1,764
|
|
18
|
Allegro (96 units)
|
$30.6
|
$2,262
|
|
19
|
416 on Broadway (115 units)
|
$43.0
|
$2,114
|
|
20
|
Santee Court (165 units)
|
$31.2
|
$1,345
|
|
21
|
Santee Village (73 units)
|
$19.0
|
$2,004
|
|
22
|
Anavia (250 units)
|
$84.8
|
$2,112
|
|
23
|
Skyline (349 units)
|
$134.3
|
$3,046
|
|
24
|
Bellerive (63 units)
|
$27.2
|
$2,738
|
|
25
|
Reveal (438 units)
|
$132.9
|
$1,991
|
|
26
|
Fountain at La Brea (187 units)
|
$74.7
|
-
|
Anavia - Anaheim, CA
101 San Fernando - San Jose, CA
Essex Skyline - Santa Ana, CA
22
416 on Broadway - Glendale, CA
Santee Court - Los Angeles, CA
Elevation - Redmond, WA
Bella Villagio - San Jose, CA
Corbella at Juanita Bay - Kirkland, WA

DEVELOPMENT TRACK RECORD
Over the past 25-years, we have delivered over 8,500 units through our development program
|
|
|
|
|
|
Estimated
Units |
|
Estimated retail
sq. feet |
|
Incurred to
Date |
|
Estimated
Total Cost |
|
Construction
Complete |
|
Project Name
|
|
Location
|
|
|
|
|
|
|
|
|
|
|
|
|
|
|
|
|
|
|
|
|
|
|
|
|
|
|
|
|
Via
|
|
Sunnyvale, CA
|
|
284
|
|
40,000
|
|
$101.2
|
|
$112.0
|
|
Oct-11
|
|
|
Queen Anne (JV)
|
|
Seattle, WA
|
|
275
|
|
17,000
|
|
$28.5 |
|
$79.1
|
|
Apr-13
|
|
|
West Dublin (JV)
|
|
Dublin, CA
|
|
309
|
|
-
|
|
$17.9
|
|
$94.5
|
|
Jun-13
|
|
|
Cadence - Phase I (JV)
|
|
San Jose, CA
|
|
280
|
|
-
|
|
$65.2 |
|
$98.6
|
|
Jul-13
|
|
|
Fountain at La Brea (JV)
|
|
West Hollywood, CA
|
|
187
|
|
18,200
|
|
$21.0
|
|
$74.7
|
|
Jan-14
|
|
|
Total Active Development Pipeline
|
|
1,335 |
|
75,200
|
|
$233.8 |
|
$458.9
|
|
|
||
ACTIVE DEVELOPMENT PIPELINE
(Dollars in Millions)
Via - Sunnyvale, CA
23

§ Capitalize on the strategy of owning Class B quality assets in “A” locations - supply
constraint in Essex markets results in older housing stock which leads to greater
renovation potential
§ Selective repositioning: rent justified improvements to maximize NOI and value
Highridge - Rancho Palos Verde, CA
255 units
$16.6 million renovation cost
$65,000 cost per unit
9.25% return
Redevelopment
Before
After
Before
After
The Pointe at Cupertino - Cupertino, CA
116 units
$8.0 million renovation cost
$69,000 cost per unit
9.5% return
REDEVELOPMENT
24

Fund & Joint Ventures
25
The co-investment program facilitates external growth via private capital,
provides a diversified source of equity and enhances risk adjusted returns.
This platform represents 18.2% of the units in Essex’s total portfolio.
Current Co-Investment Programs Consists of:
§ Fund II
- 14 well-positioned assets with dispositions beginning in 2012/2013
§ Programmatic Joint Ventures
- Wesco I - a 50/50 joint venture to acquire apartments. The joint
venture has invested $375 million to date.
- Canada Pension Plan Investment Board (“CPPIB”) - 55% Essex/45%
CPPIB joint venture to develop Cadence and West Dublin.
§ Single Asset Joint Venture
- Essex Skyline at MacArthur Place - a 50/50 joint venture to invest in a
349-unit high-rise condominium
§ Development Joint Ventures with Regional Developers:
- Queen Anne- a 50/50 joint venture to develop and operate a 275-unit
community.
community.
- Fountain at La Brea - a 50/50 joint venture to develop and operate a 187-
unit community.
unit community.

Essex is 30% leveraged on total market capitalization with a strong interest
coverage ratio of over 2.5x, staggered maturities and a BBB S&P corporate
rating.
coverage ratio of over 2.5x, staggered maturities and a BBB S&P corporate
rating.
Conservatively Proportioned and Flexible Balance Sheet
|
Cost of Debt
|
5.5%
|
4.9%
|
5.0%
|
5.3%
|
5.2%
|
4.9%
|
Debt Maturities
Consolidated Debt ($MM): $2,260 at 9/30/11, excludes lines of credit

2011 Guidance (updated November 2, 2011)
FFO Per Share Guidance
$5.66- $5.74
Same Property Revenue Growth (Midpoint)
3.9%
Same Property NOI Growth (Midpoint)
5.4%
Market Expectations
2011
2011
2011
Market
Market
Market
Job Growth
Rent Growth
Occupancy
Southern California
0.9%
4.8%
95.2%
Northern California
1.6%
9.7%
96.5%
Seattle Metro
2.0%
9.0%
95.5%
Weighted Average
1.2%
7.5%
95.8%
US Economic Assumptions
GDP Growth of 1.75%
Job Growth of 1.1%
Targeted Acquisitions
$450 million - $550 million
Targeted Development Investment
$263 million related to finishing Via, starting Queen Anne and the Cadence
Campus Phase I, West Dublin, and starting Fountain at La Brea
27

28
2011 Guidance Road Map

NOTES
___________________________
___________________________
___________________________
___________________________
___________________________
___________________________
___________________________
___________________________
___________________________
___________________________
___________________________
___________________________
___________________________
29

Via - Sunnyvale, CA
416 on Broadway - Glendale, CA
Joule - Seattle, WA
For additional information, please contact the Company’s
Investor Relations department at (650) 849-1600.
Investor Relations department at (650) 849-1600.
Fourth & U - Berkeley, CA
Axis 2300 - Irvine, CA
Arbors at Park Rose - Oxnard, CA