Attached files
| file | filename |
|---|---|
| 8-K - CURRENT REPORT OF MATERIAL EVENTS OR CORPORATE CHANGES - EAGLE ROCK ENERGY PARTNERS L P | a11-29832_28k.htm |
Exhibit 99.1
|
|
Building on Our Core RBC Capital Markets MLP Conference November 2011 |
|
|
2 This document may include "forward-looking statements." All statements, other than statements of historical facts, included in this press release that address activities, events or developments that the Partnership expects, believes or anticipates will or may occur in the future are forward-looking statements and speak only as of the date on which such statement is made. These statements are based on certain assumptions made by the Partnership based on its experience and perception of historical trends, current conditions, expected future developments and other factors it believes are appropriate under the circumstances. Such statements are subject to a number of assumptions, risks and uncertainties, many of which are beyond the control of the Partnership. These include risks related to volatility of commodity prices; market demand for natural gas and natural gas liquids; the effectiveness of the Partnership's hedging activities; the Partnership's ability to retain key customers; the Partnership's ability to continue to obtain new sources of natural gas supply; the availability of local, intrastate and interstate transportation systems and other facilities to transport natural gas and natural gas liquids; competition in the oil and gas industry; the Partnership's ability to obtain credit and access the capital markets; general economic conditions; and the effects of government regulations and policies. Should one or more of these risks or uncertainties occur, or should underlying assumptions prove incorrect, the Partnership's actual results and plans could differ materially from those implied or expressed by any forward-looking statements. The Partnership assumes no obligation to update any forward-looking statement as of any future date. For a detailed list of the Partnership's risk factors, please consult the Partnership's Form 10-K, filed with the Securities and Exchange Commission (“SEC”) for the year ended December 31, 2010, the Partnership’s Forms 10-Q, filed with the SEC for subsequent quarters, as well as any other public filings and press releases. Forward Looking Statements |
|
|
3 Jeffrey P. Wood Senior Vice President & Chief Financial Officer Adam K. Altsuler Director, Corporate Finance & Investor Relations Management Representatives |

|
|
Eagle Rock (NASDAQ: EROC) is a growth-oriented MLP engaged in the midstream and upstream businesses and is well-positioned to benefit from some of the most prolific producing basins in the U.S. Legen Midstream Processing Plants Midstream Gathering Systems Existing Areas of Operation (1) Equity value includes common units and warrants priced at their respective prices as of 11/4/11. (2) Calculated based on 3 months ended 9/30/11 Adjusted EBITDA times 4. (3) Based on segment operating income plus DD&A for the LTM ended 9/30/11 and excluding G&A. (4) Based on 9/30/11 LTM gross margin based on net equity volumes from Midstream Business and production volumes from Upstream Business and weighted average received prices for respective business segments and periods. Adjusted for Eustace processing facility shut-down and pro forma for Mid-Continent acquisition. 4 Eagle Rock Energy Partners, L.P. Snapshot Estimated Business Mix (3) Enterprise Value(1): $2.1 billion Annualized Adj. EBITDA(2): $248.8 million Q3 Leverage Ratio: 3.2x Total Company Commodity Mix (4) Oil / Condensate 48% NGLs 32% Natural Gas 20% Midstream 38% Upstream 62% |
|
|
Midstream Business (1) Strategically Located, Diversified Asset Base 5 5,482 miles of pipeline 19 processing plants 476 MMcf/d gathering volumes 6.7 MBbls/d equity NGLs / Condensate Upstream Business (2) 600 operated producing wells 385 Bcfe proved reserves 81.1 MMcfe/d net production 63% natural gas by reserves Upstream Business Mix (3) Midstream Business Mix (3) (1) Based on Q3 2011. (2) Pro forma reserves as of 12/31/10 based on SEC pricing as of 12/31/10. Net production based on Q3 average production. (3) Based on Q3 2011 operating income plus DD&A, excluding G&A and hedging impact. East Texas 17% Permian 7% South Texas 1% Alabama 30% Mid-Continent 45% GOM 3% East Texas / Louisiana 22% South Texas 1% Texas Panhandle 74% |
|
|
6 Delivering on Our Strategic Objectives Objective Status Create Platform to Grow Organically Recently announced Midstream projects capitalize on existing infrastructure Upstream properties contain over 680 gross identified drilling locations Deliver Outstanding Service to Our Midstream Producer Customers Adding new processing capacity in Granite Wash to accommodate growing volumes Enhance Liquidity and Balance Sheet Stability Over $225 million of liquidity on credit facility at September 30, 2011 New $675 million credit facility put in place in May 2011 with 2016 maturity Inaugural senior notes issuance of $300 million completed in May 2011 Mitigate Commodity Exposure Extensive hedging program covering approximately 80% of near-term volumes and extending through 2014 Majority of near-term NGL volumes hedged directly by product |
|
|
Positioning for Further Growth 7 Eagle Rock Has Substantially Improved Its Liquidity and Balance Sheet Stability (1) September 30, 2009 September 30, 2010 September 30, 2011 Enterprise Value: $1.1 billion Enterprise Value: $1.1 billion Enterprise Value: $2.0 billion Credit Facility Availability : ~$34 million Credit Facility Availability : ~$157 million Credit Facility Availability : ~$228 million 3-Mo. Avg. Daily Trading Value: ~$1.7 million 3-Mo. Avg. Daily Trading Value: ~$1.8 million 3-Mo. Avg. Daily Trading Value: ~$3.5 million (1) Equity value includes common units and warrants priced at their respective prices as of the respective periods. Credit Facility Borrowings 22% Senior Notes 15% Equity 62% Warrants 1% Credit Facility Borrowings 70% Equity 30% Credit Facility Borrowings 49% Equity 49% Warrants 2% |
|
|
Crude, Condensate and NGLs (>C2) (1) Prices shown reflect weighted average price of swaps and collar floors ($/Bbl and $/MMBtu) and exclude price impact of direct product hedges. Ethane and Natural Gas $75.23 $80.05 $96.66 $98.54 $5.96 $5.87 $5.22 $5.55 Avg. Strike Price (1) Robust Hedging Profile 8 NGL Exposure Hedged Directly Total Hedges in Place Ethane Exposure Hedged Directly Total Hedges in Place 75% 80% 80% 31% 59% 78% 0% 0% 0% 20% 40% 60% 80% 100% 2011 REM 2012 2013 2014 100% 80% 60% 40% 20% 0% 2011 REM 2012 2013 2014 102% 16% 85% 35% 67% 0% 26% 0% |
|
|
9 Delivering Value to Our Unitholders Improved Growth Profile and Capitalization Lead to Greater Unitholder Value Current Annualized Distribution Guidance ** ** Management's intentions around future distribution recommendations are subject to change, however, should factors affecting the general business climate, market conditions, commodity prices, the Partnership's specific operations, performance of the Partnership's underlying assets, applicable regulatory mandates, or the Partnership's ability to consummate accretive growth projects differ from current expectations. 25% Annualized Distribution per Unit $0.00 $0.25 $0.50 $0.75 $1.00 $0.60 $0.60 $0.75 $0.80 $1.00 4Q’10 1!’11 2Q’11 3Q’11 4Q’11 1Q’12 2Q’12 3Q’12 4Q’12 |
|
|
Midstream Business Overview Eagle Rock Energy Partners, L.P. RBC Capital Markets’ MLP Conference November 2011 |
|
|
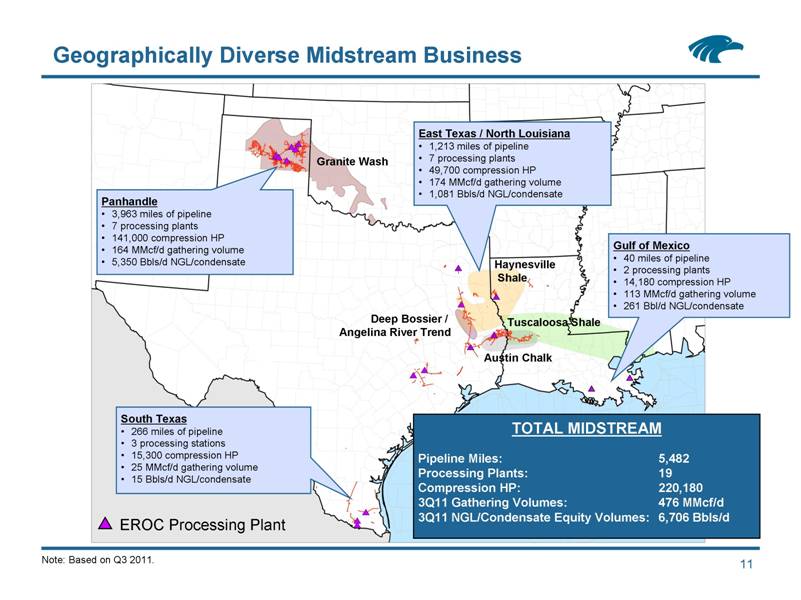
11 Geographically Diverse Midstream Business Panhandle 3,963 miles of pipeline 7 processing plants 141,000 compression HP 164 MMcf/d gathering volume 5,350 Bbls/d NGL/condensate East Texas / North Louisiana 1,213 miles of pipeline 7 processing plants 49,700 compression HP 174 MMcf/d gathering volume 1,081 Bbls/d NGL/condensate Gulf of Mexico 40 miles of pipeline 2 processing plants 14,180 compression HP 113 MMcf/d gathering volume 261 Bbl/d NGL/condensate EROC Processing Plant Haynesville Shale Austin Chalk Granite Wash South Texas 266 miles of pipeline 3 processing stations 15,300 compression HP 25 MMcf/d gathering volume 15 Bbls/d NGL/condensate Deep Bossier / Angelina River Trend TOTAL MIDSTREAM Pipeline Miles: 5,482 Processing Plants: 19 Compression HP: 220,180 3Q11 Gathering Volumes: 476 MMcf/d 3Q11 NGL/Condensate Equity Volumes: 6,706 Bbls/d Note: Based on Q3 2011. Tuscaloosa Shale 11 |
|
|
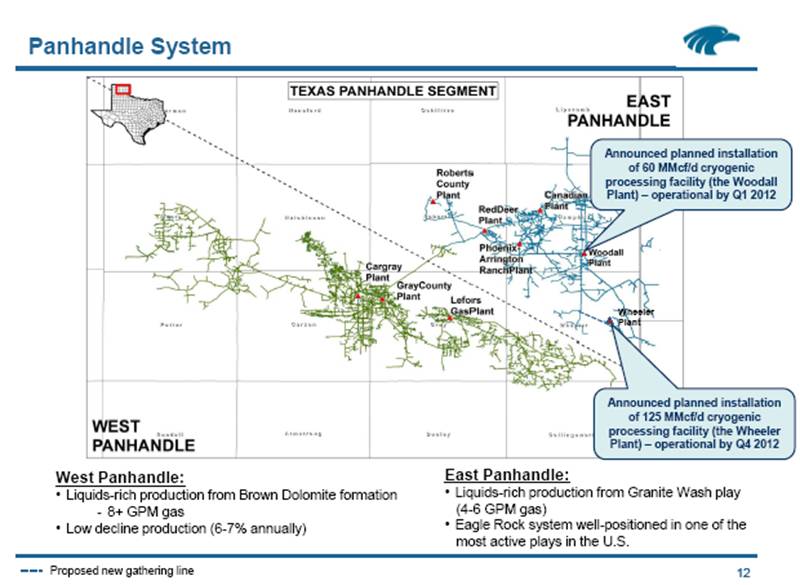
12 Panhandle System West Panhandle: Liquids-rich production from Brown Dolomite formation -8+ GPM gas Low decline production (6-7% annually) East Panhandle: Liquids-rich production from Granite Wash play (4-6 GPM gas) Eagle Rock system well-positioned in one of the most active plays in the U.S. Announced planned installation of 60 MMcf/d cryogenic processing facility (the Woodall Plant) – operational by Q1 2012 Announced planned installation of 125 MMcf/d cryogenic processing facility (the Wheeler Plant) – operational by Q4 2012 Wheeler Plant Proposed new gathering line |
|
|
13 Leading Midstream Company in the Granite Wash Superior Economics Driving Production Growth (1) Based on Hart Energy and Rystad Energy research. (2) Based on Credit Suisse estimates, using $90 per Bbl oil, excluding land costs. Stacked Pay Zones Improve Economics Granite Wash Daily Production (1) $ / MMbtu Other(s) Unit Corporation Penn Virginia Cimarex Energy QEP Resources Chesapeake Forest Oil Apache Devon Energy Newfield Exploration Linn Energy NYMEX Break-Even Economics (15% After-Tax IRR) (2) $0.00 $0.00 $0.00 $1.47 $2.37 $3.09 $3.23 $3.53 $3.61 $3.75 $3.86 $3.87 $4.12 $4.20 $4.55 $4.58 $4.64 $5.24 $5.31 $5.53 $6.65 $6.76 $6.87 $0.00 $1.00 $2.00 $3.00 $4.00 $5.00 $6.00 $7.00 0 0.5 1 1.5 2 2.5 3 3.5 2007 2008 2009 2010 2011 2012 2013 2014 2015 2016 2017 2018 2019 2020 Bcfe/d |
|
|
The Granite Wash Fairway 14 Eagle Rock is Well-Positioned to Serve Growing Production Volumes Tight sands formation with up to 3,000 feet of pay through multiple zones 132 directional / horizontal rigs running in Roberts, Hemphill and Wheeler counties World class well economics, particularly in core Northern Wheeler / Southern Hemphill counties 30-day IPs of 10+ MMcfe/d EURs of 6+ Bcfe Source: Hart Energy and Rystad Energy research. |
|
|
Building on Our Core; Delivering for Our Customers 15 Eagle Rock Processing Facility Red Deer Canadian Phoenix-Arrington Ranch Hemphill County Wheeler County Roberts County New producer customer acreage dedications Proposed new 6-inch NGL line Recent Activity Oct. ‘10 Acquired Gathering Systems from CEFS Dec. ’10 Installed Phoenix-Arrington Ranch Plant (50 MMcf/d) Oct. ’11 Completed Phoenix-Arrington Ranch Plant Expansion (+30 MMcf/d) 1Q ’12 Planned Installation of Woodall Plant (60 MMcf/d) 4Q ’12 Planned Installation of Wheeler Plant (125 MMcf/d) 1 2 3 4 5 Proposed new gathering line 1 2 3 4 5 Woodall Wheeler Existing Planned Eagle Rock Granite Wash Cryogenic Processing Capacity 0 50 100 150 200 250 300 350 3Q'10 4Q'10 1Q'11 2Q'11 3Q'11 4Q'11 1Q'12 2Q'12 3Q'12 4Q'12 1Q'13 2Q'13 M Mcf/d Red Deer / Canadian Plants Phoenix - Arrington Ranch Plant Phoenix - Arrington Ranch Expansion Woodall Plant Wheeler Plant |
|
|
16 Austin Chalk: Large independents staking 14 potential dedicated sites Drilling moving east into Louisiana with Austin Chalk and prospective Tuscaloosa Shale / Louisiana Eagle Ford Play Currently, four rigs running on dedicated acreage Strategic Footprint in East Texas System Activity Source: SEC filings, industry investor presentations, HPDI and RigData. Indigo Minerals Bentley Lumber 34H #1 and 32#1 Tuscaloosa Shale wells Swift and Anadarko Austin Chalk wells |
|
|
Upstream Business Overview Eagle Rock Energy Partners, L.P. RBC Capital Markets’ MLP Conference November 2011 |
|
|
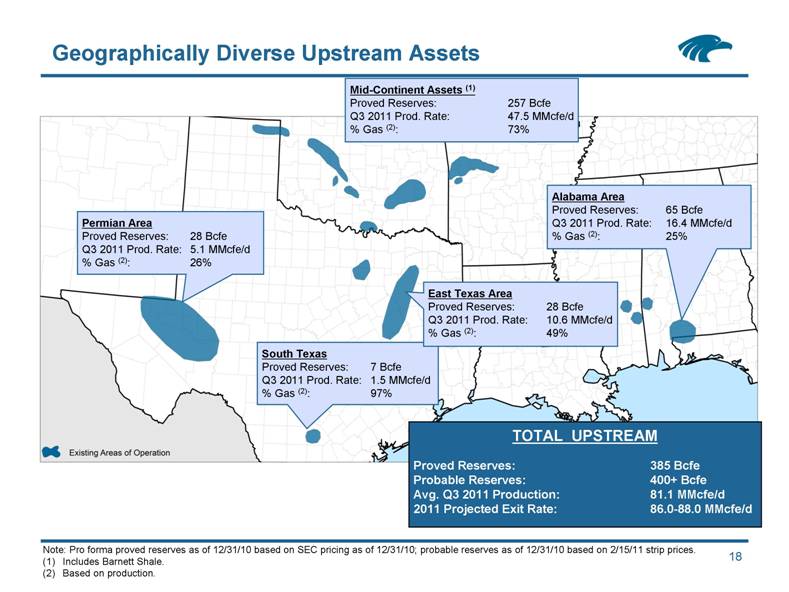
Alabama Area Proved Reserves: 65 Bcfe Q3 2011 Prod. Rate: 16.4 MMcfe/d % Gas (2): 25% Permian Area Proved Reserves: 28 Bcfe Q3 2011 Prod. Rate: 5.1 MMcfe/d % Gas (2): 26% South Texas Proved Reserves: 7 Bcfe Q3 2011 Prod. Rate: 1.5 MMcfe/d % Gas (2): 97% East Texas Area Proved Reserves: 28 Bcfe Q3 2011 Prod. Rate: 10.6 MMcfe/d % Gas (2): 49% TOTAL UPSTREAM Proved Reserves: 385 Bcfe Probable Reserves: 400+ Bcfe Avg. Q3 2011 Production: 81.1 MMcfe/d 2011 Projected Exit Rate: 86.0-88.0 MMcfe/d 18 Geographically Diverse Upstream Assets Mid-Continent Assets (1) Proved Reserves: 257 Bcfe Q3 2011 Prod. Rate: 47.5 MMcfe/d % Gas (2): 73% Note: Pro forma proved reserves as of 12/31/10 based on SEC pricing as of 12/31/10; probable reserves as of 12/31/10 based on 2/15/11 strip prices. (1) Includes Barnett Shale. (2) Based on production. |
|
|
19 Diversified Reserve Base Across High Quality Basins Production Reserves by Commodity Reserves by Category Third quarter 2011 average production rate of 81.1 MMcfe/d Production growth anticipated from liquids-rich Cana Shale and Golden Trend plays in Oklahoma 210 gross identified PUD drilling locations 469 gross identified probable drilling locations across upstream portfolio Total pro forma proved reserves as of December 31, 2010 of 385 Bcfe 13.0 year reserve life index based on current production rates (1) Eagle Rock PDP reflects recategorization of reserves following the resumption of East Texas production associated with the Eustace facility. Note: Pro forma reserves as of 12/31/10 based on SEC pricing as of 12/31/10. Oil 20% Gas 63% NGLs 17% PDP (1) 65% PDNP 9% PUD 26% |
|
|
20 Golden Trend Play Non-operated 2011 Wells Operated 3Q‘11 Wells Sections with Eagle Rock Operations Liquids-rich field producing from multiple pay formations from 8,000’ to 14,000’ including Bromide, Big 4, Springer, Morrow, Hart, Deese EROC Operated Rig Dennis 3-11 IP: 1,500 Mcfd, 500 Bopd Scott 1-17 IP 1,100 Mcfd, 300 Bopd Riddle 9-32 IP 1,500 Mcfd, 160 Bopd McElvaney 2-23 IP: 780 Mcfd, 265 Bopd Lane 1-3 IP: 500 Mcfd, 116 Bopd Newby 2-36 IP 328 BO 1000 MCF Dennis 1-11 Drilling Hart Sandstone Springer Sandstone Sycamore Limestone Woodford Shale Hunton Limestone Viola Limestone Bromide Sandstone |
|
|
21 Cana Shale Play Drilling Activity Helm 1-25H IP 2.6 MMCFD; 165 Bbls/d NGLs Stidham 1-16H Flowing to sales 2.9 MMcfd, 30 Bopd, 85 Bbls/d NGLs Johnson 1-14H Drilling 47 rigs currently drilling horizontal wells in the western Oklahoma Woodford “Cana” shale trend Shale characterized by dry gas to the southwest and oil to the northeast 296 Cana wells on production across play (35 with EROC WI) 11 EROC Non-Op wells are WOC or first sales Majority of drilling activity conducted by large independent producers such as Devon, Cimarex, Continental, and Marathon EROC Cana Shale net leasehold totals 13,600 acres Majority of acreage in wet gas “window” One rig operated program Participating with WI in 7-9 rigs drilling in play |
|
|
22 Woodford Shale -- Potential Room to Run Eagle Rock acreage Cana Shale Arkoma Basin Golden Trend Field Verden Field Ardmore Basin |
|
|
23 Capital ($ in MMs) (1) Upstream Growth Production Growth Driven Organically by Lower-Risk Drilling Inventory (1) This capital spending is subject to the availability of adequate sources, including cash from operations, borrowings under our revolving credit facility and potentially the issuance of additional equity or debt securities. (2) Adjusted to reflect estimate of a full quarter of East Texas production (removing the impact of the Eustace processing facility shut-down). Average Production (MMcfe/d) (2) 4-Year Production CAGR = 30% Eagle Rock Identified Locations PUD PROB Cana Shale 21 413 Golden Trend 36 2 Anadarko 42 21 Arkoma 46 11 Barnett Shale 4 9 Verden 33 13 Other 28 0 TOTAL 210 469 |
|
|
24 (1) OPEX excludes production, ad valorem taxes and post-production costs. (2) Adjusted to reflect estimate of a full quarter of East Texas production (removing the impact of the Eustace processing facility shut-down). Total OPEX (MM$) Unit OPEX ($/Mcfe) Focus on Low Cost Operations Upstream Historical and Projected Operating Costs (1) Operating expense of the legacy assets is driven by sulfur treating costs 2010 OPEX averaged $1.95/Mcfe Included $2.3 million of plant turnaround ($1.78/Mcfe removing turnaround and Eustace shut-down impact) 2010 workover expense above normal levels In 2011 unit operating expense has benefitted from the addition of Mid-Continent assets and lower overall workover expense Mid-Continent assets have a conventional gas composition resulting in lower treating expense Large, existing gathering infrastructure reduces producer gathering and compression expense Mid-Continent assets - $0.45/Mcfe (2) 22.2 18.8 23.2 24.5 24.8 5.5 11.7 0.00 0.30 0.60 0.90 1.20 1.50 1.80 2.10 2.40 0 5 10 15 20 25 30 35 40 2008 2009 2010 2011E 2012E Mid Continent Legacy Assets Unit OPEX |
|
|
Strong credit profile and capital availability Absence of incentive distribution rights enhances long-term accretion potential Core midstream operations in liquids-rich areas with substantial organic growth opportunities in Granite Wash and expansion potential in Austin Chalk and Louisiana Balanced midstream / upstream platform widens opportunity set Substantial drilling inventory (~680 drilling locations) focused in attractive basins including the Cana Shale and Golden Trend in Oklahoma Management’s expectation to recommend $1.00/unit distribution by end of 2012 (1) Eagle Rock is Well-Positioned for Continued Growth (1) Based on current expectations of business performance and future commodity prices. All actual distributions will be determined, declared and paid at the discretion of the Eagle Rock Board of Directors. 25 |
|
|
Appendix Eagle Rock Energy Partners, L.P. RBC Capital Markets’ MLP Conference November 2011 |
|
|
Mid-Continent Acquisition 27 Transaction Overview Transaction Highlights Added significant scale and geographic diversity to existing Upstream Business Proved reserves of 257 Bcfe (Total 3P reserves of 740.5 Bcfe) located in multiple basins across Oklahoma, Texas and Arkansas(1) Provides for long-term accretion (driven by production growth) to distributable cash flow per unit Expands portfolio of identified drilling opportunities (adds 182 PUD locations; 413 probable Cana locations; 56 probable non-Cana locations) Lower-risk locations in established plays (76% operated)(2) Base for organic production growth through 2015 (based on current drilling schedule) Lengthens total upstream reserve life (2010 YE Proved Reserves / 2010 Total Production) from 11 years to 17 years(3) Significant acreage position in Cana Shale provides upside to be realized through drilling Acquisition of all equity interests of CC Energy II L.L.C (“Crow Creek”) for a total purchase price of $563.7 million 60% of purchase price in form of equity to sellers, primarily Natural Gas Partners (1) Pro forma proved reserves as of 12/31/10 based on SEC pricing as of 12/31/10; total 3P reserves as of 12/31/10 based on 2/15/11 strip prices. (2) Based on estimated 2011 production. (3) Adjusted to reflect estimate of a full year of East Texas production (removing the impact of the Eustace processing facility shut-down). |
|
|
Robust Drilling Economics 28 Golden Trend Economics Cana Shale Economics Note: Based on $85 per Bbl flat oil price deck and Eagle Rock management estimates. Exposure to liquids rich plays greatly enhances drilling economics in low gas price environment Early development of Cana Shale shows a range of EURs, with attractive drilling economics in liquids rich portion of the play using conservative reserve levels In the Golden Trend Field area, risk is minimized and reserve upside is greatly enhanced with multiple, prolific pay zones extending from 8,000 – 15,000 feet 0 10 20 30 40 50 60 $3.00 $4.00 $5.00 $6.00 $7.00 Internal Rate of Return, % Natural Gas Price, Henry Hub, $/MMbtu 5 BCF 6 BCF 7 BCF 0 10 20 30 40 50 60 $3.00 $4.00 $5.00 $6.00 $7.00 Internal Rate of Return, % Natural Gas Price, Henry Hub, $/MMbtu 1.1 BCF |
|
|
Drilling Assumptions / Well Type Curves 29 Golden Trend Type Curve Cana Shale Type Curve $3.0 million completed well cost EUR of 1.1 Bcfe 50 Bbl/MMcf Condensate; NGL yield of 80 Bbl/MMcf with 31% shrinkage 1,000 Btu residue gas Received natural gas price = Henry Hub less 0.6% Received oil price = WTI less $5.00/Bbl Received NGL price = WTI less 57% Opex: $2,500/well/month Golden Trend Drilling Assumptions $8.6 million completed well cost EUR of 5-7 Bcfe 10 Bbl/MMcf Condensate; NGL yield of 50 Bbl/MMcf with 20% shrinkage 1,000 Btu residue gas Received natural gas price = Henry Hub less 10% Received oil price = WTI less $2.50/Bbl Received NGL price = WTI less 50% Opex: $3,500/well/month Cana Shale Drilling Assumptions Note: These represent management's assumptions as to the performance of a typical well in these areas used in evaluating the Crow Creek Acquisition. They were based on the performance of certain wells (all of which were drilled by other oil and gas companies) in the areas, together with management's experience and estimates. In addition, the performance and costs of wells in these areas have shown substantial variance. There can be no guarantee that the actual costs or results of any well in these areas will match management's assumptions. |
|
|
30 System Overview Map of Texas Panhandle System (1) Midstream: Panhandle System Miles of Pipeline: 3,963 Processing Plants: 7 Compression HP: 141,000 LTM Avg. Gathering Volume: 151 MMcf/d LTM Avg. Equity NGL / Condensate Volume: 5.0 Mbbl/d LTM Operating Income (2): $86.1 million LTM Capex (2): $41.0 million Producing Formations: Granite Wash Morrow Brown Dolomite Cleveland (1) Includes planned installation and construction of Woodall Plant in Hemphill County. (2) LTM as of 9/30/2011. Excludes Depreciation, depletion, amortization and impairment. (3) Based on December 2010. Contract Mix by Throughput (3) Gross Margin (3) Phoenix Cargray Canadian Gray County Red Deer Lefors Roberts Co. Woodall (Under Construction) Wheeler (Announced) East Processing Plants West Processing Plants Wheeler Plant Woodall Plant Fixed Fee 19% Commodity Based 81% Fixed Fee 9% Commodity Based 91% |
|
|
31 System Overview Map of East Texas System Midstream: East Texas System Miles of Pipeline: 1,213 Processing Plants: 7 Compression HP: 49,700 LTM Avg. Gathering Volume: 190 MMcf/d LTM Avg. Equity NGL / Condensate Volume: 1.1 Mbbl/d LTM Operating Income (1): $35.1 million LTM Capex (1): $15.4 million Producing Formations: Austin Chalk James Lime Trend Travis Peak Haynesville Shale Cotton Valley Woodbine (1) LTM as of 9/30/2011. Excludes Depreciation, depletion and amortization. (2) Based on December 2010. Contract Mix by Throughput (2) Gross Margin (2) Processing Plants Brookeland Indian Springs Fixed Fee 35% Commodity Based 65% Fixed Fee 27% Commodity Based 73% |
|
|
32 System Overview Map of South Texas System Producer Activity / Competitive Positioning Midstream: South Texas System Major producers are Chesapeake and Sanchez Oil & Gas in South Texas Activity has slowed due to lower natural gas commodity prices Phase 1 20-inch provides lower pressure service with access to two competing processing plants for producers Miles of Pipeline: 266 Processing JT Skids: 3 Compression HP: 15,300 LTM Operating Income (1): $5.1 million LTM Capex (1): $0.1 million (1) LTM as of 9/30/2011. Excludes Depreciation, depletion, amortization and discontinued operations. (2) Based on December 2010. Contract Mix by Throughput (2) Gross Margin (2) Processing JT Skids Raymondville Donna Merit Fixed Fee 74% Commodity Based 26% Fixed Fee 37% Commodity Based 63% |
|
|
33 System Overview Gulf of Mexico System Midstream: Gulf of Mexico System Miles of Pipeline: 40 Processing Plants: 2 (non-operated) Compression HP: 14,180 LTM Operating Income (1): $3.3 million LTM Capex (1): $0.2 million Producer interests in approximately 115 blocks committed to life-of-lease contracts Davy Jones discovery in shallow water covers some of Eagle Rock’s committed leases Deep subsalt shelf drilling could provide additional upside Major producers are Stone Energy and McMoran Exploration Contracts are life-of-lease commitments and typically percent of proceeds with fixed floors Have processing contracts with four third party plants and our two equity plants Provides ability to handle producers’ needs across the Gulf of Mexico (1) LTM as of 9/30/2011. Excludes Depreciation, depletion and amortization. Based on December 2010. Contract Mix by Throughput (2) Gross Margin (2) Producer Activity / Competitive Positioning Processing Plants Operating Interest North Terrebone 2.63% Yscloskey 10.54% Fixed Fee 1% Commodity Based 99% Fixed Fee 14% Commodity Based 86% |
|
|
34 Mid-Continent: Upstream Asset Asset Overview Mid-Continent Properties 2011 Objectives Fully integrate the Crow Creek acquisition into the Eagle Rock Upstream business Grow production on the Cana Shale leasehold and within the Golden Trend field with both operated and non-operated drilling and recompletion programs Continue to acquire leasehold in the productive liquids-rich window of the Cana Shale play and in the Golden Trend field area |
|
|
35 Alabama: Upstream Asset Acquisition Date: July 31, 2007 Alabama Counties: Escambia, Choctaw Operated Producing Wells: 29 Non-Op Wells: 2 Net Acreage: 13,000 Net Reserves: 10.9 MMboe (65.4Bcfe) Average Operated W.I.: 73% Producing Formations: Smackover, Norphlet Gas Stream Composition (+/-): 20% H2S 45% CO2 Assets include two treating plants (100 MMcf/d capacity) and one cryogenic processing plant (50 MMcf/d) to remove H2S and CO2 prior to sales Net Production: Gas Mcf/d: 3,578 Oil Bo/d: 1,566 NGLs Bl/d: 647 Sulfur LT/d: 169 Total Mcfe/d: 16,798 (21% gas) Financial Summary Revenue ($ in millions): $55.4 Operating Expense ($ in millions) (1): $14.3 Unit Operating Expense ($/BOE) (1): $14.28 Florida / Alabama State Border (1) Excluding taxes. Exploit behind-pipe zones in current wellbores Continue to increase market flexibility for all products Optimize gathering system to increase production Reconfigure wells and install artificial lift to improve flow efficiencies Improve SO2 recoveries at BEC and Flomaton facilities to comply with changing emissions requirements Asset Overview Alabama Properties 2010 Operating Statistics 2011 Objectives |
|
|
36 East Texas Smackover Trend Assets Acquisition Date: July 31, 2007 Texas Counties: Wood, Rains, Van Zandt, Henderson Operating Producing Wells: 34 Non-Op Producing Wells: 123 (ETX/LA) Net Acreage: 16,000 Net Reserves: 4.5 MMboe (27.0 Bcfe) Average Operated W.I.: 83% Producing Formations: Smackover, Cotton Valley Gas Composition: 20-40% H2S Eagle Rock’s East Texas production is treated and processed by Tristream Energy facilities Net Production: Gas Mcf/d: 5,199 Oil Bo/d: 261 NGLs Bl/d: 518 Sulfur LT/d: 103 Total Mcfe/d: 9,876 (53% gas) Financial Summary Revenue ($ in millions): $19.0 Operating Expense ($ in millions) (2): $3.9 Unit Operating Expense ($/BOE) (2): $8.54 (1) Includes the Partnership’s Mississippi and South Texas operations. (2) Excluding taxes. Exploit new Cotton Valley discovery with targeted drilling and well re-entries Improve well performance through well re-configuration and artificial lift Optimize compression to reduce wellhead pressures and increase production Asset Overview East Texas Properties 2010 Operating Statistics (1) 2011 Objectives |
|
|
37 Asset Overview Permian Basin Properties 2010 Operating Statistics Permian Basin Assets Acquisition Date: April 30, 2008 Texas Counties: Ward, Crane, Pecos Operated Producing Wells: 186 Non-Op Producing Wells: 21 Net Acreage: 24,000 Net Reserves: 4.7 MMboe (28.2 Bcfe) Average Operated W.I.: 96% Producing Formations: Yates, Queen, San Andres, Wichita Albany, Holt, Wolfcamp and Penn Net Production: Gas Mcf/d: 1,563 Oil Bo/d: 469 NGLs Bl/d: 221 Total Mcfe/d: 5,706 (27% gas) Financial Summary Revenue ($ in millions): $17.4 Operating Expense ($ in millions) (1): $5.0 Unit Operating Expense ($/BOE) (1): $14.53 (1) Excluding taxes. 2011 Objectives Exploit behind-pipe reserves in multiple horizons with low risk workovers Evaluate tertiary CO2 flood potential Target bolt-on acquisition opportunities |
|
|
38 Asset Overview South Texas Properties South Texas Upstream Assets Acquisition Date: July 31, 2007 Texas Counties: Atascosa Operating Producing Wells: 11 Net Acreage: 1,400 Net Reserves: 1.1 MMboe (6.6 Bcfe) Average Operated W.I.: 100% Producing Formations: Edwards Successful re-completion program conducted in 2008 with infill drilling locations identified for future development Acreage is well-positioned in the “wet” gas window of the Eagleford Shale Evaluating options to exploit resource Note: South Texas operations included in East Texas operating statistics. |
|
|
39 SEC Reserve Disclosures The SEC permits oil and gas companies, in their filings with the SEC, to disclose only “reserves” as defined by SEC rules. Estimates of reserves in this communication are based on economic assumptions with regard to commodity prices (NYMEX strip) that differ from the prices required by the SEC (historical 12 month average) to be used in calculating reserves estimates of reserves prepared in accordance with SEC definitions and guidelines. In addition, the SEC generally prohibits in SEC filings the reporting of reserves of different categories on a combined basis (3P) because each category of proved, probable and possible reserves involves substantially different risks of ultimate recovery. Factors affecting ultimate recovery include the scope of our proposed drilling program, which will be directly affected by the availability of capital, drilling and production costs, commodity prices, availability of drilling services and equipment, drilling results, lease expirations, transportation constraints, regulatory approvals and other factors, and actual drilling results, including geological and mechanical factors affecting recovery rates. Accordingly, actual quantities that may be ultimately recovered from the Partnership's interests may differ substantially from the Partnership’s estimates of reserves. In addition, the Partnership's estimates of reserves may change significantly as development of the Partnership’s properties provide additional data. |
|
|
40 This presentation includes, and certain statements made during this presentation may include, the non-generally accepted accounting principles, or non-GAAP, financial measures of Adjusted EBITDA. The accompanying non-GAAP financial measures schedule provides reconciliations of Adjusted EBITDA to its most directly comparable financial measure calculated and presented in accordance with accounting principles generally accepted in the United States, or GAAP, with respect to the references to Adjusted EBITDA that are of a historical nature. Where references are forward-looking or prospective in nature, and not based in historical fact, this presentation does not provide a reconciliation. Eagle Rock could not provide such reconciliation without undue hardship because the Adjusted EBITDA numbers included in the presentation, and that may be included in certain statements made during the presentation, are estimations, approximations and/or ranges. In addition, it would be difficult for Eagle Rock to present a detailed reconciliation on account of many unknown variables for the reconciling items. For an example of the reconciliation, please consult the reconciliations included for the historical Adjusted EBITDA numbers in this appendix. Non-GAAP financial measures should not be considered as alternatives to GAAP measures such as net income (loss), operating income (loss), cash flows from operating activities or any other GAAP measure of liquidity or financial performance. Eagle Rock defines Adjusted EBITDA as net income (loss) plus or (minus) income tax provision (benefit); interest-net, including realized interest rate risk management instruments and other expense; depreciation, depletion and amortization expense, impairment expense; other operating expense, non-recurring; other non-cash operating and general and administrative expenses, including non-cash compensation related to our equity-based compensation program; unrealized (gains) losses on commodity and interest rate risk management related instruments; (gains) losses on discontinued operations and other (income) expenses. Eagle Rock uses Adjusted EBITDA as a measure of its core profitability to assess the financial performance of its assets. Adjusted EBITDA also is used as a supplemental financial measure by external users of Eagle Rock’s financial statements such as investors, commercial banks and research analysts. For example, Eagle Rock’s lenders under its revolving credit facility use a variant of Eagle Rock’s Adjusted EBITDA in a compliance covenant designed to measure the viability of Eagle Rock and its ability to perform under the terms of its revolving credit facility; Eagle Rock, therefore, uses Adjusted EBITDA to measure its compliance with its revolving credit facility. Eagle Rock believes that investors benefit from having access to the same financial measures that its management uses in evaluating performance. Adjusted EBITDA is useful in determining Eagle Rock’s ability to sustain or increase distributions. By excluding unrealized derivative gains (losses), a non-cash, mark-to-market benefit (charge) which represents the change in fair market value of Eagle Rock’s executed derivative instruments and is independent of its assets’ performance or cash flow generating ability, Eagle Rock believes Adjusted EBITDA reflects more accurately Eagle Rock’s ability to generate cash sufficient to pay interest costs, support its level of indebtedness, make cash distributions to its unitholders and general partner and finance its maintenance capital expenditures. Eagle Rock further believes that Adjusted EBITDA also describes more accurately the underlying performance of its operating assets by isolating the performance of its operating assets from the impact of an unrealized, non-cash measure designed to describe the fluctuating inherent value of a financial asset. Similarly, by excluding the impact of non-recurring discontinued operations, Adjusted EBITDA provides users of the Partnership’s financial statements a more accurate picture of its current assets’ cash generation ability, independently from that of assets which are no longer a part of its operations. Use of Non-GAAP Financial Measures |
|
|
41 Eagle Rock’s Adjusted EBITDA definition may not be comparable to Adjusted EBITDA or similarly titled measures of other entities, as other entities may not calculate Adjusted EBITDA in the same manner as Eagle Rock. For example, Eagle Rock includes in Adjusted EBITDA the actual settlement revenue created from its commodity hedges by virtue of transactions undertaken by it to reset commodity hedges to prices higher than the then-current forward strip price for such future period or purchase puts or other similar floors despite the fact that Eagle Rock excludes from Adjusted EBITDA any charge for amortization of the cost of such commodity hedge reset transactions or puts. Eagle Rock has reconciled historical Adjusted EBITDA numbers to the GAAP financial measure of net income (loss) in the appendix to this presentation but has not reconciled prospective Adjusted EBITDA numbers. Use of Non-GAAP Financial Measures (Continued) |
|
|
Adjusted EBITDA Reconciliation Adjusted EBITDA Reconciliation 42 2011 2010 2011 2010 Net cash flows provided by operating activities $59,258 $34,145 $84,951 $76,807 Add (deduct): Discontinued operations (197) 166 210 43,811 Depreciation, depletion, amortization and impairment (44,910) (29,324) (105,068) (87,367) Amortization of debt issuance costs (642) (242) (1,688) (1,062) Risk management portfolio value changes 94,634 (14,225) 114,403 31,482 Reclassing financing derivative settlements 1,263 373 3,706 1,001 Other (1,106) (1,498) 22 (5,705) Accounts receivables and other current assets (4,283) (13,398) 1,200 (22,109) Accounts payable, due to affiliates and accrued liabilities (6,929) (1,008) 91 9,474 Other assets and liabilities 277 (226) 892 555 Net income (loss) $97,365 ($25,237) $98,719 $46,887 Add (deduct): Interest (income) expense, net 13,766 8,470 33,120 26,935 Depreciation, depletion and amortization 44,910 29,324 105,068 87,367 Income tax (benefit) provision (1,077) (1,244) (1,810) (970) EBITDA $154,964 $11,313 $235,097 $160,219 Add (deduct): Risk management portfolio value changes (93,846) 20,156 (88,355) (25,551) Unrealized losses related to Eagle Rock Gas Services (538) - (538) - Restricted unit compensation expense 1,507 1,294 3,441 4,652 Non-cash mark-to-market Upstream imbalances (107) 102 (123) (465) Discontinued operations, net of tax 197 (166) (210) (43,811) Other income - (21) - (99) Other operating income - - (2,893) - ADJUSTED EBITDA $62,177 $32,678 $146,419 $94,945 2011 2010 2011 2010 Amortization of commodity derivative costs - - - $3,078 September 30, September 30, ($ in thousands) ($ in thousands) Nine Months Ended Three Months Ended September 30, September 30, Three Months Ended Nine Months Ended |