Attached files
| file | filename |
|---|---|
| 8-K - FORM 8-K - DOLE FOOD CO INC | d257645d8k.htm |
| EX-99.1 - PRESS RELEASE - DOLE FOOD CO INC | d257645dex991.htm |
 1
1
Dole Food Company, Inc.
Earnings Call and Webcast
Third Quarter 2011
November 17, 2011
Exhibit 99.2 |
 2
2
Beth Potillo
Treasurer |
 3
3
Forward-Looking Statements
The information presented here contains "forward-looking
statements," within the meaning of the Private Securities
Litigation Reform Act of 1995 that involve a number of risks and
uncertainties. Forward-looking statements, which are based on
management's current expectations, are generally identifiable by
the use of terms such as "may," "will," "expects,"
"believes," "intends," "anticipates" and similar
expressions. The potential risks and uncertainties that could cause actual
results to differ materially from those expressed or implied herein include
weather-related phenomena; market responses to industry
volume pressures; product and raw materials supplies and
pricing; energy supply and pricing; changes in interest and
currency exchange rates; economic crises and security risks in
developing countries; international conflict; and quotas, tariffs
and other governmental actions. Further information on the
factors that could affect Dole's financial results is included in its
SEC filings, including its Annual Report on Form 10-K.
|
 4
Non-GAAP Financial Measures
EBIT before discontinued operations, Adjusted EBITDA, Adjusted EBITDA Excluding Significant Items, and
Comparable Income (loss) from continuing operations (total and per share) are measures commonly
used by financial analysts in evaluating the performance of companies. EBIT before discontinued
operations is calculated from net income by adding interest expense and income tax expense, and
subtracting income from discontinued operations, net of income taxes, and gain on disposal of discontinued
operations, net of income taxes. Adjusted EBITDA is calculated from EBIT before discontinued
operations by: (1) adding depreciation and amortization; (2) adding the net unrealized loss or
subtracting the net unrealized gain on foreign currency and bunker fuel hedges and the cross
currency swap which do not have a more than insignificant financing element present at contract inception; (3)
adding the net loss or subtracting the net gain on the long-term Japanese yen hedges; (4) adding
the foreign currency loss or subtracting the foreign currency gain on the vessel obligations;
(5) adding the net unrealized loss or subtracting the net unrealized gain on foreign
denominated instruments; and (6) subtracting the gain on asset sales. Due to the fact that the long-term Japanese
yen hedges had more than an insignificant financing element at inception, the liability is treated
similar to a debt instrument and the associated cash flows are classified as a financing
activity. As a result, both the realized and unrealized gains and losses related to these
hedges are subtracted from or added back to EBIT before discontinued operations when calculating Adjusted EBITDA.
Adjusted EBITDA Excluding Significant Items is calculated from Adjusted EBITDA by: (1) adding the
refinancing charges and loss on early retirement of 2014 notes: and (2) subtracting the gain on
container arbitration settlement. Comparable Income (loss) from continuing operations is
calculated from income (loss) from continuing operations by: (1) adding charges for restructuring and long-
term receivables, net of income taxes; (2) adding the net unrealized loss or subtracting the net
unrealized gain on foreign currency and bunker fuel hedges and the cross currency swap, net of
income taxes; (3) adding the net loss or subtracting the net gain on the long-term Japanese
yen hedges, net of income taxes; (4) adding the foreign currency loss or subtracting the foreign currency gain on
the vessel obligations, net of income taxes; (5) adding the net unrealized loss or subtracting the net
unrealized gain on foreign denominated instruments, net of income taxes; (6) adding the
refinancing charges and loss on early retirement of 2014 notes, net of income taxes; (7)
subtracting the gain on container arbitration settlement, net of income taxes; and (8) subtracting gain on asset
sales, net of income taxes. These items have been adjusted because management excludes these amounts
when evaluating the performance of Dole. Net debt is calculated as total debt less cash.
EBIT before discontinued operations, Adjusted EBITDA and Comparable Income (loss) from
continuing operations (total and per share) are not calculated or presented in accordance with
U.S. GAAP and are not a substitute for net income attributable to Dole Food Company, Inc., net
income, income from continuing operations, cash flows from operating activities or any other measure
prescribed by U.S. GAAP. Further, EBIT before discontinued operations, Adjusted EBITDA and Comparable
Income (loss) from continuing operations (total and per share) as used herein are not
necessarily comparable to similarly titled measures of other companies. However, Dole has
included these three measures herein because management believes that they are useful
performance measures for Dole and for securities analysts, investors and others in the evaluation of
Dole. |
 5
5
David A. DeLorenzo
Chief Executive Officer |
  6
Adjusted EBITDA
Excluding Significant Items
($ millions)
October 8, 2011
October 9, 2010
October 8, 2011
October 9, 2010
Adjusted EBITDA
19
$
101
$
278
$
299
$
Significant items included in Adjusted EBITDA:
Charges for restructuring and long-term
receivables
13
24
22
25
Gain on arbitration settlement, net
-
(27)
-
(27)
Refinancing charges and loss on early
retirement of 2014 notes
26
-
26
-
Adjusted EBITDA Excl. Significant Items
58
$
98
$
326
$
297
$
See Page 18 for reconciliation of Net Income to Adjusted EBITDA
Quarter
Ended
Three Quarters Ended
|
 7
Adjusted EBITDA Excluding
Significant Items By Segment
($ millions)
October 8, 2011
October 9, 2010
October 8, 2011
October 9, 2010
Fresh fruit
35
$
58
$
250
$
195
$
Fresh vegetables
9
12
34
39
Packaged foods
32
30
82
94
Corporate/other
(18)
(2)
(40)
(31)
Adjusted EBITDA Excl. Significant Items
58
$
98
$
326
$
297
$
See Pages 19 & 20 for Adjusted EBITDA by segment |
 8
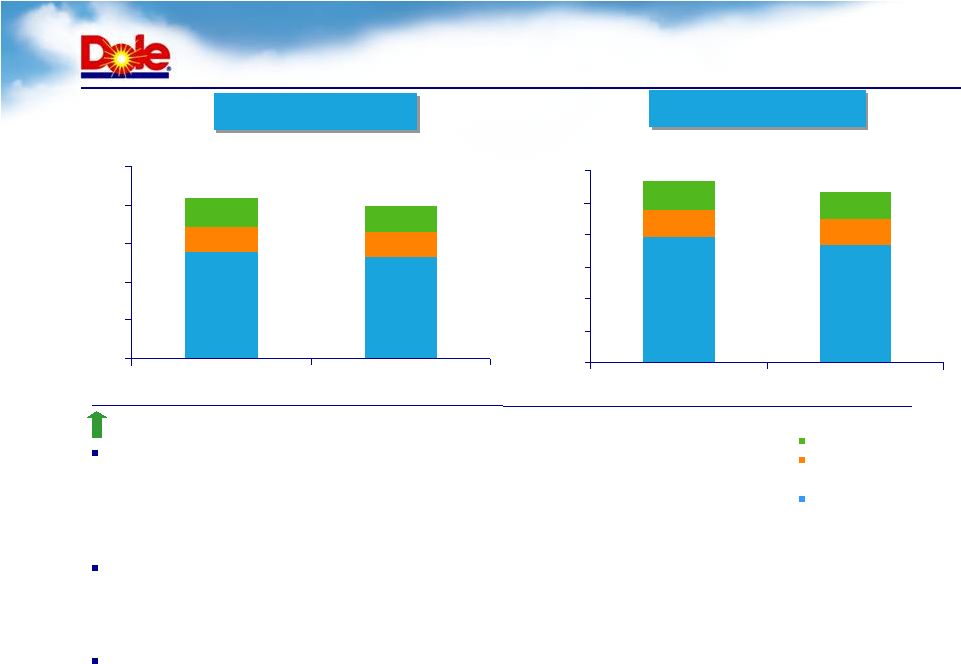
Fresh Fruit: 3Q11
Review
Revenues increased 5%
Restructuring on track:
Q3 cost savings of $14 million
Additional restructuring initiatives to benefit 2012
–
Banana industry exports to Europe up 9% as a result of good
growing conditions
–
Additional restructuring initiatives in production and shipping
operations to benefit 2012
–
Reduced
2011
banana
volumes
(
19%
year-to-date)
–
Higher shipping costs primarily resulting from higher fuel prices
–
Volumes and prices up year-to-date
–
Higher fruit, packaging and shipping costs
–
Growth in China and Middle East markets
–
YTD volumes up ~10%, prices up ~4%
Latin America
Europe
North America
Asia |
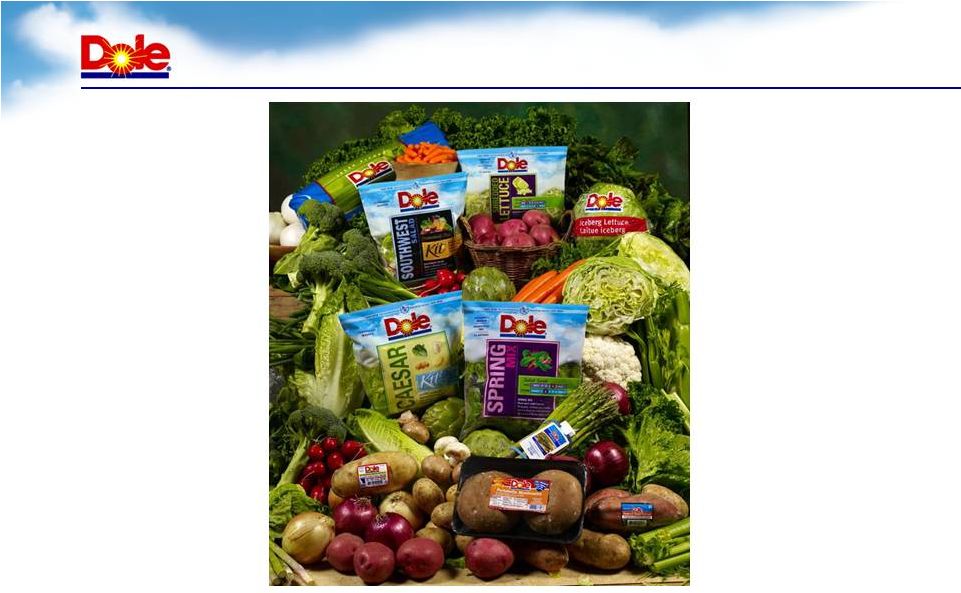
 Fresh Vegetables: 3Q11 Review
Packaged salads
-
Improved performance continues
-
Higher prices, better mix, increased retail volumes
-
Lower marketing costs
Fresh-packed vegetables
-
Weaker performance more than offsets packaged
salad improvements in the quarter
-
Lower iceberg lettuce pricing
Acquisition of SunnyRidge Farm
-
Premium blueberry and blackberry operations to
complement our existing fresh and frozen strawberry
program.
9
•
Packaged Salad
improvement continues
•
Completed acquisition of
SunnyRidge Farm |
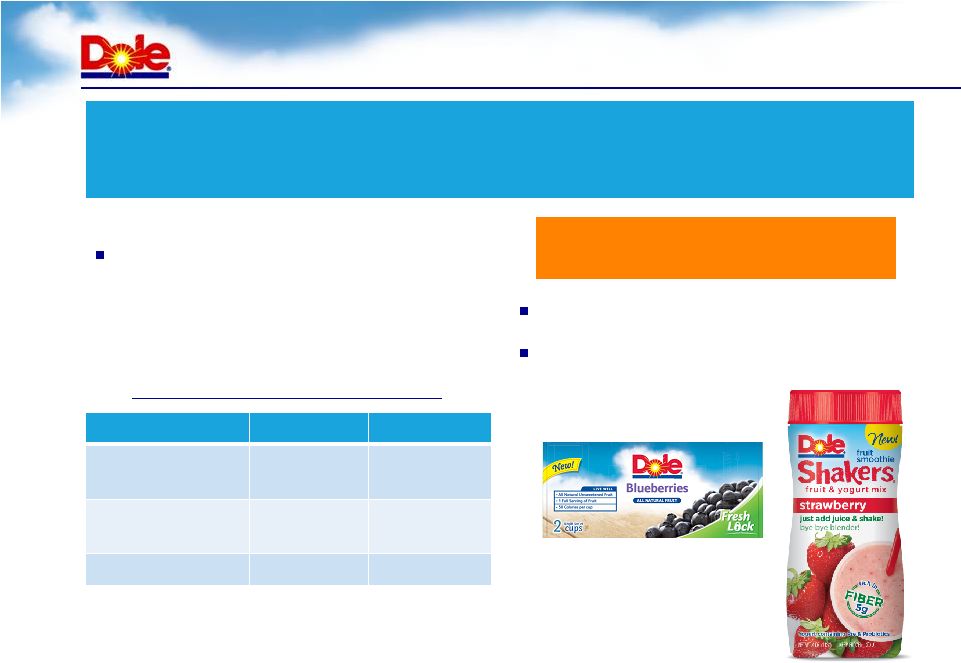 Packaged Foods: 3Q11 Review
10
Dole
Fruit
Smoothie
Shakers
®
Frozen Fruit Single-serve Cups
Revenue increased 9%
Adjusted EBITDA increased $2 million to $32 million
U.S.
Dollar
Market
Shares
Product
2011*
2010*
Canned
pineapple
56.8% #1
57.3%
Canned
pineapple juice
57.7% #1
56.8%
Fruit Bowls
48.1% #1
46.7%
*Source: IRI Syndicated Data Total US for the third quarter ended
October 8, 2011 and October 9, 2010 Successful new product
introductions
Higher volume and pricing
offset increased product costs |
 11
Summary
As anticipated, a challenging
market in Europe during the third
quarter
Year-to-date performance well
ahead of 2010
Implementing additional
restructuring initiatives focused
on further improving profitability
in Europe
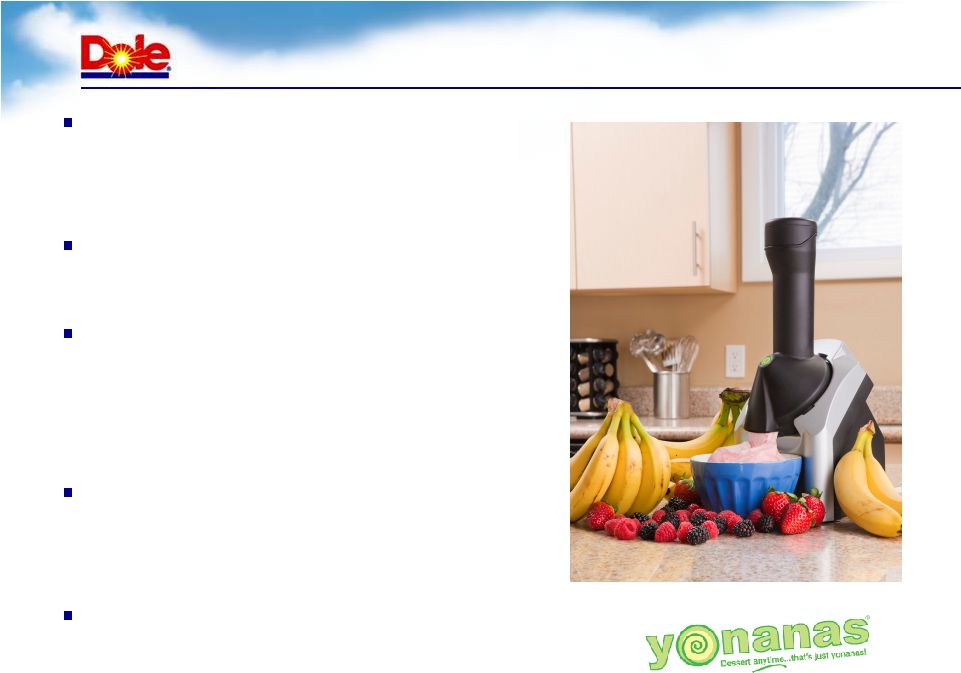
Strategic investments in
SunnyRidge Farm and Healthy
Foods, LLC
Continued progress on asset
sale program |
 12
12
Joseph S. Tesoriero
Chief Financial Officer |
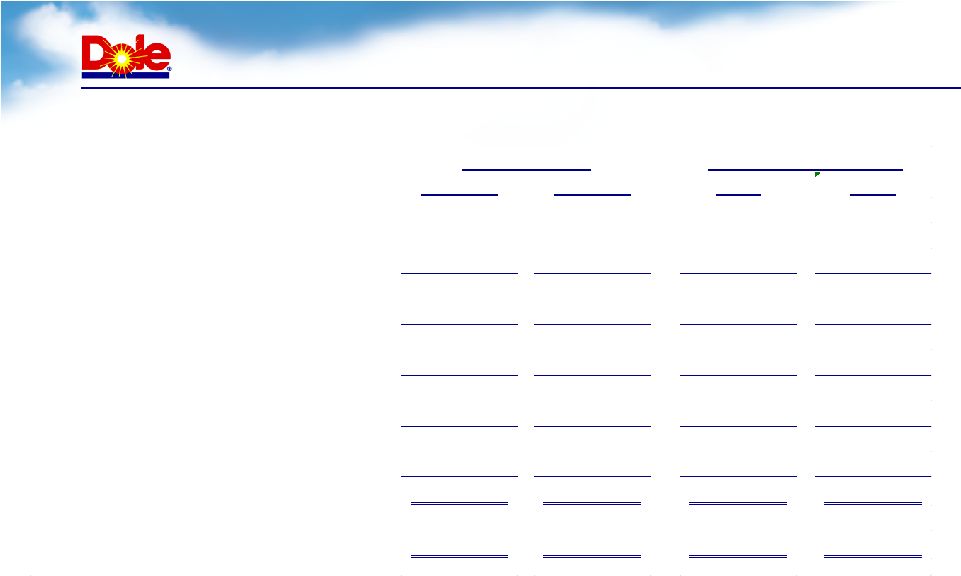
 13
Segment Revenues
Packaged foods
Fresh
vegetables
Fresh fruit
($ millions)
3,932
3,674
852
825
903
836
$0
$1,000
$2,000
$3,000
$4,000
$5,000
$6,000
2011
2010
$5,688
$5,336
First Three Quarters
First Three Quarters
First Three Quarters
3rd Quarter
3rd Quarter
3rd Quarter
1,393
1,327
327
326
366
335
$0
$500
$1,000
$1,500
$2,000
$2,500
2011
2010
$2,086
$1,989
Revenue in all segments increased
Fresh fruit up 5%
-
Higher
banana
volumes
in
North
America
and
Asia;
improved
banana
pricing
in North America, offset by planned lower volumes in Europe
-
Higher volumes and pricing of Chilean deciduous fruit
-
Higher pricing of pineapples and other fresh fruit in Asia
Vegetables
-
Packaged salads had higher prices and better mix, higher retail volumes
-
Fresh-packed vegetables had lower prices and volumes in iceberg lettuce,
partially offset by higher volumes and pricing in strawberries
Packaged foods up 9%
-
Higher sales across all major product lines
Note: Numbers may not foot due to rounding. |
 14
Adjusted EBITDA Excluding
Significant Items By Segment
($ millions)
October 8, 2011
October 9, 2010
October 8, 2011
October 9, 2010
Fresh fruit
35
$
58
$
250
$
195
$
Fresh vegetables
9
12
34
39
Packaged foods
32
30
82
94
Corporate/other
(18)
(2)
(40)
(31)
Adjusted EBITDA Excl. Significant Items
58
$
98
$
326
$
297
$
See Pages 19 & 20 for Adjusted EBITDA by segment |
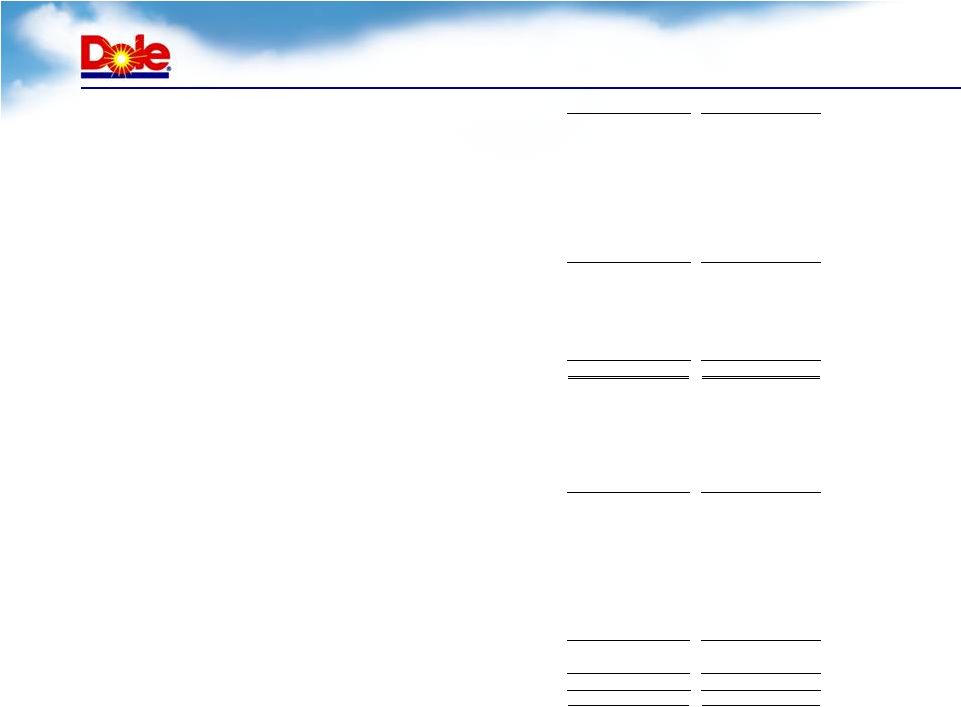
 Comparable Income from Continuing Ops.
15
($ millions, except per share data)
See Page 4 for definition of non-GAAP measures
The
line
items
presented
here
have
been
adjusted
consistent
with
the
purpose
of
calculating
Comparable
Income
from
continuing operations, and thus are non-GAAP measures.
Q3 2011
Q3 2010
2011
2010
Revenues, net
2,086.0
$
1,988.6
$
5,687.9
$
5,336.0
$
Cost of products sold
(1,902.4)
(1,791.1)
(5,037.2)
(4,764.2)
Gross Margin
183.6
197.5
650.7
571.8
SMG&A expenses
(160.3)
(139.0)
(416.0)
(372.5)
Operating Income
23.3
58.5
234.7
199.3
Other, net
3.3
1.3
12.3
9.5
EBIT before disc. ops.
26.6
59.8
247.0
208.8
Interest expense
(41.4)
(49.2)
(111.7)
(127.4)
Earnings before taxes
(14.8)
10.6
135.3
81.4
Income taxes
(0.3)
(7.5)
(19.2)
(19.5)
Comparable Income from cont. ops.
$ (15.1)
$ 3.1
$ 116.1
$ 61.9
$ (0.17)
$ 0.04
$ 1.32
$ 0.71
Quarter Ended
Three Quarters Ended
Comp. Income from cont. ops. per share |
 16
16
Q&A |
 17
17
Appendix |
  18
Reconciliation of Net Income to EBIT before Discontinued Operations,
Adjusted EBITDA and Adjusted EBITDA Excl. Significant Items
($ millions)
October 8, 2011
October 9, 2010
October 8, 2011
October 9, 2010
Net income (loss)
(47)
$
(49)
$
38
$
7
$
Discontinued operations, net
-
(5)
(1)
(5)
Interest expense
41
49
112
127
Income taxes
-
8
19
20
EBIT before discontinued operations
(6)
3
168
149
Depreciation and amortization
32
38
79
88
Net unrealized (gain) loss - derivatives
2
43
35
59
Net gain on long-term Japanese yen hedges
(3)
-
(7)
-
Foreign currency (gain) loss - vessel
obligations (2)
4
-
(1)
Net unrealized (gain) loss - foreign instruments
(1)
13
6
7
Gain on asset sales
(3)
-
(3)
(3)
Adjusted EBITDA
19
$
101
$
278
$
299
$
Significant items included in Adjusted EBITDA:
Charges for restructuring and long-term receivables
13
24
22
25
Gain on arbitration settlement, net
-
(27)
-
(27)
Write-off of debt issuance costs, refinancing fees
and loss on early retirement of 2014 notes
26
-
26
-
Adjusted EBITDA Excl.
Significant Items 58
$
98
$
326
$
297
$
Quarter Ended
Three Quarters
Ended |
  19
Adjusted Q3 QTD EBITDA by Segment
($ millions)
Fresh
Fresh
Packaged
Corporate/
Fruit
Vegetables
Foods
Other
Total
Quarter Ended October 8, 2011
EBIT before disc. ops.
7
$
3
$
24
$
(40)
$
(6)
$
Net unrealized (gain) loss - derivatives
1
-
1
-
2
Net gain on long-term Japanese yen hedges
-
-
-
(3)
(3)
Foreign currency (gain) loss - vessel obligations
(2)
-
-
-
(2)
Net unrealized (gain) loss - foreign instruments
1
-
-
(2)
(1)
Gain on asset sales
(3)
-
-
-
(3)
Sub total
4
3
25
(45)
(13)
Depreciation and amortization
18
6
7
1
32
Adjusted EBITDA
22
$
9
$
32
$
(44)
$
19
$
Significant items
13
-
-
26
39
Adjusted EBITDA Excluding Significant Items
35
$
9
$
32
$
(18)
$
58
$
Fresh
Packaged
Corporate/
Fresh Fruit
Vegetables
Foods
Other
Total
Quarter Ended October 9, 2010
EBIT before disc. ops.
36
$
5
$
24
$
(62)
$
3
$
Net unrealized (gain) loss - derivatives
(2)
-
(1)
46
43
Foreign currency (gain) loss - vessel obligations
4
-
-
-
4
Net unrealized (gain) loss - foreign instruments
-
-
-
13
13
Sub total
38
5
23
(3)
63
Depreciation and amortization
23
7
7
1
38
Adjusted EBITDA
61
$
12
$
30
$
(2)
$
101
$
Significant items
(3)
-
-
(3)
Adjusted EBITDA Excluding Significant Items
58
$
12
$
30
$
(2)
$
98
$
|
  20
Adjusted Q3 YTD EBITDA by Segment
($ millions)
Fresh
Fresh
Packaged
Corporate/
Fruit
Vegetables
Foods
Other
Total
Three Quarters Ended October 8, 2011
EBIT before disc. ops.
184
$
18
$
62
$
(96)
$
168
$
Net unrealized (gain) loss - derivatives
2
-
2
31
35
Net gain on long-term Japanese yen hedges
-
-
-
(7)
(7)
Foreign currency (gain) loss - vessel obligations
-
-
-
-
-
Net unrealized (gain) loss - foreign instruments
-
-
1
5
6
Gain on asset sales
(3)
-
-
-
(3)
Sub total
183
18
65
(67)
199
Depreciation and amortization
45
16
17
1
79
Adjusted EBITDA
228
$
34
$
82
$
(66)
$
278
$
Significant items
22
-
-
26
48
Adjusted EBITDA Excluding Significant Items
250
$
34
$
82
$
(40)
$
326
$
Fresh
Fresh
Packaged
Corporate/
Fruit
Vegetables
Foods
Other
Total
Three Quarters Ended October 9, 2010
EBIT before disc. ops.
147
$
23
$
78
$
(99)
$
149
$
Net unrealized (gain) loss - derivatives
-
-
(1)
60
59
Foreign currency (gain) loss - vessel obligations
(1)
-
-
-
(1)
Net unrealized (gain) loss - foreign instruments
1
-
-
6
7
Gain on asset sales
(3)
-
-
-
(3)
Sub total
144
23
77
(33)
211
Depreciation and amortization
53
16
17
2
88
Adjusted EBITDA
197
$
39
$
94
$
(31)
$
299
$
Significant items
(2)
-
-
-
(2)
Adjusted EBITDA Excluding Significant Items
195
$
39
$
94
$
(31)
$
297
$ |
  21
Non-GAAP Financial Measures
($ thousands, except per share data)
Quarter Ended
Three Quarters Ended
October 8, 2011
October 9, 2010
October 8, 2011
October 9, 2010
Net Income (loss)
(47,004)
$
(48,829)
$
38,074
$
7,405
$
Income (loss) from discontinued operations, net of income taxes
43
(202)
(188)
(876)
Gain on disposal of discontinued operations, net of income taxes
-
(4,143)
(339)
(4,143)
Interest expense
41,402
49,187
111,709
127,375
Income taxes
123
7,522
18,781
19,764
EBIT
168,037
149,525
Depreciation & amortization
79,064
87,620
Net unrealized (gain)/loss on derivative instruments
2,487
43,527
35,104
59,164
Net (gain) loss on Japanese yen hedges
(2,298)
(6,582)
Foreign currency exchange (gain)/loss on vessel obligations
(2,590)
3,946
(51)
(1,147)
Gain on asset sales
(3,326)
-
(3,337)
(2,921)
Debt retirement costs in connection with initial public offering
Net unrealized FX (gain)/loss on foreign denominated borrowings
(1,645)
12,579
5,802
6,581
Sub Total
(7,372)
60,052
30,936
61,677
Adjusted EBITDA
18,858
$
101,185
$
278,037
$
298,822
$
Significant items included in Adjusted EBITDA:
Charges for restructuring and long-term receivables
13,171
23,518
21,873
24,888
Gain on arbitration settlement, net
-
(27,271)
-
(27,271)
Write-off of debt issuance costs, refinancing fees and loss on early
retirement of 2014 notes
26,192
-
26,192
-
Adjusted EBITDA excluding significant items
58,221
$
97,432
$
326,102
$
296,439
$
After tax adjustments
Net unrealized (gain)/loss on derivative instruments
2,609
$
43,575
$
34,855
$
59,183
$
Net (gain) loss on Japanese yen hedges
(2,298)
-
(6,582)
-
Foreign currency exchange (gain)/loss on vessel obligations
(2,590)
3,946
(51)
(1,147)
Gain on asset sales
(3,326)
-
(3,337)
(2,710)
Debt retirement costs in connection with initial public offering
-
-
-
-
Net unrealized FX (gain)/loss on foreign denominated borrowings
(1,851)
12,580
5,588
6,590
Charges for restructuring and long-term receivables
13,171
23,518
21,873
24,888
Gain on arbitration settlement, net
-
(27,271)
-
(27,271)
Refinancing charges and loss on early retirement of 2014 notes
26,192
-
26,192
-
Sub Total
31,907
$
56,348
$
78,538
$
59,533
$
Comparable income (loss) from continuing operations
($15,054)
$3,125
$116,085
$61,908
Comparable net income attributable to Dole Food Company, Inc.
($16,731)
$5,923
$112,706
$63,620
Earnings per share - Diluted:
Comparable income from continuing operations
($0.17)
$0.04
$1.32
$0.71
Comparable net income attributable to Dole Food Company, Inc.
($0.19)
$0.07
$1.28
$0.73
3,535
31,666
37,598
(5,436) |
  22
Statements of Operations
Quarter Ended
Three Quarters Ended
October 8, 2011
October 9, 2010
October 8, 2011
October 9, 2010
Revenues, net
2,086,032
$
1,988,571
$
5,687,861
$
5,335,967
$
Cost of products sold
(1,910,314)
(1,789,085)
(5,047,176)
(4,763,474)
Gross margin
175,718
199,486
640,685
572,493
Selling, marketing and general and administrative expenses
(160,902)
(137,712)
(415,865)
(372,792)
Charges for restructuring and long-term receivables
(7,877)
(23,518)
(16,579)
(24,888)
Gain on arbitration settlement, net
-
27,271
-
27,271
Gain on asset sales
3,326
-
3,337
2,921
Operating income
10,265
65,527
211,578
205,005
Other income (expense), net
(18,956)
(61,994)
(53,970)
(62,883)
Interest income
1,318
1,606
3,802
4,724
Interest expense
(41,402)
(49,187)
(111,709)
(127,375)
Income (loss) from continuing operations before income taxes and equity
earnings
(48,775)
(44,048)
49,701
19,471
Income taxes
(123)
(7,522)
(18,781)
(19,764)
Earnings (losses from equity method investments
1,937
(1,604)
6,627
2,679
Income (loss) from continuing operations
(46,961)
(53,174)
37,547
2,386
Income (loss) from discontinued operations, net of income taxes
(43)
202
188
876
Gain on disposal of discontinued operations, net of income taxes
-
4,143
339
4,143
Net income (loss)
(47,004)
(48,829)
38,074
7,405
Less: Net income attributable to noncontrolling interests
(1,634)
(1,547)
(3,906)
(3,307)
Net income (loss) attributable to Dole Food Company, Inc.
(48,638)
$
(50,376)
$
34,168
$
4,098
$
($ thousands) |
  Balance Sheets
23
October 8, 2011
January 1, 2011
(in thousands)
ASSETS
Cash and cash equivalents
190,586
$
170,147
$
Restricted cash and deposits
5,683
51,108
Receivables, net
700,420
751,265
Inventories
805,872
734,966
Prepaid expenses and other assets
67,816
67,909
Deferred income tax assets
43,835
36,810
Assets Held for Sale
120,845
86,050
Total current assets
1,935,057
1,898,255
Investments
97,170
87,914
Property, plant and equipment, net
894,078
943,030
Goodwill
407,247
407,247
Intangible assets, net
698,106
701,081
Other assets, net
217,048
219,463
Total Assets
4,248,706
4,256,990
LIABILITIES AND EQUITY
Accounts payable
486,561
521,330
Liabilities related to assets-held-for-sale
19,951
0
Accrued liabilities
533,771
642,481
Current portion of long-term debt, net
9,411
7,348
Notes payable
28,040
31,922
Total current liabilities
1,077,734
1,203,081
Long-term debt, net
1,575,559
1,564,325
Deferred income tax liabilities
248,838
244,324
Other long-term liabilities
515,640
428,476
Shareholders' equity
Common stock
89
89
Additional paid-in capital
784,121
776,918
Retained earnings
105,251
71,083
Accumulated other comprehensive income (loss )
(84,246)
(55,921)
Equity attributatble to shareholders of Dole Food
Company, Inc. 805,215
792,169
Equity attributatble to noncontrolling interests
25,720
24,615
Total equity
830,935
816,784
Total liabilities and equity
4,248,706
$
4,256,990
$
|