Attached files
| file | filename |
|---|---|
| 8-K - CURRENT REPORT ON FORM 8-K - WABASH NATIONAL Corp | v240815_8k.htm |
INVESTOR UPDATE November 2011 Dick Giromini, President & CEO Mark Weber, CFO

2 S AFE H ARBOR S TATEMENT This presentation will contain certain forward - looking statements, as defined by the Private Securities Litigation Reform Act of 1995 . These forward - looking statements are, however, subject to certain risks and uncertainties that could cause actual results to differ materially from those implied by the forward - looking statements . Without limitation, these risks and uncertainties include increased competition, dependence on new management, reliance on certain customers and corporate partnerships, shortages of raw materials, dependence on industry trends, access to capital, acceptance of new technology and products, and government regulation . Listeners should review and consider the various disclosures made by the Company in this presentation and in its reports to its stockholders and periodic reports on Forms 10 - K and 10 - Q . We cannot give assurance that the expectations reflected in our forward - looking statements will prove to be correct . Our actual results could differ materially from those anticipated in these forward - looking statements . All written and oral forward - looking statements attributable to us are expressly qualified in their entirety by the factors we disclose that could cause our actual results to differ materially from our expectations . © 2011 Wabash National, L.P. All rights reserved. Wabash®, Wabash National®, DuraPlate ®, DuraPlate HD®, ArcticLite®, DuraPlate AeroSkirt® , TrustLock Plus® and RoadRailer® are marks owned by Wabash National, L.P. Transcraft®, Eagle® and Benson® are marks owned by Transcraft Corporation.

3 I NVESTMENT H IGHLIGHTS x Leading market position as #1 dry van semi - trailer manufacturer in North America x Strong brand preference and longstanding relationships with blue - chip customer base x Best - in - class, technologically innovative products x Trucking cycle recovery and aging fleet equipment fueling trailer demand growth x Successful cost and manufacturing restructuring: Lean manufacturing culture x Leveraging capital to support business diversification strategy x Strong and experienced management team

4 C OMPANY H ISTORY Founded as a start - up Achieved leading industry position Acquired specific assets of bankrupt Fruehauf Trailer Corp. Introduced the DuraPlate® Composite Dry Van Trailer Major industry downturn Company returned to profitability Acquired Transcraft : leading steel flatbed producer Transcraft acquired assets of Benson Int’l: leading aluminum flatbed producer IPO ( NYSE : WNC ) Major industry downturn Record annual trailer production of 70,000 units Economic recovery continues • Headquartered in Lafayette, IN • 4,400 Associates • 2011 Estimated Trailer Shipments: 47,000 - 48,000 1985 - 2011 Launched DuraPlate Aeroskirt 4Q10: WNC returns to profitability 2011 Launched DuraPlate XD - 35 2010 2009 2008 2006 2004 2000 1999 1997 1996 1994 1991 1985

5 Longstanding Market Share Leader • #1 in Total Trailer production for 17 of the past 23 years • #1 in Dry Van trailer production • #3 in Refrigerated Van trailer production • Top 3 in Platform trailer production • Strong brand recognition and brand preference L EADING N ORTH A MERICAN T RAILER M ANUFACTURER Source: Trailer Body Builders Magazine Building and maintaining industry leading brands

6 P REMIER C ARRIER R ELATIONSHIPS Wabash National Customers • 48% of Top 50 For - Hire Fleets • 32% of Top 100 For - Hire Fleets Preferred by the industry’s leading carriers Source: 2010 Transport Topics 100

7 C OMPREHENSIVE P RODUCT L INE Dry Freight Vans: 77% / Total Refrigerated Vans: 15% / Total Platform Trailers: 6% / Total Specialty Equipment: 2% / Total Note: Percentages based on WNC shipments 2008 - 2010 DuraPlate® Vans 47% DuraPlate® HD Vans 15 % ArcticLite® Refrigerated Vans 15% DuraPlate® Pups 12% Platform Trailers 6% Sheet & Post Vans 3% Bimodal 1% Dump Trailers 1 % WNC Shipments by Product Type

8 S ALES AND D ISTRIBUTION Dry and Refrigerated Vans • Factory Direct Sales Force • Independent Dealers: 26 − Locations: 63 − Sales People: 100+ Platform Trailers • Total Dealers: 95 − Independent Dealers: 71 − WN Independent Dealers: 13 − WNTC Branches: 11 − Locations : 139 Wabash National Trailer Centers • Branch Locations: 11 (1 Used Trailer Center) − Sales People: 20+ Extensive sales and support network WNTC Platform Dealer Dry/Refrigerated Dealer
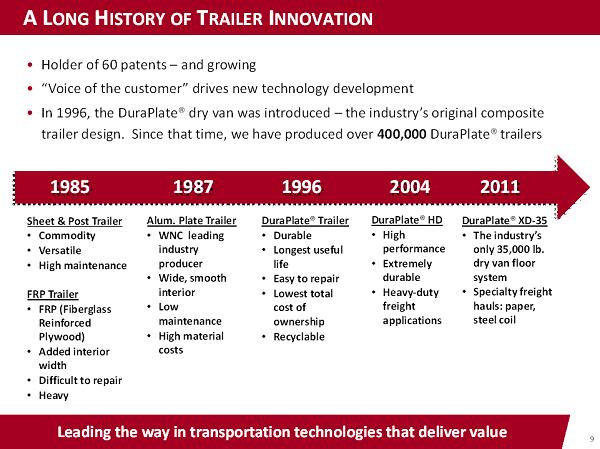
9 A L ONG H ISTORY OF T RAILER I NNOVATION • Holder of 60 patents – and growing • “Voice of the customer” drives new technology development • In 1996, the DuraPlate® dry van was introduced – the industry’s original composite trailer design. Since that time, we have produced over 400,000 DuraPlate® trailers Leading the way in transportation technologies that deliver value Sheet & Post Trailer • Commodity • Versatile • High maintenance FRP Trailer • FRP (Fiberglass Reinforced Plywood) • Added interior width • Difficult to repair • Heavy 1985 Alum. Plate Trailer • WNC leading industry producer • Wide, smooth interior • Low maintenance • High material costs 1987 DuraPlate® Trailer • Durable • Longest useful life • Easy to repair • Lowest total cost of ownership • Recyclable 1996 DuraPlate® HD • High performance • Extremely durable • Heavy - duty freight applications 2004 DuraPlate® XD - 35 • The industry’s only 35,000 lb. dry van floor system • Specialty freight hauls: paper, steel coil 2011

10 I NDUSTRY - L EADING P RODUCT I NNOVATION Customer - focused commercialization process Launch Innovation Description 2009 TrustLock® Plus Proprietary door locking system with single lock mechanism 2009 DuraPlate ® AeroSkirt ® Aerodynamic side - faring that delivers 6% fuel savings 2009 - 2011 Bonding Technologies Truck Body Sidewalls, Trailer Sidewalls, Logistics 2011 Tire Hauler Proprietary solution for cost - effective transport of 13’ tires 2011 Combo ID/Stop Light Enhanced visibility for improved highway safety 2011 Zinc - Based Coating System Provides superior corrosion resistance and color options 2011 DuraPlate XD - 35 Model Heavy - duty floor system (35K) provides freight haul flexibility 2012 Maximum Height Overhead Door Maximizes door opening to improve carrier freight operations 2012 Pneumatic Door Seal Provides superior seal for overhead door on refrigerated trailer Combo ID/Stop Light: Brakes Applied Maximum Height Overhead Door Tire Hauler

11 A TTRACTIVE P OINT IN THE T RAILER C YCLE Cycle recovery progressing: Recent orders reflect normal seasonality • Previous three cycles lasted 58, 67, and 89 months • The most recent cycle reached its low in Dec.'08, at month 89 • Trailer industry is 35 months into a new cycle as of November 2011 Source: ACT 0 10,000 20,000 30,000 40,000 Jan-91 Jan-92 Jan-93 Jan-94 Jan-95 Jan-96 Jan-97 Jan-98 Jan-99 Jan-00 Jan-01 Jan-02 Jan-03 Jan-04 Jan-05 Jan-06 Jan-07 Jan-08 Jan-09 Jan-10 Jan-11 Jan-12 U.S. Monthly Trailer Net Orders

12 T RUCK T ONNAGE I NDICATOR September TTI up 1.6% M/M & 5.9% Y/Y; overall trend positive - 30% - 20% - 10% 0% 10% 20% 30% 50 60 70 80 90 100 110 120 130 2003 2004 2005 2006 2007 2008 2009 2010 2011 Truck Tonnage Index (ATA) TTI (Seas. Adjusted) Y/Y % Change Source: American Trucking Associations

13 F ORECASTED T RUCKING G ROWTH Trucking boosts share of total tonnage to 70% by 2022 67.2% 14.1% 1.2% 6.7% 10.7% 0.1% 2010 Truck Rail Carload Rail Intermodal Water Pipeline Air 70.0% 12.8% 1.8% 6.1% 9.2% 0.1% 2022 Truck Rail Carload Rail Intermodal Water Pipeline Air Source: American Trucking Association, November 2011 Overall Growth Trends • Total tonnage will increase an estimated 13.4B tons in 2010 to 16.5B tons in 2022 • Estimated Freight Increase ’11 - ’16 ’17 - ’22 General freight 4.1% 1.7% Bulk freight 2.0% 0.6% Trucking Trends • Truck share of total tonnage forecasted to exceed pre - recession level of ~69%. • Estimated Freight Increase ’11 - ’16 ’17 - ’22 Truckload (TL) 3.3% 1.2% Less - than - truckload (LTL) 3.4% 2.5%

14 I NDUSTRY O UTLOOK Currently in very early innings of trailer rebound cycle Source: ACT Research and FTR Associates. FTR numbers represent trailer production . Dry Van Shipments: Forecast 2009 2010 2011 2012 2013 2014 2015 ACT 29,950 60,227 113,500 133,000 162,000 145,000 118,000 Total Trailer Demand: Forecast 2009 2010 2011 2012 2013 2014 2015 ACT (shipments) 79,027 124,162 207,770 241,450 268,700 246,800 216,000 FTR (production) 78,526 121,128 215,414 230,000 240,000 245,000 250,000 • Total trailer shipments forecasted to reach 269K by 2013 • WNC is well - positioned to capitalize on strong dry van demand over the next several years

15 0 50,000 100,000 150,000 200,000 250,000 300,000 2006 2007 2008 2009 2010 2011F 2012F 2013F 2014F 2015F 2016F U.S. Trailer Forecasts: Shipments (ACT) & Production (FTR) ACT FTR 2011 O UTLOOK : I NDUSTRY F ORECAST Strong demand above replacement levels • Age of equipment is at an all - time high of nearly 8.5 years • Equipment age profile: disproportionate number of aged units in fleets • 3+ years of significant under - buy • Implementation of the Federal Motor Carriers Safety Administration's CSA Program • Tax Act of 2010: Bonus Depreciation provides for 100% write - off of capital investments in 2011; 50% in 2012 Short - /Mid - Term Demand Drivers Source: ACT DRY VANS: Population & Average Age 1979 - 2016 ACT Research Co., LLC: Copyright 2011 80 82 84 86 88 90 92 94 96 98 00 02 04 06 08 10 12 14 16 0 200 400 600 800 1000 1200 1400 1600 1800 2000 Population (000s) 5.5 6.0 6.5 7.0 7.5 8.0 8.5 9.0 9.5 10.0 10.5 Age (in Years) POPULATION AVERAGE AGE

16 2011 AND B EYOND Potential Demand Drivers • CARB Regulations (California Air Resource Board) on emissions/fuel efficiency • Proposed increase in GVWR (Gross Vehicle Weight Restriction) from 80,000 to 97,000 lbs • Proposed changes to HOS Rules (Hours of Service) from 11 to 10 hours • Proposed requirement for EOBRs (Electronic On - Board Recorders) to enforce HOS Rules Potential of future demand may be greater than forecast

17 D URA P LATE ® P RODUCTS : E XCEEDING E XPECTATIONS New product offerings being developed as we speak… DuraPlate® Composite Material • Pre - coated, galvanized steel skins • Foamed HDPE Core • Extremely strong • Light weight • Damage resistant • Multiple industrial applications Steel Skins HDPE Core 2008 2009 2010 2011 2013 $10M $24M Revenue: Start Up ~$50M $70 - 90M Van Truck Bodies Cargo Trailers Swing & Overhead Doors DuraPlate AeroSkirt® Portable Storage Other Industrial Applications

18 A LLIED P RODUCTS : E NERGY S ECTOR One of many diversification opportunities being evaluated and pursued… $70M+ Frac Tank Agreement • Entry into the Energy and Environmental Services Markets • Leverage industrial expertise in welding, forming, fabrication, and assembly into products outside of our traditional trailer business • Producing Frac Tanks on behalf of Sabre Manufacturing: 2,500 units over 5 years

FINANCIALS

20 0 200 400 600 800 1,000 1,200 1,400 2006 2007 2008 2009 2010 3Q11 YTD $1,312 $1,103 $836 $338 $640 $846 -8% -4% 0% 4% 8% 12% 2006 2007 2008 2009 2010 3Q11 YTD 8% 8% 3% - 7% 4% 5% -16% -12% -8% -4% 0% 4% 8% 12% 2006 2007 2008 2009 2010 3Q11 YTD 5% 5% - 1% - 13% 1% 3% Revenue ($ millions) Gross Margin Operating EBITDA Margin (2) (1) 2008 operating income excludes a non - cash impairment for goodwill of $66.3 million (2) A reconciliation of Operating EBITDA to net income (loss) for the periods presented is included in the Appendix to this p res entation -80 -60 -40 -20 0 20 40 2006 2007 2008 2009 2010 3Q11 YTD $22.9 $26.5 ($37.5) ($66.1) ($15.4) $11.4 Operating Income (1) ($ millions) F INANCIAL H IGHLIGHTS

21 0 50 100 150 200 250 300 350 1Q08 3Q08 1Q09 3Q09 1Q10 3Q10 1Q11 3Q11 $161 $202 $243 $231 $78 $86 $88 $85 $78 $150 $171 $242 $222 $287 $336 (25.0) (20.0) (15.0) (10.0) (5.0) 0.0 5.0 10.0 15.0 1Q08 3Q08 1Q09 3Q09 1Q10 3Q10 1Q11 3Q11 ($3.0) $3.5 $1.9 ($13.5) ($21.6) ($10.7) ($4.6) ($6.3) ($6.0) ($0.5) $0.6 $10.8 $8.8 $9.7 $6.6 Revenue ($ millions) Operating EBITDA (1) ($ millions) (1) A reconciliation of Operating EBITDA to net income (loss) for the periods presented is included in the Appendix to this p res entation Optimization & Productivity Initiatives Lafayette Enhancements: • Consolidated six lines to three flexible, mix - model capable production lines • Consolidated 10 material warehouses into one centralized warehouse Transcraft Optimization: • Consolidated all platform and dump trailer production to a single facility in Cadiz, KY Salaried Headcount: • 27% reduction compared to 2006 through process streamlining Q UARTERLY F INANCIAL H IGHLIGHTS
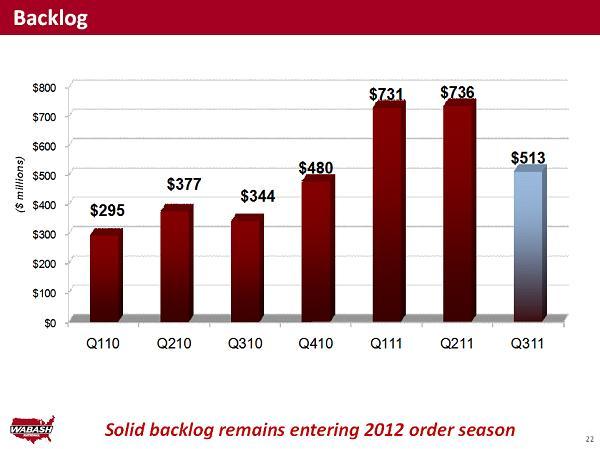
22 22 Backlog Solid backlog remains entering 2012 order season $0 $100 $200 $300 $400 $500 $600 $700 $800 Q110 Q210 Q310 Q410 Q111 Q211 Q311 $295 $377 $344 $480 $731 $736 $513 ($ millions)
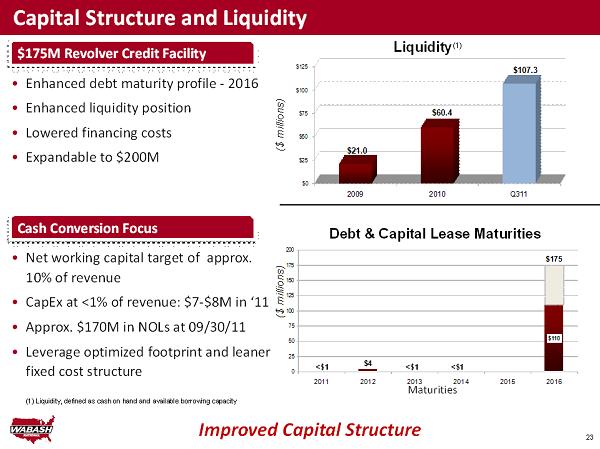
Capital Structure and Liquidity Improved Capital Structure $4 $175 $110 0 25 50 75 100 125 150 175 200 2011 2012 2013 2014 2015 2016 ($ millions) Maturities $175M Revolver Credit Facility • Enhanced debt maturity profile - 2016 • Enhanced liquidity position • Lowered financing costs • Expandable to $ 200M $0 $25 $50 $75 $100 $125 2009 2010 Q311 $21.0 $60.4 $107.3 ($ millions) Liquidity (1) Debt & Capital Lease Maturities (1) Liquidity, defined as cash on hand and available borrowing capacity Cash Conversion Focus • Net working capital target of approx. 10% of revenue • CapEx at <1% of revenue: $7 - $8M in ‘11 • Approx. $170M in NOLs at 09/30/11 • Leverage optimized footprint and leaner fixed cost structure <$1 <$1 <$1 23
23 23 Capital Structure and Liquidity Improved Capital Structure $4.9 $175 $110 0 25 50 75 100 125 150 175 200 2011 2012 2013 2014 2015 2016 ($ millions) Maturities $175M Revolver Credit Facility • Enhanced debt maturity profile - 2016 • Enhanced liquidity position • Lowered financing costs • Expandable to $ 200M $0 $25 $50 $75 $100 $125 2009 2010 Q311 $39.4 $60.4 $107.3 ($ millions) Liquidity (1) Debt Maturities (1) Liquidity, defined as cash on hand and available borrowing capacity Cash Conversion Focus • Net working capital target of approx. 10% of revenue • CapEx at <1% of revenue: $7 - $8M in ‘11 • Approx. $170M in NOLs at 09/30/11 • Leverage optimized footprint and leaner fixed cost structure
APPENDIX
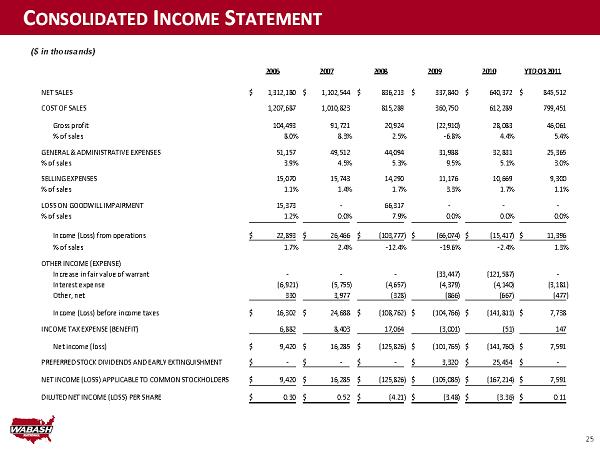
25 C ONSOLIDATED I NCOME S TATEMENT ($ in thousands) 2006 2007 2008 2009 2010 YTD Q3 2011 NET SALES 1,312,180$ 1,102,544$ 836,213$ 337,840$ 640,372$ 845,512$ COST OF SALES 1,207,687 1,010,823 815,289 360,750 612,289 799,451 Gross profit 104,493 91,721 20,924 (22,910) 28,083 46,061 % of sales 8.0% 8.3% 2.5% -6.8% 4.4% 5.4% GENERAL & ADMINISTRATIVE EXPENSES 51,157 49,512 44,094 31,988 32,831 25,365 % of sales 3.9% 4.5% 5.3% 9.5% 5.1% 3.0% SELLING EXPENSES 15,070 15,743 14,290 11,176 10,669 9,300 % of sales 1.1% 1.4% 1.7% 3.3% 1.7% 1.1% LOSS ON GOODWILL IMPAIRMENT 15,373 - 66,317 - - - % of sales 1.2% 0.0% 7.9% 0.0% 0.0% 0.0% - - - - - - Income (Loss) from operations 22,893$ 26,466$ (103,777)$ (66,074)$ (15,417)$ 11,396$ % of sales 1.7% 2.4% -12.4% -19.6% -2.4% 1.3% OTHER INCOME (EXPENSE) Increase in fair value of warrant - - - (33,447) (121,587) - Interest expense (6,921) (5,755) (4,657) (4,379) (4,140) (3,181) Other, net 330 3,977 (328) (866) (667) (477) Income (Loss) before income taxes 16,302$ 24,688$ (108,762)$ (104,766)$ (141,811)$ 7,738$ INCOME TAX EXPENSE (BENEFIT) 6,882 8,403 17,064 (3,001) (51) 147 Net income (loss) 9,420$ 16,285$ (125,826)$ (101,765)$ (141,760)$ 7,591$ PREFERRED STOCK DIVIDENDS AND EARLY EXTINGUISHMENT -$ -$ -$ 3,320$ 25,454$ -$ NET INCOME (LOSS) APPLICABLE TO COMMON STOCKHOLDERS 9,420$ 16,285$ (125,826)$ (105,085)$ (167,214)$ 7,591$ DILUTED NET INCOME (LOSS) PER SHARE 0.30$ 0.52$ (4.21)$ (3.48)$ (3.36)$ 0.11$

26 C ONSOLIDATED B ALANCE S HEET ($ in thousands) 2006 2007 2008 2009 2010 9/30/2011 ASSETS Current assets Cash and cash equivalents 29,885$ 41,224$ 29,766$ 1,108$ 21,200$ 47,993$ Accounts receivable 110,462 68,752 37,925 17,081 37,853 45,892 Inventories 133,133 113,125 92,896 51,801 110,850 199,986 Deferred taxes 26,650 14,514 - - - - Prepaid expenses and other 4,088 4,046 5,307 6,877 2,155 662 Total current assets 304,218$ 241,661$ 165,894$ 76,867$ 172,058$ 294,533$ Property, plant & equipment 129,325 122,063 122,035 108,802 98,834 95,114 Goodwill 66,692 66,317 - - - - Deferred income taxes - 2,772 - - - - Intangibles 35,998 32,498 29,089 25,952 22,863 20,577 Other assets 20,250 18,271 14,956 12,156 9,079 8,281 Total assets 556,483$ 483,582$ 331,974$ 223,777$ 302,834$ 418,505$ LIABILITIES & STOCKHOLDERS' EQUITY Current liabilities Current portion of long-term debt -$ -$ 80,008$ -$ -$ -$ Current portion of capital lease obligations - - 337 337 590 4,058 Accounts payable 90,632 40,787 42,798 30,201 71,145 119,988 Other accrued liabilities 58,706 54,258 45,449 34,583 38,896 41,326 Warrant - - - 46,673 - - Total current liabilities 149,338$ 95,045$ 168,592$ 111,794$ 110,631$ 165,372$ Long-term debt 125,000 104,500 - 28,437 55,000 110,000 Capital lease obligations - - 4,803 4,469 3,964 826 Deferrred income taxes 1,556 - - - - - Other noncurrent liabilities and contingencies 2,634 4,108 5,142 3,258 4,214 4,084 Preferred stock - - - 22,334 - - Stockholders' equity 277,955 279,929 153,437 53,485 129,025 138,223 Liabilities and stockholders' equity 556,483$ 483,582$ 331,974$ 223,777$ 302,834$ 418,505$
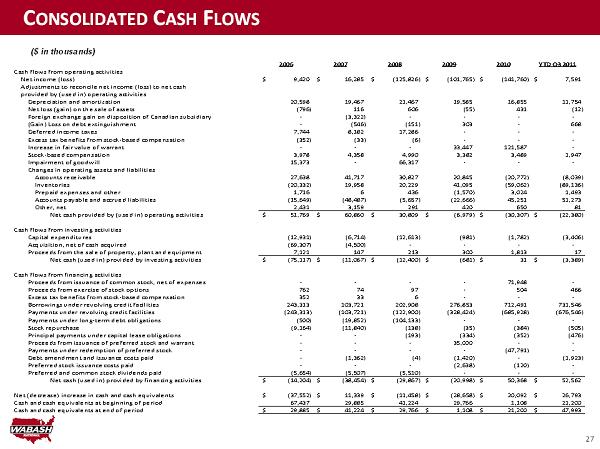
27 C ONSOLIDATED C ASH F LOWS ($ in thousands) 2006 2007 2008 2009 2010 YTD Q3 2011 Cash flows from operating activities Net income (loss) 9,420$ 16,285$ (125,826)$ (101,765)$ (141,760)$ 7,591$ Adjustments to reconcile net income (loss) to net cash provided by (used in) operating activities Depreciation and amortization 20,598 19,467 21,467 19,585 16,855 11,754 Net loss (gain) on the sale of assets (796) 116 606 (55) 431 (12) Foreign exchange gain on disposition of Canadian subsidiary - (3,322) - - - - (Gain) Loss on debt extinguishment - (546) (151) 303 - 668 Deferred income taxes 7,744 8,182 17,286 - - - Excess tax benefits from stock-based compensation (352) (33) (6) - - - Increase in fair value of warrant - - - 33,447 121,587 - Stock-based compensation 3,978 4,358 4,990 3,382 3,489 1,947 Impairment of goodwill 15,373 - 66,317 - - - Changes in operating assets and liabilities Accounts receivable 27,638 41,717 30,827 20,845 (20,772) (8,039) Inventories (20,332) 19,958 20,229 41,095 (59,062) (89,136) Prepaid expenses and other 1,716 6 436 (1,570) 3,024 1,493 Accounts payable and accrued liabilities (15,649) (48,487) (5,657) (22,666) 45,251 51,273 Other, net 2,431 3,159 291 420 650 81 Net cash provided by (used in) operating activities 51,769$ 60,860$ 30,809$ (6,979)$ (30,307)$ (22,380)$ Cash flows from investing activities Capital expenditures (12,931) (6,714) (12,613) (981) (1,782) (3,406) Acquisition, net of cash acquired (69,307) (4,500) - - - - Proceeds from the sale of property, plant and equipment 7,121 147 213 300 1,813 17 Net cash (used in) provided by investing activities (75,117)$ (11,067)$ (12,400)$ (681)$ 31$ (3,389)$ Cash flows from financing activities Proceeds from issuance of common stock, net of expenses - - - - 71,948 - Proceeds from exercise of stock options 762 74 97 - 504 466 Excess tax benefits from stock-based compensation 352 33 6 - - - Borrowings under revolving credit facilities 243,313 103,721 202,908 276,853 712,491 731,546 Payments under revolving credit facilities (243,313) (103,721) (122,900) (328,424) (685,928) (676,546) Payments under long-term debt obligations (500) (19,852) (104,133) - - - Stock repurchase (9,164) (11,840) (138) (35) (384) (505) Principal payments under capital lease obligations - - (193) (334) (352) (476) Proceeds from issuance of preferred stock and warrant - - - 35,000 - - Payments under redemption of preferred stock - - - - (47,791) - - (1,362) (4) (1,420) - (1,923) - - - (2,638) (120) - Preferred and common stock dividends paid (5,654) (5,507) (5,510) - - - Net cash (used in) provided by financing activities (14,204)$ (38,454)$ (29,867)$ (20,998)$ 50,368$ 52,562$ Net (decrease) increase in cash and cash equivalents (37,552)$ 11,339$ (11,458)$ (28,658)$ 20,092$ 26,793$ Cash and cash equivalents at beginning of period 67,437 29,885 41,224 29,766 1,108 21,200 Cash and cash equivalents at end of period 29,885$ 41,224$ 29,766$ 1,108$ 21,200$ 47,993$ Debt amendment and issuance costs paid Preferred stock issuance costs paid

28 R ECONCILIATION OF N ON - GAAP M EASURES Note: This table reconciles annual net income (loss) for the periods presented to the non - GAAP measure of Operating EBITDA ($ in millions) 2006 2007 2008 2009 2010 YTD Q3 2011 Net income (loss) 9.4$ 16.3$ (125.8)$ (101.8)$ (141.8)$ 7.6$ Income tax expense (benefit) 6.9 8.4 17.1 (3.0) (0.1) 0.1 Increase in fair value of warrant - - - 33.4 121.6 - Interest expense 6.9 5.8 4.7 4.4 4.1 3.2 Depreciation and amortization 20.6 19.5 21.5 19.6 16.9 11.8 Stock-based compensation 4.0 4.4 5.0 3.4 3.5 1.9 Impairment of goodwill 15.4 - 66.3 0.0 - - Other non-operating (income) expense (0.3) (4.1) 0.2 0.9 0.7 0.5 Operating EBITDA 62.9$ 50.3$ (11.0)$ (43.1)$ 4.9$ 25.1$ % of sales 4.8% 4.6% -1.3% -12.8% 0.8% 3.0%

29 Notes: R ECONCILIATION OF N ON - GAAP M EASURES ($ in millions) This table reconciles quarterly net income (loss) for the periods presented to the non - GAAP measure of Operating EBITDA The sum of the individual quarters may not equal the annual EBITDA calculation due to rounding Q1 Q2 Q3 Q4 Q1 Q2 Q3 Q4 Q1 Q2 Q3 Q4 Q1 Q2 Q3 Net (loss) income (6.4)$ (3.2)$ (4.3)$ (111.9)$ (28.3)$ (17.9)$ (66.4)$ 10.9$ (139.1)$ (5.6)$ (1.9)$ 4.9$ 3.2$ 3.3$ 1.1$ Income tax (benefit) expense (3.7) (1.0) (1.3) 23.1 - - (0.1) (3.0) 0.1 - - (0.2) - - 0.1 Increase (Decrease) in fair value of warrant - - - - - - 54.0 (20.5) 126.8 (1.9) (3.3) - - - - Interest expense 1.2 1.0 1.2 1.3 1.0 1.3 1.1 0.9 1.0 1.0 1.0 1.1 0.9 1.1 1.1 Depreciation and amortization 5.2 5.2 5.2 5.9 4.8 4.8 4.8 5.2 4.4 4.3 4.1 4.0 3.9 3.9 3.9 Stock-based compensation 0.9 1.3 1.3 1.5 1.0 1.2 0.8 0.5 0.8 0.9 0.7 1.0 0.8 0.7 0.4 Impairment of goodwill - - - 66.3 - - - - - - - - - - - Other non-operating (income) expense (0.2) 0.2 (0.2) 0.3 (0.1) (0.1) 1.2 (0.3) - 0.8 - - - 0.7 - Operating EBITDA (3.0)$ 3.5$ 1.9$ (13.5)$ (21.6)$ (10.7)$ (4.6)$ (6.3)$ (6.0)$ (0.5)$ 0.6$ 10.8$ 8.8$ 9.7$ 6.6$ % of sales -1.9% 1.7% 0.8% -5.9% -27.7% -12.4% -5.2% -7.4% -7.7% -0.3% 0.4% 4.5% 4.0% 3.4% 1.9% 2008 2009 2010 2011